The Relative Performance of NDIR-based Sensors in the Near Real-time Analysis of CO2 in Air

Department of Earth & Environmental Sciences, Sejong University, Seoul, Korea
*
Author to whom correspondence should be addressed.
Sensors 2007, 7(9), 1683-1696; https://doi.org/10.3390/s7091683
Submission received: 10 July 2007
/
Accepted: 27 August 2007
/
Published: 3 September 2007
Abstract
:In this study, the reliability of NDIR-based sensors was explored by evaluating the comparability between measurement systems in the near real-time analysis of CO2. For this purpose, replicate analyses were performed using sensors of two different model types (H-550 and B-530, ELT Company, Korea). Three replicate data of each sensor type collected continuously by side-by-side analysis in three second intervals (a duration of 304 hour) were evaluated for the relative performance of NDIR sensors. The reproducibility of sensors, when assessed by relative standard error (RSE %) values of all sensor units, showed moderate changes with time with the overall mean of 2.33%. When CO2 measurements from all NDIR sensor units were evaluated by correlation analysis, the results showed strong comparability, regardless of the model type. The overall results of this study suggest that NDIR sensors are reliable enough to produce highly comparable data at least in a relative sense.
1. Introduction
Carbon dioxide (CO2) is the fourth most common gas present in the earth's atmosphere with an average ambient concentration (in fresh air) of about 380 ppm [1]. Being the most important anthropogenic green house gas, carbon dioxide contributes to changes in the climate, as it is responsible for alterations in the chemistry of the ocean through the trapping of infrared radiation. This in turn can lead to a warming of the climate and changes in ecological systems [2].
Carbon dioxide is one of the most common by-products of living organisms [3], as humans release it into the atmosphere with every exhaled breath (with an average concentration of about 3.8%) [4]. According to a study conducted by the United States Department of Agriculture (USDA), a daily production rate of CO2 for the average person corresponds to 450 liters (900 grams) [5]. Carbon dioxide is an insidious gas so that changes in its concentration are difficult for humans to recognize. The gas is safe in low concentrations but life-threatening in excessively large quantities (e.g., more than 30,000 ppm for a short term exposure of 15 minutes and more than 5000 ppm for 8 hour time-weighted average) [6].
Information concerning CO2 concentration levels often becomes an essential element in air quality investigations. The popularization of the airtight envelope system in the design of buildings and in Heating Ventilating and Air Conditioning (HVAC) systems have resulted in the deterioration of indoor air quality [7, 8, 9]. The poor quality of indoor air in houses and workplaces due to a high concentration of CO2 can result in several health-related problems such as: sick building syndrome (SBS) or tight building syndrome (TBS), building related illnesses (e.g., nausea, skin irritation, lethargy, etc), and sick house syndrome (SHS) [10,11]. For this reason, there is a growing demand for real-time continuous monitoring of indoor CO2 concentration levels such as affordable and portable CO2 gas sensors. In the present study, the analytical performance of NDIR sensors was investigated in terms of reproducibility and compatibility in the continuous long-term measurement of CO2.
2. Materials and methods
2.1 Background of CO2 analysis
The analysis of CO2 gas comprises a long history of 180 years with the development of several chemical and physical methods such as: gas chromatography [12, 13], infrared analysis [14], C14 isotope measurement [15], mass spectrometry [16], FT-IR spectroscopy [17], gas diffusion-flow injection (GD-FIA) [18] or continuous flow systems based on photometric detection with various pH indicator systems [19, 20, 21, 22], conductimetric sensors [23, 24, 25] thermistors [26], and acoustic detectors [27, 28].
At present, there are two types of gas sensors that are commonly available for monitoring CO2 concentrations in air, i.e., non-dispersive infrared (NDIR) [29] and solid electrolyte sensor types [30]. Non-dispersive infrared sensors have more technical advantages in terms of long-term stability, accuracy, and power consumption rate during CO2 measurement [31]. Hence, NDIR sensors are the most widely used for the real-time measurement of carbon dioxide. Because the NDIR method uses the physical sensing principle such as gas absorption at a particular wavelength, it has a high selectivity and sensitivity in open air conditions. It can be employed to measure CO2 as a function of the absorbance of infrared (IR) light at a specific wavelength (4.26 μm) [32]. It is well-known that CO2 has a strong absorbance at that band that is selective with negligible interference [33].
NDIR sensors are simple spectroscopic devices that can be applied to gas analysis. The main components of NDIR are infrared sources (lamps), sample chambers (or light tubes), wavelength filters, and infrared detectors [34]. The gas is pumped (or diffused) into the sample chamber, and the concentration of target gas is measured electro-optically by its absorption of a specific wavelength in the infrared (IR) range. The IR light is directed through the sample chamber towards the detector. An optical filter in front of the detector can eliminate all light except the wavelength of the selected gas molecules. The term non-dispersive refers to all the light that passes through the gas sample while being filtered immediately before entering the detector. (In the case of dispersive IR detectors, the use of grating (or prism) is useful to pre-select the desired wavelength of light.) Ideally, other gas molecules do not absorb light at this wavelength so as not to affect the amount of light reaching the detector.
2.2 Experimental methodology
In this study, the relative performance of CO2 sensors was tested using two different NDIR-based sensor types produced by ELT Company in Korea. These sensors models (H-550 and B-530) are different in terms of their detection ranges, i.e., B-530 has detection range of 0-10,000 ppm, while H-550 can measure CO2 in the range of 0-50,000 ppm (refer to Table 1 for their specifications). These two models were examined for their feasibility in the real-time analysis of CO2 gas. For this purpose, we designed a system to concurrently retrieve data from six CO2 sensors (i.e., three identical sensor units of each model introduced above). A computer installed with data acquisition software for NDIR sensors was operated to collect near real-time measurement data for CO2 from each system at 3 second intervals. For all the sensor units, calibration was made prior to the study, and the performance of each sensor unit was basically found well within the specifications mentioned.
During this study, all six sensors were operated to record CO2 concentrations concurrently for a 304 hour duration (∼13 day: 21 May to 1 June, 2007) at 3 second intervals. This side-by-side analysis of CO2 sensors was conducted under the same environmental conditions at the Atmospheric Environment Laboratory, Sejong University, Korea. All data sets primarily recorded at 3 second intervals were utilized as raw data after being converted into hourly (or daily) mean values. The results obtained from this study were then evaluated to examine the relative performance for real-time CO2 measurements in air. To properly apply this sensing system to the analysis of CO2 in ambient air, more experiments are currently underway to describe analytical properties of this sensor including its absolute reliability; the results of our continuing efforts will be described subsequently in our future publications.
3. Results and discussions
3.1 The overall pattern of CO2 analysis
To make a diverse comparison of the CO2 data sets, all data obtained initially at 3 second intervals were used as raw data after being converted into hourly intervals. All of these data were used to derive a statistical summary (Table 2). When the raw CO2 data (3 second interval) were compared against the ones converted at hourly intervals (Table 2A and 2B), the latter data exhibited the same mean values as the former but at slightly reduced standard deviation (SD) values. Hence, for the sake of simplicity, interpretation of our CO2 data was conducted using hourly data unless otherwise specified. As shown in Table 1A, the overall mean values of CO2 measured by each sensor unit ranged from 396 ± 30.9 ppm (B1) to 448 ± 29 ppm (B2). When the results were compared in terms of mean values, each sensor unit generally showed strong comparability (Fig 2).
The temporal patterns of CO2 measured during the entire study period were also plotted in Fig 3. When the results of CO2 analysis were plotted at hourly intervals (Fig 3a), each individual sensor unit fell in close range regardless of sensor type. The raw data sets obtained at 3 second intervals were segregated and used directly to compute day-to-day variabilities in CO2 concentration values. As all measurements were collected in open air in a laboratory, the CO2 concentrations seemed to exhibit slight variations in relation to the day-to-day activities of the laboratory.
3.2 Performance evaluation of NDIR sensors
As a simple means to assess the relative performance of NDIR sensors in CO2 measurement, relative standard error (RSE in %) was computed for the data sets from 6 sensor units.
The hourly RSE values were calculated using the CO2 data measured by all six sensor units and plotted for the entire study period (304 hour duration) (Figure 4). RSE values when checked at hourly intervals, exhibited a moderate changes that ranged from 1.33 to 3.56%. However, this trend was consistent throughout the study period. The overall mean for RSE during the entire period was 2.33%.
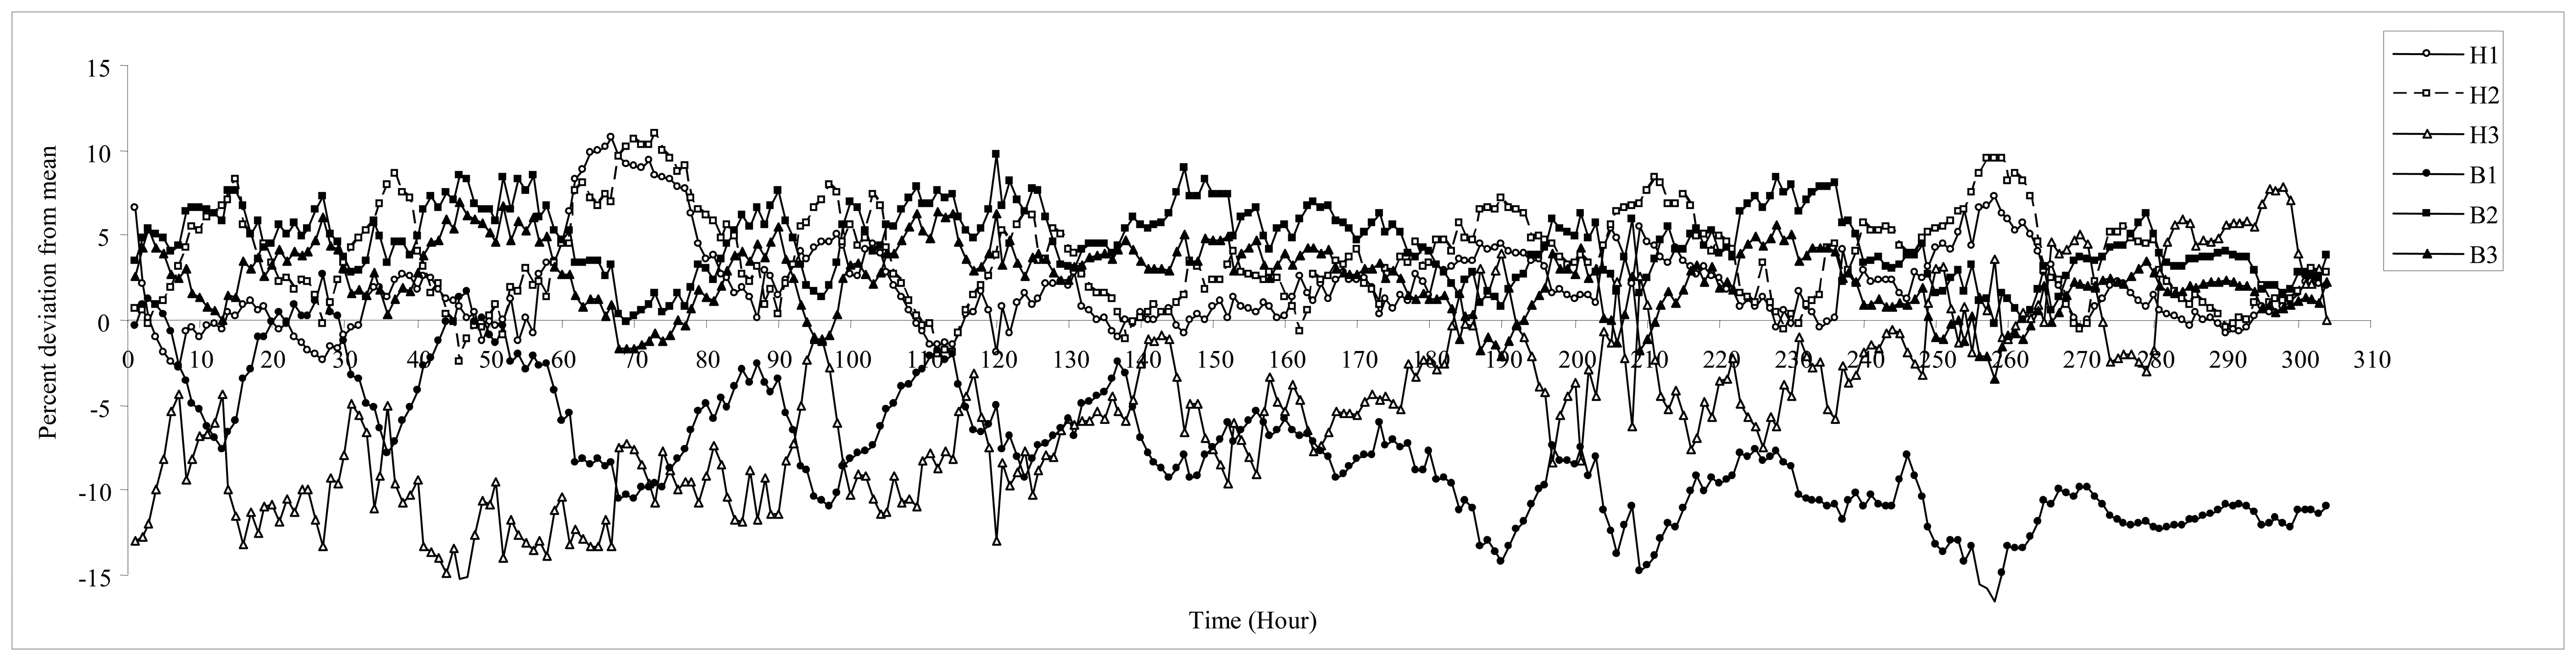
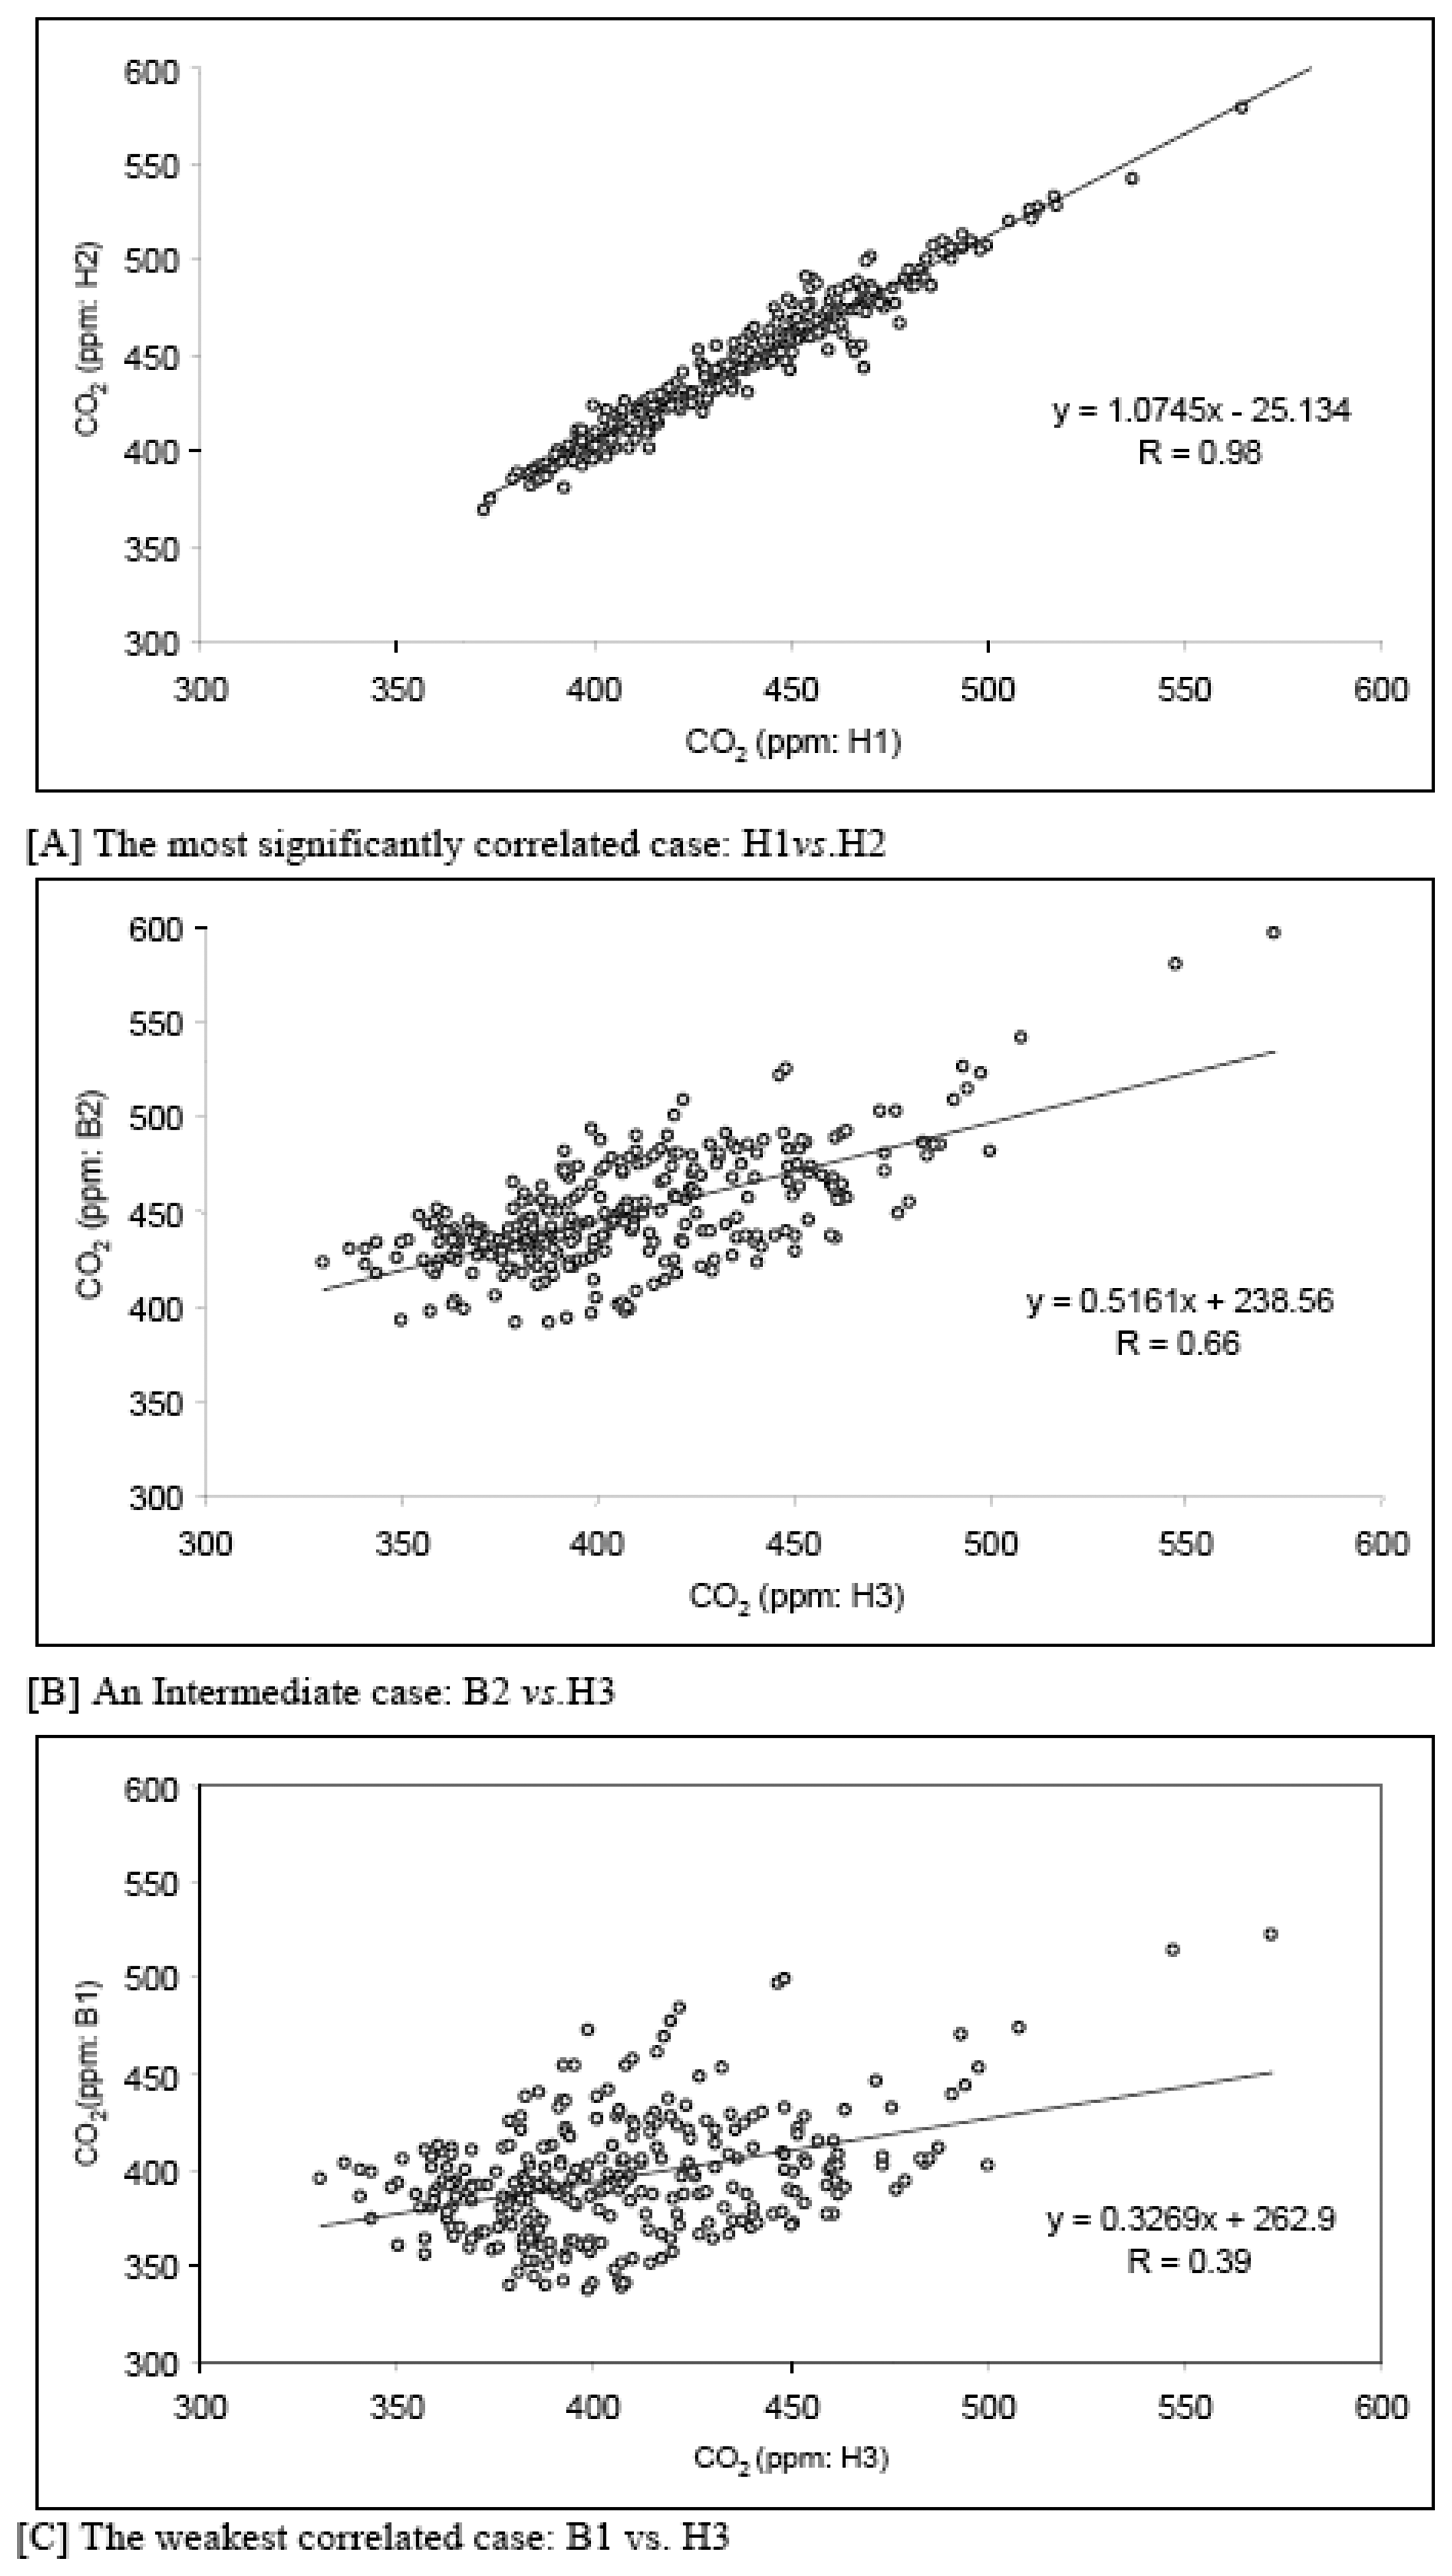
To make a more meaningful evaluation of the comparability between different sensor units, the hourly percent deviation (PD) values were calculated for each unit by subtracting CO2 values of individual units from the mean from all 6 units. The results of PD computation are summarized in Table 3. As shown in Table 3, sensor units H3 and B1 showed negative deviation (∼ -6% range), whereas H1, H2, B2, and B3 units showed positive deviation (∼ 4%) from the mean. The results shown in Fig. 5 reconfirm that the trends for hourly PD values were similar between H3 and B1 units. The two units showed negative deviation from the mean as a general trend. Although B-530 units are supposed to experience delayed response relative to H-500, the results obtained from concurrent measurements were not sufficient to detect such a trend in a systematic manner (refer to Table 1). As another means to check for the comparability of NDIR performance, a correlation analysis was conducted between hourly CO2 data sets retrieved from all the sensor units (Table 4). The results of correlation analysis indicate that there are many matching cases of strong correlation such as: B2 and B3 (r = 0.99, p < 0.01), H1 and H2 (r = 0.98, p < 0.01), B1 and B2 (r = 0.97, p < 0.01), and B1 and B3 pairs (r = 0.92, p < 0.01. A strong positive and significant correlation (e.g., r > 0.80 and p < 0.01) was observed from most of the matching pairs, while there were also a few exceptions from such general trend (e.g., B1 and H3 pair). To account for the differences in the correlation patterns between different combinations of sensor units, three different types of matching cases are compared in Fig 6. It shows that H1 vs. H2 pair maintain an excellent correlation with the slope value approaching the unity. In contrast, the matching pair of B2vs.H3 shows a moderately strong correlation, while B1 vs. H3 combinations the lowest of all matching pairs (r=0.39, p < 0.01). Considering that all correlation pairs with the H3 unit maintain the weakest correlations among all matching cases, the individual H3 unit is suspected to suffer from certain problems such as the possible variations in calibrations [e.g., 35].
3.3 Comparison with previous studies
In an attempt to understand the fundamental features of NDIR performance examined in this study, we explored available data concerning comparative measurements of CO2 between different techniques. In a previous study conducted by Satienperakul et al. [18], performance of diffusion-flow injection (GD-FIA) method was evaluated with respect to gas chromatography with thermal conductivity detector (GC-TCD) and to CO2/Temperature meter. These authors collected and analyzed air samples from various environmental conditions (e.g., laboratory, an undercover park, the headspace of pasteurized-milk containers, and soil). The report highlighted that the results obtained with the three methods (GD-FIA, GC-TCD, and CO2/Temperature meter) were statistically indistinguishable at 95% confidence level (based on a t-statistics).
To indirectly assess the relative performance of the NDIR method in CO2 analysis, we compared the RSE values of CO2 data acquired using different methodologies as a measure of reproducibility. Table 5 presents a summary of RSE computations between different methods under various environmental conditions. Although the RSE value determined by the NDIR method was moderately low at 2.33%, those determined by the repetitive CO2 measurement at a constant concentration level (∼340 ppm) were 6.20% (GC-TCD) and 5.98% (GC-FIA). According to another report by Esler et al (2000), CO2 analysis by Fourier transform infrared (FT-IR) spectroscopy yielded short-term precision at a level of 0.15%. The relative error in CO2 measurement was reported as -3.0% by the continuous-flow method using a conductimetric detector [24]. As per NIOSH manual of analytical methods (1994), the GC-TCD method has an accuracy of ± 5.3% and a bias of -2.5% in the 2270-10000 ppm range of CO2 analysis. A comparative study of CO2 analysis (in the 800-1000 ppm range) conducted between three brands of detector tubes (Draeger CH 30801, Kitagawa 126, and Gastec 2LL) yielded relative standard error values in the 5-7% range [36]. The mean RSE (2.33%) observed in the present study was derived from 6 different sensor units which were operated concurrently. Hence, our results can be distinguished from those of other studies made by repetitive measurements of an individual unit. Based on the above comparison, it can be concluded that the method applied in the present study (NDIR-based CO2 sensor) may fall into a reliable range of reproducibility in terms of RSE.
4. Summary
This study was undertaken in order to assess the relative performance of NDIR sensors in the continuous real-time analysis of CO2. For this purpose, 3 replicate sensors from each of two NDIR sensor models (H-550 and B-530, ELT Company, Korea) were operated to monitor the CO2 concentration in open air condition in a laboratory. During the comparative experiment conducted in a laboratory environment, the CO2 concentration data were obtained at three second interval as a side-by-side analysis with six sensor units for a continuous duration of 304 hours. The temporal patterns (hourly and daily) of CO2 measured during the entire study showed that performance of each individual sensor unit showed a good correlation in terms of CO2 concentration regardless of the sensor type. The results of the CO2 analysis were compared in terms of RSE (%) values using the data measured concurrently at hourly intervals throughout the study period. According to this analysis, a moderate change in RSE values was observed throughout a 304 hour period with a mean RSE of 2.33%. The results of the correlation analysis further indicated that all 6 sensor units used in this study yielded fairly good correlation with each other. A comparative analysis with other methods suggests that the NDIR method can be used to produce stable data in terms of reproducibility.
In the present study, the relative performance of the NDIR CO2 sensor was evaluated in a range of the concentrations which is comparable to that of the ambient air (i.e., ∼400 ppm range); results of routine monitoring task on CO2 levels are commonly made from the various authentic agencies such as WMO and IPCC. Based on the results of present study, we are currently testing the possibility for the application of this sensing system to the routine analysis of CO2 in ambient air with simultaneous measurement of relevant meteorological parameters.
Acknowledgments
This work was supported by a grant from the Korea Research Foundation (KRF-2006-341-C00026) funded by the Korean government (MOEHRD). All authors also acknowledge the constructive criticism of the anonymous reviewer in improving the final version of the manuscript.
References and Notes
- WMO. The 13th WMO/IAEA Meeting of Experts on Carbon Dioxide Concentration and Related Tracers Measurement Techniques, TD No. 1359), Boulder, Colorado, USA, 19-22 September 2005; 2006.
- Harvey, L.D. D. Allowable CO2concentrations under the United Nations Framework Convention on Climate Change as a function of the climate sensitivity probability distribution function. Environmental Research Letters 2007. [Google Scholar] [CrossRef]
- Orr, J.C.; Fabry, V.J.; Aumont, O.; Bopp, L.; Doney, S.C.; Feely, R.M.; Gnanadesikan, A.; Gruber, N.; Ishida, A.F.; Joos, R.; Key, M.; Lindsay, K.; Maier-Reimer, E.; Matear, R.J.; Monfray, P.; Mouchet, A.; Najjar, R.G.; Plattner, G.-K.; Rodgers, K.B.; Sabine, C.L.; Sarmiento, J.L.; Schlitzer, R.; Slater, R.D.; Totterdell, I.J.; Weirig, M.-F.; Yamanaka, Y.; Yool, A. Anthropogenic ocean acidification over the twenty-first century and its impact on calcifying organisms. Nature. 2005, 437, 681–686. [Google Scholar]
- Henderson, E.R. Carbon dioxide measures up as a real hazard. 2006. http://www.rimbach.com/scripts/Article/ Accessed on 12 June, 2007.
- Hannan, J. Your Role in the “Greenhouse Effect”. ITEST Bulletin. 1997, 28, 9–11. [Google Scholar]
- NIOSH Chemical Listing and Documentation of Revised IDLH Values: Documentation for Immediately Dangerous to Life or Health Concentrations (IDLH), 1995.
- Ferng, S.F.; Lee, L.W. Indoor air quality assessment of daycare facilities with carbon dioxide, temperature, and humidity as indicators. Journal of Environmental Health. 2002, 65, 14–18. [Google Scholar]
- Daisey, J.M.; Angell, W.J.; Apte, M.G. Indoor air quality, ventilation and health symptoms in schools: an analysis of existing information. Indoor Air 2003, 13, 53–64. [Google Scholar]
- Ramachandran, G.; Adgate, J.L.; Banerjee, S.; Church, TR.; Jones, D.; Fredrickson, A.; Sexton, K. Indoor air quality in two urban elementary schools measurements of airborne fungi, carpet allergens, CO2, temperature, and relative humidity. Journal of Occupational and Environmental Hygiene. 2005, 2(11), 553–566. [Google Scholar]
- Jennings, PR.; Fahringer, D.; Collins, T. Sick building syndrome. Indoor air quality and your patients' health. JAAPA. 2000, 34-6, 39. [Google Scholar]
- Gupta, S.; Khare, M.; Goyal, R. Sick building syndrome— A case study in a multistory centrally air-conditioned building in the Delhi City. Building and Environment. 2007, 42, 2797–2809. [Google Scholar]
- Giannovario, J.A.; Grob, R.L.; Rulon, P.W. Analysis of trace pollutants in the air by means of cryogenic gas chromatography. Journal of Chromatography A. 1976, 121, 285–294. [Google Scholar]
- Woebkenberg, M.L. Carbon dioxide: method 6603: NIOSH Manual of Analytical Methods (NMAM). 1994. [Google Scholar]
- Radwan, L. Infrared CO2 analysis in expired air as a test of the pulmonary function. I. Evaluation of the capnographic curve. Pol.Med. J 1967, 6, 403–11. [Google Scholar]
- Nydal, R.; Lovseth, K. Carbon-14 measurements in atmospheric CO2from northern and southern hemisphere sites. 1962-1993. 1996. ORNL/CDIAC, NDP-057. [Google Scholar]
- Verkouteren, R.M.; Dorko, W.D. High-accuracy gas analysis via isotope dilution mass spectrometry: carbon dioxide in air. Analytical chemistry. 1989, 21, 2416–22. [Google Scholar]
- Esler, M. B.; Griffith, D.W.; Wilson, S.R.; Steele, L.P. Precision trace gas analysis by FT-IR spectroscopy. Simultaneous analysis of CO2, CH4, N2O, and CO in air. Analytical Chemistry. 2000, 72, 206–15. [Google Scholar]
- Satienperakul, S.; Cardwell, T.J.; Cattrall, R.W.; McKelvie, I.D.; Taylor, D.M.; Kolev, S.D. Determination of carbon dioxide in gaseous samples by gas diffusion-flow injection. Talanta. 2004, 62, 631–636. [Google Scholar]
- Baadenhuijsen, H.; Jacobs, H.E.H. Seuren. Determination of total CO2 in plasma by automated flow-injection analysis. Clinical chemistry. 1979, 25, 443–445. [Google Scholar]
- Lang, W.; Wolf, U.H.; Zander, R. A sensitive continuous and discontinuous photometric determination of oxygen, carbon dioxide, and carbon monoxide in gases and fluids. Analytical Biochemistry. 1979, 92, 255–264. [Google Scholar]
- Motomizu, S.; Toei, K.; Kuwaki, T.; Oshima, M. Gas-Diffusion Unit with Tubular Microporous Poly (tetrafluoroethy1ene) Membrane for Flow-Injection Determination of Carbon Dioxide. Analytical Chemistry. 1987, 59, 2930–32. [Google Scholar]
- Linares, P.; Castro, M.D.; Luque, de.; Valcarcel, M. Simultaneous determination of carbon dioxide and sulphur dioxide in wine by gas-diffusion/flow-injection analysis. Analytica Chimica Acta. 1989, 225, 443–448. [Google Scholar]
- Bruckenstein, S.; Symanski, S. Continuous conductimetric sensor for carbon dioxide. Analytical Chemistry. 1986, 58, 1766–1770. [Google Scholar]
- Calegario, F.F.; Cosso, R.G.; Almeida, F.V.; Vercesi, A.E.; Jardim, W.F. Determination of the respiration rate of tomato fruit using flow analysis. Postharvest Biology and Technology. 2001, 22, 249–256. [Google Scholar]
- Almeida, F.V.; Guimaraes, J.R.; Jardim, W.F. Measuring the CO2flux at the air/water interface in lakes using flow injection analysis. Journal of Environmental Monitoring. 2001, 3, 317–321. [Google Scholar]
- Liu, S.; Tubino, M. Dual-phase gas-permeation flow-injection thermometric analysis for the determination of carbon dioxide. Talanta. 1998, 47, 711–717. [Google Scholar]
- Su, X.-L.; Tan, H.-W.; Li, W.-F.; Wei, W.-Z.; Yao, S.-Z. Comparison of a Piezoelectric Impedance Sensor-Based Flow-Injection System and a N, N, N', N'-Tetrakis-2-hydroxylethyl Ethylenediamine-Coated Quartz Crystal Microbalance for Determination of CO2 in Wine and Beer. Analytical Sciences. 1998, 14, 553. [Google Scholar]
- Yao, S.-Z.; Su, X.-L. Gas diffusion flow injection analysis with bulk acoustic wave detection and the applications for determining nitrogen, carbon, or sulfite species in varieties of complex matrixes. Journal of AOAC International. 1999, 82, 1479–1487. [Google Scholar]
- Wong, J. Y. NDIR Gas Sensor. US Patent No. 5,444,249, 22 Aug.
- Sashida, T.; Saitou, T.; Egawa, M. Development of a carbon dioxide concentration meter using a solid electrolyte sensor; 2002; SICE, Aug 5-7; 2002; Osaka. [Google Scholar]
- Yi, S.H.; Park, Y.W.; Han, S.O.; Min, N.; Kim, E.S.; Ahn, T.W. Novel NDIR CO2sensor for indoor Air quality monitoring. The 13th International Conference on Solid-State Sensors, Actuators and Microsystems, Seoul, Korea, June 5-9 2005; 2005. [Google Scholar]
- Lang, T.; Wiemhöfer, H.-D.; Göpel, W. Carbonate Based CO2 Sensors with High Performance. Sensors and Actuators B. 1996, 34, 383–387. [Google Scholar]
- Stuart, B.H. Infrared Spectroscopy: Fundamentals and Applications (Analytical Techniques in the Sciences (AnTs).; John Wiley and Sons, 2004. [Google Scholar]
- Miller, L. J. Principles of Infrared Technology: A Practical Guide to the State of the Art; Springer, 2001. [Google Scholar]
- Werle, P.W.; Mazzinghi, P.; Amato, F.D.; Rosa, De M.; Maurer, K.; Slemr, F. Signal processing and calibration procedures for in situ diode-laser absorption spectroscopy. Spectrochimica Acta Part A. 2004, 60, 1685–1705. [Google Scholar]
- Norback, D.; Ancker, K.; Johanson, G. Field Evaluation of CO2 Detector Tubes for Measuring Outdoor Air Supply Rate in the Indoor Environment. Indoor Air. 1992, 2, 58–64. [Google Scholar]
Figure 1.
A picture of two different sensor types tested in this study: [A] B-530 and [B] H-550.

Figure 2.
A comparison of relative performance of six sensor units for CO2 analysis (All results compared in overall mean concentration levels of CO2 (ppm) at hourly intervals) Dotted line represents the grand mean concentration derived from all six sensor units and whiskers represent the standard deviation values from the mean.

Figure 3.
a.A comparison of variations in mean hourly concentration values of CO2 measured simultaneously by 6 CO2 senor units for a continuous duration of 304.b.The variation patterns in the mean CO2 levels (ppm) measured in side-by-side analysis with 6 sensor units for the entire study (Results are compared in terms of the daily mean values).

Figure 4.
The variation in hourly RSE (%) values in the simultaneous measurement of CO2 made by 6 sensor units (Dotted line shows the overall mean RSE value for the entire study).
Figure 4.
The variation in hourly RSE (%) values in the simultaneous measurement of CO2 made by 6 sensor units (Dotted line shows the overall mean RSE value for the entire study).

Figure 5.
The temporal variation of percent deviation (PD) values derived using hourly mean value of CO2 data measured concurrently by 6 sensor units.
Figure 5.
The temporal variation of percent deviation (PD) values derived using hourly mean value of CO2 data measured concurrently by 6 sensor units.

Figure 6.
Comparison of correlation analysis patterns between different matching pairs of sensor units: the results of three extreme cases are plotted for comparative purpose.
Figure 6.
Comparison of correlation analysis patterns between different matching pairs of sensor units: the results of three extreme cases are plotted for comparative purpose.


Table 1.
A brief description of general properties and specifications pertaining to two types of NDIR-based CO2 sensors used in this study.
| Property / specification | Sensor model | |
|---|---|---|
| B-530 | H-550 | |
| Sensing Method | (Non dispersive Infrared) | |
| Measurement Range | 0∼10,000 ppm | 0∼50,000 ppm |
| Storage Temperature | -20 ∼ +60°C | -20 ∼ +60°C |
| Operating Temperature | 0∼+50°C | 0 ∼ +50°C |
| Sensitivity | ±20 ppm ± 1% | ±20 ppm ± 1% |
| Accuracy | ±30 ppm ±5% | ±30 ppm ±5% |
| Response time (90%) | Within 120 sec | Within 30 sec |
| Operating Humidity (RH: (%) | 0∼95% RH | 0∼95% RH |
| Input Power | DC12 V | DC12 V |
| Size | 50(T)X65(W)X25.5(H) mm | 38(L)X32(W)X12(H) mm |
| Output Signal | Analog (0.5 V ∼4.5 V,2∼10 V) | Digital (UART Rx,,Tx) |
Table 2.
A statistical summary of CO2 concentration data measured using two different sensor types (H-500 and B-530 model) (21May to 01June 2007: 304 hour duration): Results derived using [A] 3 second raw data and [B] hourly data are compared (All concentrations in ppm unit).
| Sensor units | |||||||
|---|---|---|---|---|---|---|---|
| H11] | H21] | H31] | B12] | B22] | B32] | ||
| [A] 3 second data | Mean ± SD (Median) | 438 ±36.3 (436) | 445 ± 40 (442) | 407 ±39.8 (396) | 396 ±34.2 (391) | 448 ± 31.7 (442) | 439 ± 30.2 (433) |
| (raw data) | Range | 333-668 | 335-678 | 307-666 | 323-557 | 317-678 | 335-668 |
| N | 383.662 | 383,660 | 383,581 | 383,406 | 383,469 | 383.555 | |
| [B] After conversion into hourly intervals | Mean ± SD (Median) | 438 ±33.8 (437) | 445 ± 37.2 (445) | 407 ±37 (401) | 396 ±30.9 (392) | 448 ± 29 (442) | 439 ±27.4 (433) |
| Range | 372-586 | 368-601 | 330-572 | 336-522 | 391-595 | 386-582 | |
| N | 304 | 304 | 304 | 304 | 304 | 304 | |
1] and 2] denote the model No H-500 and B-530 series of sensor units for CO; measurements used in this study, respectively
Table 3.
A statistical summary of percent deviation (PD) values for each sensor unit calculated from the raw data and hourly mean values of all 6 sensor units.
| Sensor units | |||||||
|---|---|---|---|---|---|---|---|
| H11] | H21] | H31] | B2] | B22] | B32] | ||
| [A] 3 second raw data | Mean ± SD (Median) | 2.25 ±2.93 (1.95) | 2.21 ±4.96 (2.85) | -5.15 ± 5.74 (-5.58) | -5.60 ±6.51 (-7.47) | 4.15 ± 2.77 (4.16) | 2.49 ± 2.52 (2.51) |
| (N = 359.919) | Range | -9.87-15.2 | -17.2-17.7 | -24.6-10.8 | -20.1-21.6 | -18.9-23.5 | -10.5-18.6 |
| [B] Hourly data | Mean ± SD (Median) | 2.03 ±2.52 (1.54) | 3.73 ±2.76 (3.46) | -5.11 ±5.35 (-5.42) | -7.68 ±3.98 (-8.12) | 4.63 ± 2.05 (4.75) | 2.40 ±2.00 (2.55) |
| (N = 304) | Range | -2.76-10.7 | -2.46-11.0 | -15.2-7.86 | -16.6-2.64 | -0.23-9.74 | -3.49-6.98 |
1] and 2] denote the model no H-500 and B-530 of sensor units for CO2 measurements used in this study, respectively
Table 4.
Results of a correlation analysis between hourly CO2 concentration data in side-by-side measurement with different sensor units (All results are expressed in terms of correlation coefficient values).
| H1 | H2 | H3 | B1 | B2 | B3 | |
|---|---|---|---|---|---|---|
| H1 | 1 | |||||
| H2 | 0.98** | 1 | ||||
| H3 | 0.75** | 0.75** | 1 | |||
| B1 | 0.70** | 0.72** | 0.39** | 1 | ||
| B2 | 0.85** | 0.88** | 0.66** | 0.88** | 1 | |
| B3 | 0.85** | 0.86** | 0.66** | 0.92** | 0.99** | 1 |
**Correlations is significant at the level of 0.01 (two-tailed)
| Method | Measurement condition | Mean | SD | N | CV | RSE (%) |
|---|---|---|---|---|---|---|
| NDIR-sensor 1] | Laboratory | 429 | 33 | 6 | 7.69 | 2.334] |
| GD-FIA 2] | In open air (Laboratory) | 338 | 35 | 3 | 10.4 | 5.98 |
| GC-TCD 2] | In open air (Laboratory) | 335 | 36 | 3 | 10.7 | 6.2 |
| CO2 monitor 2l | In open air (Laboratory) | 320 | 3 | 3 | 0.94 | 0.54 |
| GD-FIA2] | Undercover car parking | 565 | 9 | 3 | 1.59 | 0.92 |
| GC-TCD2] | Undercover car parking | 554 | 15 | 3 | 2.71 | 1.56 |
| CO2 monitor21 | Undercover car parking | 541 | 18 | 3 | 3.33 | 1.92 |
| GD-FIA2] | Soil atmosphere | 5770 | 340 | 3 | 5.89 | 3.4 |
| GC-TCD21 | Soil atmosphere | 5820 | 340 | 3 | 5.84 | 3.37 |
| GD-FIA21 | Headspace in milk container | 6020 | 80 | 3 | 1.33 | 0.77 |
| GC-TCD2] | Headspace in milk container | 5750 | 190 | 3 | 3.3 | 1.91 |
| Detector tube anlysis3] | Indoor air | 800-1000 | -5] | -5] | -5] | 5-7 |
1]This study
2]Satierperakul et al., 2004
3]Norback et al., 1992
4]Shows mean RSE value for entire study, calculated from hourly RSE data
5]Data not available
© 2007 by MDPI ( http://www.mdpi.org). Reproduction is permitted for noncommercial purposes.
Share and Cite
MDPI and ACS Style
Pandey, S.K.; Kim, K.-H. The Relative Performance of NDIR-based Sensors in the Near Real-time Analysis of CO2 in Air. Sensors 2007, 7, 1683-1696. https://doi.org/10.3390/s7091683
AMA Style
Pandey SK, Kim K-H. The Relative Performance of NDIR-based Sensors in the Near Real-time Analysis of CO2 in Air. Sensors. 2007; 7(9):1683-1696. https://doi.org/10.3390/s7091683
Chicago/Turabian StylePandey, Sudhir Kumar, and Ki-Hyun Kim. 2007. "The Relative Performance of NDIR-based Sensors in the Near Real-time Analysis of CO2 in Air" Sensors 7, no. 9: 1683-1696. https://doi.org/10.3390/s7091683