Land Use/Cover Dynamics in Response to Changes in Environmental and Socio-Political Forces in the Upper Reaches of Yangtze River, China


Abstract
:
1. Introduction
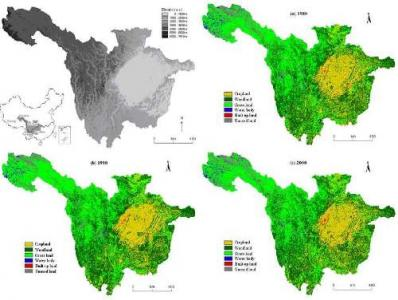
2. Study area
3. Methodology
3.1. Data
3.2. Methods
| CHi | is the change of land use/cover in row i relative to the previous compared year; |
| pi. | is the row total of grid cells for category i; |
| p.i | is the column total of grid cells for category i. |
- Ploss(i),j is the percentage taken by type j in the total “conversion loss” of category row i;
- Pgain(i),j is the percentage taken by type j in the total “conversion gain” of category row i;
- pi,j and pj.i is the individual entry in a transition matrix A.
4. Results and Discussion
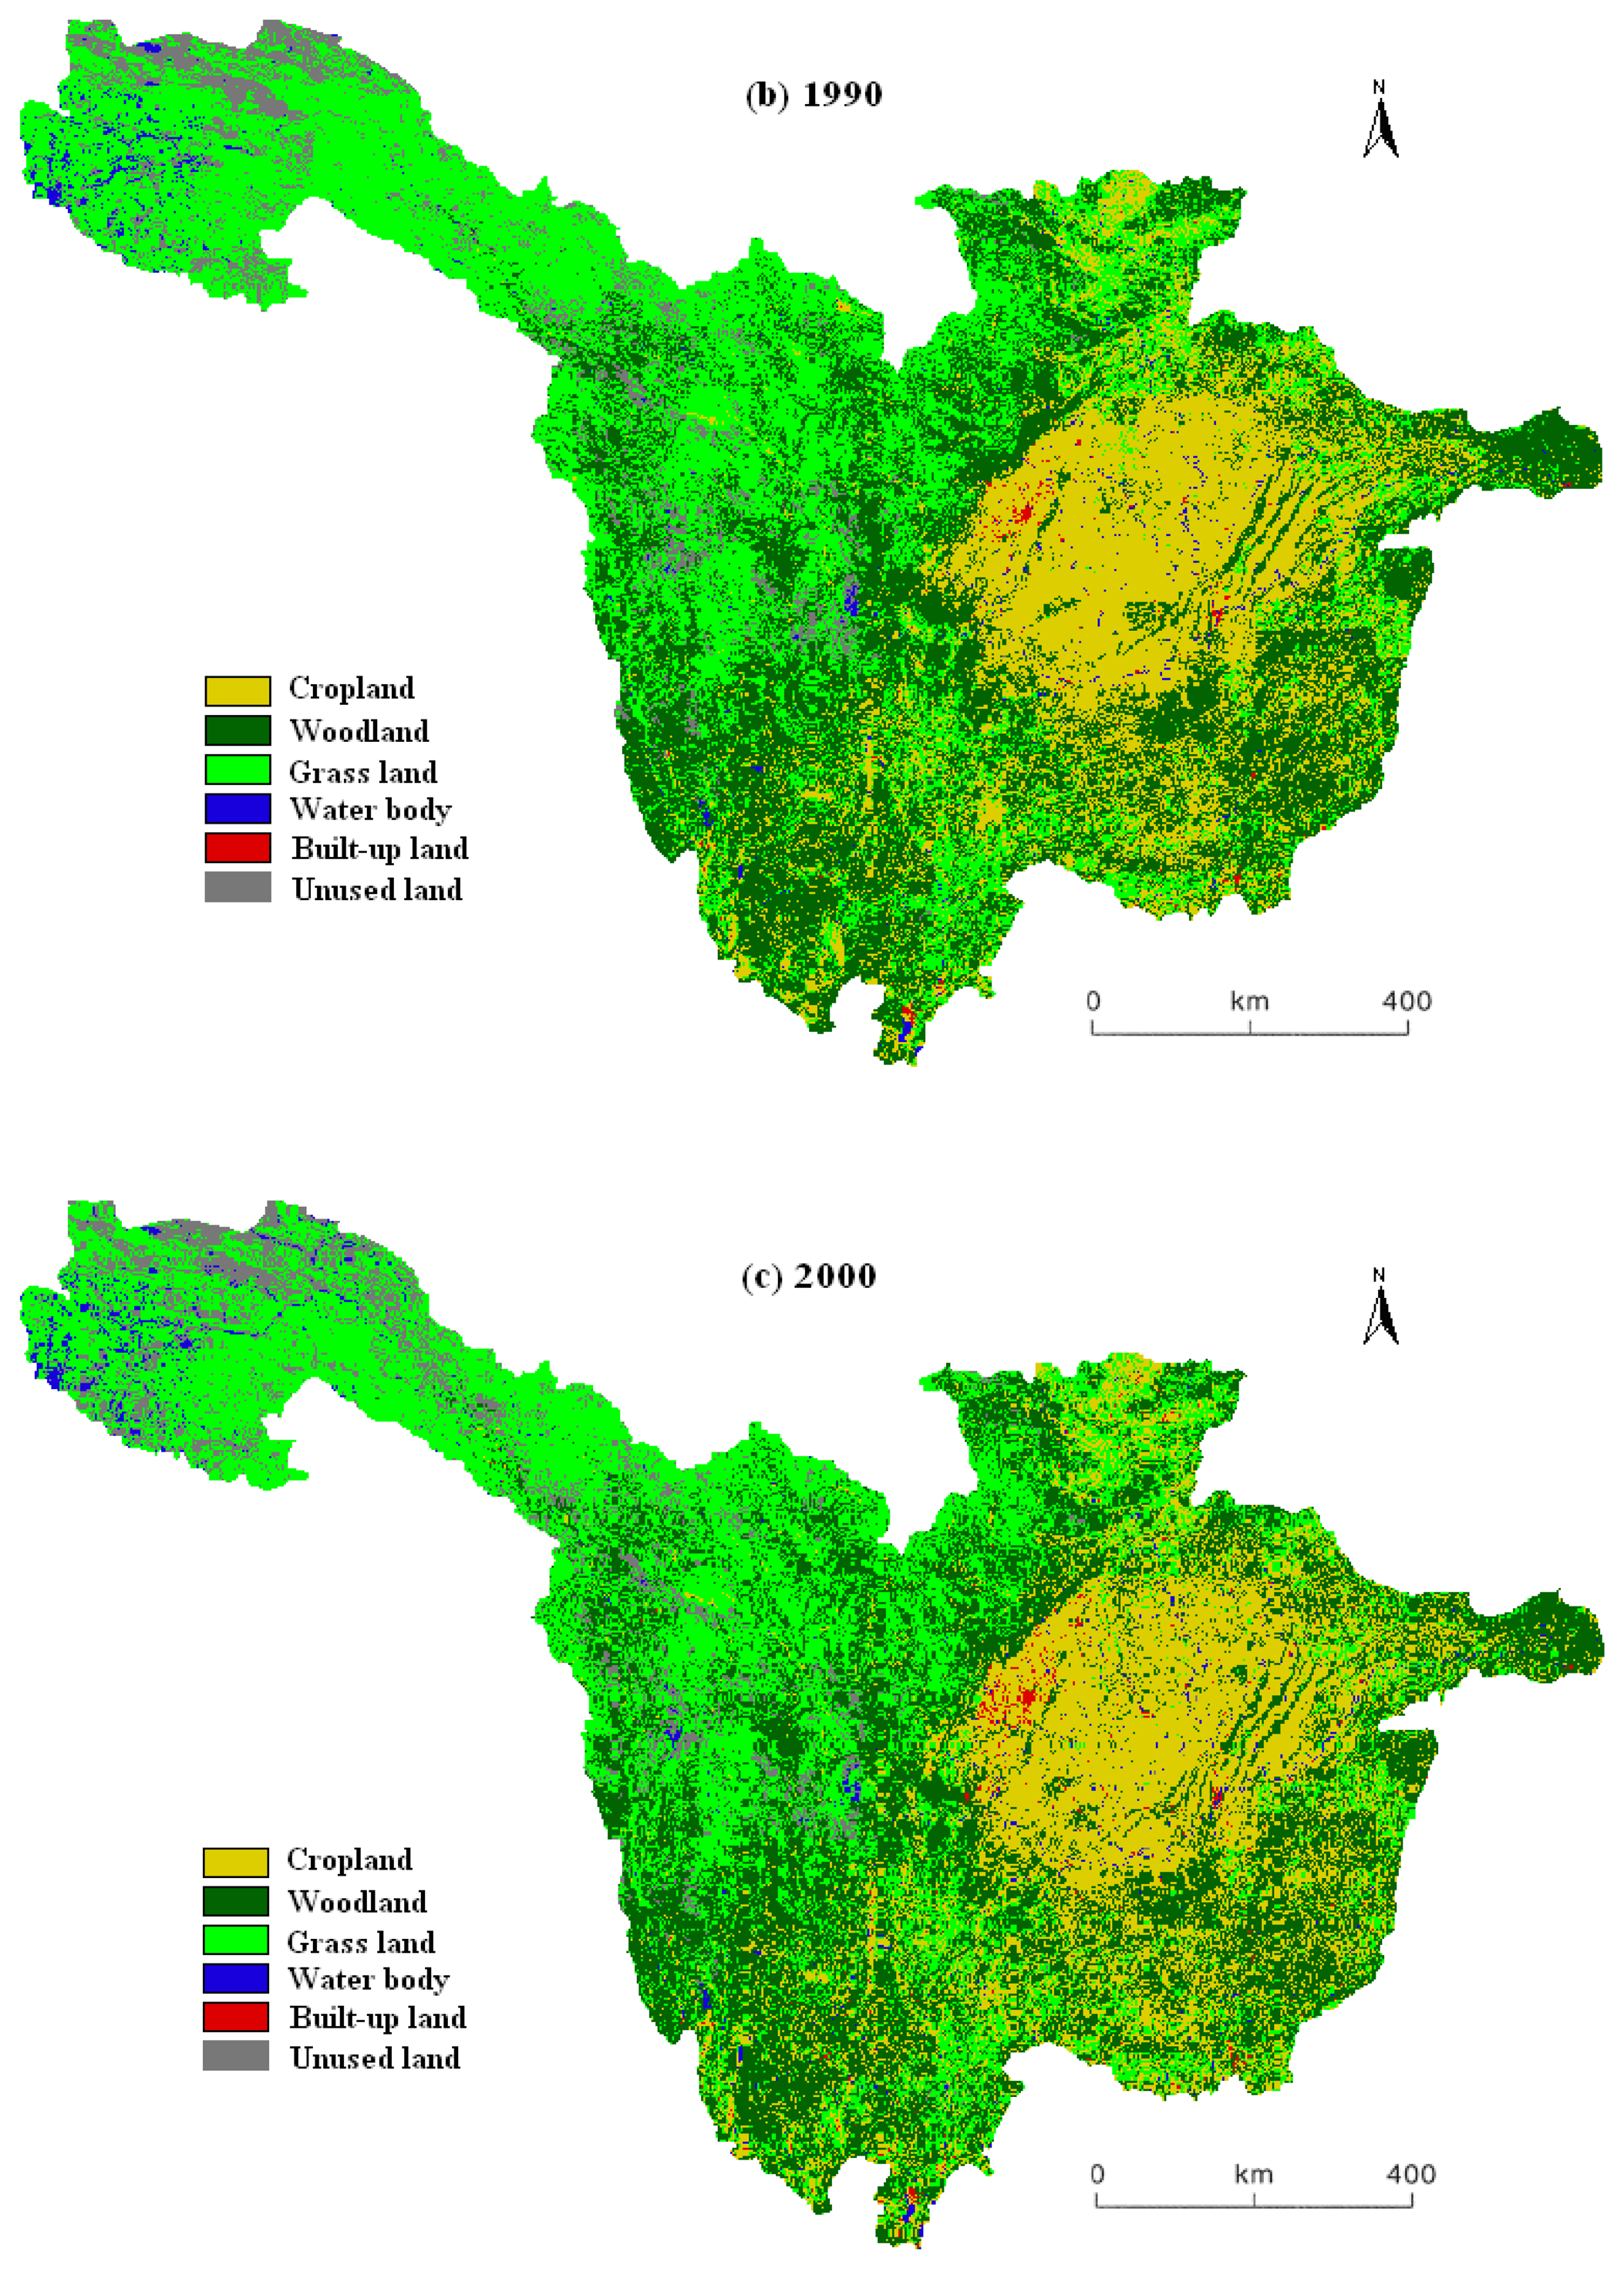
4.1. Land use/cover change
5. Conclusions
Acknowledgments
References
- Munroe, D.; Müller, D. Issues in spatially explicit statistical land-use/cover change (LUCC) models: Examples from western Honduras and the Central Highlands of Vietnam. Land Use Policy 2007, 24, 521–530. [Google Scholar]
- Fan, F.; Weng, Q.; Wang, Y. Land use and land cover change in Guangzhou, China, from 1998 to 2003, based on Landsat TM/ETM+ imagery. Sensors 2007, 7, 1323–1342. [Google Scholar]
- Peng, J.; Wang, Y.L.; Wu, J.S.; Yue, J.; Zhang, Y.; Li, W.F. Ecological effects associated with land-use change in China's southwest agriculture landscape. Int. J. Sustainable Dev. World Ecol. 2006, 13, 315–325. [Google Scholar]
- Gautam, A.P.; Webb, E.L.; Shivakoti, G.P.; Zoebisch, M.A. Land use dynamics and landscape change pattern in a mountain watershed in Nepal. Agric. Ecosyst. Environ. 2003, 99, 83–96. [Google Scholar]
- Kamusoko, C.; Aniya, M. Land use/cover change and landscape fragmentation analysis in the Bindura district, Zimbabwe. Land Degrad. Dev. 2007, 18, 221–233. [Google Scholar]
- Liu, J.Y.; Liu, M.L.; Tian, H.Q.; Zhuang, D.F.; Zhang, Z.X.; Zhang, W.; Tang, X.M.; Deng, X.Z. Spatial and temporal patterns of China's cropland during 1990-2000: an analysis based on Landsat TM data. Remote Sens. Environ. 2005, 98, 442–456. [Google Scholar]
- Reger, B.; Otte, A.; Waldhardt, R. Identifying patterns of land-cover change and their physical attributes in a marginal European landscape. Landscape Urban Plan. 2007, 81, 104–113. [Google Scholar]
- Semwal, R.L.; Nautiyal, S.; Sen, K.K.; Rana, U.; Maikhuri, R.K.; Rao, K.S.; Saxena, K.G. Patterns and ecological implications of agricultural land-use changes: a case study from central Himalaya, India. Agric. Ecosyst. Environ. 2004, 102, 81–92. [Google Scholar]
- Williams, N.S.G.; McDonnell, M.J.; Seager, E.J. Factors influencing the loss of an endangered ecosystem in an urbanising landscape: a case study of native grassland from Melbourne, Australia. Landscape Urban Plan. 2005, 71, 35–49. [Google Scholar]
- Hietel, E.; Waldhardt, R.; Otte, A. Statistical modeling of land-cover changes based on key socio-economic indicators. Ecol. Econ. 2007, 62, 496–507. [Google Scholar]
- Long, H.L.; Wu, X.Q.; Wang, W.J.; Dong, G.H. Analysis of urban-rural land-use change during 1995-2006 and its policy dimensional driving forces in Chongqing, China. Sensors 2008, 8, 681–699. [Google Scholar]
- Seto, K.C.; Kaufmann, R.K. Modelling the drivers of urban land use change in the Pearl River Delta, China: integrating remote sensing with socioeconomic data. Land Econ. 2003, 79, 106–121. [Google Scholar]
- Veldkamp, A.; Verburg, P.H. Modelling land use change and environmental impact. J. Environ. Manage. 2004, 72, 1–3. [Google Scholar]
- Xiao, H.L.; Weng, Q.H. The impact of land use and land cover changes on land surface temperature in a karst area of China. J. Environ. Manage. 2007, 85, 245–257. [Google Scholar]
- Zhang, W.G.; Hu, Y.M.; Hu, J.C.; Chang, Y.; Zhang, J.; Liu, M. Impacts of land-use change on mammal diversity in the upper reaches of Minjiang River, China: Implications of biodiversity conservation planning. Landscape Urban Plan. 2008, 85, 195–204. [Google Scholar]
- Chen, L.; Wang, J.; Fu, B.J.; Qiu, Y. Land-use change in a small catchment of northern Loess Plateau, China. Agric. Ecosyst. Environ. 2001, 86, 163–172. [Google Scholar]
- Hietel, E.; Waldhardt, R.; Otte, A. Analysing land-cover changes in relation to environmental variables in Hesse, Germany. Landscape Ecol. 2004, 19, 473–489. [Google Scholar]
- Reid, R.S.; Kruska, R.L.; Muthui, N.; Taye, A.; Wotton, S.; Wilson, C.J.; Mulatu, W. Land-use and land-cover dynamics in response to changes in climatic, biological and socio-political forces: the case of southwestern Ethiopia. Landscape Ecol. 2000, 15, 339–355. [Google Scholar]
- Mladenoff, D.J.; White, M.A.; Pastor, J.; Crow, T.R. Comparing spatial pattern in unaltered old-growth and disturbed forest landscapes. Ecol. Appl. 1993, 3, 294–306. [Google Scholar]
- Verburg, P.H.; Veldkamp, A. The role of spatially explicit models in land-use change research: a case study for cropping patterns in China. Agric. Ecosyst. Environ. 2001, 85, 177–190. [Google Scholar]
- Lambin, E.F.; Rounsevell, M.D.A.; Geist, H.J. Are agricultural land-use models able to predict changes in land-use intensity? Agric. Ecosyst. Environ. 2000, 82, 321–331. [Google Scholar]
- Long, H.L.; Tang, G.P.; Li, X.B.; Heilig, G.K. Socio-economic driving forces of land-use change in Kunshan, the Yangtze River Delta Economic Area of China. J. Environ. Manage. 2007, 83, 351–364. [Google Scholar]
- Liu, J.Y.; Liu, M.L.; Zhuang, D.F.; Zhang, Z.X.; Deng, X.Z. Study on spatial pattern of land-use change in China during 1995-2000. Sci. Chin. Ser. D 2003, 46, 373–378. [Google Scholar]
- Porter Bolland, L.; Ellis, E.A.; Gholz, H.L. Land use dynamics and landscape history in La Montana, Campeche, Mexico. Landscape Urban Plan. 2007, 82, 198–207. [Google Scholar]
- Tekle, K.; Hedlund, L. Land cover changes between 1958 and 1986 in Kalu District, Southern Wello, Ethiopia. Mountain Res. Dev. 2000, 20, 42–51. [Google Scholar]
- Chen, J.; Gong, P.; He, C.Y.; Pu, R.L.; Shi, P.J. Land-use/land-cover change detection using improved change-vector analysis. Photogram. Eng. Remote Sens. 2003, 69, 369–379. [Google Scholar]
- Kaufmann, R.K.; Seto, K.C. Change detection, accuracy, and bias in a sequential analysis of Landsat imagery in the Pearl River Delta, China: econometric techniques. Agric. Ecosyst. Environ. 2001, 85, 95–105. [Google Scholar]
- Krausmann, F.; Haberl, H.; Schulz, N.B.; Erb, K.H.; Darge, E.; Gaube, V. Land-use change and socio-economic metabolism in Austria –Part I : driving forces of land-use change: 1950-1995. Land Use Policy 2003, 20, 1–20. [Google Scholar]
- Alig, R.J.; Kline, J.D.; Lichtenstein, M. Urbanization on the US landscape: looking ahead in the 21st century. Landscape Urban Plan. 2004, 69, 219–234. [Google Scholar]
- Giri, C.; Defourny, P.; Shrestha, S. Land cover characterization and mapping of continental Southeast Asia using multi-resolution satellite sensor data. Int. J. Remote Sens. 2003, 24, 4181–4196. [Google Scholar]
- Long, H.L.; Heilig, G.K.; Li, X.B.; Zhang, M. Socio-economic development and land-use change: analysis of rural hosing land transition in the Transect of the Yangtze River, China. Land Use Policy 2007, 24, 141–153. [Google Scholar]
- Liu, J.Y.; Zhan, J.Y.; Deng, X.Z. Spatio-temporal patterns and driving forces of urban land expansion in China during the economic reform era. Ambio 2005, 34, 450–455. [Google Scholar]
- Lu, L.; Li, X.; Cheng, G.D. Landscape evolution in the middle Heihe River Basin of north-west China during the last decade. J. Arid Environ. 2003, 53, 395–408. [Google Scholar]
- Weng, Q.H. Land use change analysis in the Zhujiang Delta of China using satellite remote sensing, GIS and stochastic modelling. J. Environ. Manage. 2002, 64, 273–284. [Google Scholar]
- Wang, X.H.; Zheng, D.; Shen, Y.C. Land use change and its driving forces on the Tibetan Plateau during 1990-2000. Catena 2008, 72, 56–66. [Google Scholar]
- Yang, Z.S.; Liang, L.H.; Liu, Y.S.; He, Y.M. Land use change during 1960-2000 period and its eco-environmental effects in the Middle and Upper reaches of the Yangtze River: a case study in Yiliang County, Yunnan, China. J. Mountain Sci. 2004, 1, 250–263. [Google Scholar]
- Li, C.H.; Gu, S.Z. A study on the characteristics of soil and water loss in the upper reaches of the Yangtze River and corresponding countermeasures. Bull. Soil Water Conserv. 1992, 12, 1–6, in Chinese. [Google Scholar]
- Wang, X.T. The control of soil and water loss in the upper reaches of the Yangtze River and agricultural and rural sustainable development. Issues Agric. Economy 1998, 12, 40–44, in Chinese. [Google Scholar]
- Higgitt, D.L.; Lu, X.X. Challenges in relating land use to sediment yield in the Upper Yangtze. Hydrobiologia 1999, 410, 269–277. [Google Scholar]
- Lu, X.X.; Ashmore, P.; Wang, J. Sediment yield mapping in a large river basin: the Upper Yangtze, China. Environ. Model. Soft. 2003, 18, 339–353. [Google Scholar]
- Ruddiman, W.F.; Prell, W.L.; Raymo, M.E. Late Cenozoic uplift in southern Asia and the American West: rationale for general circulation modelling experiments. J. Geophys. Res. 1989, 94, 18379–18391. [Google Scholar]
- Lu, X.X.; Higgitt, D.L. Recent changes of sediment yield in the Upper Yangtze, China. Environ. Manag. 1998, 22, 697–709. [Google Scholar]
- Long, H.L.; Heilig, G.K.; Wang, J.; Li, X.B.; Luo, M.; Wu, X.Q.; Zhang, M. Land use and soil erosion in the upper reaches of the Yangtze River: some socio-economic considerations on China's Grain-For-Green Programme. Land Degrad. Dev. 2006, 17, 589–603. [Google Scholar]
- Liu, J.Y.; Zhuang, D.F.; Luo, D.; Xiao, X. Land-cover classification of China: integrated analysis of AVHRR imagery and geophysical data. Int. J. Remote Sens. 2003, 24, 2485–2500. [Google Scholar]
- NBSC (National Bureau of Statistics of China). China Statistical Yearbook; Chinese Statistical Publishing House: Beijing, 1960-2003; in Chinese. [Google Scholar]
- Qian, J.; Wang, G.X.; Ding, Y.J.; Liu, S.Y. The land ecological evolutional patterns in the source areas of Yangtze and Yellow Rivers in the past 15 years, China. Environ. Monit. Assess. 2006, 116, 137–156. [Google Scholar]
- Wang, G.X.; Wang, Y.B.; Kubota, J. Land-cover changes and its impacts on ecological variables in the headwaters area of the Yangtze River, China. Environ. Monit. Assess. 2006, 120, 361–385. [Google Scholar]
- Ochoa-Gaona, S.; Gonzalez-Espinosa, M. Land use and deforestation in the highlands of Chiapas, Mexico. Appl. Geogr. 2000, 20, 17–42. [Google Scholar]
- Kammerbauer, J.; Ardon, C. Land use dynamics and landscape change pattern in a typical watershed in the hillside region of central Honduras. Agric. Ecosyst. Environ. 1999, 75, 93–100. [Google Scholar]
- Rao, K.S.; Pant, R. Land use dynamics and landscape change pattern in a typical micro watershed in the mid elevation zone of central Himalaya, India. Agric. Ecosyst. Environ. 2001, 86, 113–123. [Google Scholar]
- Del Barrio, G.; Alvera, B.; Puigdefabregas, J.; Diez, C. Response of high mountain landscape to topographic variables: Central Pyrenees. Landscape Ecol. 1997, 12, 95–115. [Google Scholar]
- Lin, G.C.S.; Ho, S.P.S. China's land resources and land-use change: insights from the 1996 land survey. Land Use Policy 2003, 20, 87–107. [Google Scholar]
- Zhang, H.; Wu, J.W.; Zheng, Q.H.; Yu, Y.J. A preliminary study of oasis evolution in the Tarim Basin, Xingjiang, China. J. Arid Environ. 2003, 55, 545–553. [Google Scholar]
- Zhou, Y.M.; Wang, J.H.; Ma, A.Q.; Qi, Y.; Ba, Y. Study on land use dynamics based on RS and GIS in Linze County, Gansu Province, China. J. Desert Res. 2003, 23, 142–146, in Chinese. [Google Scholar]
- Wang, X.H.; Lu, C.H.; Fang, J.F.; Shen, Y.C. Implication for development of grain-for-green policy based on cropland suitability evaluation in desertification-affected north China. Land Use Policy 2007, 24, 417–424. [Google Scholar]
- Feng, Z.M.; Yang, Y.Z.; Zhang, Y.Q.; Zhang, P.T.; Li, Y.Q. Grain-for-green policy and its impacts on grain supply in West China. Land Use Policy 2005, 22, 301–312. [Google Scholar]
- Liu, C.; Wang, Q.X.; Watanabe, M. Nitrogen transported to three Gorges Dam from agro-ecosystems during 1980-2000. Biogeochemistry 2006, 81, 291–312. [Google Scholar]
- Hietel, E.; Waldhardt, R.; Otte, A. Linking socio-economic factors, environment and land cover in the German Highlands, 1945-1999. J. Environ. Manage. 2005, 75, 133–143. [Google Scholar]
- Ding, C. Land policy reform in China: assessment and prospects. Land Use Policy 2003, 20, 109–120. [Google Scholar]
- Bengston, D.N.; Fletcher, J.O.; Nelson, K.C. Public policies for managing urban growth and protecting open space: policy instruments and lessons learned in the United States. Landscape Urban Plan. 2004, 69, 271–286. [Google Scholar]


| Land use/cover type in 1990 | Land use/cover type in 1980 | Changes in 1990 (%) | ||||||
|---|---|---|---|---|---|---|---|---|
| CL | WL | GL | WB | BUL | UL | Total | ||
| CL | 157.119 | 35.576 | 19.095 | 1.856 | 2.375 | 0.062 | 216.083 | -1.69 |
| WL | 38.309 | 255.174 | 43.947 | 0.57 | 0.26 | 1.104 | 339.364 | 0.69 |
| GL | 21.642 | 44.799 | 273.515 | 3.862 | 0.313 | 24.031 | 368.162 | 3.76 |
| WB | 1.523 | 0.472 | 2.693 | 6.452 | 0.123 | 0.669 | 11.932 | -17.63 |
| BUL | 1.149 | 0.171 | 0.123 | 0.101 | 1.175 | 0.006 | 2.725 | -35.91 |
| UL | 0.048 | 0.831 | 15.461 | 1.645 | 0.006 | 29.427 | 47.418 | -14.25 |
| Total | 219.79 | 337.023 | 354.834 | 14.486 | 4.252 | 55.299 | 985.684 | |
| Landuse/covertype in 2000 | Land use/cover type in 1990 | Changesin 2000(%) | ||||||
|---|---|---|---|---|---|---|---|---|
| CL | WL | GL | WB | BUL | UL | Total | ||
| CL | 195.262 | 15.825 | 7.99 | 0.191 | 0.223 | 0.016 | 219.507 | 1.58 |
| WL | 11.612 | 307.774 | 16.209 | 0.083 | 0.035 | 0.344 | 336.057 | -0.97 |
| GL | 6.3 | 14.974 | 325.857 | 0.432 | 0.031 | 8.308 | 355.901 | -3.33 |
| WB | 0.618 | 0.194 | 0.698 | 11.07 | 0.022 | 1.4 | 14.001 | 17.34 |
| BUL | 2.275 | 0.148 | 0.164 | 0.015 | 2.412 | 0.001 | 5.015 | 84.04 |
| UL | 0.018 | 0.45 | 17.244 | 0.142 | 0.002 | 37.349 | 55.204 | 16.42 |
| Total | 216.083 | 339.364 | 368.162 | 11.932 | 2.725 | 47.418 | 985.684 | |
| Corresponding land use/cover type | Land use/cover type (1980-1990) | Land use/cover type (1990-2000) | ||||||||||
|---|---|---|---|---|---|---|---|---|---|---|---|---|
| CL− | WL+ | GL+ | WB− | BUL− | UL− | CL+ | WL− | GL− | WB+ | BUL+ | UL+ | |
| CL | 116.7 | 19.1 | 13.0 | 80.3 | 0.2 | 127.5 | 13.8 | 20.6 | 89.6 | 0 | ||
| WL | 73.7 | 6.4 | 3.8 | 5.8 | 3.5 | 122.9 | 10.1 | 5.4 | 4.9 | 1.4 | ||
| GL | 68.7 | -36.4 | 45.8 | 12.4 | 108.7 | 49.4 | -37.4 | 12.9 | 5.8 | 114.8 | ||
| WB | -9.0 | 4.2 | 8.8 | 1.4 | -12.4 | -12.4 | 3.3 | 2.2 | -0.3 | -16.2 | ||
| BUL | -33.1 | 3.8 | 1.4 | -0.9 | 0 | -59.9 | 3.4 | 1.1 | 0.3 | 0 | ||
| UL | -0.4 | 11.7 | 64.3 | 38.2 | 0 | -0.1 | 3.2 | 72.8 | 60.8 | 0 | ||
© 2008 by the authors; licensee Molecular Diversity Preservation International, Basel, Switzerland. This article is an open access article distributed under the terms and conditions of the Creative Commons Attribution license (http://creativecommons.org/licenses/by/3.0/).
Share and Cite
Wu, X.; Shen, Z.; Liu, R.; Ding, X. Land Use/Cover Dynamics in Response to Changes in Environmental and Socio-Political Forces in the Upper Reaches of Yangtze River, China. Sensors 2008, 8, 8104-8122. https://doi.org/10.3390/s8128104
Wu X, Shen Z, Liu R, Ding X. Land Use/Cover Dynamics in Response to Changes in Environmental and Socio-Political Forces in the Upper Reaches of Yangtze River, China. Sensors. 2008; 8(12):8104-8122. https://doi.org/10.3390/s8128104
Chicago/Turabian StyleWu, Xing, Zhenyao Shen, Ruimin Liu, and Xiaowen Ding. 2008. "Land Use/Cover Dynamics in Response to Changes in Environmental and Socio-Political Forces in the Upper Reaches of Yangtze River, China" Sensors 8, no. 12: 8104-8122. https://doi.org/10.3390/s8128104