Three-Dimensional Transport Modeling for Proton Exchange Membrane(PEM) Fuel Cell with Micro Parallel Flow Field

Department of Mechanical Engineering, University of Incheon, 177 Dohwa –Dong , Nam-Gu, Incheon, Korea
*
Author to whom correspondence should be addressed.
Sensors 2008, 8(3), 1475-1487; https://doi.org/10.3390/s8031475
Submission received: 30 January 2008
/
Accepted: 27 February 2008
/
Published: 3 March 2008
(This article belongs to the Special Issue Modeling, Testing and Reliability Issues in MEMS Engineering)
Abstract
:Modeling and simulation for heat and mass transport in micro channel are being used extensively in researches and industrial applications to gain better understanding of the fundamental processes and to optimize fuel cell designs before building a prototype for engineering application. In this study, we used a single-phase, fully three dimensional simulation model for PEMFC that can deal with both anode and cathode flow field for examining the micro flow channel with electrochemical reaction. The results show that hydrogen and oxygen were solely supplied to the membrane by diffusion mechanism rather than convection transport, and the higher pressure drop at cathode side is thought to be caused by higher flow rate of oxygen at cathode. And it is found that the amount of water in cathode channel was determined by water formation due to electrochemical reaction plus electro-osmotic mass flux directing toward the cathode side. And it is very important to model the back diffusion and electro-osmotic mass flux accurately since the two flux was closely correlated each other and greatly influenced for determination of ionic conductivity of the membrane which directly affects the performance of fuel cell.
1. Introduction
PEMFC (Proton Exchange Membrane Fuel Cell) using very thin polymer membrane has been considered as a promising candidate of future power sources for transportation application and residential power. This type of fuel cell has many advantages such as high efficiency, clean, quiet, low temperature operation, and quick startup capability. However its performance and durability under harsh environments and high cost should be optimized to be competitive to conventional combustion power plants[1-3].
Typical schematics of a Proton Exchange Membrane Fuel Cell (PEMFC) is shown in Figure 1-(a) The cell is a sandwich of two graphite bipolar plate with micro flow channels separated by MEA(Membrane Electrode Assembly) which consists of a membrane and two electrodes with dispersed Pt catalyst. The gas diffusion layer (GDL) is porous to supply reactants to the electrodes at unexposed areas of micro flow channel [4].
As shown Figure 1-(b), the typical micro serpentine bipolar flow plates in fuel cells contain many micro flow channels that distribute the reactant gas flow over the catalytic reactive surface. The shape, size and pattern of the micro flow channels were known to greatly affect the fuel cell performance.
Modeling and simulation of the heat and mass transport in micro channel are being used extensively in researches and industrial applications to gain better understanding of the fundamental processes of fuel cell and to optimize fuel cell designs before building a prototype for engineering application.
The first application of CFD (Computational Fluid Dynamic method) to PEMFC focused on one dimensional model by Bernard and Verbrugge[5-6] and Springer[7], who presented several important principles related to the electrochemical reaction process in fuel cell. Recently, a two dimensional model emphasizing the effects of two-phase water and heat transport was developed by Fuller and Newman[8], Nguyen and White[9] and Gurau and Liu[10]. And numerical models incorporating the coupled effects of electrochemical reaction and mass transport in two or three dimensional domains have been developed by Kumar and Reddy[11], Shimpalee[12], Um and Wang[13].
In this study, we attempt to develop a fully three dimensional computational model for PEMFC which can deal with both anode and cathode micro flow fields. A commercial program FLUENT (version 6.3) was modified using User Defined Function to simulate three dimensional micro flow fields with MEA (Membrane Electrode Assembly), which consists of membrane and two electrode with dispersed Pt catalyst. The pressure drops and concentration distributions of reactants and product along the micro channel, water transport though MEA and channel, and current-voltage performance of the fuel cell were calculated through the three dimensional numerical simulation in this study.
2. Numerical Models
2.1 Model assumptions
Governing equations for calculating the fully three dimensional flow field are expressed under following assumptions.
- 1)
- The gas mixture is incompressible, ideal fluid
- 2)
- The flow in the flow channel is laminar
- 3)
- Isothermal condition
- 4)
- Butler - Volmer kinetics for electrochemical reaction rate
2.2 Governing equation
1) Mass conservation equation
where ε is the porosity of the porous media, which is equal to unit for the gas channels, ρ the density, and u⃑ the intrinsic fluid velocity vector, εu⃑, reflects the superficial velocity in the porous media. Sm denotes source terms corresponding to the consumption of hydrogen and oxygen in the anode and cathode, and the production of water in the cathode.
2) Momentum conservation equation
The fluid flow in the fuel cell can be described by the general equation as:
where ρ denotes the pressure, μ the effective viscous coefficient. Because the fluid flowing in the channels, gas diffusion layers and catalyst layer, membrane is different μ stand for gas viscous coefficient for gas mixture in the channel and gas diffusion layer, and liquid viscous coefficient for liquid in the catalyst layer and membrane. Furthermore, mass-weighted mixing law gives viscosity of the gaseous mixture. The source terms in the momentum equations are added based on the Darcy's law, representing an extra drag force in the equation as follows:
3) Species conservation equation
The species conservation equation for the gas mixture is
Here, k denotes chemical species that include hydrogen, oxygen, nitrogen and water.
is the effective diffusion coefficient. Source term Sk denotes,
where MH2, MH2O and MO2 are the molecular weight of hydrogen, water and oxygen.
2.3 Water transport equation
Water management is a critical issue for the performance of a proton electrolyte membrane fuel cell. The transport phenomena of water can be described as follows: the water molecules are transported through the polymer electrolyte membrane by the hydrogen protons and this process is called electro-osmotic drag. In addition to the molecular diffusion and electro-osmotic drag, water is generated in the cathode catalyst layer due to electrochemical reaction.
1) Electro-osmotic drag flux
Electro-osmotic water flux through the membrane can be calculated from the proton flux through the membrane, given by the specified current density and Faraday law
where nd is Electro-osmotic drag coefficient which depends on water activity as follows.
where λ represents water contend of the membrane described as,
where aK, water activity, is expressed as
where X,K, Psat are water mole fraction and saturation pressure at each electrode respectively.
2) Back diffusion flux
The water formation at the cathode results in a gradient in the water content between the cathode side and anode side of the membrane. For PEMFC, this gradient causes a water flux back to anode side which is superimposed to the electro-osmotic flux. This back diffusion is expressed as following water flux,
where ρm,dry is the dry density of electrolyte, Mm,dry is the electrolyte equivalent weight, and z is the direction through the membrane thickness.
Dw is water diffusion coefficient which is strongly1 dependent on water, content as follows,
3) Current density and membrane ion Conductivity
I(x,y,z) is current density generated by electrochemical reaction, which can be expressed,
where σm(x,y,z) indicates the ion conductivity of membrane expressed as,
2.4 Numerical algorithm
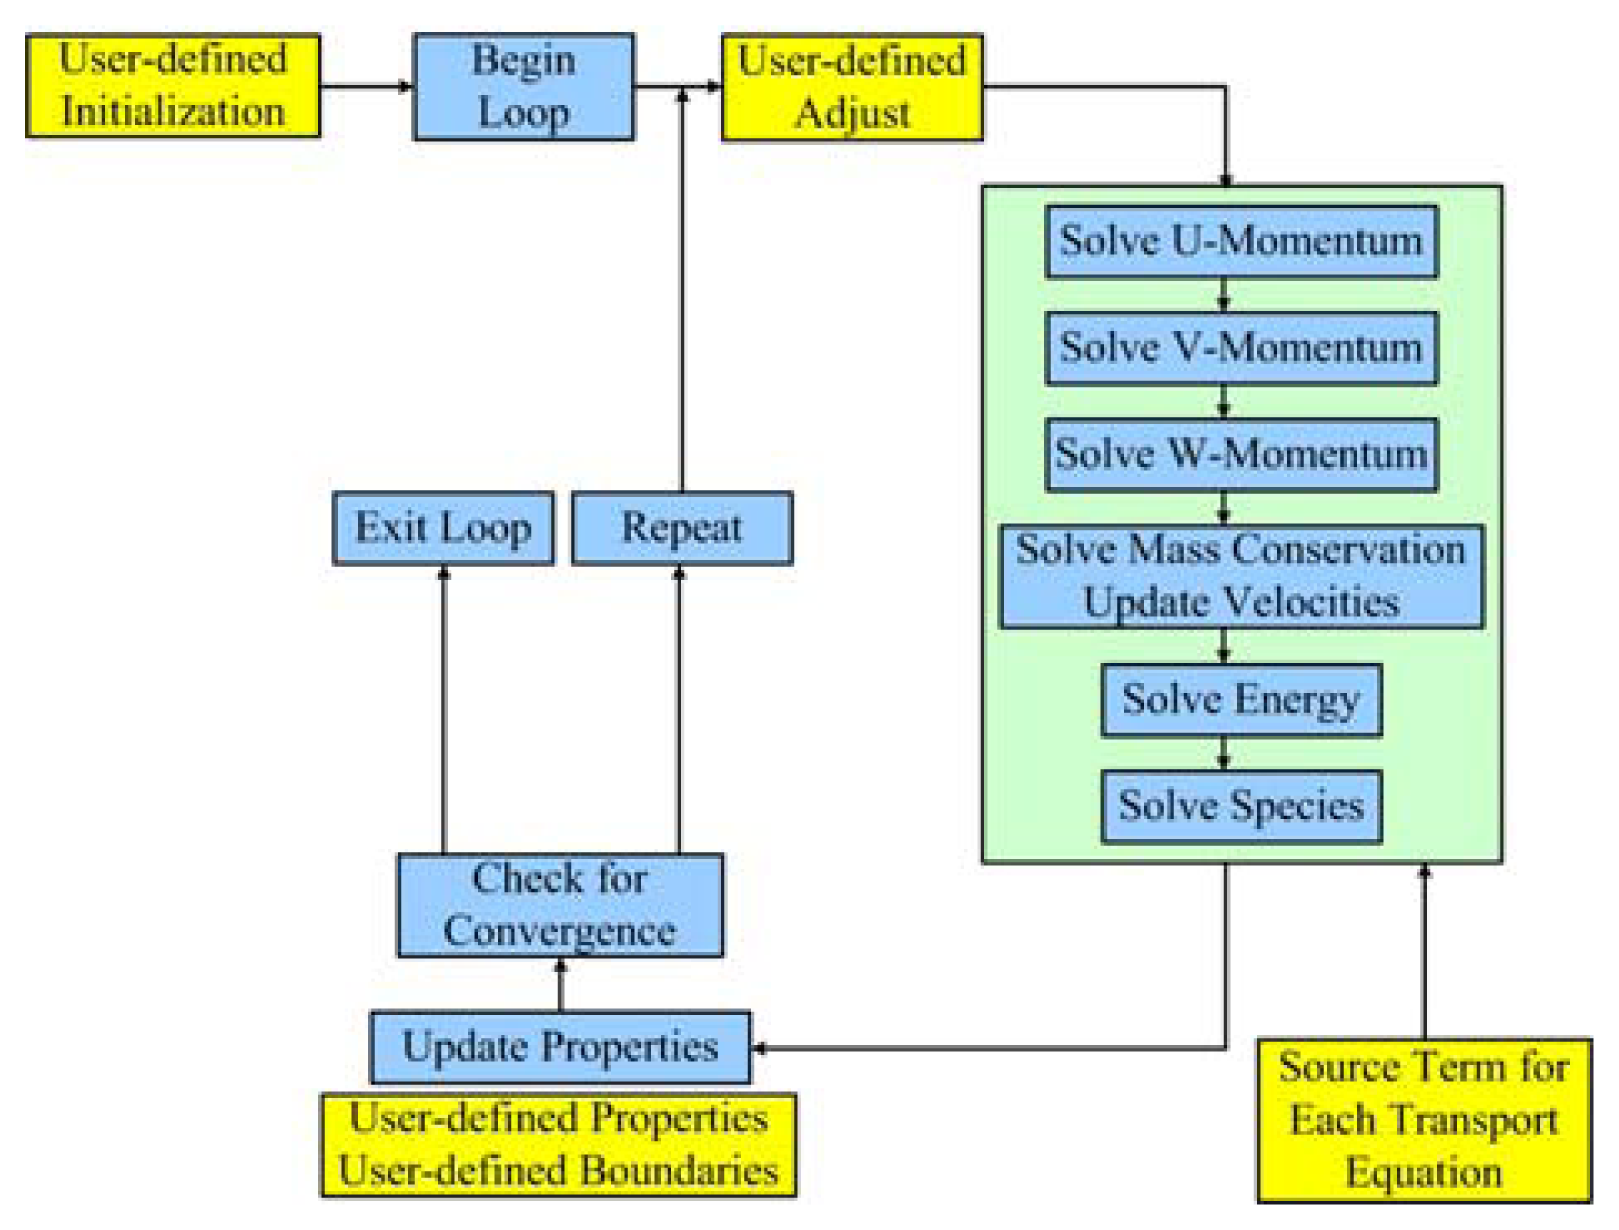
The numerical simulation model is based on SIMPLE (semi-implicit method for pressure linked equations consistent) algorithm using Segregated solver of Fluent® (version 6.3). Uniform flow velocity and reactant concentration at the inlet are given as the initial condition. Source terms generated by the electrochemical reaction are inserted into mass and species conservation equation using the User Define Function (UDF). The coupled set of equations was solved iteratively until the relative error in each field reached a specific convergent standard (usually 10−9). The flow diagram for this numerical algorithm is represented in Figure 2.
2.5 Numerical simulation model
The schematics of the parallel micro flow channel with GDL and catalyst layer is shown in Figure 3. The cross sectional area at inlet of flow channel is 762×762(μm) and its length is 40(mm). And the thickness of gas diffusion layer and catalyst layer are set to 254(μm) and 28.7(μm) respectively.
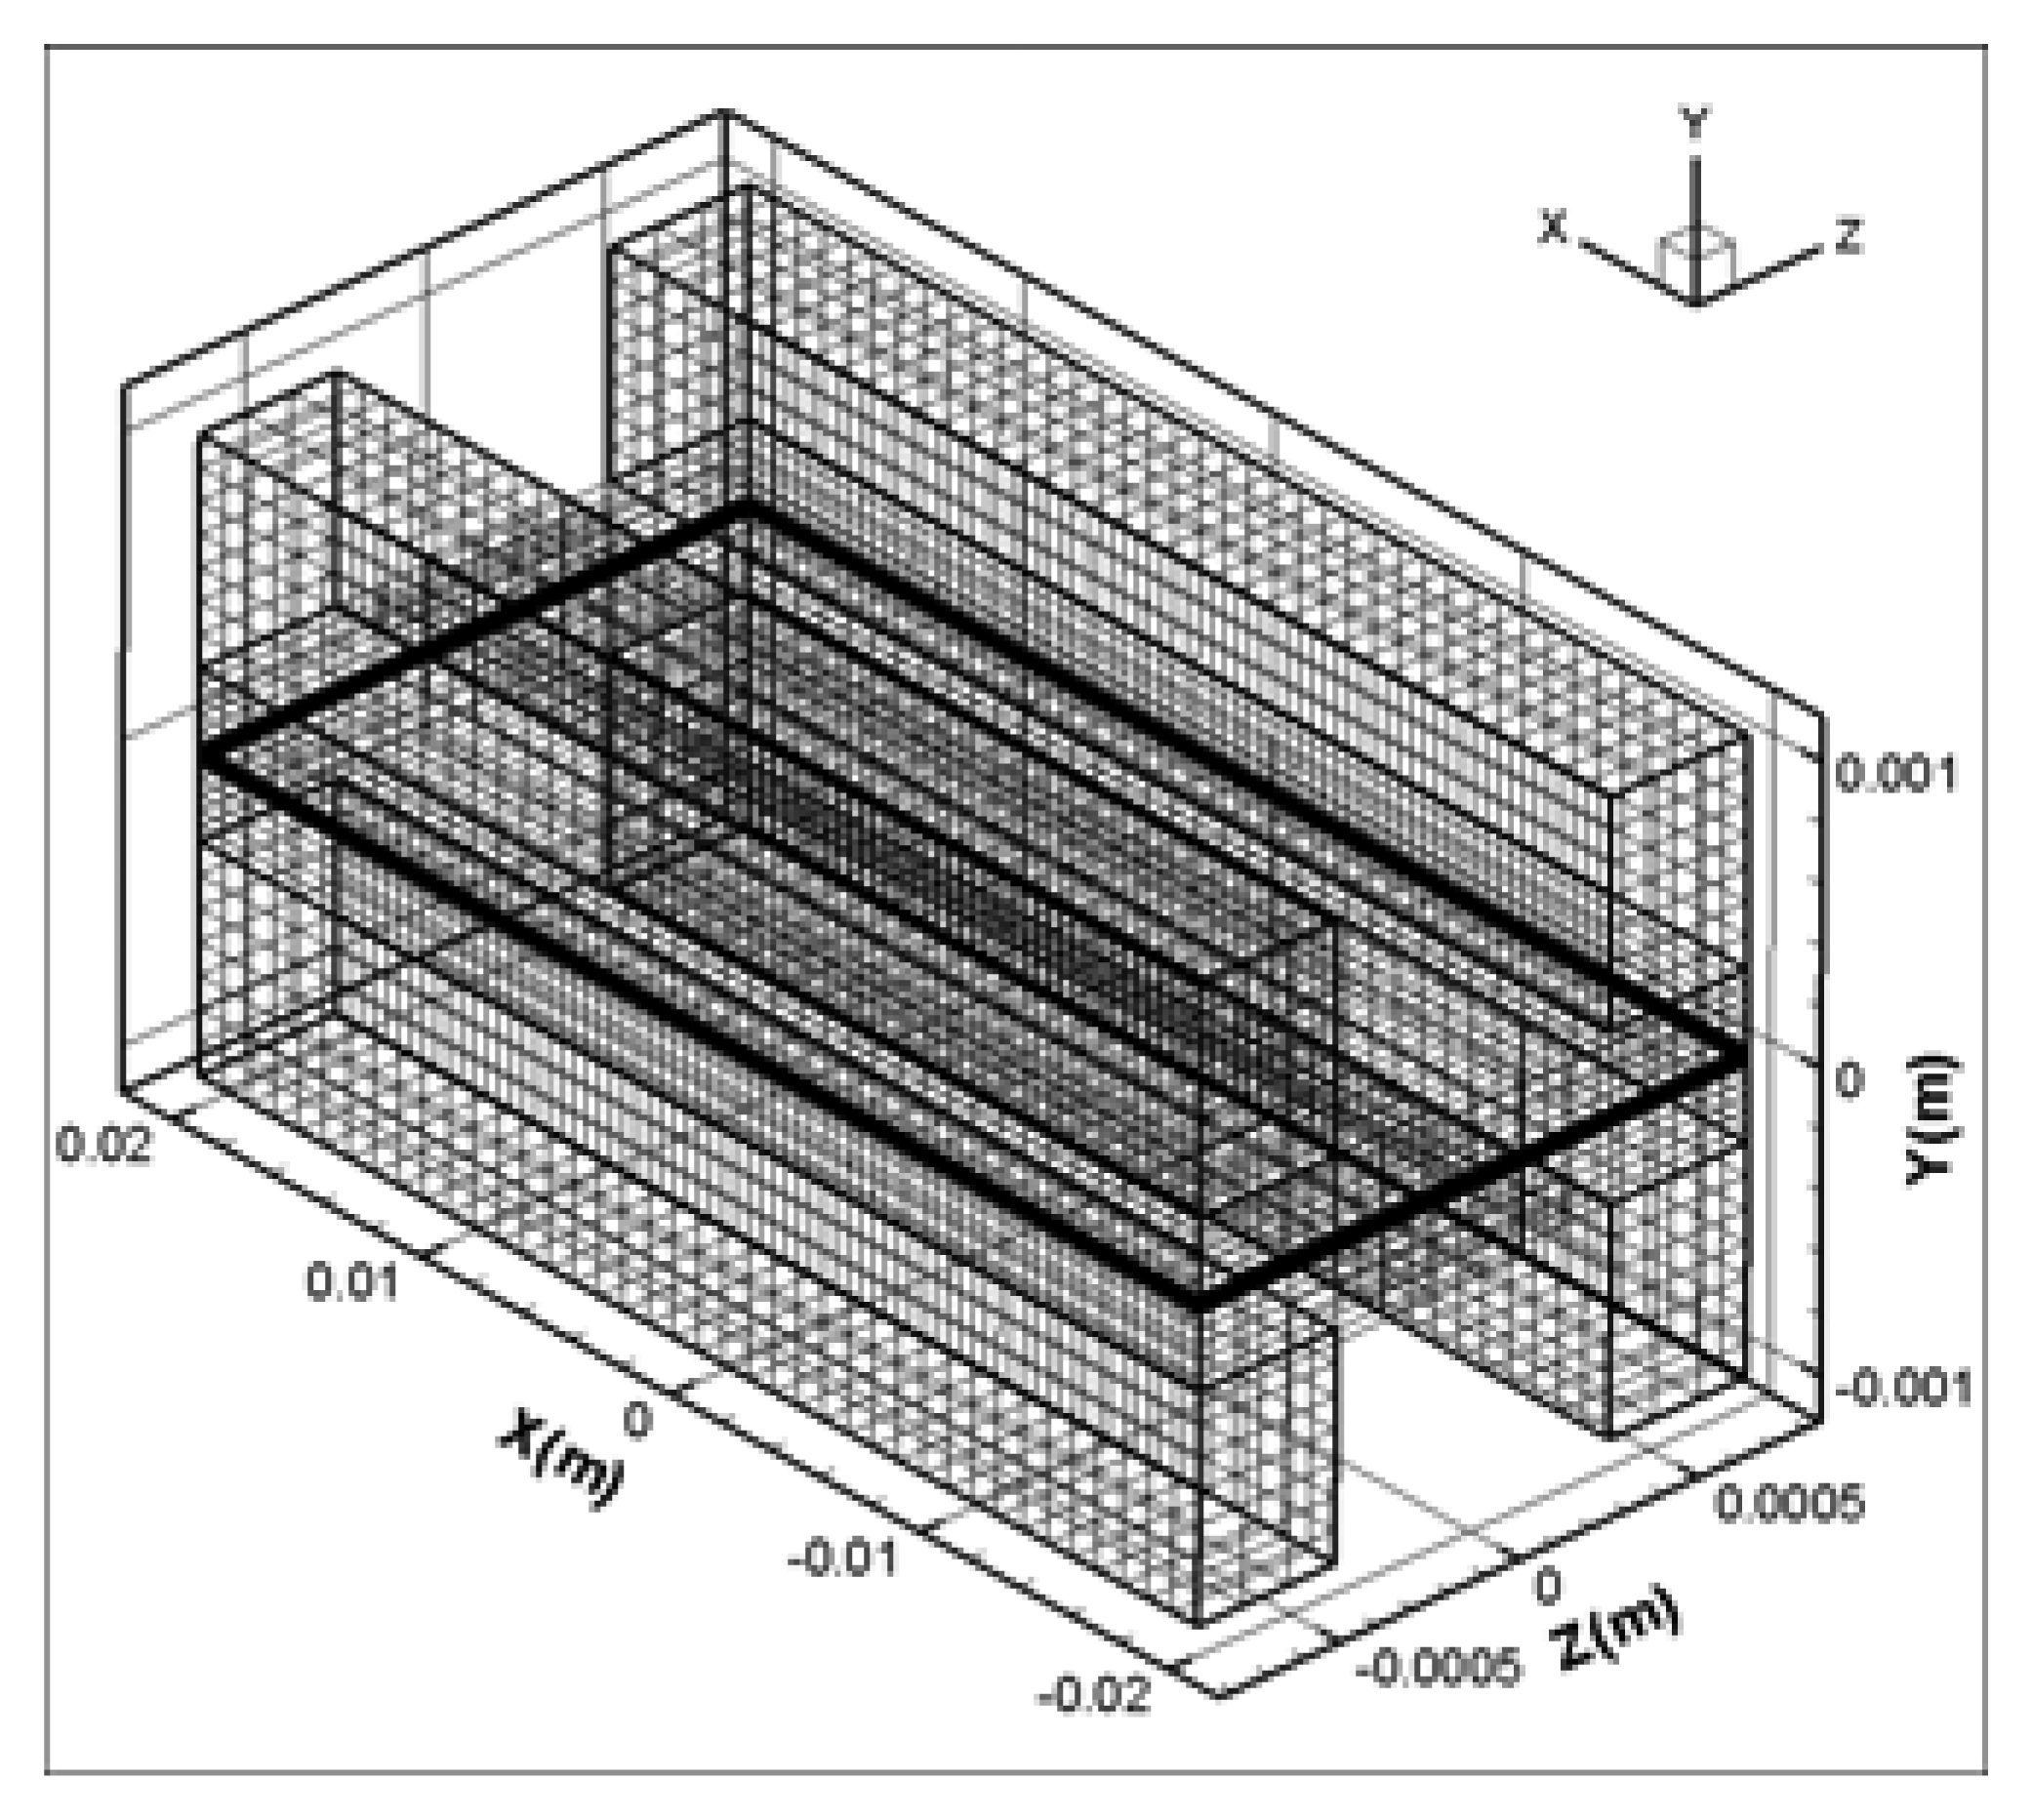
The computational mesh structure which is divided into 40×50×24 (total mesh number is 48,000) is presented in Figure 4,. Boundary conditions are set as follows: constant mass flow rate at the inlet and constant pressure condition. Table 1 provides the physical parameters necessary for a numerical calculation.
3. Discussions
To validate the numerical simulation model used in this study, the performance curves of voltage and current density compared with the experimental data of the fuel cell with a serpentine flow channel under the same conditions in Figure 5. The computed polarization curve is in favorable agreement with the experimental polarization curve [14]. But at high current density, the discrepancy between the computational results and experimental data is a little large, and the model always over predicted the current density. In the high current density region, the low current density of the experimental results may be caused by the presence of liquid water in the catalyst layers and the gas diffusion layers. Due to the presence of liquid water, the effective porosity of the gas diffusion layers and catalyst layers decreased, and the mass transfer resistance increased. Since the current model neglected the above two-phase effect, the predicted current density at high current density was always higher than the experimental density. But the comparison of relative performance of the fuel cell with different flow configurations using single phase model may give the data necessary to design of the flow channel.
Using this numerical simulation model and conditions listed in Table 1, calculations were carried out to examine parallel micro flow fields.
It is very important to know how reactants are transported into the membrane. Figure 6 shows the velocity vectors of hydrogen and oxygen at the anode and cathode sides of flow channel at the operation condition of 0.5V. These velocity vectors indicated the mass transport at each section of the fuel cell very well. Figure 6 shows that almost all velocity vectors are directed to the membrane side in the Y direction, which meant that hydrogen and oxygen were supplied to the membrane by the diffusion mechanism. And the velocity vector pattern was symmetric pattern to the Y axis center line of flow field.
Parasite loss such as pressure drop in micro flow channel should be reduced in order for a fuel cell to produce optimum performance. Figure 7 presents the pressure distribution along the parallel flow channel at the condition of 0.5V. Pressure drop of 11 Pa at the anode and 22.5 Pa at the cathode flow channel were obtained from calculation. The higher pressure drop at the cathode side than that at the anode side is thought to be caused by the higher flow rate of oxygen at the cathode.
Oxygen, water concentration, current density band activation over potential at the catalyst layer surface is presented in Figure 8 for two different cell voltages. The figure shows that oxygen, current density and over potential are high at the entrance of flow channel and then decrease along the channel due to electrochemical reaction as shown in Figure 8-(a), (c), (d). On the other hand, water concentration exhibits the gradual increase along the channel length as presented in Figure 8-(b).
The contour of current density is found to correlate with oxygen and activation over potential contour [15]. The current density is maximum on the land areas, but the oxygen concentration maxima appears at the flow channel area. And the maxima of current density on the land area was attributed to the higher ohmic loss on the flow channel area due to the longer electron path on the flow area than that on the land area.
Average value of current density is higher for low cell voltage that that for high cell voltage as shown in Figure 8-(d). In a lower voltage region, the spatial gradient of the local current density varied much more than that for the high voltage.
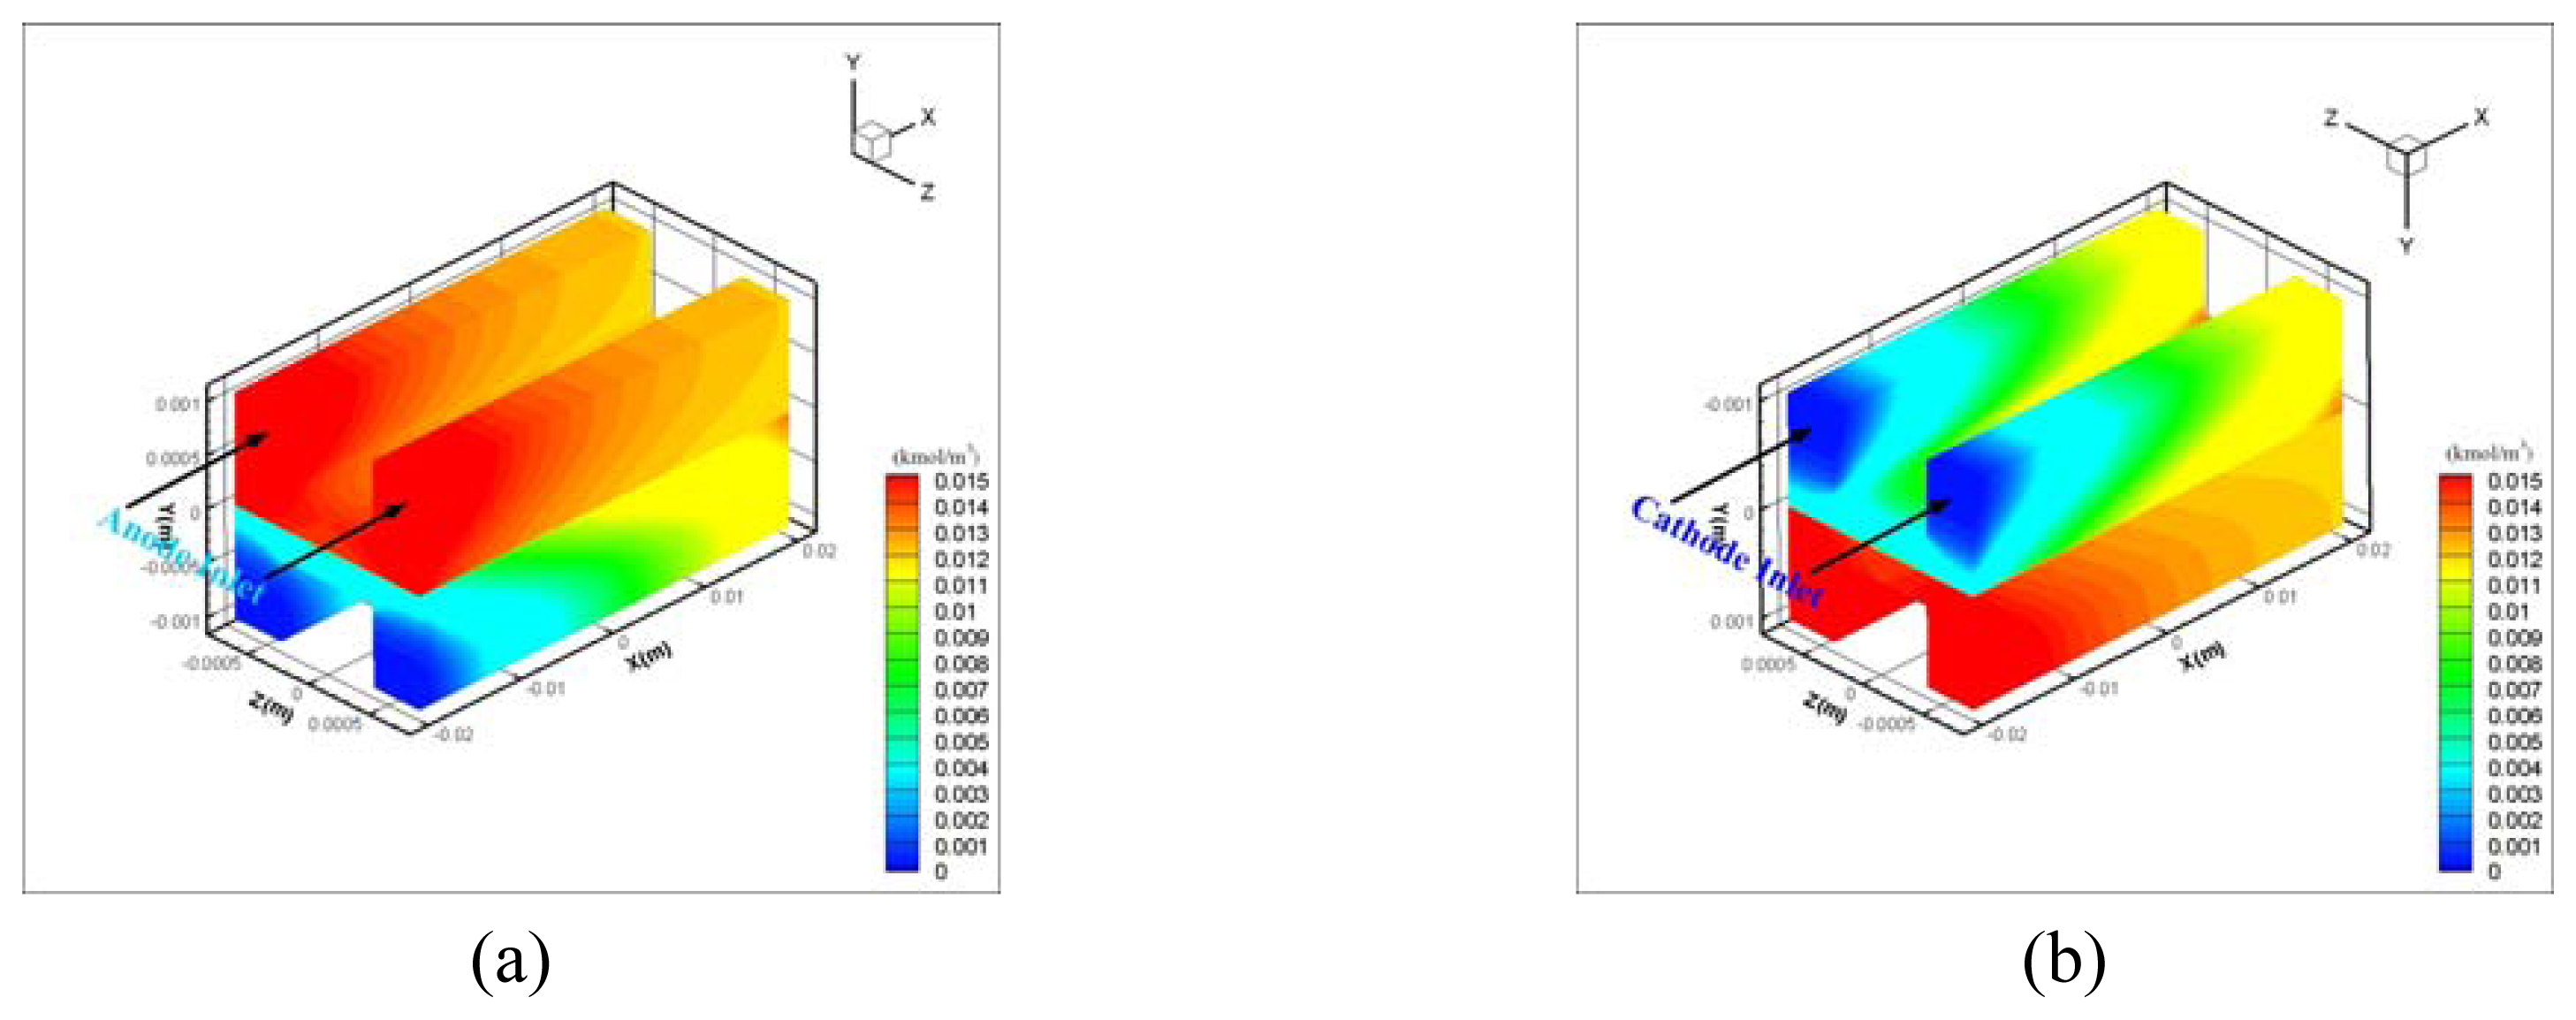
It is very important to know the water transport along the cathode and anode channel since the water concentration is closely associated with the ionic conductivity of the membrane. Figure 9 shows three dimensional contour of the molar concentration of water at each channel.
In Figure 9-(a) showing the water distribution at the fully humidified anode side, the water concentration decreased along the flow channel. This decrease of water concentration along the anode channel was caused by electro-osmotic drag directing from the anode to the cathode. But water concentration at the cathode channel increased along the flow channel. This increase of water concentration was associated with the fact that the water was formed by electrochemical reaction along the channel and water was transported from anode side by electro-osmotic drag simultaneously
The oxygen concentration along the anode and cathode channels is presented in Figure 10 with water concentration. The oxygen concentration at the cathode decreased along the channel due to oxygen consumption by water formation.
Therefore, the water transport through the membrane is very crucial for simulating the water concentration and determining of water content in the membrane.
Figure 11 presents the electro-osmotic mass flux and back diffusion flux across the membrane along each channel. The net flux across the membrane is expressed by the following equation
It is found that the water molecules at the inlet of the anode channel are transported mostly to the cathode by electro-osmotic drag but the electro-osmotic mass flux decreased along the channel.
As shown the figure, the back diffusion took place at about 30mm away from the inlet and its amount was much smaller than the electro-osmotic mass flux. Therefore the net water mass across the membrane is directed from anode to cathode side.
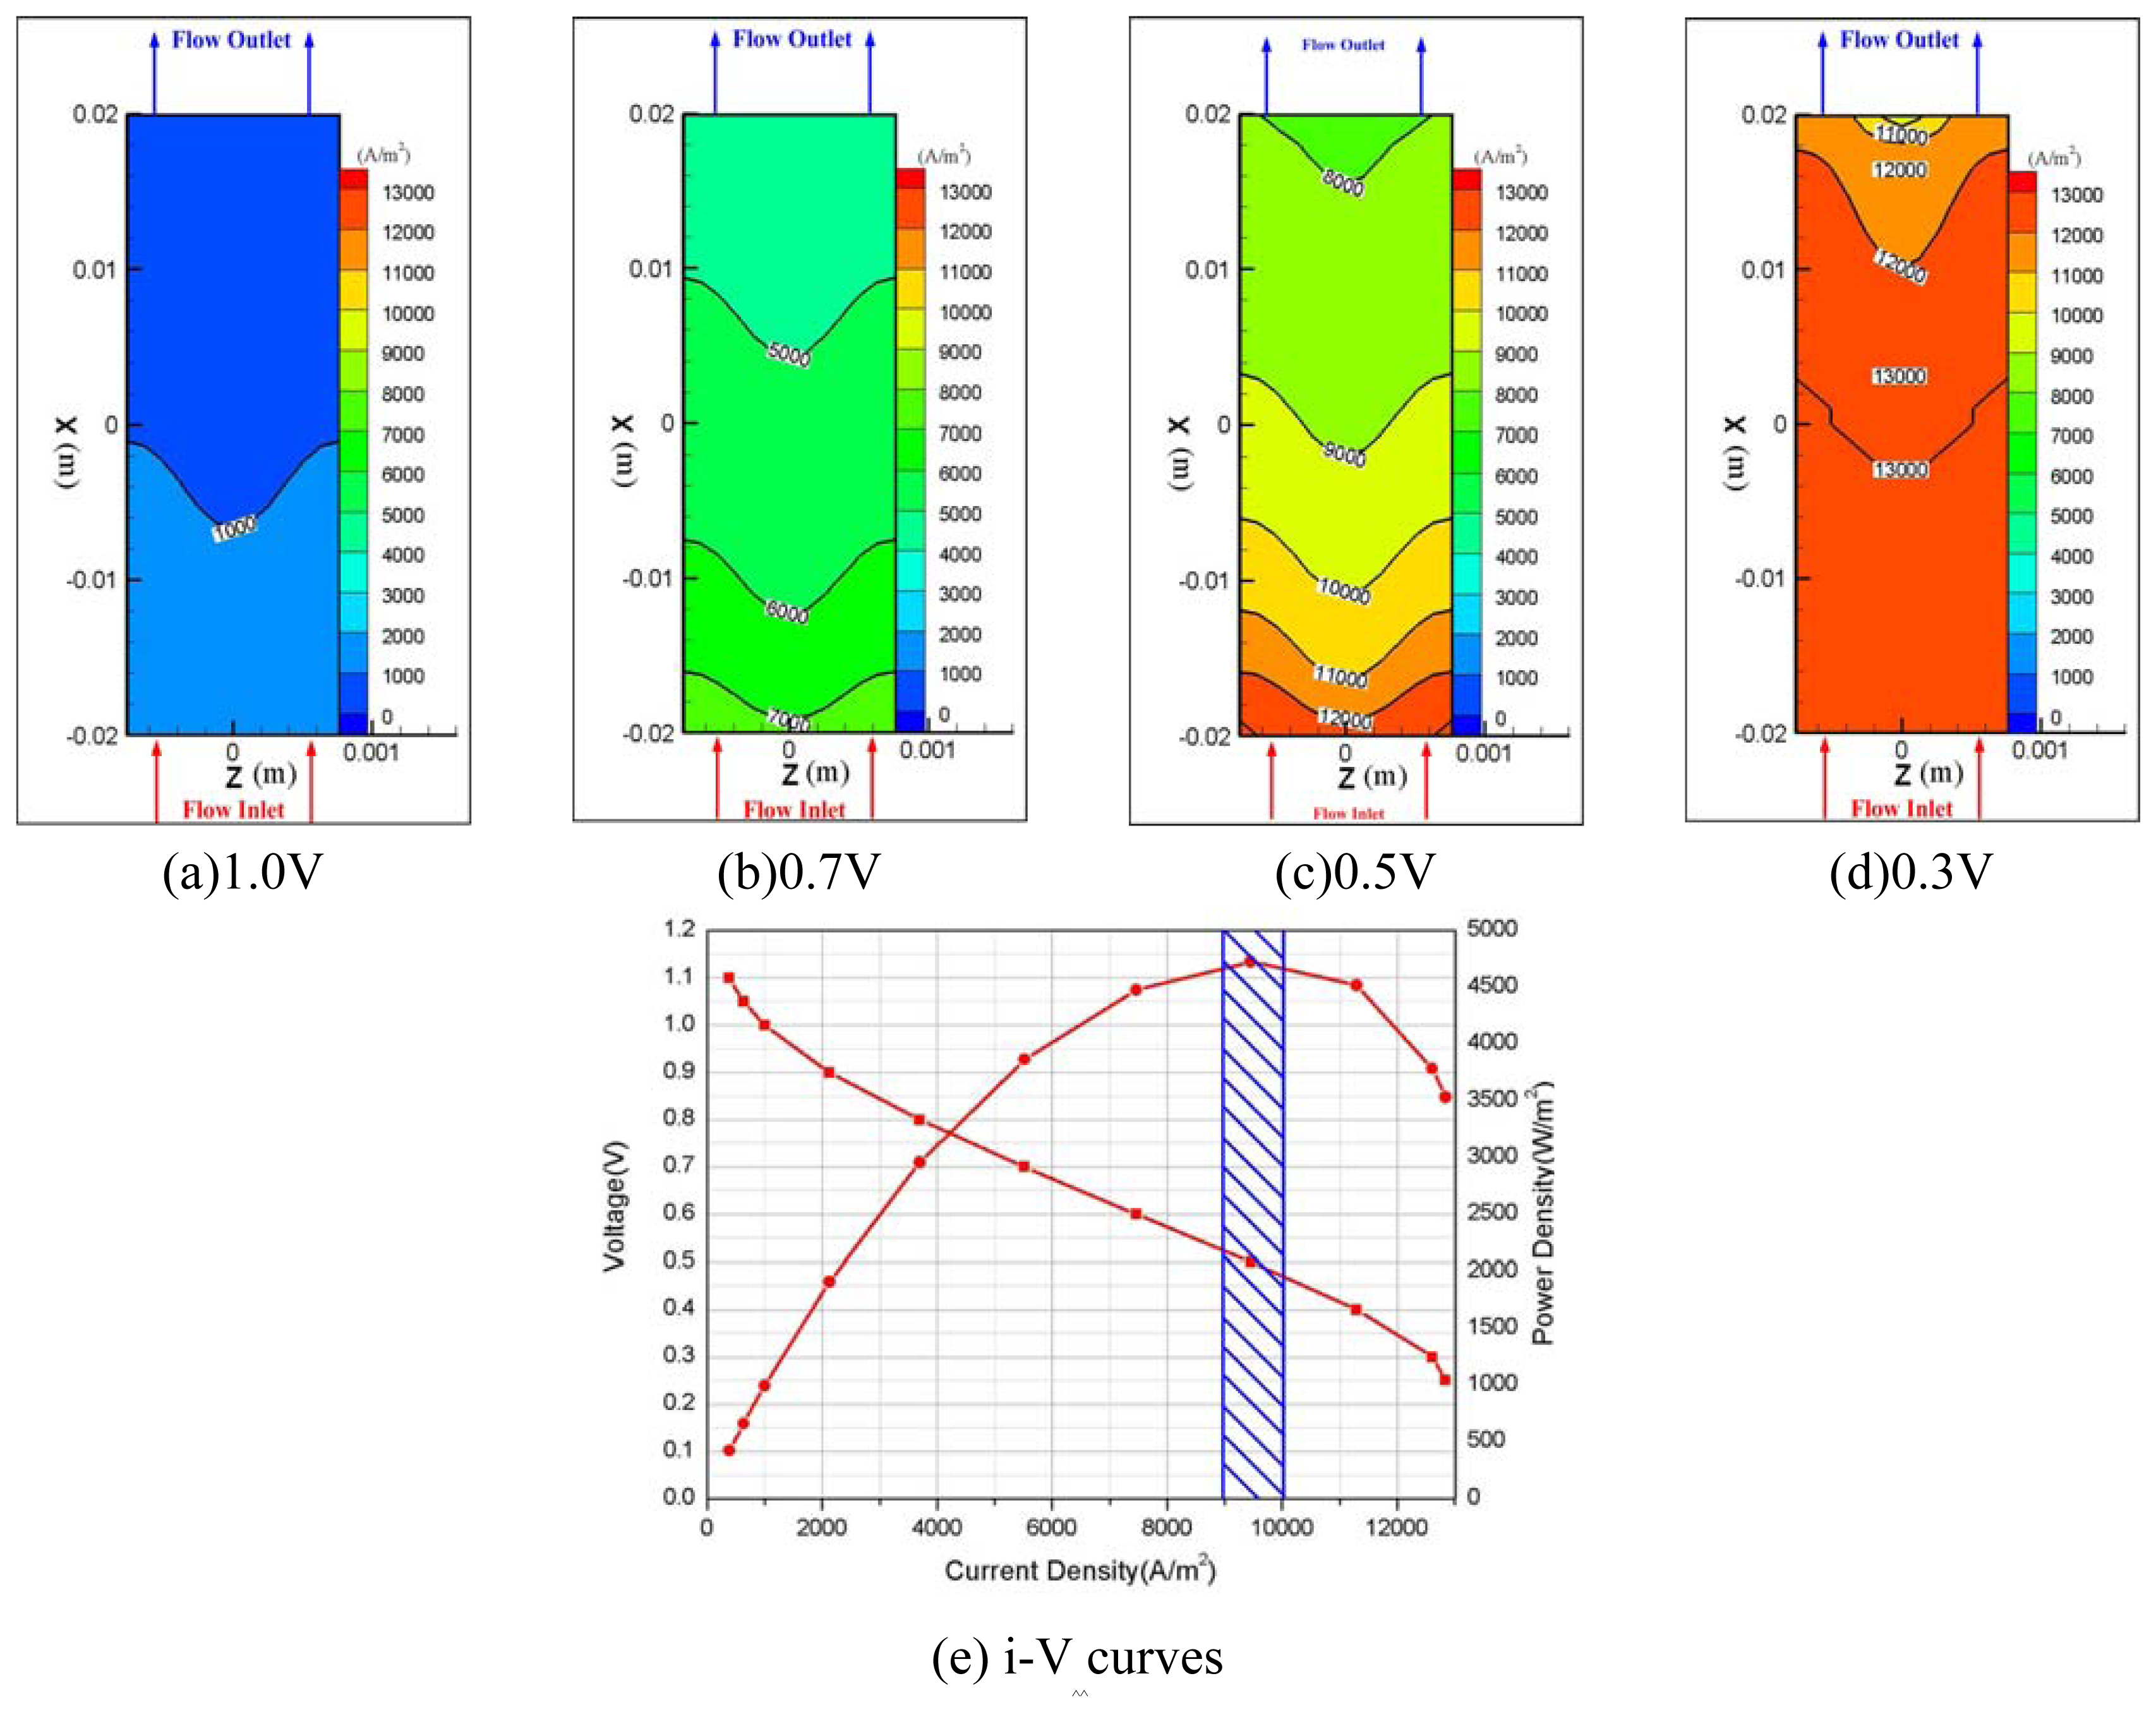
The current density on the catalyst layer is presented in Figure 12. As expected, the current density at 1.0 V in Figure 12-(a) is much smaller than that at 0.3V. The current density at the inlet was the highest and decreased along the channel. The highest value of current density at inlet is probably because of the high concentration of hydrogen and oxygen and high electro-osmotic mass flux at the inlet region.
Figure 12-(e) presents the current density (i) - voltage(V) polarization curve for the fuel cell with parallel micro flow channel. The current density increased with decreasing cell voltage. The voltage for the maximum power density as found to be 0.5V was optimal operation condition for fuel cell in this study.
4. Conclusions
Using a single-phase, fully three dimensional simulation model for PEMFC which can deal with both anode and cathode flow, the following conclusions for PEMFC with parallel micro flow channel were obtained.
- 1)
- Hydrogen and oxygen were supplied to the membrane by diffusion mechanism rather than convection transport. Pressure drop was 11 Pa at anode and 22.5 Pa at the cathode flow channel for 0.5V, and a higher pressure drop at the cathode side is thought to be caused by the higher flow rate of oxygen at the cathode.
- 2)
- The amount of water in cathode channel was determined by the water formation due to the electrochemical reaction plus the electro-osmotic mass flux directing toward the cathode side.
- 3)
- It is very important to model the back diffusion and electro-osmotic mass flux accurately since the two flux were closely correlated with each other and have greatly influenced the determination of ionic conductivity of the membrane, which directly affected the performance of the fuel cell.
- 4)
- Since our model was only a single-phase model, it has some limitations in representing water flooding phenomena properly. However, a comparison of the relative performances of fuel cells with different flow configurations may give the data necessary for designing the micro flow channel.
References
- Kazim, A.; Liu, H.T.; Forges, P. Modeling of performance of PEM fuel cells with conventional and interdigitated flow fields. J. Appl. Electrochem. 1999, 29, 1409–1416. [Google Scholar]
- Nguyen, T. V. Modeling two-phase flow in the porous electrodes of proton exchange membrane fuel cells using the interdigitated flow fields. May 1999.
- Wood, D.L.; Yi, J. S.; Nguyen, T. V. Effect of direct liquid water injection and interdigitated flow field on the performance of proton exchange membrane fuel cells. Electrochem. Acta. 1998, 43, 3795–3809. [Google Scholar]
- Lee, P.H.; Cho, S. A.; Han, S. S.; Hwang, S. S. Performance characteristics of proton exchange membrane fuel cell(PEMFC) with interdigitated flow channel. International J. Automotive Technology. 2007, 8, 761–769. [Google Scholar]
- Bernardi, D.M.; Verbrugge, M. W. Mathematical model of a gas diffusion electrode bonded to polymer electrolyte. AIChE J. 1992, 37, 1151–1163. [Google Scholar]
- Bernardi, D.M.; Verbrugge, M. W. Mathematical model of the solid polymer-electrolyte fuel cell. J. Electrochem. Soc. 1992, 139, 2477–2491. [Google Scholar]
- Springer, T.E.; Zawodzinski, T. A.; Gottesfeld, S. Polymer electrolyte fuel cell model. J. Eletrochem. Soc. 1999, 138, 2334–2342. [Google Scholar]
- Fuller, T.E.; Newman, I. Water thermal management in solid polymer electrolyte fuel cells. J. Eletrochem. Soc. 1998, 146, 1218–1225. [Google Scholar]
- Nguyen, T.V.; White, R. E.; Water, A. Heat management model for proton exchange membrane fuel cells. J. Electrochem. Soc. 1993, 140, 2178–2186. [Google Scholar]
- Gurau, V.; Liu, H.; Kakac, S. Two-dimensional model for proton exchange membrane fuel cells. AIChE J. 1998, 44, 2410–2422. [Google Scholar]
- Kumar, A.; Reddy, R.G. Modeling of polymer electrolyte membrane fuel cell with metal form in the flow-field of the bipolar/end plate. J. Power Sources. 2003, 114, 54–62. [Google Scholar]
- Shimpalee, S.; Dutta, S.; Lee, W. K.; Van Zee, J. W. Effect of humidity on PEM fuel cell performance part II - mumerical simulation. In Proceeding of ASME IMECH, TN, HTD; Nashville, USA, 1999; Volume 364-1, pp. 367–374. [Google Scholar]
- Um, S.; Wang, C.Y. Three-dimensional analysis of transport and electrochemical reactions in polymer electrolyte fuel cells. J. Power Socrces. 2004, 125, 40–51. [Google Scholar]
- Wang, L.; Husar, A.; Zhou, T.; Liu, H. A parametric study of PEM fuel cell performances. International Journal of Hydrogen Energy. 2003, 28, 1263–1272. [Google Scholar]
- Sivertsen, B.R.; Djilali, N. CFD-based modeling of proton exchange membrane fuel cells. J. Power Sources. 2005, 141, 65–78. [Google Scholar]
Figure 1.
Schematics of a fuel cell assembly displaying different essential components of the system (a) and micro serpentine bipolar flow plate (b).
Figure 1.
Schematics of a fuel cell assembly displaying different essential components of the system (a) and micro serpentine bipolar flow plate (b).
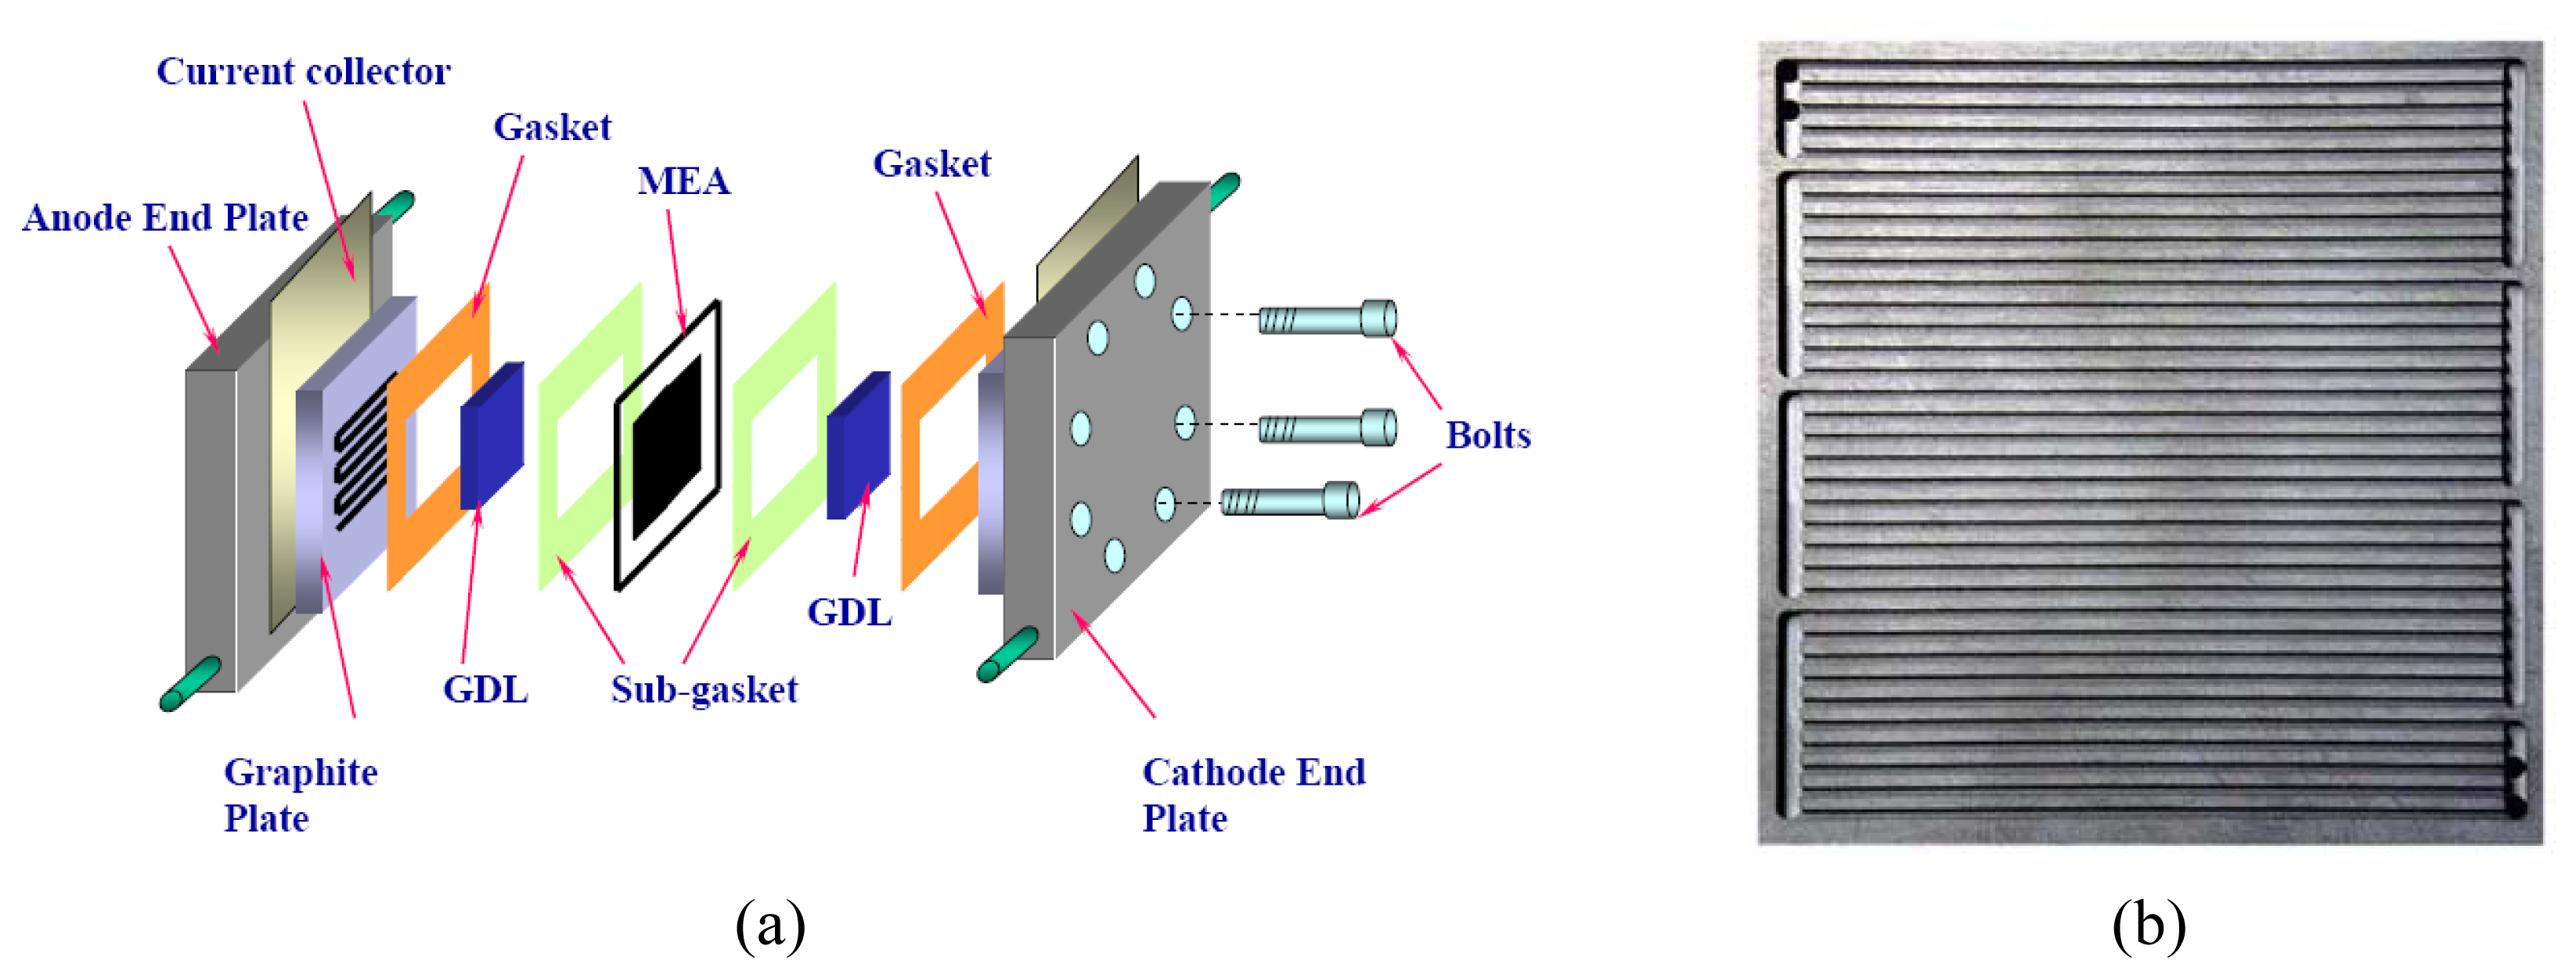
Figure 2.
A flow diagram of the solution procedure.

Figure 3.
Schematic of the parallel micro flow channel structure.
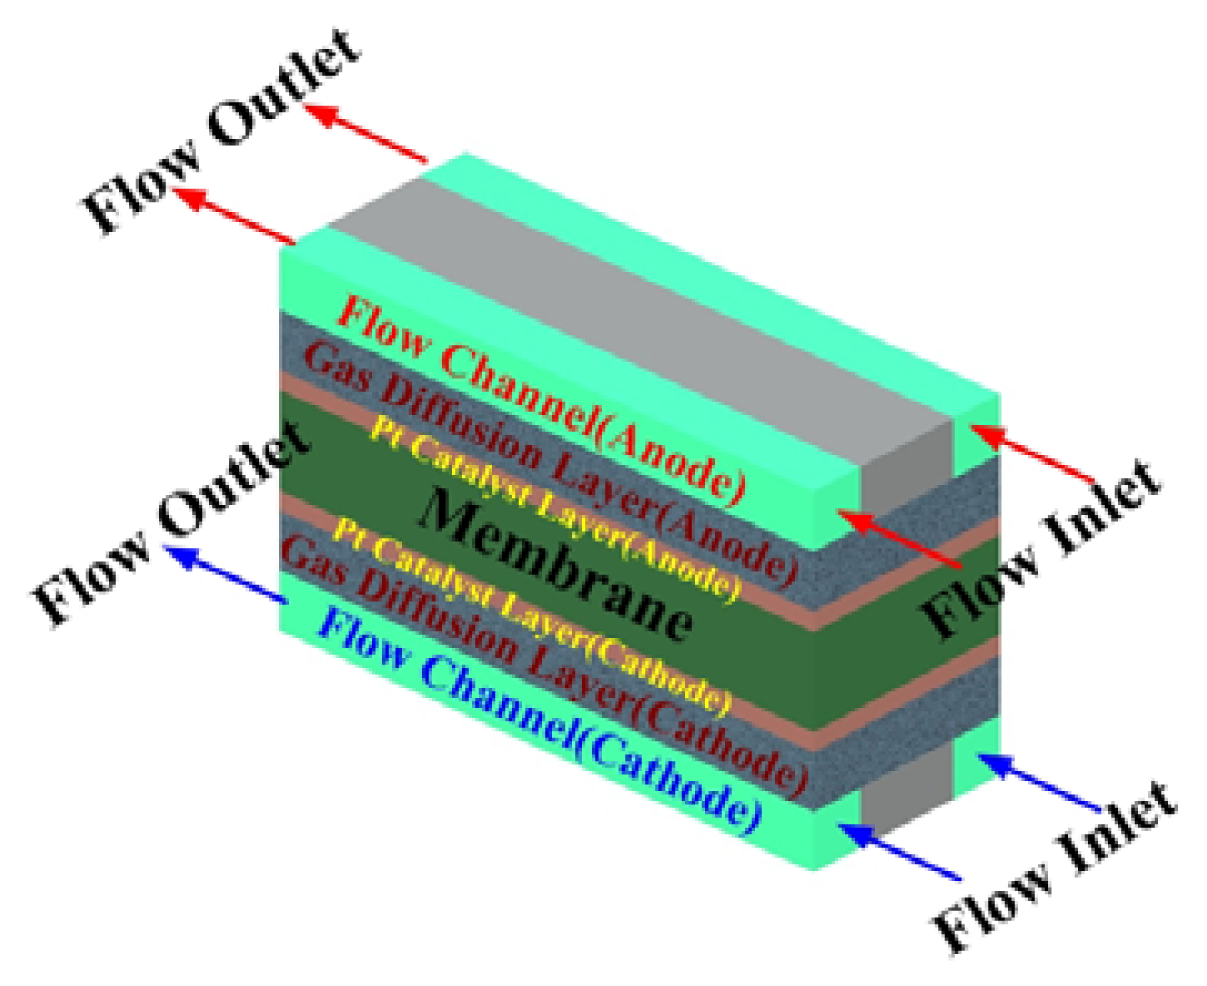
Figure 4.
Computational grids for parallel flow channel.

Figure 5.
Comparison of experimental and simulated polarization curves.

Figure 6.
Two-dimensional velocity field in the parallel micro flow channel at z=L/2.
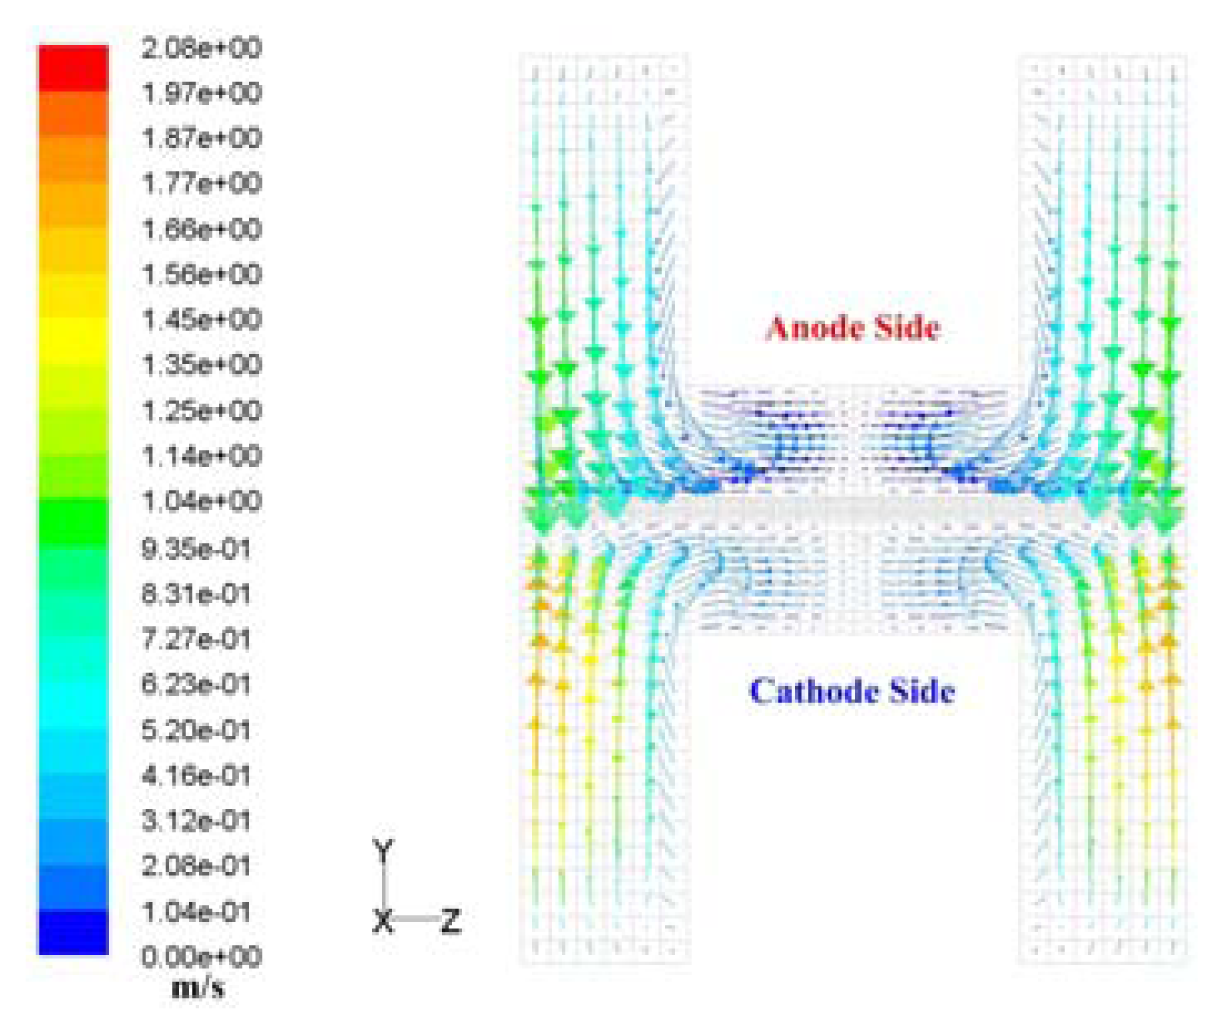
Figure 7.
Three dimensional distribution of pressure drop for parallel micro flow field.
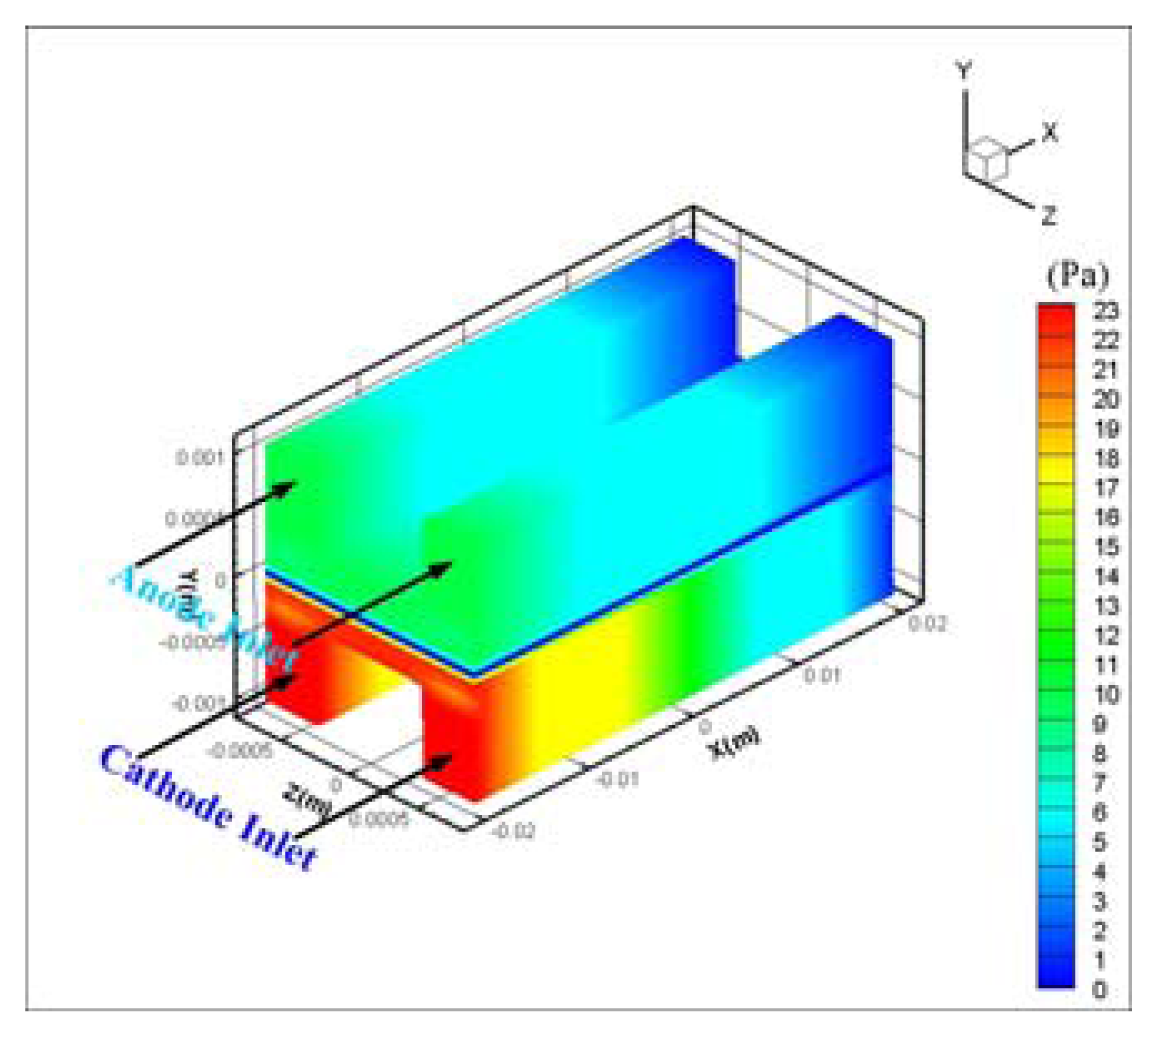
Figure 8.
Contours of oxygen and water concentration, overpotential, current density at the catalyst layer in cathode side.
Figure 8.
Contours of oxygen and water concentration, overpotential, current density at the catalyst layer in cathode side.
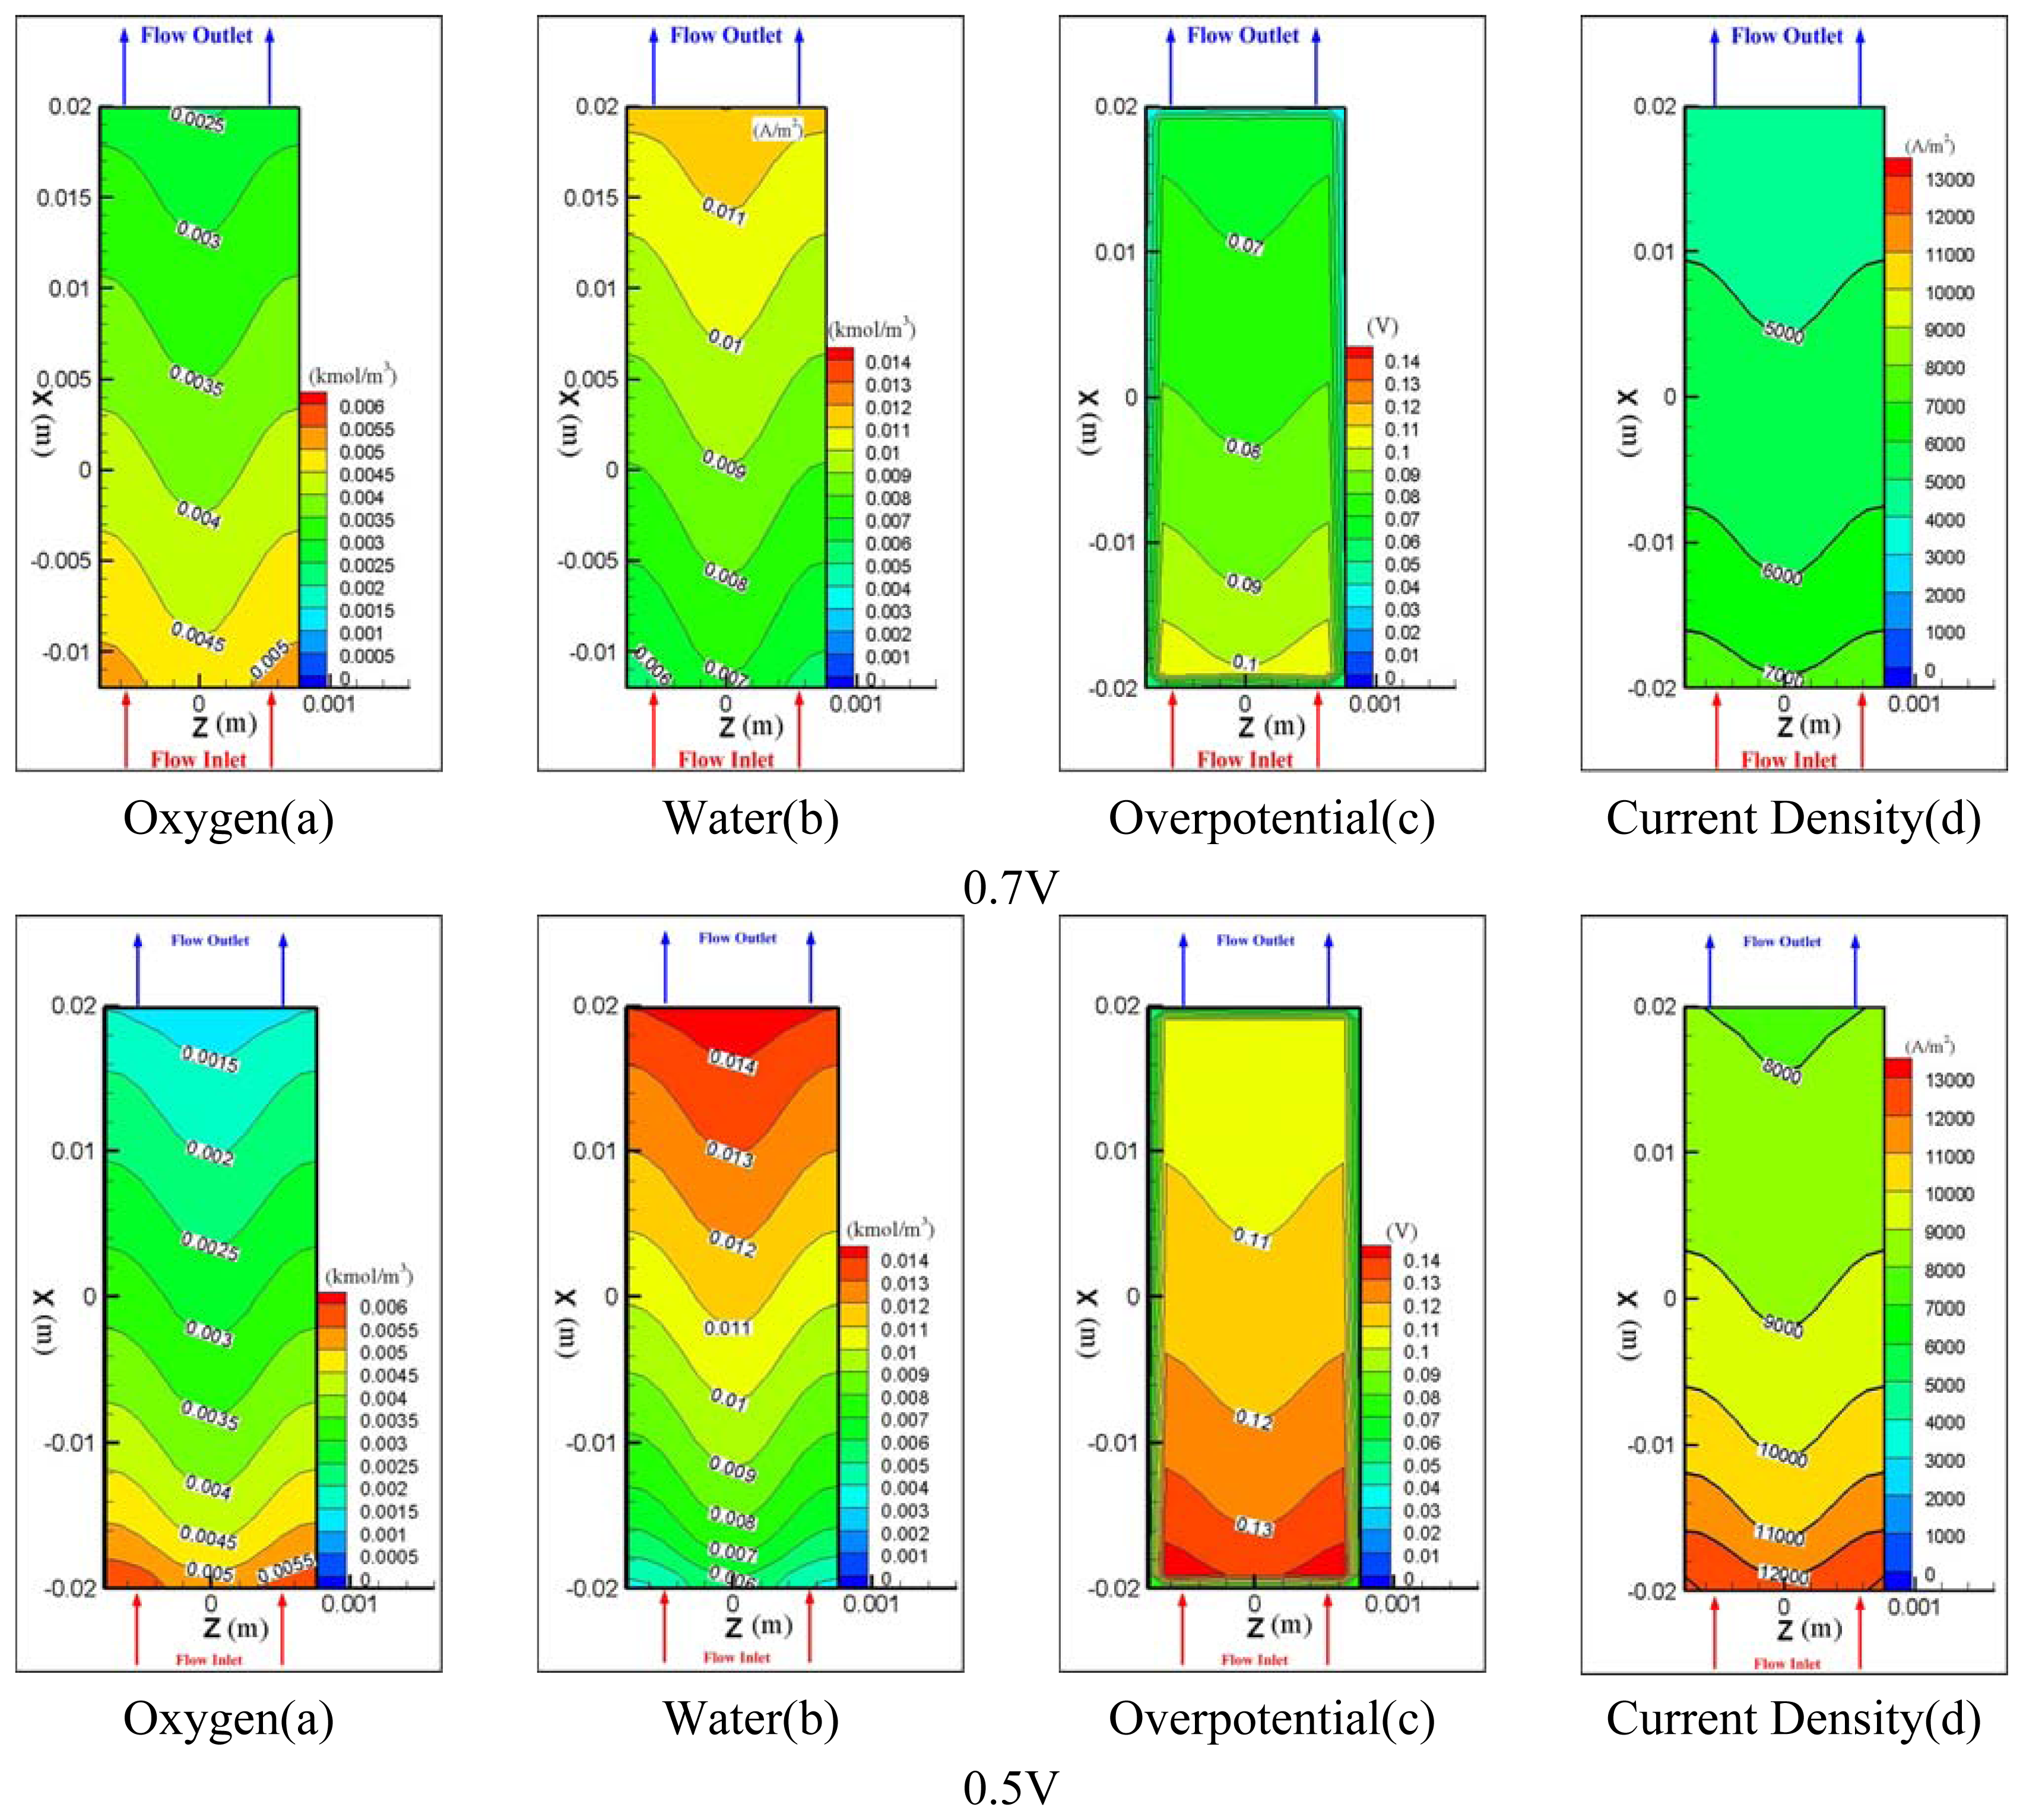
Figure 9.
Three dimensional distribution of moral water concentration at anode side (a) and parallel micro flow field at cathode side (b).
Figure 9.
Three dimensional distribution of moral water concentration at anode side (a) and parallel micro flow field at cathode side (b).

Figure 10.
Oxygen and water concentration at catalyst layer along the channel length.
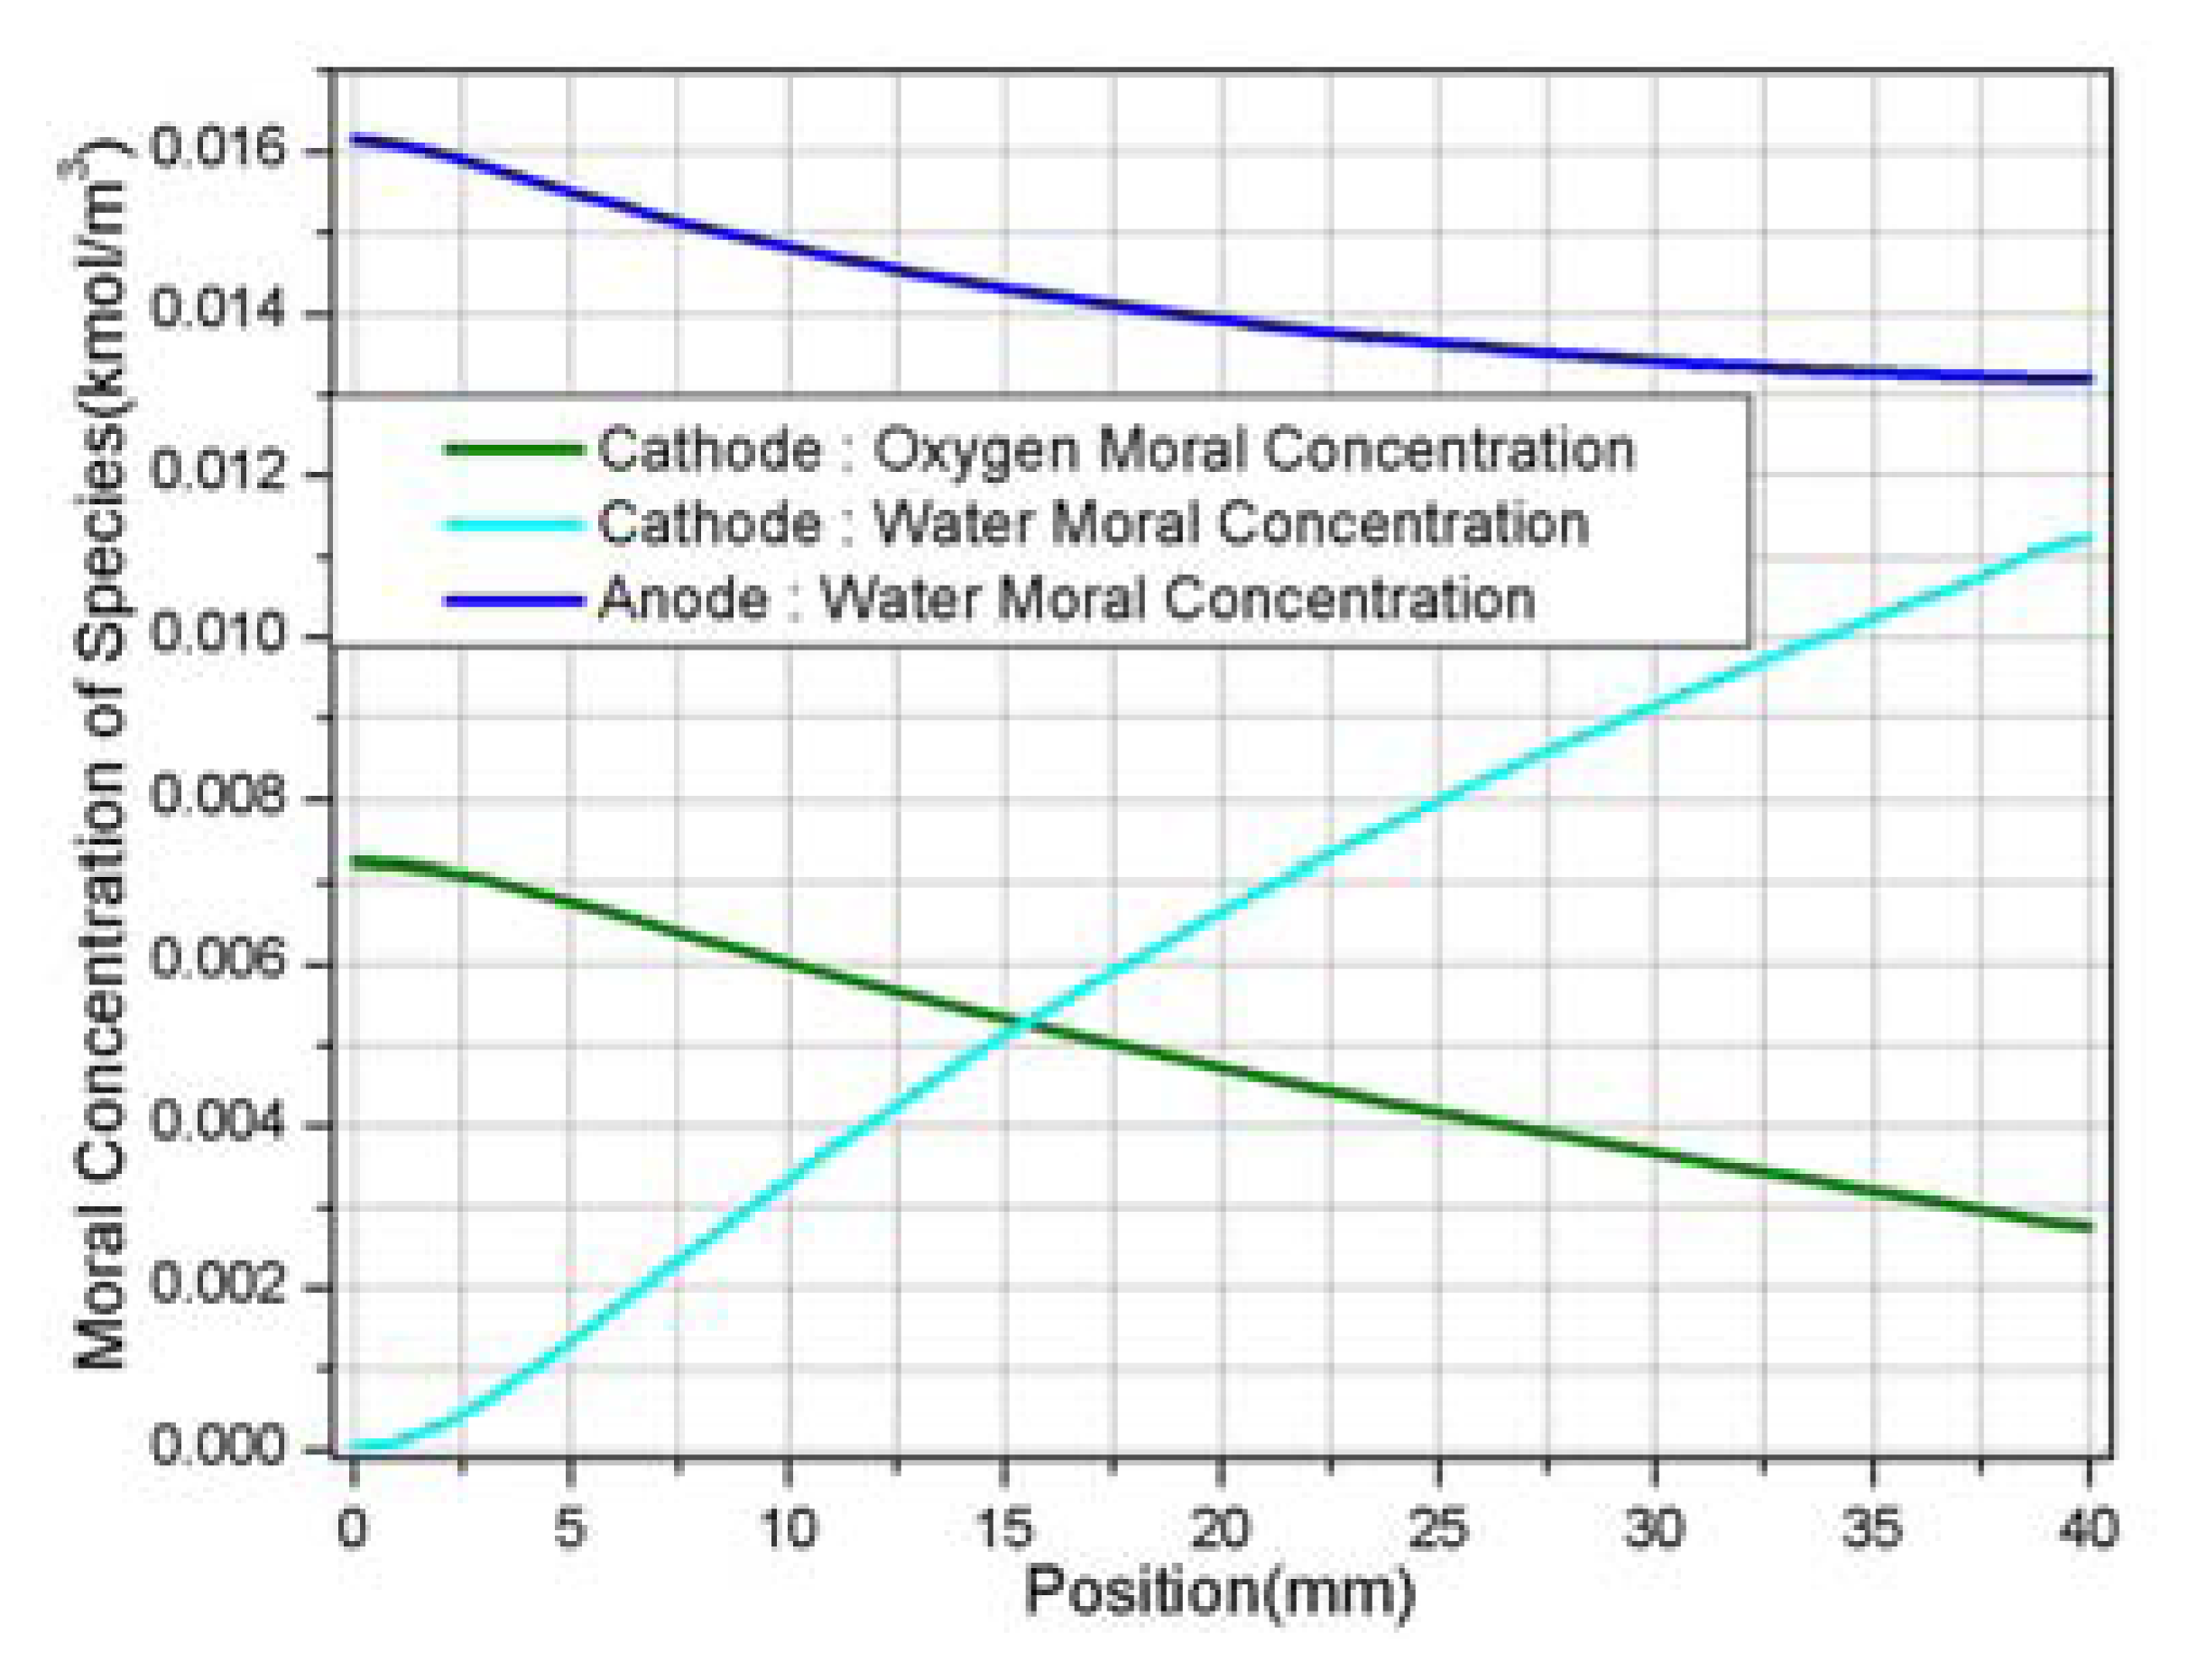
Figure 11.
Comparison of back diffusion flux and electro-osmotic drag flux on the membrane.

Figure 12.
Local current density at different voltage and polarization curves.

| Description | Value | Description | Value |
|---|---|---|---|
| Channel length (mm) | 40 | Cathode side pressure (atm) | 1 |
| Channel width (μm) | 762 | Anode stoichiometric number | 1.5 |
| Channel height (μm) | 762 | Cathode stoichiometric number | 2.0 |
| GDL thickness (μm) | 254 | O2 / N2 ratio | 0.21/0.79 |
| Catalyst layer thickness (μm) | 28.7 | H2 inlet mass fraction, Anode(%) | 11.54 |
| Cell temperature (K) | 353.2 | H2O inlet mass fraction, Anode(%) | 88.46 |
| Anode side pressure (atm) | 1 | O2 inlet mass fraction, Cathode (%) | 23.3 |
© 2008 by MDPI Reproduction is permitted for noncommercial purposes.
Share and Cite
MDPI and ACS Style
Lee, P.H.; Han, S.S.; Hwang, S.S. Three-Dimensional Transport Modeling for Proton Exchange Membrane(PEM) Fuel Cell with Micro Parallel Flow Field. Sensors 2008, 8, 1475-1487. https://doi.org/10.3390/s8031475
AMA Style
Lee PH, Han SS, Hwang SS. Three-Dimensional Transport Modeling for Proton Exchange Membrane(PEM) Fuel Cell with Micro Parallel Flow Field. Sensors. 2008; 8(3):1475-1487. https://doi.org/10.3390/s8031475
Chicago/Turabian StyleLee, Pil Hyong, Sang Seok Han, and Sang Soon Hwang. 2008. "Three-Dimensional Transport Modeling for Proton Exchange Membrane(PEM) Fuel Cell with Micro Parallel Flow Field" Sensors 8, no. 3: 1475-1487. https://doi.org/10.3390/s8031475