
Anti-Mycobacterial Evaluation of 7-Chloro-4-Aminoquinolines and Hologram Quantitative Structure–Activity Relationship (HQSAR) Modeling of Amino–Imino Tautomers

 , ,
, ,
Abstract
:
1. Introduction
2. Results and Discussion
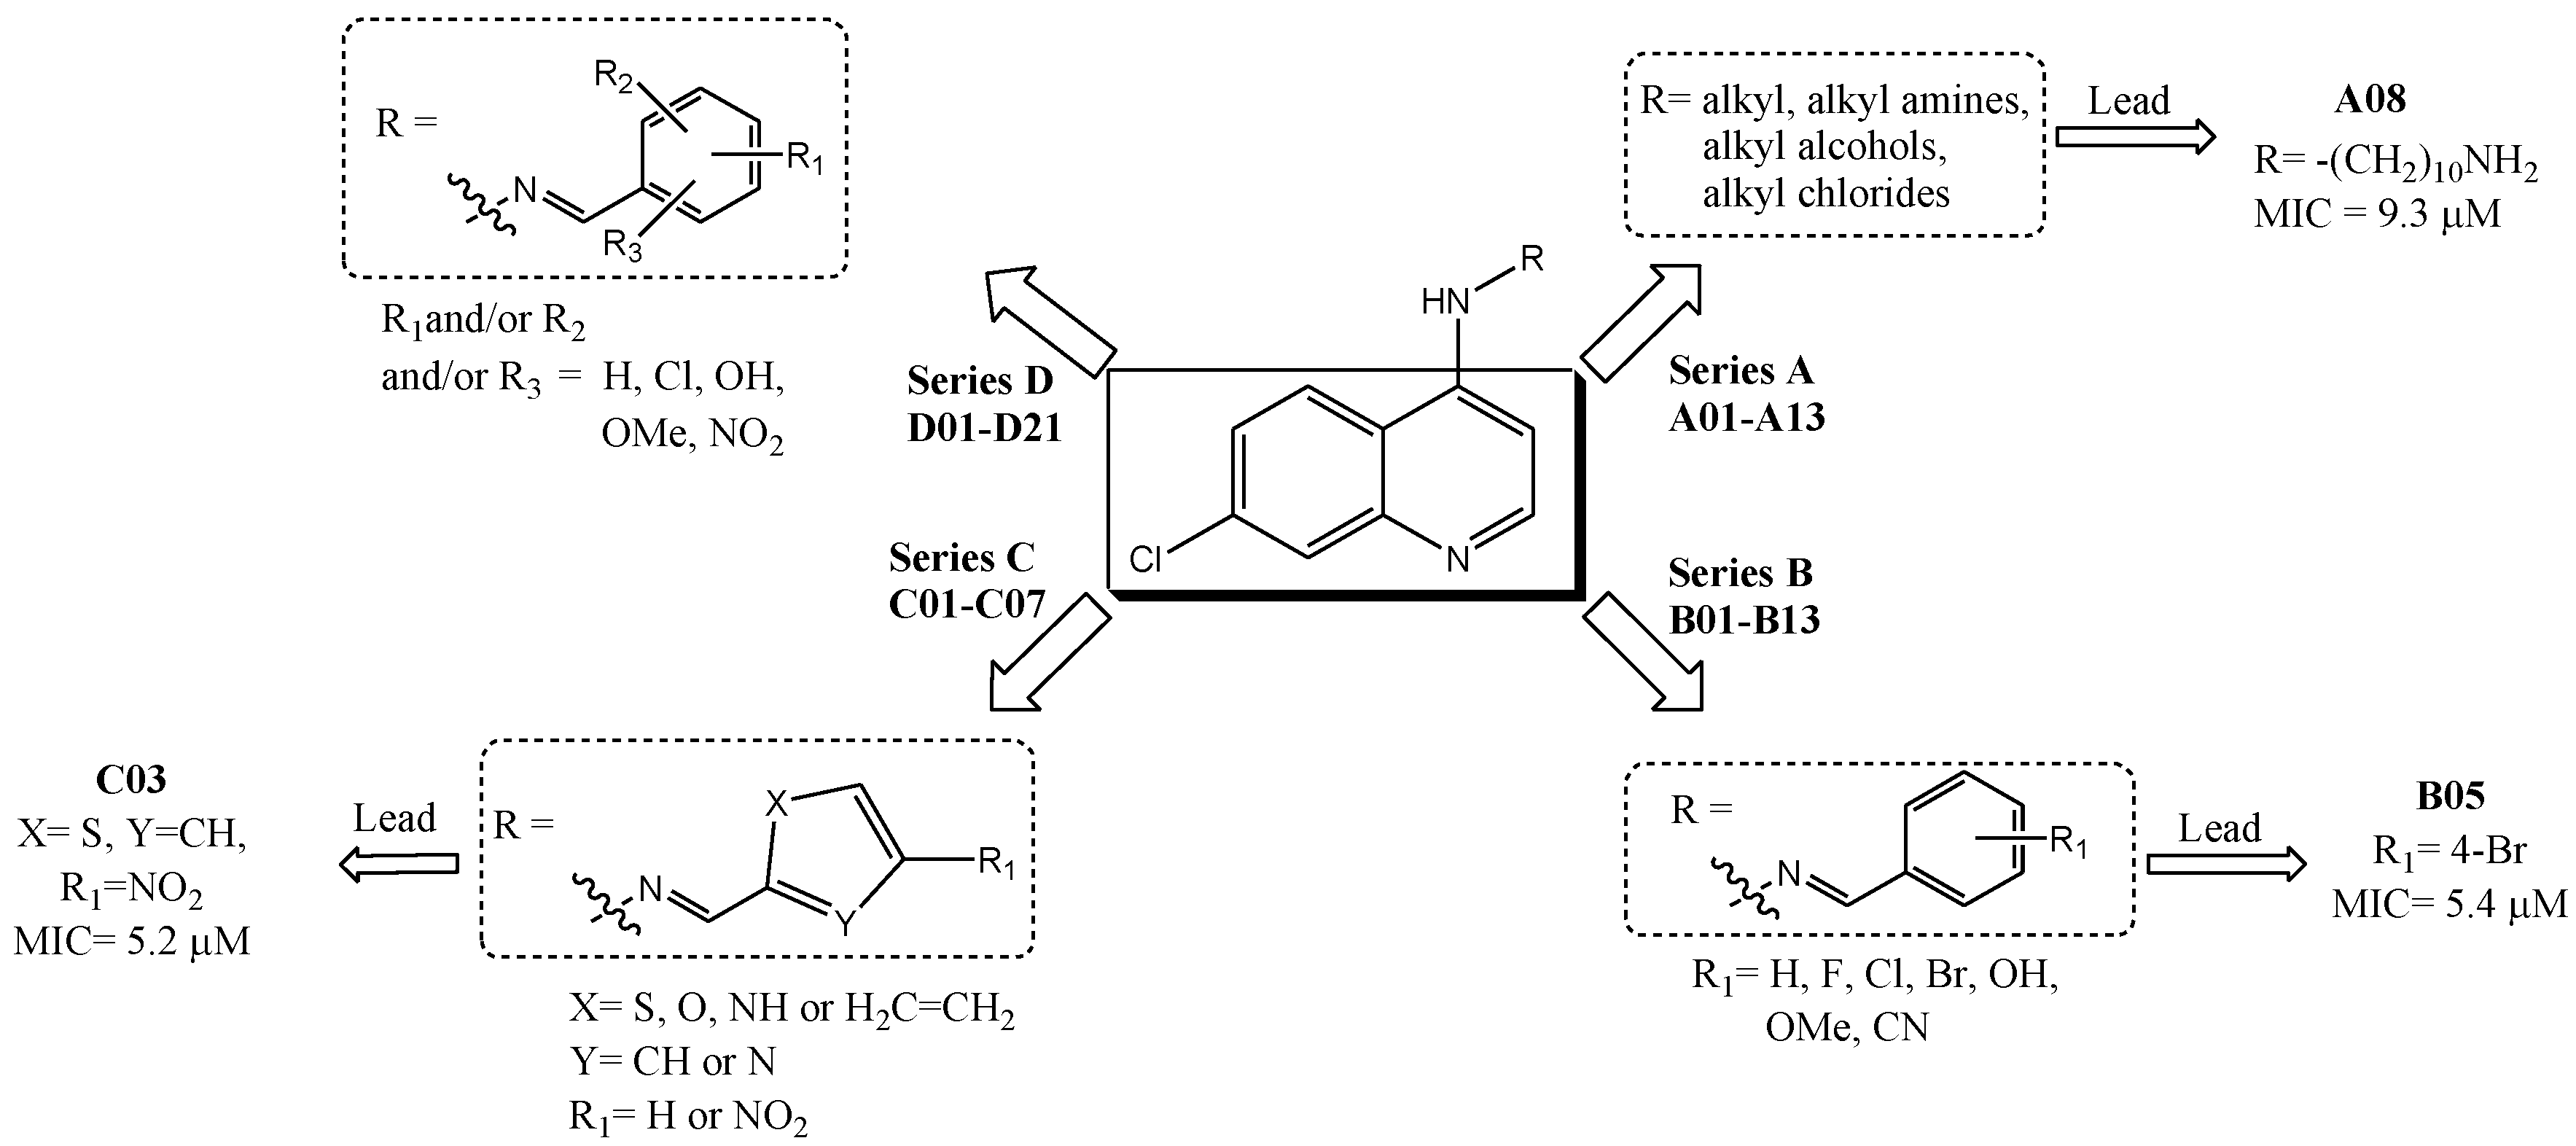
2.1. Biological Activities
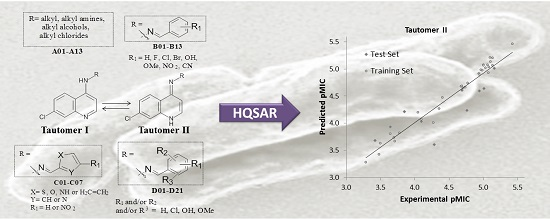
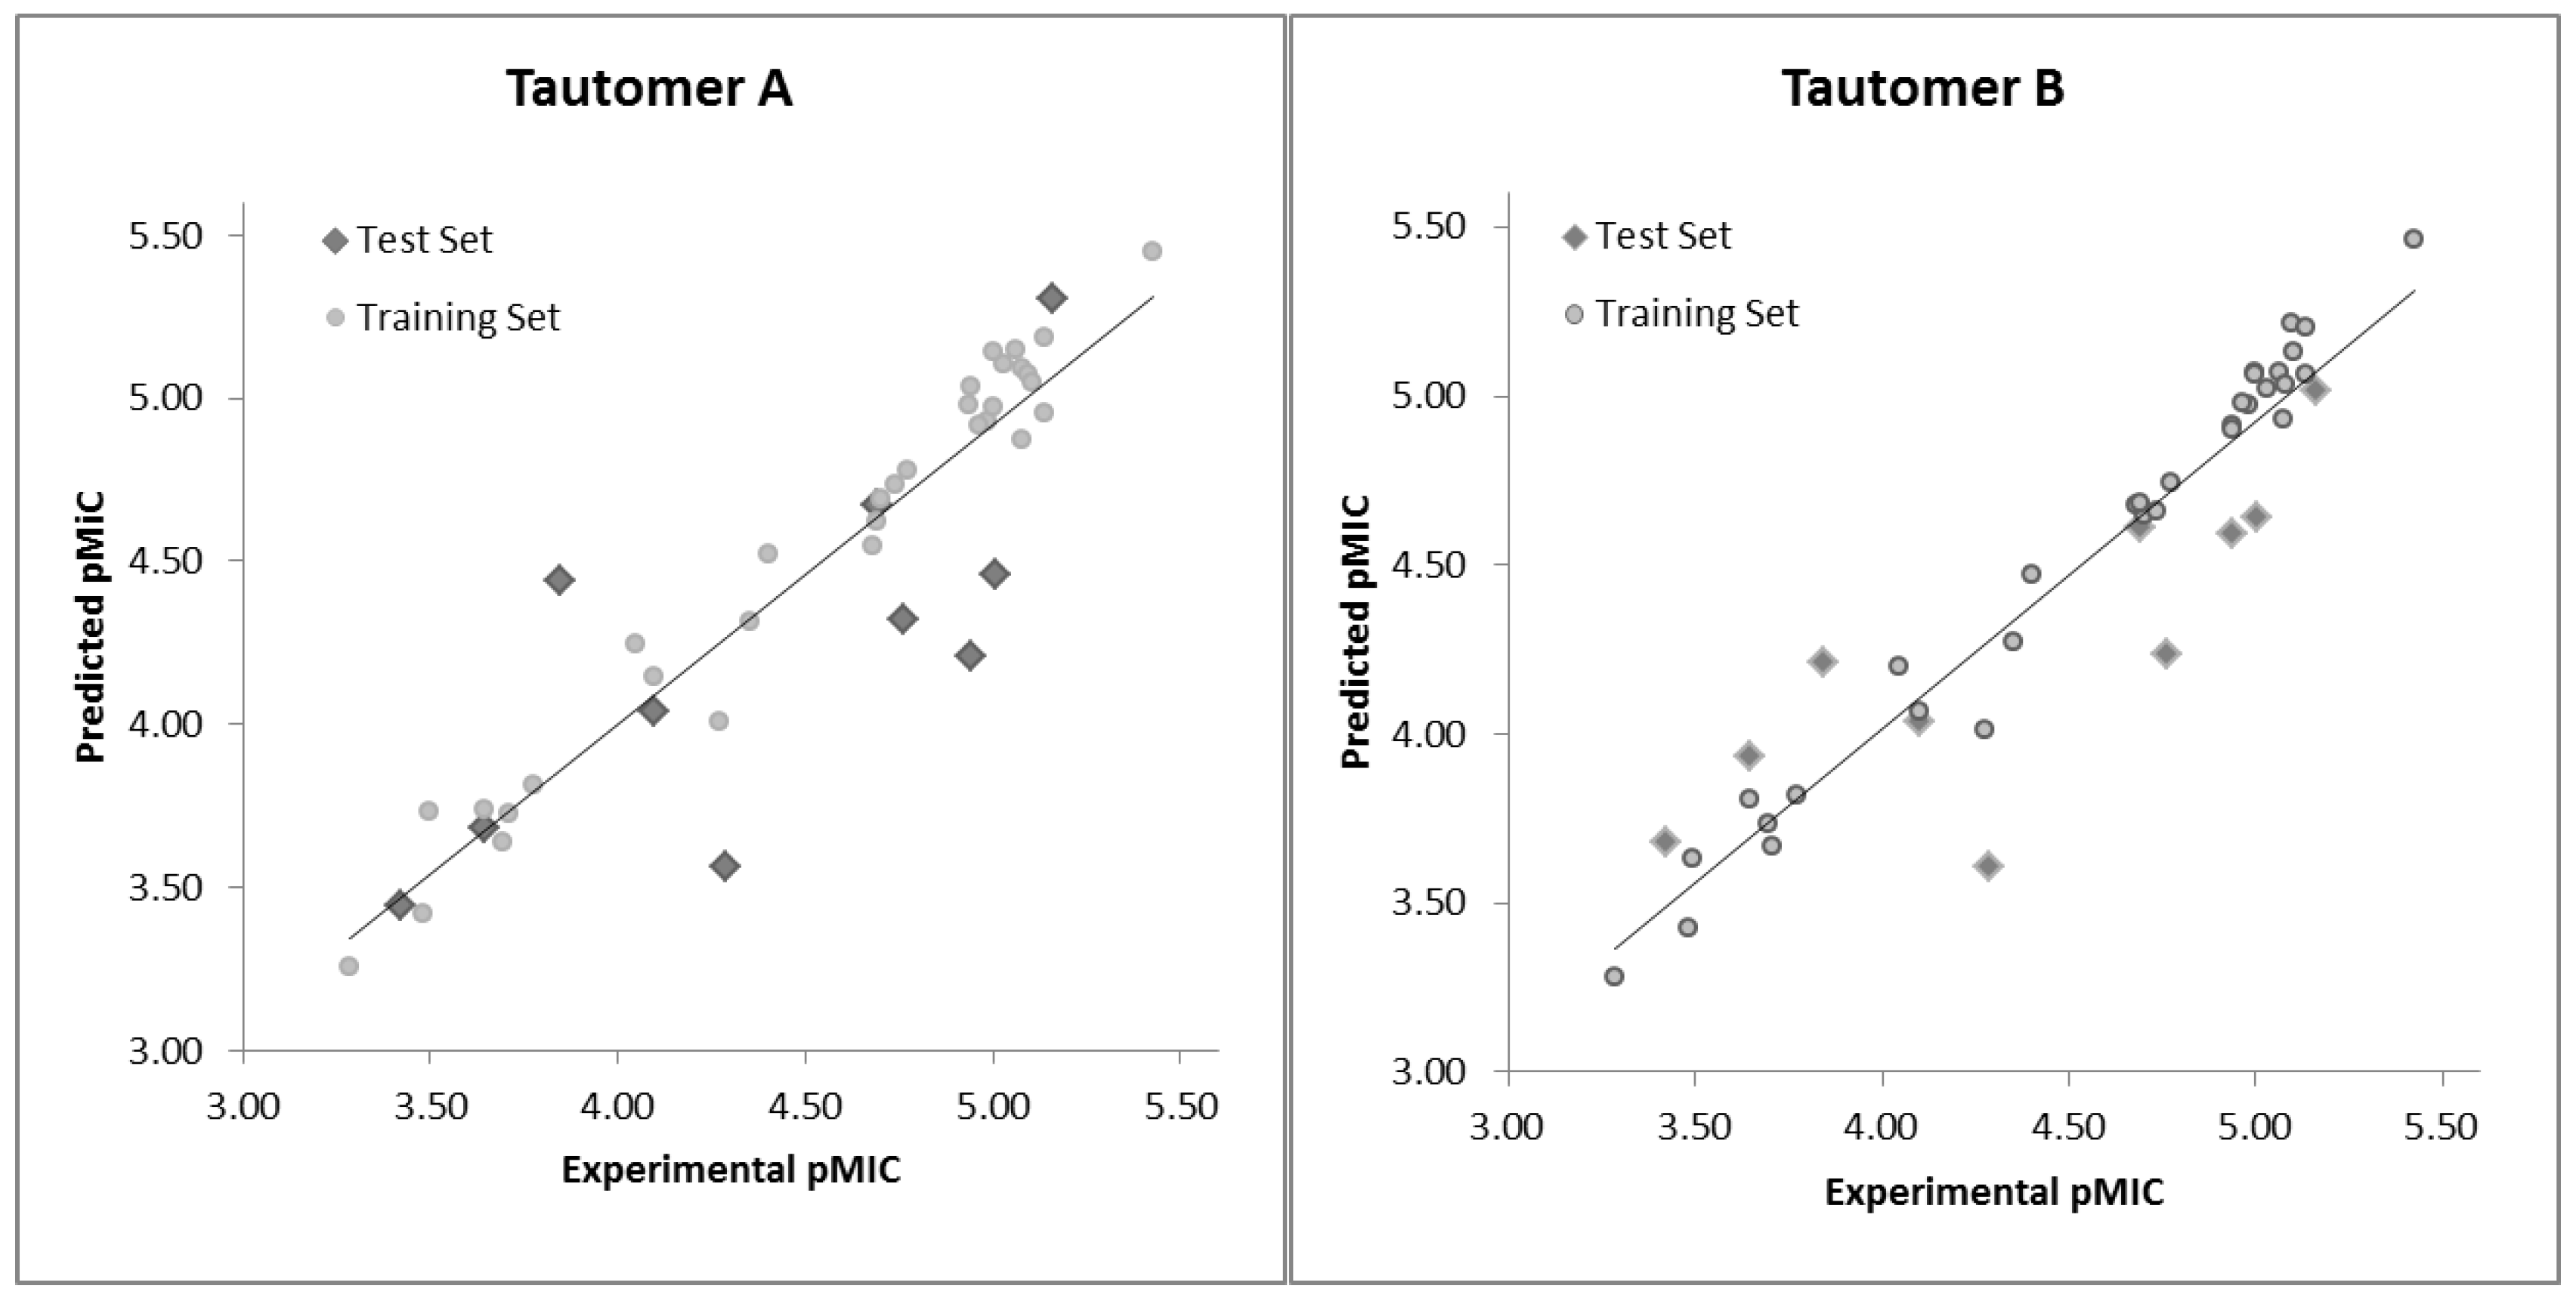
2.2. HQSAR (2D-QSAR) Modeling
3. Materials and Methods
3.1. General Procedures for Biological Tests
3.1.1. Anti-Mycobacterial (Anti-MTB) Activity
3.1.2. Cytotoxicity Activity (Colorimetric Cell Viability Assay)
3.2. Computational Analysis
3.2.1. Chemical and Biological Dataset
3.2.2. Molecular Modeling
3.2.3. HQSAR Modeling
4. Conclusions
Acknowledgments
Author Contributions
Conflicts of Interest
References
- World Health Organization. Global Tuberculosis Report 2015; Switzerland, 2015; Available online: http://reliefweb.int/report/world/global-tuberculosis-report-2015 (accessed on 6 June 2017).
- Welsch, M.E.; Snyder, S.A.; Stockwell, B.R. Privileged scaffolds for library design and drug discovery. Curr. Opin. Chem. Biol. 2010, 14, 347–361. [Google Scholar] [CrossRef] [PubMed]
- Montenegro, R.C.; Lotufo, L.V.; de Moraes, M.O.; do O Pessoa, C.; Rodrigues, F.A.R.; Bispo, M.L.F.; Freire, B.A.; Kaiser, C.R.; de Souza, M.V.N. Cytotoxic activity of polysubstituted 7-chloro-4-quinolinyl-hydrazone derivatives. Lett. Drug Des. Discov. 2012, 9, 251–256. [Google Scholar] [CrossRef]
- Mitton-Fry, M.J.; Brickner, S.J.; Hamel, J.C.; Brennan, L.; Casavant, J.M.; Chen, M.; Chen, T.; Ding, X.; Driscoll, J.; Hardink, J.; et al. Novel quinoline derivatives as inhibitors of bacterial DNA gyrase and topoisomerase IV. Bioorg. Med. Chem. Lett. 2013, 23, 2955–2961. [Google Scholar] [CrossRef] [PubMed]
- Casagrande, M.; Barteselli, A.; Basilico, N.; Parapini, S.; Taramelli, D.; Sparatore, A. Synthesis and antiplasmodial activity of new heteroaryl derivatives of 7-chloro-4-aminoquinoline. Bioorg. Med. Chem. 2012, 20, 5965–5979. [Google Scholar] [CrossRef] [PubMed]
- Coimbra, E.S.; Antinarelli, L.M.R.; da Silva, A.D.; Bispo, M.L.F.; Kaiser, C.R.; de Souza, M.V.N. 7-Chloro-4-quinolinyl hydrazones: a promising and potent class of antileishmanial compounds. Chem. Biol. Drug Des. 2013, 81, 658–665. [Google Scholar] [CrossRef] [PubMed]
- Sun, X.H.; Guan, J.Q.; Tan, J.J.; Liu, C.; Wang, C.X. 3D-QSAR studies of quinoline ring derivatives as HIV-1 integrase inhibitors. SAR QSAR Environ. Res. 2012, 23, 683–703. [Google Scholar] [CrossRef] [PubMed]
- Palomino, J.C.; Martin, A. TMC207 becomes bedaquiline, a new anti-TB drug. Future Microbiol. 2013, 8, 1071–1080. [Google Scholar] [CrossRef] [PubMed]
- Andries, K. A diarylquinoline drug active on the ATP synthase of Mycobacterium tuberculosis. Science 2005, 307, 223–227. [Google Scholar] [CrossRef] [PubMed]
- Candéa, A.L.P.; Ferreira, M.L.; Pais, K.C.; Cardoso, L.N.F.; Kaiser, C.R.; Henriques, M.G.M.O.; Lourenço, M.C.S.; Bezerra, F.A.F.M.; de Souza, M.V.N. Synthesis and antitubercular activity of 7-chloro-4-quinolinylhydrazones derivatives. Bioorg. Med. Chem. Lett. 2009, 19, 6272–6274. [Google Scholar] [CrossRef] [PubMed]
- De Souza, M.V.N.; Pais, K.C.; Kaiser, C.R.; Peralta, M.A.; Ferreira, M.L.; Lourenço, M.C.S. Synthesis and in vitro antitubercular activity of a series of quinoline derivatives. Bioorg. Med. Chem. 2009, 17, 1474–1480. [Google Scholar] [CrossRef] [PubMed]
- Ferreira, M.L.; Gonçalves, R.S.; Cardoso, L.N.F.; Kaiser, C.R.; Candéa, A.L.P.; Henriques, M.G.M.O.; Lourenço, M.C.S.; Bezerra, F.A.F.M.; de Souza, M.V.N. Synthesis and antitubercular activity of heteroaromatic isonicotinoyl and 7-chloro-4-quinolinyl hydrazone derivatives. Sci. World J. 2010, 10, 1347–1355. [Google Scholar] [CrossRef] [PubMed]
- Gonçalves, R.S.; Kaiser, C.R.; Lourenço, M.C.; Bezerra, F.A.; de Souza, M.V.N.; Wardell, J.L.; Wardell, S.M.; Henriques, M.G.M.O.; Costa, T. Mefloquine–oxazolidine derivatives, derived from mefloquine and arenecarbaldehydes: in vitro activity including against the multidrug-resistant tuberculosis strain T113. Bioorg. Med. Chem. 2012, 20, 243–248. [Google Scholar] [CrossRef] [PubMed]
- Lima, C.H.S.; de Alencastro, R.B.; Kaiser, C.R.; de Souza, M.V.N.; Rodrigues, C.R.; Albuquerque, M.G. Aqueous molecular dynamics simulations of the M. tuberculosis enoyl-ACP reductase-NADH system and its complex with a substrate mimic or diphenyl ethers inhibitors. Int. J. Mol. Sci. 2015, 16, 23695–23722. [Google Scholar] [CrossRef] [PubMed]
- Vergara, F.M.F.; Lima, C.H.S.; Henriques, M.G.M.O.; Candéa, A.L.P.; Lourenço, M.C.S.; Ferreira, M.L.; Kaiser, C.R.; de Souza, M.V.N. Synthesis and antimycobacterial activity of N′-[(E)-(monosubstituted-benzylidene)]-2-pyrazinecarbohydrazide derivatives. Eur. J. Med. Chem. 2009, 44, 4954–4959. [Google Scholar] [CrossRef] [PubMed]
- Heritage, T.W.; Lowis, D.R. Molecular Hologram QSAR. In Rational Drug Design; Parrill, A.L., Reddy, M.R., Eds.; ACS Symposium Series: USA, 1999; pp. 212–225. [Google Scholar]
- de Souza, S.D.; de Souza, A.M.; de Sousa, A.C.; Sodero, A.C.; Cabral, L.M.; Albuquerque, M.G.; Castro, H.C.; Rodrigues, C.R. Hologram QSAR models of 4-[(diethylamino)methyl]-phenol inhibitors of acetyl/butyrylcholinesterase enzymes as potential anti-Alzheimer agents. Molecules 2012, 17, 9529–9539. [Google Scholar] [CrossRef] [PubMed]
- Leal, F.D.; da Silva Lima, C.H.; de Alencastro, R.B.; Castro, H.C.; Rodrigues, C.R.; Albuquerque, M.G. Hologram QSAR models of a series of 6-arylquinazolin-4-amine inhibitors of a new Alzheimer’s disease target: dual specificity tyrosine-phosphorylation-regulated kinase-1A enzyme. Int. J. Mol. Sci. 2015, 16, 5235–5253. [Google Scholar] [CrossRef] [PubMed]
- Rodrigues, C.R.; Flaherty, T.M.; Springer, C.; McKerrow, J.H.; Cohen, F.E. CoMFA and HQSAR of acylhydrazide cruzain inhibitors. Bioorg. Med. Chem. Lett. 2002, 12, 1537–1541. [Google Scholar] [CrossRef]
- Myint, K.Z.; Xie, X.-Q. Recent advances in fragment-based QSAR and multi-dimensional QSAR methods. Int. J. Mol. Sci. 2010, 11, 3846–3866. [Google Scholar] [CrossRef] [PubMed]
- Franzblau, S.G.; Witzig, R.S.; McLaughlin, J.C.; Torres, P.; Madico, G.; Hernandez, A.; Degnan, M.T.; Cook, M.B.; Quenzer, V.K.; Ferguson, R.M.; Gilman, R.H. Rapid, low-technology MIC determination with clinical Mycobacterium tuberculosis isolates by using the microplate Alamar Blue assay. J. Clin. Microbiol. 1998, 36, 362–366. [Google Scholar] [PubMed]
- Canetti, G.; Rist, N.; Grosset, J. Measurement of sensitivity of the tuberculous bacillus to antibacillary drugs by the method of proportions. Methodology, resistance criteria, results and interpretation. Rev. Tuberc. Pneumol. 1963, 27, 217–272. [Google Scholar]
- Bhattachar, S.N.; Deschenes, L.A.; Wesley, J.A. Solubility: it’s not just for physical chemists. Drug Discov. Today 2006, 11, 1012–1018. [Google Scholar] [CrossRef] [PubMed]
- Ishikawa, M.; Hashimoto, Y. Improvement in aqueous solubility in small molecule drug discovery programs by disruption of molecular planarity and symmetry. J. Med. Chem. 2011, 54, 1539–1554. [Google Scholar] [CrossRef] [PubMed]
- Carvalho, M.V.; Penido, C.; Siani, A.C.; Valente, L.M.M.; Henriques, M.G.M.O. Investigations on the anti-inflammatory and anti-allergic activities of the leaves of Uncaria guianensis (Aublet) J. F. Gmelin. Inflammopharmacology 2006, 14, 48–56. [Google Scholar] [CrossRef] [PubMed]
- Souza, M.C.; Siani, A.C.; Ramos, M.F.S.; Menezes-de-Lima, O.J.; Henriques, M.G.M.O. Evaluation of anti-inflammatory activity of essential oils from two Asteraceae species. Pharmazie 2003, 58, 582–586. [Google Scholar] [PubMed]
- Araújo, J.Q.; de Brito, M.A.; Hoelz, L.V.B.; de Alencastro, R.B.; Castro, H.C.; Rodrigues, C.R.; Albuquerque, M.G. Receptor-dependent (RD) 3D-QSAR approach of a series of benzylpiperidine inhibitors of human acetylcholinesterase (HuAChE). Eur. J. Med. Chem. 2011, 46, 39–51. [Google Scholar] [CrossRef] [PubMed]
- Rando, D.G.; Sato, D.N.; Siqueira, L.; Malvezzi, A.; Leite, C.Q.; do Amaral, A.T.; Ferreira, E.I.; Tavares, L.C. Potential tuberculostatic agents. Topliss application on benzoic acid [(5-nitro-thiophen-2-yl)-methylene]-hydrazide series. Bioorg. Med. Chem. 2002, 10, 557–560. [Google Scholar] [CrossRef]
- de Souza, M.V.N.; Bispo, M.L.F.; Alcantara, C.C.; Wardell, S.M.S.V.; Wardell, J.L. Structures of a co-crystal of tautomers of (E)-N-7-chloro-4-(2-methoxycinnamolyhydrazinyl)quinoline and a single tautomer of the 4-methoxy analogue. Zeitschrift für Krist. Cryst. Mater. 2013, 228, 232–239. [Google Scholar] [CrossRef]
- Howie, R.A.; de Souza, M.V.N.; Ferreira, M.L.; Kaiser, C.R.; Wardell, J.L.; Wardell, S.M.S.V. Structures of arylaldehyde 7-chloroquinoline-4-hydrazones: supramolecular arrangements derived from N—H···N, C—H···X (X = N, O, or π) and π···π interactions. Zeitschrift für Krist. 2010, 225, 440–447. [Google Scholar]
- Allen, F.H. The Cambridge Structural Database: a quarter of a million crystal structures and rising. Acta Crystallogr. Sect. B Struct. Sci. 2002, 58, 380–388. [Google Scholar] [CrossRef]
- Shao, Y.; Molnar, L.F.; Jung, Y.; Kussmann, J.; Ochsenfeld, C.; Brown, S.T.; Gilbert, A.T.B.; Slipchenko, L.V.; Levchenko, S.V.; O’Neill, D.P.; et al. Advances in methods and algorithms in a modern quantum chemistry program package. Phys. Chem. Chem. Phys. 2006, 8, 3172–3191. [Google Scholar] [CrossRef] [PubMed]
- Dewar, M.J.S.; Zoebisch, E.G.; Healy, E.F.; Stewart, J.J.P. Development and use of quantum mechanical molecular models. 76. AM1: a new general purpose quantum mechanical molecular model. J. Am. Chem. Soc. 1985, 107, 3902–3909. [Google Scholar] [CrossRef]
- HQSAR, Sybyl, version 8.0, software for molecular modeling; Tripos Inc.: St. Louis, MO, USA, 2008.
- Benigni, R.; Bossa, C. Predictivity of QSAR. J. Chem. Inf. Model. 2008, 48, 971–980. [Google Scholar] [CrossRef] [PubMed]
- Fernandes, J.P.S.; Pasqualoto, K.F.M.; Ferreira, E.I.; Brandt, C.A. Molecular modeling and QSAR studies of a set of indole and benzimidazole derivatives as H4 receptor antagonists. J. Mol. Model. 2011, 17, 921–928. [Google Scholar] [CrossRef] [PubMed]
- Cramer, R.D.; Patterson, D.E.; Bunce, J.D. Comparative molecular field analysis (CoMFA). 1. Effect of shape on binding of steroids to carrier proteins. J. Am. Chem. Soc. 1988, 110, 5959–5967. [Google Scholar] [CrossRef] [PubMed]


| # | R substituent | MIC (μM) a,b | Cell Viability c,d (%)/Dose (µg/mL) | ||
|---|---|---|---|---|---|
| 2.5 | 25 | 100 | |||
| D01 | 2,6-Cl | 142.6 | 100 | 90 | 86 |
| D02 | 2,3-OH | 79.7 | 83 | 40 | 83 |
| D03 | 3,4-OH | 318.7 | 78 | 35 | 72 |
| D04 | 2,5-OH | 79.7 | 100 | 100 | 70 |
| D05 | 2,3-OCH3 | 7.3 | 98 | 97 | 85 |
| D06 | 3,4-OCH3 | 7.3 | 65 | 8 | 20 |
| D07 | 2,5-OCH3 | 18.3 | 40 | 22 | 47 |
| D08 | 3,4,5-OCH3 | 16.8 | 93 | 90 | 69 |
| D09 | 2-Cl, 3-OH, 4-OCH3 | 17.3 | 80 | 55 | 48 |
| D10 | 2,3-Cl | n.d. | n.d. | n.d. | n.d. |
| D11 | 2,4-Cl | n.d. | n.d. | n.d. | n.d. |
| D12 | 3,4-Cl | n.d. | n.d. | n.d. | n.d. |
| D13 | 2,4-OH | n.d. | n.d. | n.d. | n.d. |
| D14 | 2,3,4-OH | n.d. | n.d. | n.d. | n.d. |
| D15 | 3,4,5-OH | n.d. | n.d. | n.d. | n.d. |
| D16 | 2,4-OCH3 | n.d. | n.d. | n.d. | n.d. |
| D17 | 2-OH, 4-CH3 | n.d. | n.d. | n.d. | n.d. |
| D18 | 2-OH, 5-CH3 | n.d. | n.d. | n.d. | n.d. |
| D19 | 3-Cl, 4-OH | n.d. | n.d. | n.d. | n.d. |
| D20 | 2-OH, 3-OCH3 | n.d. | n.d. | n.d. | n.d. |
| D21 | 3-NO2, 4-Cl | n.d. | n.d. | n.d. | n.d. |
| EMB | ---- | 15.3 | 100 | 93 | 82 |
| # a | R substituent | pMIC b | # a | R substituent | pMIC b | # a | R substituent | pMIC b |
|---|---|---|---|---|---|---|---|---|
| A01* | -(CH2)2Cl | 4.29 | B02* |  | 5.01 | C03 |  | 5.43 |
| A02 | -(CH2)2N3 | 3.69 | B03 |  | 4.40 | C04 |  | 4.96 |
| A03* | -(CH2)2-NH-(CH2)2CH3 | 3.42 | B04 |  | 5.06 | C05 |  | 4.94 |
| A04 | -(CH2)2-NH-C6H11 | 3.48 | B05* |  | 5.16 | C06 |  | 4.94 |
| A05 | -(CH2)2-NH-Ph | 3.77 | B06 |  | 4.98 | C07 |  | 4.35 |
| A06 | -(CH2)6-NH2 | 4.05 | B07 |  | 5.08 | D01* |  | 3.85 |
| A07* | -(CH2)8-NH2 | 4.69 | B08 |  | 5.08 | D02 |  | 4.10 |
| A08 | -(CH2)10-NH2 | 5.03 | B09 |  | 4.68 | D03 |  | 3.50 |
| A09 | -CH3 | 3.28 | B10 |  | 5.00 | D04* |  | 4.10 |
| A10 | -(CH2)2CH3 | 3.64 | B11 |  | 5.00 | D05 |  | 5.14 |
| A11* | -CH2(CH3)2 | 3.64 | B12 |  | 5.10 | D06 | 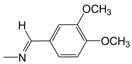 | 5.14 |
| A12 | -(CH2)3CH3 | 4.27 | B13 |  | 4.69 | D07 | 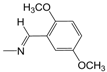 | 4.74 |
| A13 | -(CH2)3Cl | 3.71 | C01 |  | 5.10 | D08 | 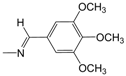 | 4.77 |
| B01 |  | 4.70 | C02* |  | 4.94 | D09* |  | 4.76 |
| FD b | Tautomer I/Statistical Indexes a | Tautomer II/Statistical Indexes a | ||||||||||
|---|---|---|---|---|---|---|---|---|---|---|---|---|
| q2 | r2 | SE | SEcv | NC | HL | q2 | r2 | SE | SEcv | NC | HL | |
| A/B | 0.63 | 1.00 | 0.05 | 0.52 | 15 | 83 | 0.66 | 0.97 | 0.13 | 0.42 | 9 | 61 |
| A/C | 0.80 | 0.97 | 0.12 | 0.32 | 8 | 53 | 0.77 | 0.98 | 0.10 | 0.35 | 10 | 53 |
| A/H | 0.58 | 0.91 | 0.21 | 0.45 | 7 | 59 | 0.58 | 0.91 | 0.21 | 0.45 | 7 | 59 |
| A/Ch | 0.70 | 1.00 | 0.05 | 0.44 | 13 | 401 | 0.68 | 1.00 | 0.05 | 0.45 | 13 | 401 |
| A/DA | 0.61 | 1.00 | 0.06 | 0.53 | 15 | 307 | 0.61 | 1.00 | 0.06 | 0.53 | 15 | 307 |
| B/C | 0.69 | 0.97 | 0.15 | 0.47 | 15 | 59 | 0.68 | 0.96 | 0.15 | 0.44 | 12 | 59 |
| B/H | 0.33 | 0.88 | 0.25 | 0.59 | 9 | 307 | 0.44 | 0.90 | 0.23 | 0.55 | 9 | 307 |
| C/H | 0.54 | 0.97 | 0.15 | 0.58 | 15 | 257 | 0.61 | 0.97 | 0.14 | 0.50 | 13 | 199 |
| C/DA | 0.77 | 0.99 | 0.09 | 0.39 | 14 | 97 | 0.72 | 0.99 | 0.08 | 0.45 | 15 | 83 |
| A/B/C | 0.62 | 1.00 | 0.04 | 0.52 | 15 | 401 | 0.68 | 0.99 | 0.08 | 0.42 | 10 | 257 |
| A/C/H | 0.79 | 0.98 | 0.10 | 0.33 | 9 | 83 | 0.68 | 1.00 | 0.03 | 0.48 | 15 | 199 |
| A/B/C/H | 0.67 | 1.00 | 0.02 | 0.49 | 15 | 307 | 0.73 | 1.00 | 0.01 | 0.44 | 15 | 307 |
| FS | Tautomer I/Statistical Indexes a | Tautomer II/Statistical Indexes a | ||||||||||
|---|---|---|---|---|---|---|---|---|---|---|---|---|
| q2 | r2 | SE | SEcv | NC | HL | q2 | r2 | SE | SEcv | NC | HL | |
| 2‒5 | 0.61 | 0.99 | 0.09 | 0.53 | 15 | 257 | 0.70 | 0.99 | 0.08 | 0.47 | 15 | 257 |
| 3‒6 | 0.61 | 0.99 | 0.07 | 0.52 | 14 | 353 | 0.68 | 0.99 | 0.07 | 0.47 | 14 | 151 |
| 4‒7 | 0.80 | 0.97 | 0.12 | 0.32 | 8 | 53 | 0.77 | 0.98 | 0.10 | 0.35 | 10 | 53 |
| 5‒8 | 0.63 | 1.00 | 0.04 | 0.48 | 12 | 353 | 0.75 | 1.00 | 0.03 | 0.43 | 15 | 61 |
| 6‒9 | 0.64 | 0.96 | 0.14 | 0.41 | 6 | 353 | 0.67 | 0.98 | 0.10 | 0.40 | 7 | 257 |
| 7‒10 | 0.66 | 1.00 | 0.01 | 0.49 | 15 | 257 | 0.62 | 1.00 | 0.02 | 0.50 | 13 | 257 |
| 8‒11 | 0.60 | 0.98 | 0.09 | 0.46 | 9 | 97 | 0.57 | 1.00 | 0.01 | 0.56 | 15 | 257 |
| 9‒12 | 0.53 | 0.98 | 0.10 | 0.50 | 9 | 307 | 0.57 | 0.99 | 0.07 | 0.49 | 10 | 353 |
| Randomization | R a | Tautomer I Statistical Indexes b | Tautomer II Statistical Indexes b | ||
|---|---|---|---|---|---|
| q2 | r2 | q2 | r2 | ||
| 1 | −0.20 | 0.107 | 0.458 | 0.078 | 0.267 |
| 2 | −0.21 | 0.178 | 0.301 | 0.138 | 0.526 |
| 3 | −0.43 | 0.212 | 0.726 | 0.410 | 0.632 |
| 4 | −0.11 | 0.298 | 0.565 | 0.172 | 0.688 |
| 5 | −0.02 | n.p. | n.p. | n.p. | n.p. |
| 6 | 0.07 | n.p. | n.p. | n.p. | n.p. |
| 7 | −0.03 | n.p. | n.p. | n.p. | n.p. |
| 8 | −0.11 | n.p. | n.p. | n.p. | n.p. |
| 9 | −0.06 | n.p. | n.p. | n.p. | n.p. |
| 10 | 0.02 | n.p. | n.p. | n.p. | n.p. |
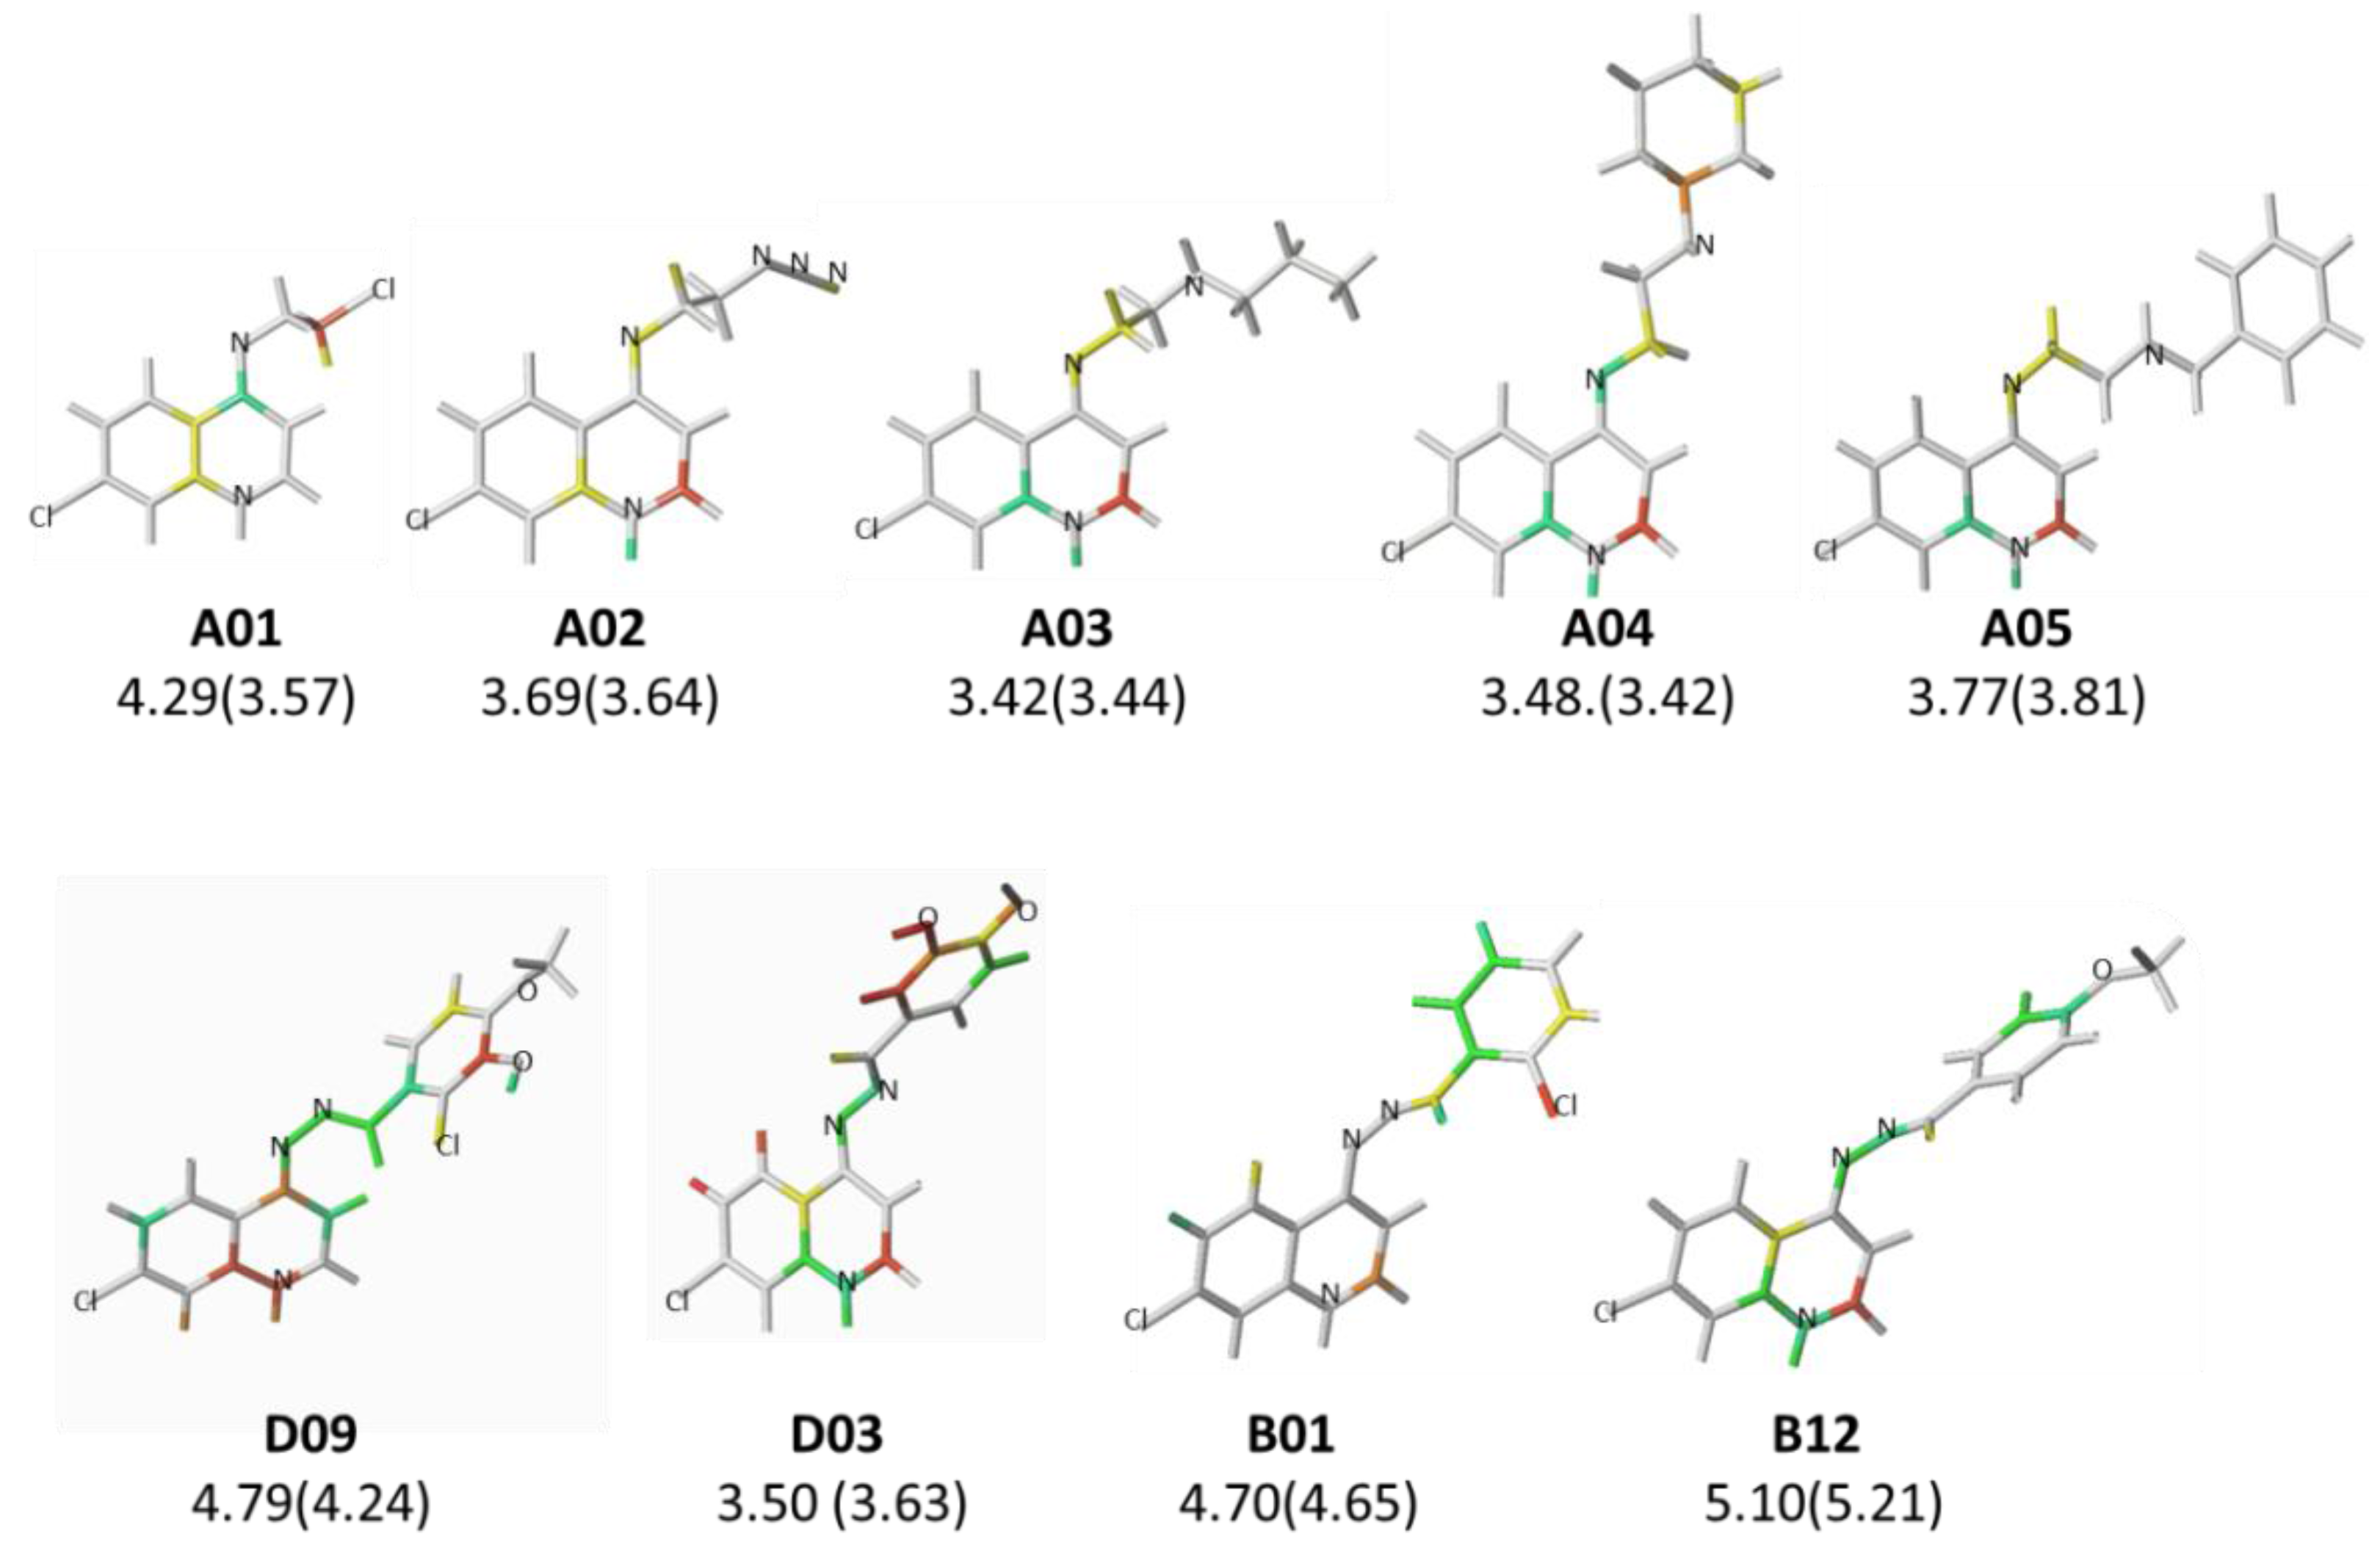
| # a | pMICExp b | Tautomer I | Tautomer II | #a | pMICExp b | Tautomer I | Tautomer II | ||||
|---|---|---|---|---|---|---|---|---|---|---|---|
| pMICCalc | Res c | pMICCalc | Res c | pMICCalc | Res c | pMICCalc | Res c | ||||
| A01* | 4.29 | 3.57 | 0.72 | 3.61 | 0.68 | B09 | 4.68 | 4.55 | 0.13 | 4.68 | 0.00 |
| A02 | 3.69 | 3.64 | 0.06 | 3.73 | −0.04 | B10 | 5.00 | 5.14 | −0.14 | 5.07 | −0.07 |
| A03* | 3.42 | 3.44 | −0.02 | 3.68 | −0.26 | B11 | 5.00 | 4.97 | 0.03 | 5.06 | −0.06 |
| A04 | 3.48 | 3.42 | 0.06 | 3.42 | 0.06 | B12 | 5.10 | 5.07 | 0.02 | 5.21 | −0.12 |
| A05 | 3.77 | 3.81 | −0.04 | 3.82 | −0.04 | B13 | 4.69 | 4.63 | 0.07 | 4.68 | 0.01 |
| A06 | 4.05 | 4.25 | −0.20 | 4.20 | −0.16 | C01 | 5.10 | 5.05 | 0.05 | 5.13 | −0.03 |
| A07* | 4.69 | 4.68 | 0.01 | 4.61 | 0.08 | C02* | 4.94 | 4.21 | 0.73 | 4.59 | 0.35 |
| A08 | 5.03 | 5.10 | −0.07 | 5.02 | 0.01 | C03 | 5.43 | 5.45 | −0.02 | 5.46 | −0.03 |
| A09 | 3.28 | 3.26 | 0.03 | 3.28 | 0.00 | C04 | 4.96 | 4.91 | 0.05 | 4.98 | −0.02 |
| A10 | 3.64 | 3.74 | −0.09 | 3.80 | −0.16 | C05 | 4.94 | 4.98 | −0.04 | 4.91 | 0.03 |
| A11* | 3.64 | 3.68 | −0.04 | 3.93 | −0.29 | C06 | 4.94 | 5.03 | −0.09 | 4.90 | 0.04 |
| A12 | 4.27 | 4.01 | 0.27 | 4.01 | 0.26 | C07 | 4.35 | 4.32 | 0.04 | 4.27 | 0.08 |
| A13 | 3.71 | 3.73 | −0.02 | 3.67 | 0.04 | D01* | 3.85 | 4.44 | −0.60 | 4.21 | −0.37 |
| B01 | 4.70 | 4.69 | 0.01 | 4.65 | 0.06 | D02 | 4.10 | 4.15 | −0.05 | 4.07 | 0.03 |
| B02* | 5.01 | 4.46 | 0.55 | 4.64 | 0.36 | D03 | 3.50 | 3.74 | −0.24 | 3.63 | −0.13 |
| B03 | 4.40 | 4.52 | −0.12 | 4.47 | −0.07 | D04* | 4.10 | 4.04 | 0.06 | 4.03 | 0.06 |
| B04 | 5.06 | 5.15 | −0.09 | 5.07 | −0.01 | D05 | 5.14 | 5.19 | −0.05 | 5.20 | −0.07 |
| B05* | 5.16 | 5.31 | −0.15 | 5.02 | 0.14 | D06 | 5.14 | 4.96 | 0.18 | 5.06 | 0.07 |
| B06 | 4.98 | 4.93 | 0.06 | 4.98 | 0.01 | D07 | 4.74 | 4.74 | 0.00 | 4.66 | 0.08 |
| B07 | 5.08 | 5.09 | −0.01 | 5.04 | 0.04 | D08 | 4.77 | 4.78 | 0.00 | 4.74 | 0.03 |
| B08 | 5.08 | 4.87 | 0.20 | 4.93 | 0.15 | D09* | 4.76 | 4.32 | 0.44 | 4.24 | 0.53 |
| # | R substituent | pMICCalc | # | R substituent | pMICCalc |
|---|---|---|---|---|---|
| D10 |  | 4.32 | D16 |  | 5.07 |
| D11 |  | 4.00 | D17 |  | 4.56 |
| D12 |  | 4.15 | D18 |  | 4.97 |
| D13 |  | 4.50 | D19 |  | 4.19 |
| D14 |  | 3.09 | D20 |  | 4.80 |
| D15 |  | 2.58 | D21 |  | 5.97 |
© 2017 by the authors. Licensee MDPI, Basel, Switzerland. This article is an open access article distributed under the terms and conditions of the Creative Commons Attribution (CC BY) license (http://creativecommons.org/licenses/by/4.0/).
Share and Cite
Bispo, M.L.F.; Lima, C.H.S.; Cardoso, L.N.F.; Candéa, A.L.P.; Bezerra, F.A.F.M.; Lourenço, M.C.S.; Henriques, M.G.M.O.; Alencastro, R.B.; Kaiser, C.R.; Souza, M.V.N.; et al. Anti-Mycobacterial Evaluation of 7-Chloro-4-Aminoquinolines and Hologram Quantitative Structure–Activity Relationship (HQSAR) Modeling of Amino–Imino Tautomers. Pharmaceuticals 2017, 10, 52. https://doi.org/10.3390/ph10020052
Bispo MLF, Lima CHS, Cardoso LNF, Candéa ALP, Bezerra FAFM, Lourenço MCS, Henriques MGMO, Alencastro RB, Kaiser CR, Souza MVN, et al. Anti-Mycobacterial Evaluation of 7-Chloro-4-Aminoquinolines and Hologram Quantitative Structure–Activity Relationship (HQSAR) Modeling of Amino–Imino Tautomers. Pharmaceuticals. 2017; 10(2):52. https://doi.org/10.3390/ph10020052
Chicago/Turabian StyleBispo, Marcelle L. F., Camilo H. S. Lima, Laura N. F. Cardoso, André L. P. Candéa, Flávio A. F. M. Bezerra, Maria C. S. Lourenço, Maria G. M. O. Henriques, Ricardo B. Alencastro, Carlos R. Kaiser, Marcus V. N. Souza, and et al. 2017. "Anti-Mycobacterial Evaluation of 7-Chloro-4-Aminoquinolines and Hologram Quantitative Structure–Activity Relationship (HQSAR) Modeling of Amino–Imino Tautomers" Pharmaceuticals 10, no. 2: 52. https://doi.org/10.3390/ph10020052
APA StyleBispo, M. L. F., Lima, C. H. S., Cardoso, L. N. F., Candéa, A. L. P., Bezerra, F. A. F. M., Lourenço, M. C. S., Henriques, M. G. M. O., Alencastro, R. B., Kaiser, C. R., Souza, M. V. N., & Albuquerque, M. G. (2017). Anti-Mycobacterial Evaluation of 7-Chloro-4-Aminoquinolines and Hologram Quantitative Structure–Activity Relationship (HQSAR) Modeling of Amino–Imino Tautomers. Pharmaceuticals, 10(2), 52. https://doi.org/10.3390/ph10020052