
In Silico Plasma Protein Binding Studies of Selected Group of Drugs Using TLC and HPLC Retention Data


Department of Analytical Chemistry, Faculty of Pharmacy, Medical University of Lodz, 92-216 Lodz, Poland
*
Author to whom correspondence should be addressed.
Pharmaceuticals 2021, 14(3), 202; https://doi.org/10.3390/ph14030202
Submission received: 27 December 2020
/
Revised: 5 February 2021
/
Accepted: 25 February 2021
/
Published: 28 February 2021
(This article belongs to the Special Issue Selected Papers from the 6th International Electronic Conference on Medicinal Chemistry (ECMC2020))
Abstract
:Plasma protein binding is an important determinant of the pharmacokinetic properties of chemical compounds in living organisms. The aim of the present study was to determine the index of protein binding affinity based on chromatographic experiments. The question is which chromatographic environment will best mimic the drug–protein binding conditions. Retention data from normal phase thin-layer liquid chromatography (NP TLC), reversed phase (RP) TLC and HPLC chromatography experiments with 129 active pharmaceutical ingredients (APIs) were collected. The stationary phase of the TLC plates was modified with protein and the HPLC column was filled with immobilized human serum albumin. In both chromatographic methods, the mobile phase was based on a buffer with a pH of 7.4 to mimic physiological conditions. Chemometric analyses were performed to compare multiple linear regression models (MLRs) with retention data, using protein binding values as the dependent variable. In the course of the analysis, APIs were divided into acidic, basic and neutral groups, and separate models were created for each group. The MLR models had a coefficient of determination between 0.73 and 0.91, with the highest values from NP TLC data.
1. Introduction
Protein binding (PB) is an important consideration in the design of new drug substances. Only the free form of the drug is capable of pharmacodynamic action and passing through biological barriers. However, as proteins are widely distributed throughout the human body, it seems impossible to prevent them from interacting with medications [1,2]. For this reason, a number of in vitro and in vivo methods have been developed to analyze PB. Of these, chemometric methods, i.e., those that use measurement data to predict the chemical, physical or biological properties of compounds, are gaining increasing importance [3,4,5], mainly due to their relative simplicity and low cost.
Binding with proteins occurs most often as a result of hydrophobic, van der Waals and electrostatic interactions. The most important drug binding proteins are human serum albumin (HSA), alpha-1-acid glycoprotein (AGP), transferrin, transcobalamin, thyroglobulin, haptoglobin, corticosteroid binding protein, lipoproteins and immunoglobulins [6]. HSA is responsible for the majority of PB in human plasma [7,8], and is mainly responsible for the binding of neutral or acidic hydrophobic compounds [9].
The aim of this study is to find the best chromatographic environment in which the PB conditions of the body can be recreated. We tested a range of chromatographic experiments (normal phase thin-layer liquid chromatography (NP TLC), reverse phase (RP) TLC and HPLC) as indicators of the PB affinity of selected active pharmaceutical ingredients (APIs), with the assumption that results could be used to predict the PB. The successful model should demonstrate the protein binding at the physiological pH of human plasma; therefore, the mobile phase was based on a buffer at pH 7.4. Comparing the effectiveness of these methods and proposing mathematical modifications of the retention values of the studied APIs can be a source of convenient quantitative parameters. The chromatographic data obtained in the subsequent experiments were compared with the PB values from the literature [10].
In the HPLC experiment, a commercial column was used, the packing of which was immobilized with HSA (HPLCHSA). The values of the retention factor (k) were collected, along with a more useful derivative thereof: log k.
Thin-layer chromatography (TLC) was performed in normal and reverse phase (NP and RP) systems. The stationary phase surface-modifying protein was bovine serum albumin (BSA). This protein is often used as an effective replacement for human plasma albumin when studying the affinity of drugs to protein [11,12]. Such a substrate should also offer good adhesion of the protein modifier, even coverage of the plate surface and be as immobile as possible under chromatographic conditions.
Chromatographic data were later transformed using physicochemical properties such as lipophilicity or polar surfae areas. All descriptors used in the multiple linear regression are listed in Table 1.
2. Results
2.1. HPLCHSA Column Chromatography Model
In this study, we examined the retention factor (log k) and all derivatives related to the physicochemical properties of the tested APIs. A correlation matrix of all chromatographic variables was created and the level of plasma protein binding (PBabn) was calculated. In this group, the drugs of bases (b), acids (a) and neutral (n) character were tested. The log k values demonstrated a significant correlation with PBabn: R = 0.56 (number of examined cases: nabn = 128). The interactions between the remaining log k derivatives were observed in terms of their mutual correlations. The introduction of all unrelated variables (log k, log k/B2 and log k/PSA) into the multiple linear regression (MLR) analysis did not increase the correlation with the PBabn (R = 0.57, nabn = 129). This result is much less satisfactory than expected.
For the acidic APIs (a), the analysis showed significant dependencies. The values of log k and its derivatives were found to be directly proportional to the level of protein binding. The correlations were high, especially for log k (R = 0.58) and log k/PB (R = 0.63) (na = 28). It was not possible to construct a single mathematical model built on more than one independent variable due to the very strong relationships between the variables. The acidic group was also characterized by a small number of cases, and the significant correlations of chromatographic variables observed here may depend on the polar nature of acidic drugs (log k and log k/PSA).
The group of neutral APIs (n) consisted of 63 cases. The correlation matrix showed no mutual associations between the chromatographic variables (except log k and log k/PB) but showed a fairly high correlation between log k and PBn (R = 0.58, nn = 63). MLR analysis, performed using the progressive stepwise method, did not improve the result. The combined cases (a) and (n) constituted a larger group, with the number of cases nan = 91. Such structures were most often bound by human serum albumin. This increase in the number of cases did not reduce the correlation between PBan and the independent variable log k: R = 0.57 (nan = 91), and even increased it very slightly. The dependence of PBan on log k/PB: R = 0.57 (nan = 91) also increased. Log and log k/PB remained strongly related, and the subsequent independent variables did not show mutual correlations. This allowed for an attempt to establish multiple regression. Two independent variables appeared in the resulting MLR equation: log k, log k/B2. This model explained 33% of the total variability of the PBan index (R = 0.58).
Chromatographic data from the HPLCHSA column of base APIs (b) were also analyzed. This group consisted of 34 cases (nb = 34). The relationship between the chromatographic data and the level of protein binding was similar to the previous groups, but it seemed more favorable. All independent variables were directly proportional to the PBb value. As no significant correlations were found between the independent variables, they appeared useful. This time, the correlation between log k/PB and PBb was very weak and amounted to only 0.22. The correlation between PBb and the independent variable log k increased to R = 0.63 (nb = 34). This single variable explained 40% of the total variance of PBb. The MLR equation, containing log k and log k/PSA, explained 41% of the variation in PBb (R = 0.64, nb = 34). Increasing the group of bases (b) with neutral drugs (n) caused another change in the observed relationships. The number of cases increased to 100, but the level of correlation with the PBbn index did not change significantly. The chromatographic data and their derivatives were not related to each other. The MLR model built with all independent variables was no better than the correlation between PBbn and log k. The equation was statistically significant, but the result was not satisfactory (R = 0.57, nbn = 100).
2.2. NP and RP Thin-Layer Chromatography Models
The prognostic value of the obtained parameters (variables) were tested in the NP system. The analysis included 129 acid, base and neutral APIs in total, and six independent variables. The correlation matrix indicated no visible relationships between the independent variables. Hence, an MLR mathematical model was created to test the dependence of the PB on the established chromatographic parameters of NP-TLC. MLR analysis was performed using the stepwise method. The model included the following variables: NP, NP/C, NP/PSA and NP/PB. All variables were statistically significant. The correlation for the dependent variable was high (R = 0.90, nabn = 129). The model explained 81% of the total variability of PBabn—Equation (1)—in the group of all tested drugs (a, b, n).
PBabn = 1.23(±0.28) − 0.27(±0.01) NP/PB + 0.58(±0.06) NP + 0.02(±0.008) NP/PSA − 0.61(±0.29) NP/C
R= 0.90; R2 = 0.81 F(4,124) = 136.12; p < 0.0000; s = 0.12549; nabn = 129
Q2LOO = 0.70, SDEP= 0.1569, PRESS =3.1970, SPRESS = 0.1568, Q2LMO = 0.63
A good representation of drug protein binding can be seen in the scatter plot of predicted PB versus observed PB given below (Figure 1).
Chromatographic data, in the form of RM values and their derivatives, showed lower correlation with PBabn. The most important parameter was RMNP (R = 0.26, nabn = 129), which was inversely proportional to protein binding. The attempt to use all independent variables for the MLR analysis confirmed a significantly worse fit of PBabn and RMNP − R = 0.41, nabn = 129.
Further analyses were performed using the cases (a), (b) and (n); the results for each group are presented in Table 2.
Very good results were obtained for the cases from the group of acids (a), with na = 29. The correlation matrix showed a good fit of all variables to PBa and no mutual relationship was found between the independent variables. The NP correlation value increased to R = 0.48. The mathematical model based on the MLR stepwise analysis explained 91% of the total variability in PB in the (a) group. The equation was statistically significant and despite the small number of cases, the result can be considered very good: R = 0.95, na = 29.
Good results were also recorded for basic drugs (b). MLR analysis explained over 91% of the total variation in PBb. The equation was statistically significant and despite a small group of cases, the result can be considered very good: R = 0.96, nb = 34. Scatter plots for PBa, PBb and PBn are given in Appendix A (Figure A1, Figure A2 and Figure A3). Results with RM parameters for (a), (b) and (n) were significantly lower and they are not presented here.
MLR analysis was then performed in the combined groups (ab), (an) and (bn) (Table 3). Alkaline and neutral (bn) compounds account for the largest proportion of all cases, i.e., 100 cases. A mathematical model (Figure 2) was developed for this large group of drugs, which was found to account for 79% of protein binding (R = 0.89, nbn = 100). Thus, the obtained result had a very similar prognostic value to the study of the entire group of cases together. Regarding the calculated RM parameters for this group, the highest correlation with the PBbn index was obtained for RMNP/C (R = 0.24, nbn = 100). After introducing the variables RMNP/C, RMNP/PSA and RMNP/logP, the mathematical model explained only 11% of the variability of PB (R = 0.33, nbn = 100).
The chemicals tested in the two experiments described above were subjected to RP TLC analysis. All cases examined in this experiment comprised a group of 129 compounds. The correlation matrix revealed no relationship between the chromatographic variables of Rf. The independent variables in the model were not related to each other. The model (Equation (2); Figure 3) explained 76% of the variability of the PB index. However, the model yielded a worse result than in the case of the BSA-modified NP stationary phase chromatographic experiment (see Equation (1)). Furthermore, protein binding studies for the entire group of cases with RMRP variables were not conclusive.
PBabn = 0.76(±0.05) + 0.41(±0.07) RP − 0.22(±0.01) RP/PB + 0.004(±0.002) RP/B2
R= 0.87; R2 = 0.76; F(3,125) = 132.78; p < 0.0000; s = 0.14191; nabn = 129
Q2LOO = 0.72, SDEP = 0.1514, PRESS = 2.9392, SPRESS = 0.1509, Q2LMO = 0.72
As before, the statistical analysis was repeated for all three types of cases (a, b, n) and in mixed groups (an, bn, ab). The best MLR results—achieved for (a) and (ab)—are gathered in Table 4.
3. Discussion
The log k variable appears to play a key role in predicting drug-protein binding based on HPLCHSA chromatographic data. This parameter is strongly and directly proportionally correlated with PB. This correlation was observed in the acidic, neutral and basic groups, and in all combinations between them. However, the degree of the correlation changes very slightly for groups of different sizes, with R values within 0.56–0.63 for the number of cases between 27 and 128. The highest value (0.63) was observed for basic drugs (nb = 34). Analysis of the HPLCHSA data also showed that the creation of an independent chromatographic variable containing a PB value (log k/PB) did not directly increase the correlation with the dependent variable PB in any group of cases.
For all groups of cases examined by NP TLC, the chromatographic parameters describe the ability of drugs to bind to proteins, both high (for the observation of Rf data) and low (for RM). This ability was similar for all groups, regardless of significant differences in structure, acid-base character and the group size, i.e., 129, 100, 95, 63, 34 or 29. The correlation coefficient ranged from 0.89 to 0.96. Mathematical models with the participation of Rf variables explained 79–91% of the variability of PB in groups; these most often contained NP, NP/B2 and NP/PB as independent variables. BSA-modified NP TLC analysis appears to provide data (Rf and derivatives) on protein binding for any drug class. RM variables, unfortunately, can be considered of little use in predicting the level of PB. Interestingly, the scatter plot of the observed and predicted PB values highlighted three groups of cases: one with a high level of plasma protein binding, i.e., from 85% to 100%; a medium level of binding, i.e., from 25% to 85%; and a low level, i.e., from 0% to 25%. Reducing the affinity to proteins is also associated with the distance between their predicted values and the trend line.
In the RP TLC analysis, the Rf-related variables were more efficient. These were found to highly correlated with the dependent variable PBb−R = 0.86 (nb = 34), but the equation was not statistically significant. There were three independent variables in the model: RP/C, RP/PSA and RP/PB. The intercept of this equation was also not statistically significant, which proves that such a model cannot be applied. The group of neutral compounds was twice the size (nn = 66); therefore, it was possible to construct an MLR model for the PBn using three RP variables RP/PB, RP/C and RP/logP. The obtained result was good: R = 0.92, coefficient of determination R2 = 0.84. Unfortunately, the intercept in the resulting equation had the wrong parameters, it was not statistically significant and the standard error was 100 times its value. Therefore it cannot be used to predict the dependent variable.
After the RMRP dataset and their derivatives were introduced into the analysis of PBa, PBb and PBn, numerous interrelationships of the independent variables appeared. This significantly reduced the possibilities of the analysis.
When the acidic and neutral drug groups were combined (PBan), the intercept in the resulting equation had the wrong parameters, was not statistically significant and the standard error was equal to its value. Such an equation cannot be used to predict the dependent variable. The use of RMRP data yielded a model with a lower value. The model included only the RMRP/PSA and RMRP2/PB variables. The intercept was not statistically significant, and the equation explained 45% of the total variability of the PBan.
The scatter plots (from the Rf variables) in each of the independent case groups—a, b, and n—in the TLC experiments show a very similar, non-linear shape of the case distribution. The dispersion characteristic is also a representation of the dispersion of all considered cases together (see Figure 1). This distribution causes poorer predictions for drugs with moderate PB values, between 0.4 and 0.7. This suggests that the dependent variable can be mathematically transformed to better fit the model.
An accurate analytical model of the drug in a living organism allows APIs of different structure and properties to be tested. The result should also be resistant to the size of the studied group of cases. A comparison of subsequent analytical models is presented below (Table 5). The research included the entire group of 129 originally tested APIs, (abn), (a), (b), (n), plus 38 external cases (structures and data available in the Supplementary Materials, Tables S5 and S9). APIs from the external group were also divided into acidic (na = 6), basic (nb = 16) and neutral groups (nn = 16) and were subjected to chromatographic experiments under the same conditions.
Fluctuations in the size of the studied groups of cases did not affect the correlations with the dependent variable. All chromatographic experiments with plasma proteins as part of the stationary phase yielded analytical models that were resistant to changes in group size. The best correlation results were obtained with the HPLCHSA experiment. Such a result is obvious because the data of the dependent variable (PB) obtained from the literature concern the binding of drugs to human serum albumin, which is part of the construction of the stationary phase of the HSA column. The remaining experiments were performed with bovine serum albumin. The problem with HPLC data are the poor results of the MLR models, which cannot be used in predicting PB.
4. Materials and Methods
The chromatographic experiments and the methods of data collection are described in detail in Appendix B.
Statistical Modeling and Stepwise Multiple Linear Regression
The goal of multiple linear regression is to quantify the relationship between multiple independent (explanatory) variables and the dependent variable. The protein binding (PB) values were used as dependent variables [10]. Physicochemical properties PSA and log P were calculated in HyperChem (HyperChem for Windows Release 7.02, HyperCube Inc, 2002) and later used to modify the retention data. Computational descriptor B2, which describes the bioavailability in the central nervous system, was calculated from the equation log bb = 0.547 − 0.016 PSA [13]. Acid-base properties were collected from the literature [14].
MLR was performed in stepwise mode, in STATISTICA 13.1 (TIBCO Software Inc.) software. Validation of regression models was performed using general internal cross-validation procedures: “leave-one-out” (LOO) and “leave-many-out” (LMO). In the LOO validation, one case is removed from the dataset and used to verify the model built with the remaining elements; the procedure is then repeated with other elements. In the LMO approach, the dataset is divided into two subsets (25% and 75%), used for model construction and its evaluation, respectively. The prediction power of the models was estimated using the cross-validated squared correlation coefficient (Q2LOO), predicted residual sum of squares (PRESS), standard deviation based on PRESS (SPRESS) and standard deviation of the error of prediction (SDEP). The suggested criteria for predicting the accuracy of MLR models [15] are R2 > 0.6 and Q2 LO(M)O > 0.5; R2 ≥ Q2 LO(M)O and Q2 LOO ≈ Q2 LMO.
5. Conclusions
The great influence of drug–protein binding on pharmacotherapy has resulted in the development of many methods for its evaluation and determination. Such analytical models for the investigation of drug–protein binding in the body can be based on simple laboratory analyses such as TLC or HPLC.
Our findings demonstrate the value of chromatographic data in plasma protein binding studies in general, and for acidic (a), neutral (n) and basic (b) compounds. The correlations observed for the PBabn models, i.e., for all tested compounds together, did not differ significantly from those observed for narrowed groups (a), (b) and (n), despite a much larger number of cases. Additionally, the analytical models were found to be resistant to random effects, which can be noticed while increasing the number of cases in all groups (a, b, n, abn). Interestingly, the drug lipophilicity value (log P) was very small. Log P is considered to be one of the most important determinants of protein binding; however, it was found to be important only for basic compounds (b), which can demonstrate unspecific BSA binding. Of greater importance is the PSA value, related to the ionization of the compounds, and the B2 value, describing penetration into the central nervous system.
Chromatographic data can be important independent variables in mathematical models, especially in combination with physicochemical drug descriptors relevant to PB. However, the main aim of this work was to determine the predicted levels of drug protein binding by comparing different affinity chromatography environments. The best analytical models were obtained using NP TLC with BSA-modified plates, with Rf values and their derivatives. The results were significantly better than those obtained from HPLC using a commercial column with immobilized HSA. In addition, NP TLC, with its relative simplicity and low cost of analysis, can be a useful method for protein binding analysis. In addition, stationary phase modification may provide new options for TLC experiments.
Supplementary Materials
The following are available online at https://www.mdpi.com/1424-8247/14/3/202/s1.
Author Contributions
Conceptualization, E.B. and K.W.; methodology, E.B.; validation, G.Ż.; formal analysis, K.W. and G.Ż.; investigation, K.W. and A.H.; resources, A.H.; data curation, E.B.; writing—original draft preparation, K.W.; writing—review and editing, G.Ż.; visualization, K.W.; supervision, E.B.; project administration, E.B. and K.W.; funding acquisition, E.B. and K.W. All authors have read and agreed to the published version of the manuscript.
Funding
This research was funded by the Medical University of Lodz, under internal grants no. 503/3-016-03/503-31-001.
Institutional Review Board Statement
Not applicable.
Informed Consent Statement
Not applicable.
Data Availability Statement
Not applicable.
Conflicts of Interest
The authors declare no conflict of interest.
Appendix A
Figure A1.
Predicted vs. observed values for MLR model using NP TLC retention data. Dependent variable: PBa.
Figure A1.
Predicted vs. observed values for MLR model using NP TLC retention data. Dependent variable: PBa.

Figure A2.
Predicted vs. observed values for MLR model using NP TLC retention data. Dependent variable: PBb.
Figure A2.
Predicted vs. observed values for MLR model using NP TLC retention data. Dependent variable: PBb.

Figure A3.
Predicted vs. observed values for MLR model using NP TLC retention data. Dependent variable: PBn.
Figure A3.
Predicted vs. observed values for MLR model using NP TLC retention data. Dependent variable: PBn.

Appendix B
Appendix B.1. High-Performance Liquid Chromatography with HSA Column
The HPLC column was purchased from Daicel (CHIRALPAK®HSA, 5 μm; 4 × 10 mm). HPLC analysis was performed on a Perkin Elmer Series 200 apparatus with a UV-VIS spectrometer for detection with an analytical wavelength of 210 nm. The mobile phase consisted of an acetate buffer with pH 7.4:acetonitrile:methanol, 85:10:5 (v/v/v). All solvents used—water, methanol and acetonitrile—were purchased from J.T. Baker (HPLC gradient class). The acetate buffer (10 mM) was prepared by dissolving 0.77 g of ammonium acetate in 1 L of distilled water. The pH was then adjusted with a concentrated ammonia solution.
API solutions in methanol (1 mg/mL, volume of injection: 10 μL) were injected into the HSA column using an automatic autosampler. The flow rate of the mobile phase was 0.9 mL/min. Since the column could not be thermostated, the room temperature was kept constant at 25 degrees Celsius by air conditioning. Chromatographic data (retention factor k and derivative: log k) were obtained for 129 APIs using the TotalChrom software connected to HPLC. Factor k, which is the ratio between the amount of analyte in the stationary phase to the amount in the mobile phase, was obtained from the equation k = (tR − tM)/tM where tR is retention time and tM is void time. The experiment was then repeated, and the collected retention factors (k) were means values from both series.
Figure A4.
Example chromatogram obtained on an HPLC column with HSA immobilized on a stationary phase. In this case, rosuvastatin is presented. The void time marker is methanol (t = 1.63) used to dissolve the APIs’ samples, then the peak of rosuvastatin is visible (t = 3.71).
Figure A4.
Example chromatogram obtained on an HPLC column with HSA immobilized on a stationary phase. In this case, rosuvastatin is presented. The void time marker is methanol (t = 1.63) used to dissolve the APIs’ samples, then the peak of rosuvastatin is visible (t = 3.71).

Appendix B.2. Thin-Layer Chromatography in NP and RP Systems
TLC was performed in normal and reversed phase (NP and RP) systems. Aluminum plates with silica gel (Merck, TLC Silica gel 60 F254) were used in the NP system and aluminum plates with silanized silica gel—RP (Merck, TLC Silica gel 60 RP-2 F254, silanized) were used in the RP system. The stationary phase surface modifying protein was bovine serum albumin. A 2-mg/mL solution of BSA (Sigma Aldrich, Bovine serum albumin lyophilised powder) in distilled water was applied on the surface using Desaga Sprayer SG 1 and air-dried.
Drug solutions in methanol (1 mg/mL) were applied on the plates with the Desaga HPTLC-Applicator AS 30, then the plates were developed in the mobile phase composed of acetonitrile, acetate buffer pH 7.4 and methanol, 60:20:20 (v/v/v). All solvents used—water, methanol and acetonitrile—were purchased from J.T. Baker (HPLC Gradient Grade). The acetate buffer (20mM) was prepared by dissolving 1.54 g of ammonium acetate in 1 L of distilled water. The pH was then adjusted with concentrated ammonia solution.
The mobility of the compounds was initially determined on NP and RP plates without the participation of the protein modifier. These were labeled as controls (C). The obtained retardation factor (Rf) values could be used to determine the composition of the mobile phase, as well as the specific effect of the protein modifier on the mobility of the APIs. The MLR models also used the Rf/C parameter—the ratio of the Rf value on the plates modified with albumin to the Rf value on the plates without albumin. This parameter better reflects the effect of the modifier on the chromatography of each API.
Subsequently, all protein-impregnated and control plates were scanned with a Desaga Densitometer CD 60 and the retardation factor values (Rf) were collected. The analytical wavelength was selected by means of a multi-wavelength scan (values varied between 200 and 300 nm). Another TLC parameter used in analyses was RM, related to Rf:RM = log(1/Rf − 1).Chromatographic data were obtained for 129 drugs in NP and RP TLC experiments (parameters Rf and RM).
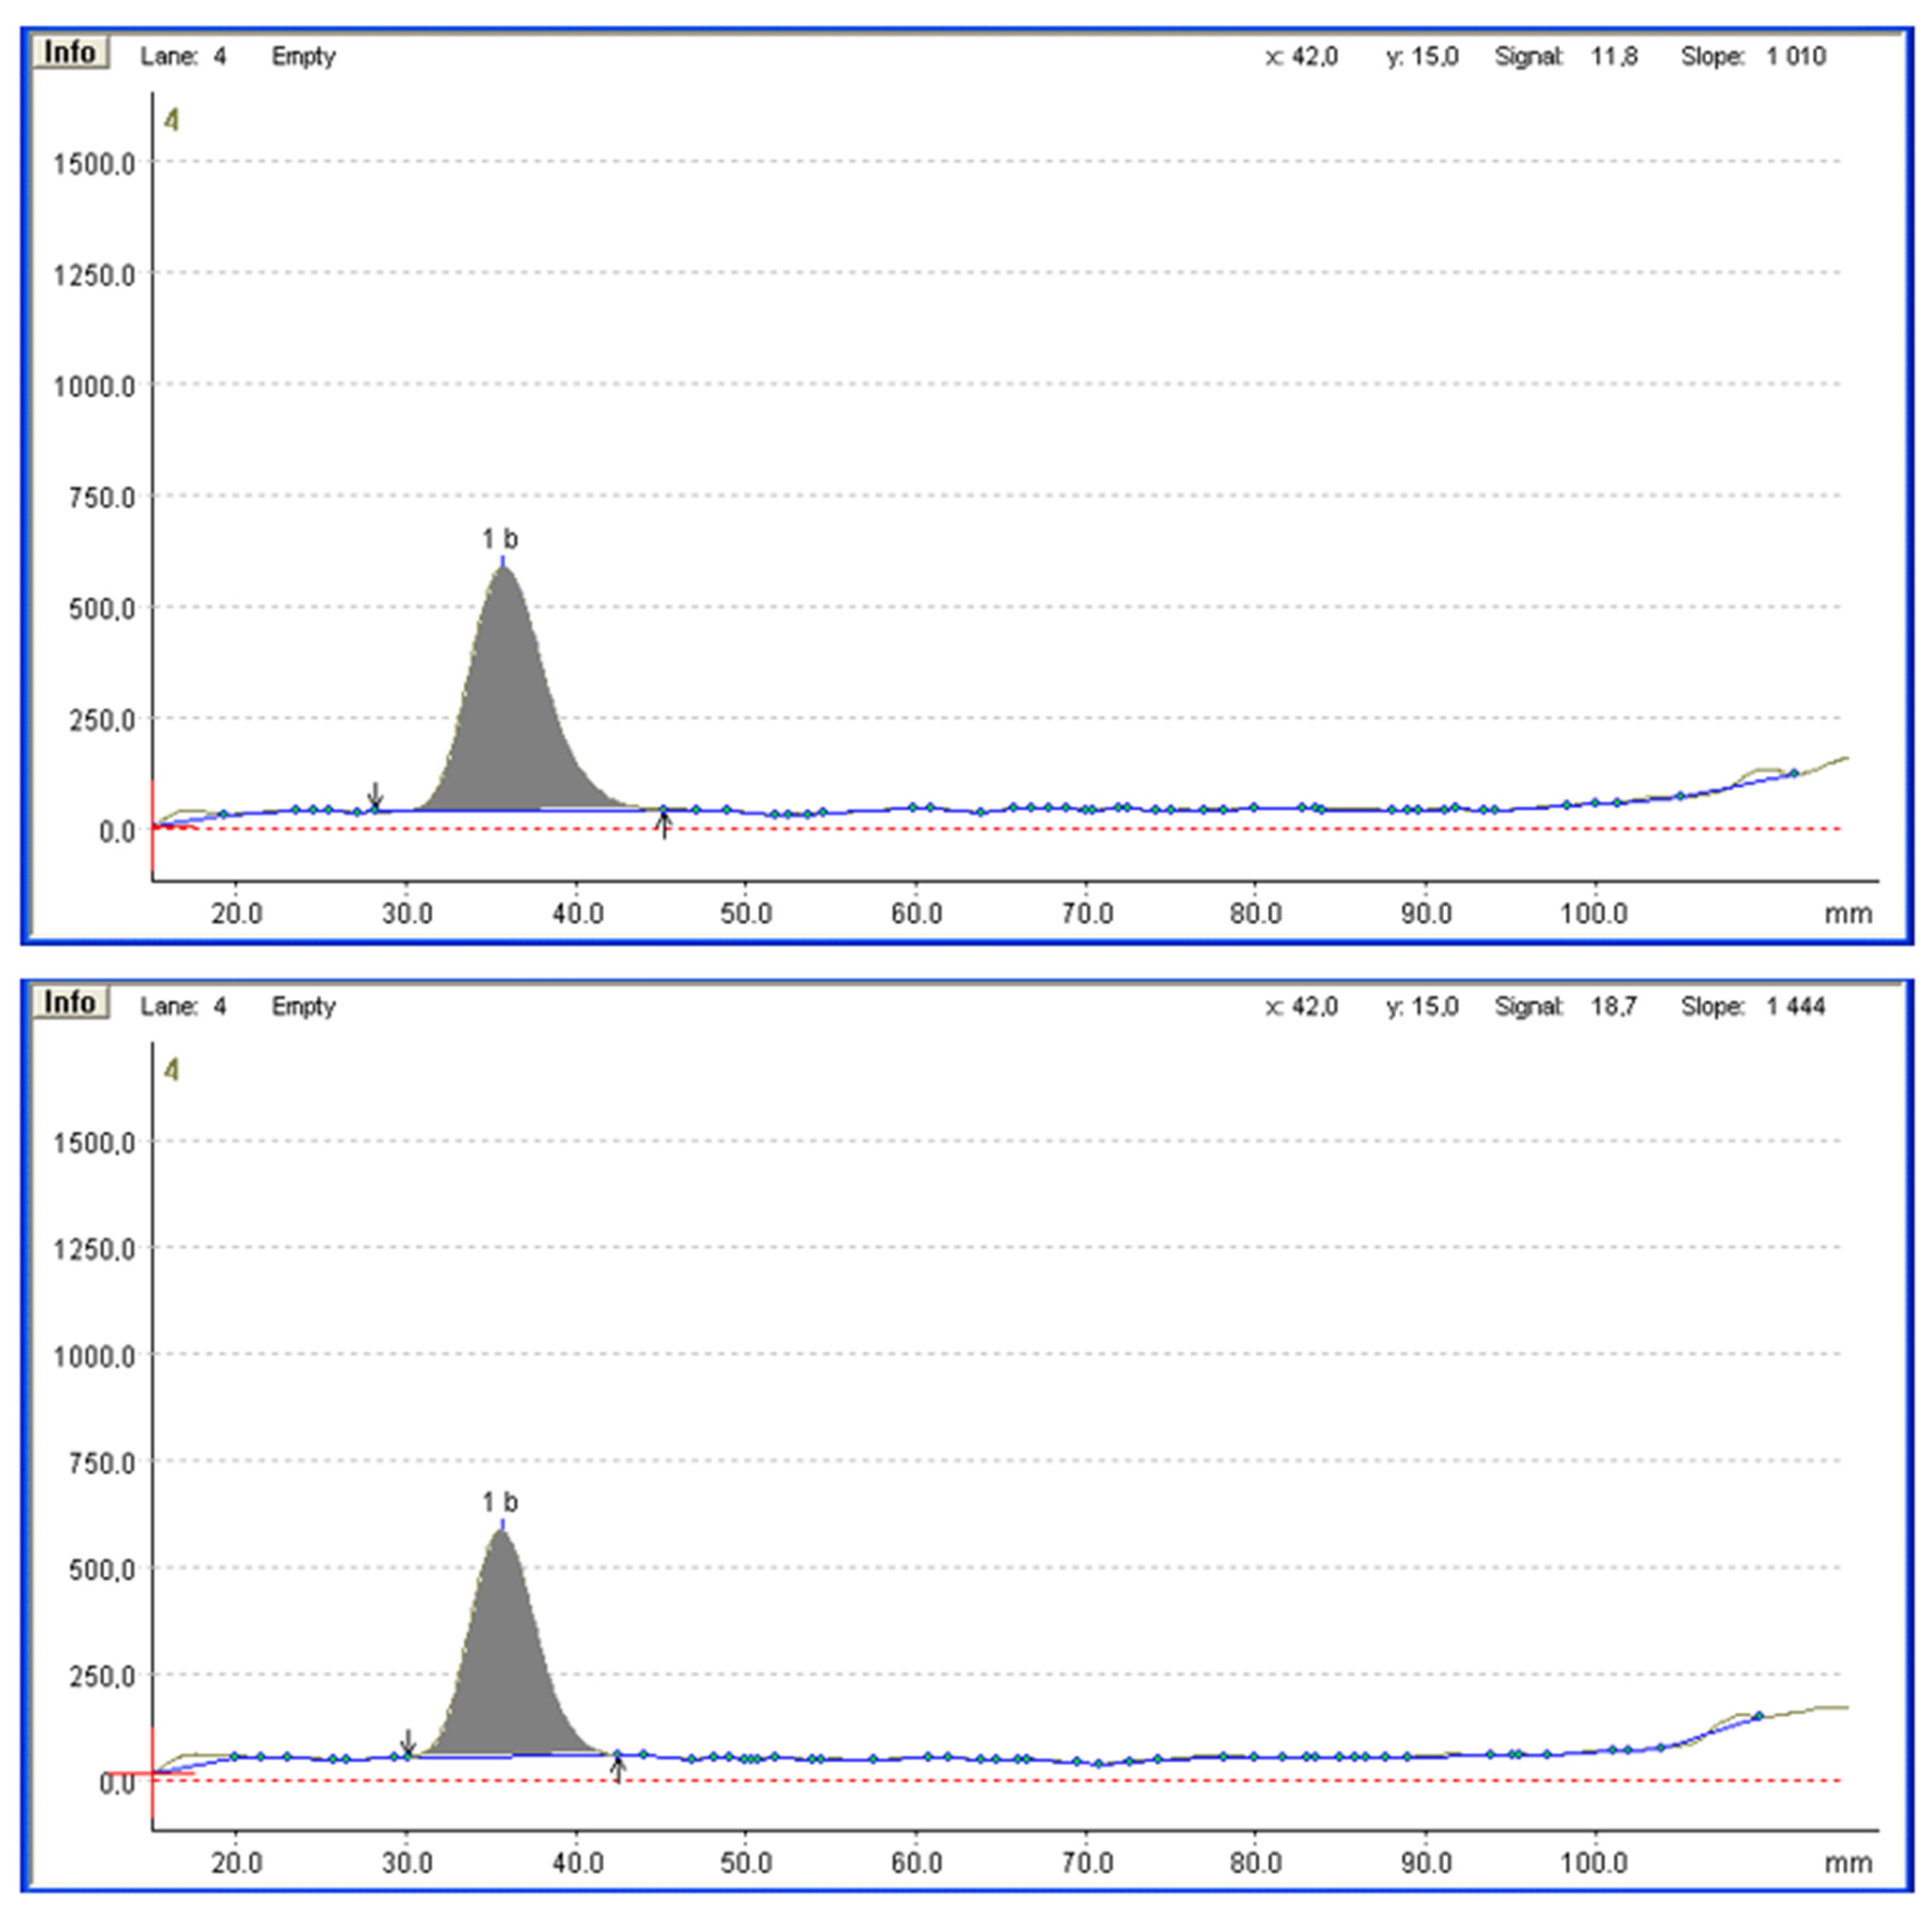
Figure A5.
Example TLC chromatogram, results obtained from control (upper picture) and BSA-impregnated NP plate (lower picture). In this case, doxepin is presented. The measurement was performed using λ = 240 nm. The Rf were 0.34 for the control and 0.31 for the impregnated plate.
Figure A5.
Example TLC chromatogram, results obtained from control (upper picture) and BSA-impregnated NP plate (lower picture). In this case, doxepin is presented. The measurement was performed using λ = 240 nm. The Rf were 0.34 for the control and 0.31 for the impregnated plate.

Appendix B.3. Data Transformation
The log k, Rf and RM values were then transformed by dividing them by the following molecular descriptors—B2, the ability of the drug to penetrate the blood-brain barrier [13]; PSA, the drug’s polar surface area; logP, the drug’s lipophilicity; PB, the percentage of the drug fraction associated with the protein. The datasets and API structures are available in the Supplementary Materials (Tables S1–S4 and S6–S8). Chromatographic parameters and their derivatives were used in analyses as independent variables (Table 1).
References
- Kratz, F.; Elsadek, B. Clinical impact of serum proteins on drug delivery. J. Control. Release 2012, 161, 429–445. [Google Scholar] [CrossRef] [PubMed]
- Buscher, B.; Laakso, S.; Mascher, H.; Pusecker, K.; Doig, M.; Dillen, L.; Wagner-Redeker, W.; Pfeifer, T.; Delrat, P.; Timmerman, P. Bioanalysis for plasma protein binding studies in drug discovery and drug development: Views and recommendations of the European Bioanalysis Forum. Bioanalysis 2014, 6, 673–682. [Google Scholar] [CrossRef] [PubMed] [Green Version]
- Toma, C.; Gadaleta, D.; Roncaglioni, A.; Toropov, A.; Toropova, A.; Marzo, M.; Benfenati, E. QSAR Development for Plasma Protein Binding: Influence of the Ionization State. Pharm. Res. 2019, 36, 1–9. [Google Scholar] [CrossRef] [PubMed] [Green Version]
- Ghafourian, T.; Amin, Z. QSAR models for the prediction of plasma protein binding. BioImpacts 2013, 3, 21–27. [Google Scholar] [CrossRef] [PubMed]
- Li, H.; Chen, Z.; Xu, X.; Sui, X.; Guo, T.; Liu, W.; Zhang, J. Predicting human plasma protein binding of drugs using plasma protein interaction QSAR analysis (PPI-QSAR). Biopharm. Drug Dispos. 2011, 32, 333–342. [Google Scholar] [CrossRef] [PubMed]
- Sun, H.; Zhao, H. Physiologic Drug Distribution and Protein Binding. In Applied Biopharmaceutics & Pharmacokinetics; McGraw-Hill Education: New York, NY, USA, 2016; p. 259. ISBN 978-0-07-182964-9. [Google Scholar]
- Dargó, G.; Bajusz, D.; Simon, K.; Müller, J.; Balogh, G.T. Human Serum Albumin Binding in a Vial: A Novel UV-pH Titration Method to Assist Drug Design. J. Med. Chem. 2020, 63, 1763–1774. [Google Scholar] [CrossRef] [PubMed] [Green Version]
- Guizado, T.R.C. Analysis of the structure and dynamics of human serum albumin. J. Mol. Model. 2014, 20, 1–13. [Google Scholar] [CrossRef] [PubMed]
- Salary, M.; Hadjmohammadi, M. Human serum albumin-mimetic chromatography based hexadecyltrimethylammonium bromide as a novel direct probe for protein binding of acidic drugs. J. Pharm. Biomed. Anal. 2015, 114, 1–7. [Google Scholar] [CrossRef] [PubMed]
- Drugbank. Available online: https://www.drugbank.ca/drugs/DB01174 (accessed on 20 November 2019).
- Ayranci, E.; Duman, O. Binding of fluoride, bromide and iodide to bovine serum albumin, studied with ion-selective electrodes. Food Chem. 2004, 84, 539–543. [Google Scholar] [CrossRef]
- Ma, G.J.; Ferhan, A.R.; Jackman, J.A.; Cho, N.-J. Conformational flexibility of fatty acid-free bovine serum albumin proteins enables superior antifouling coatings. Commun. Mater. 2020, 1, 45. [Google Scholar] [CrossRef]
- Clark, D.E. Rapid calculation of polar molecular surface area and its application to the prediction of transport phenomena. 2. Prediction of blood-brain barrier penetration. J. Pharm. Sci. 1999, 88, 815–821. [Google Scholar] [CrossRef] [PubMed]
- Chembl Database. Available online: https://www.ebi.ac.uk/chembl/ (accessed on 20 November 2019).
- Tropsha, A. Best practices for QSAR model development, validation, and exploitation. Mol. Inform. 2010, 29, 476–488. [Google Scholar] [CrossRef] [PubMed]
Figure 1.
Predicted vs. observed values for the multiple linear regression (MLR) model using NP TLC retention data. Dependent variable: PBabn.
Figure 1.
Predicted vs. observed values for the multiple linear regression (MLR) model using NP TLC retention data. Dependent variable: PBabn.

Figure 2.
Predicted vs. observed values for the MLR model using NP TLC retention data. Dependent variable: PBbn.
Figure 2.
Predicted vs. observed values for the MLR model using NP TLC retention data. Dependent variable: PBbn.

Figure 3.
Predicted vs. observed values for MLR model using RP TLC retention data. Dependent variable: PBabn.
Figure 3.
Predicted vs. observed values for MLR model using RP TLC retention data. Dependent variable: PBabn.


Table 1.
Chromatographic parameters from normal phase/reverse phase thin-layer liquid chromatography (NP/RP TLC) and HPLCHSA experiments and their derivatives used in the analysis of analytical models as independent variables.
Table 1.
Chromatographic parameters from normal phase/reverse phase thin-layer liquid chromatography (NP/RP TLC) and HPLCHSA experiments and their derivatives used in the analysis of analytical models as independent variables.
| Chromatographic Parameter or the Derivative | Description |
|---|---|
| NP; RP | The Rf, obtained in TLC chromatography on the bovine serum albumin (BSA)-impregnated plates, in normal and reversed mode, respectively |
| NP/C; RP/C | The Rf from BSA-impregnated NP or RP plates/the Rf from a clean plate |
| NP/PSA; RP/PSA | The Rf from BSA-impregnated NP or RP plate/polar surface area |
| NP/PB; RP/PB | The Rf from BSA-impregnated NP or RP plate/protein binding value |
| NP/logP; RP/logP | The Rf from BSA-impregnated NP or RP plate/partition coefficient |
| NP/B2; RP/B2 | The Rf from BSA-impregnated NP or RP plate/computational parameter B2, describes the bioavailability in the central nervous system |
| RMNP; RMRP | The RM, obtained in TLC chromatography on the BSA-impregnated plates, in normal and reversed mode, respectively |
| RMNP/C; RMRP/C | The RM from BSA-impregnated NP or RP plate/the RM from a clean plate |
| RMNP/PSA; RMRP/PSA | The RM from BSA-impregnated NP or RP plate/polar surface area |
| RMNP/PB; RMRP/PB | The RM from BSA-impregnated NP or RP plate/protein binding value |
| RMNP/logP; RMRP/logP | The RM from BSA-impregnated NP or RP plate/partition coefficient |
| RMNP/B2; RMRP/B2 | The RM from BSA-impregnated NP or RP plate/computational parameter B2, describes the bioavailability in the central nervous system |
| log k | logarithm of retention factor from HPLCHSA |
| log k/PSA | logarithm of retention factor from HPLCHSA/polar surface area |
| log k/PB | logarithm of retention factor from HPLCHSA/protein binding value |
| log k/logP | logarithm of retention factor from HPLCHSA/partition coefficient |
| log k/B2 | logarithm of retention factor from HPLCHSA/computational parameter B2, describes the bioavailability in the central nervous system |
Table 2.
MLR models for acidic (a), basic (b) and neutral (n) active pharmaceutical ingredients (APIs) using NP TLC retention data.
Table 2.
MLR models for acidic (a), basic (b) and neutral (n) active pharmaceutical ingredients (APIs) using NP TLC retention data.
| No of Cases | Stepwise Multivariate Linear Regression Model | MLR Model Parameters |
|---|---|---|
| a na = 29 | PBa = −2.99(±1.23) + 0.48(±0.10) NP + 3.53(±1.26) NP/C + 0.15(±0.04) NP/PSA − 0.21(±0.02) NP/PB | R = 0.95; R2 = 0.91; F(4,24) = 57.434; p < 0.0000; s = 0.09925 Q2LOO = 0.81, SDEP = 0.1308, PRESS = 0.5376, SPRESS = 0.1362, Q2LMO = 0.81 |
| b nb = 34 | PBb = 0.76(±0.054) + 0.88(±0.11) NP − 0.54(±0.03) NP/PB | R = 0.96; R2 = 0.91; F(2,31) = 160.74; p <0.0000; s = 0.09437 Q2LOO = 0.88, SDEP= 0.1063, PRESS = 0.3636, SPRESS = 0.1034, Q2LMO = 0.86 |
| n nn = 66 | PBn = 0.80(±0.05) + 0.44(±0.06) NP − 0.29(±0.02) NP/PB | R= 0.90; R2 = 0.81; F(2,64) = 133.29; p < 0.0000; s = 0.11958 Q2LOO = 0.77, SDEP = 0.1298, PRESS = 1.0890, SPRESS = 0.1285, Q2LMO = 0.76 |
Table 3.
MLR models for combined groups of APIs: (bn), (an) and (ab) using NP TLC retention data.
| No of Cases | Stepwise Multivariate Linear Regression Model | MLR Model Parameters |
|---|---|---|
| bn nbn = 100 | PBbn = 0.74(±0.037) + 0.56(±0.06) NP − 0.34(±0.02) NP/PB | R= 0.88; R2 = 0.78, F(2,97) = 174.29; p < 0.0000; s = 0.1339 Q2LOO = 0.75, SDEP = 0.1420, PRESS = 1.9875, SPRESS = 0.1410, Q2LMO = 0.75 |
| an nan = 95 | PBan = 0.74(±0.05) + 0.49(±0.05) NP − 0.26(±0.01) NP/PB + 0.01(±0.00) NP/B2 | R= 0.89; R2 = 0.76, F(3,91) = 111.21; p <0.0000; s = 0.13042 Q2LOO = 0.70, SDEP = 0.1504, PRESS =2.2123, SPRESS = 0.1526, Q2LMO = 0.69 |
| ab nab = 63 | PBab = 1.39(±0.41) + 0.80(±0.09) NP − 0.30(±0.02) NP/PB + 0.01(±0.00) NP/B2 + 0.03(±0.01) NP/PSA − 0.89(±0.43) NP/C | R= 0.89; R2 = 0.80, F(5,57) = 44.235; p < 0.0000; s = 0.14432 Q2LOO = 0.63, SDEP = 0.1883, PRESS = 2.6723, SPRESS = 0.2060, Q2LMO = 0.63 |
Table 4.
MLR models for acidic drugs (a) and combined group of APIs (ab) using RP TLC retention data.
Table 4.
MLR models for acidic drugs (a) and combined group of APIs (ab) using RP TLC retention data.
| No of Cases | Stepwise Multivariate Linear Regression Model | MLR Model Parameters | |
|---|---|---|---|
| a na = 29 | PBa = 0.68(±0.09) + 0.43(±0.12) RP − 0.23(±0.02) RP/PB + 0.01(±0.00) RP/B2 + 0.10(±0.04) RP/PSA | R= 0.93; R2 = 0.86; F(4,24) = 36.4743; p < 0.0000; s = 0.1213 Q2LOO = 0.74, SDEP = 0.1541, PRESS = 0.8425, SPRESS = 0.1704, Q2LMO = 0.74 | |
| ab nab = 63 | PBab = 0.71(±0.07) + 0.46(±0.10) RP − 0.21(±0.02) RP/PB | R= 0.85; R2 = 0.73; F(2,60) = 80.471; p < 0.00000; s = 0.16193 Q2LOO = 0.67, SDEP = 0.1772, PRESS = 1.9589, SPRESS = 0.1763, Q2LMO = 0.62 | |
Table 5.
Correlation of chromatographic parameters (log k and Rf from NP and RP TLC) with protein binding values. Relations were made for originally tested APIs (129 drugs) and for enlarged groups with external cases (+38 drugs).
Table 5.
Correlation of chromatographic parameters (log k and Rf from NP and RP TLC) with protein binding values. Relations were made for originally tested APIs (129 drugs) and for enlarged groups with external cases (+38 drugs).
| Group | n | log k *** | NP *** | RP *** | |
|---|---|---|---|---|---|
| a | Tested * | 29 | 0.63 | 0.48 | 0.09 |
| +external ** | 35 | 0.49 | 0.56 | 0.16 | |
| n | tested | 65 | 0.60 | 0.09 | −0.32 |
| +external | 80 | 0.67 | 0.07 | −0.24 | |
| b | tested | 34 | 0.67 | 0.22 | −0.37 |
| +external | 50 | 0.63 | 0.03 | −0.45 | |
| bn | tested | 99 | 0.56 | 0.17 | −0.28 |
| +external | 131 | 0.63 | 0.09 | −0.28 | |
| an | tested | 94 | 0.59 | 0.21 | −0.15 |
| +external | 115 | 0.58 | 0.22 | −0.09 | |
| ab | tested | 63 | 0.61 | 0.37 | −0.05 |
| +external | 85 | 0.54 | 0.31 | −0.01 | |
| abn | tested | 129 | 0.58 | 0.24 | −0.16 |
| +external | 165 | 0.57 | 0.20 | −0.16 | |
*—originally tested APIs. **—originally tested APIs + external drugs. ***—correlation with PB.
Publisher’s Note: MDPI stays neutral with regard to jurisdictional claims in published maps and institutional affiliations. |
© 2021 by the authors. Licensee MDPI, Basel, Switzerland. This article is an open access article distributed under the terms and conditions of the Creative Commons Attribution (CC BY) license (http://creativecommons.org/licenses/by/4.0/).
Share and Cite
MDPI and ACS Style
Wanat, K.; Żydek, G.; Hekner, A.; Brzezińska, E. In Silico Plasma Protein Binding Studies of Selected Group of Drugs Using TLC and HPLC Retention Data. Pharmaceuticals 2021, 14, 202. https://doi.org/10.3390/ph14030202
AMA Style
Wanat K, Żydek G, Hekner A, Brzezińska E. In Silico Plasma Protein Binding Studies of Selected Group of Drugs Using TLC and HPLC Retention Data. Pharmaceuticals. 2021; 14(3):202. https://doi.org/10.3390/ph14030202
Chicago/Turabian StyleWanat, Karolina, Grażyna Żydek, Adam Hekner, and Elżbieta Brzezińska. 2021. "In Silico Plasma Protein Binding Studies of Selected Group of Drugs Using TLC and HPLC Retention Data" Pharmaceuticals 14, no. 3: 202. https://doi.org/10.3390/ph14030202
Note that from the first issue of 2016, this journal uses article numbers instead of page numbers. See further details here.