
A Review of Advances in Bioanalytical Methods for the Detection and Quantification of Olanzapine and Its Metabolites in Complex Biological Matrices

Abstract
:1. Introduction
2. Matrix
3. Sample Preparation
3.1. Protein Precipitation (PPT)
3.2. Liquid–Liquid Extraction (LLE)
3.3. Supported Liquid Extraction (SLE)
3.4. Solid-Phase Extraction (SPE)
3.5. Micro Extraction by Packed Sorbent
3.6. Dispersive Pipette XTRaction (DPX)
3.7. Hybrid SPE–Precipitation (Hybrid SPE-PPT)
3.8. On-Line SPE
4. Separation Methods and Detection
4.1. Liquid Chromatography (LC)
4.1.1. Liquid Chromatography and Electrochemical Detection (ECD)
4.1.2. Liquid Chromatography, Ultraviolet Detection (UV), and Diode Array Detection (DAD)
4.1.3. Liquid Chromatography Coupled with Mass Spectrometry (MS) and Tandem Mass Spectrometry (MS/MS)
4.2. Gas Chromatography (GC)
4.2.1. Gas Chromatography Coupled with Mass Spectrometry (MS) and Tandem Mass Spectrometry (MS/MS)
4.2.2. Gas Chromatography with a Nitrogen Phosphorus Detector (NPD)
4.3. Comparison of Bioanalysis Methods
5. Stability
6. Conclusions
Author Contributions
Funding
Institutional Review Board Statement
Informed Consent Statement
Data Availability Statement
Conflicts of Interest
References
- Reutzel-Edens, S.M.; Bush, J.K.; Magee, P.A.; Stephenson, G.A.; Byrn, S.R. Anhydrates and Hydrates of Olanzapine: Crystallization, Solid-State Characterization, and Structural Relationships. Cryst. Growth Des. 2003, 3, 897–907. [Google Scholar] [CrossRef]
- Braslow, J.T.; Marder, S.R. History of Psychopharmacology. Annu. Rev. Clin. Psychol. 2019, 15, 25–50. [Google Scholar] [CrossRef]
- Raggi, M.A.; Mandrioli, R.; Sabbioni, C.; Pucci, V. Atypical antipsychotics: Pharmacokinetics, therapeutic drug monitoring and pharmacological interactions. Curr. Med. Chem. 2004, 11, 279–296. [Google Scholar] [CrossRef]
- Fulton, B.; Goa, K.L. Olanzapine. A review of its pharmacological properties and therapeutic efficacy in the management of schizophrenia and related psychoses. Drugs 1997, 53, 281–298. [Google Scholar] [CrossRef]
- Olesen, O.V.; Linnet, K. Olanzapine Serum Concentrations in Psychiatric Patients Given Standard Doses: The Influence of Comedication. Ther. Drug Monit. 1999, 21, 87–90. [Google Scholar] [CrossRef]
- Ring, B.J.; Binkley, S.N.; Vandenbranden, M.; Wrighton, S.A. In vitro interaction of the antipsychotic agent olanzapine with human cytochromes P450 CYP2C9, CYP2C19, CYP2D6 and CYP3A. Br. J. Clin. Pharmacol. 1996, 41, 181–186. [Google Scholar] [CrossRef]
- Callaghan, J.T.; Bergstrom, R.F.; Ptak, L.R.; Beasley, C.M. Olanzapine. Pharmacokinetic and pharmacodynamic profile. Clin. Pharmacokinet. 1999, 37, 177–193. [Google Scholar] [CrossRef]
- Bymaster, F.P.; Calligaro, D.O.; Falcone, J.F.; Marsh, R.D.; Moore, N.A.; Tye, N.C.; Seeman, P.; Wong, D.T. Radioreceptor binding profile of the atypical antipsychotic olanzapine. Neuropsychopharmacology 1996, 14, 87–96. [Google Scholar] [CrossRef]
- Bymaster, F.; Perry, K.; Nelson, D.; Wong, D.; Rasmussen, K.; Moore, N.; Calligaro, D. Olanzapine: A basic science update. Br. J. Psychiatry Suppl. 1999, 37, 36–40. [Google Scholar] [CrossRef]
- Spielmans, G.I. The promotion of olanzapine in primary care: An examination of internal industry documents. Soc. Sci. Med. 2009, 69, 14–20. [Google Scholar] [CrossRef]
- Koller, D.; Almenara, S.; Mejía, G.; Saiz-Rodríguez, M.; Zubiaur, P.; Román, M.; Ochoa, D.; Navares-Gómez, M.; Santos-Molina, E.; Pintos-Sánchez, E.; et al. Metabolic Effects of Aripiprazole and Olanzapine Multiple-Dose Treatment in a Randomised Crossover Clinical Trial in Healthy Volunteers: Association with Pharmacogenetics. Adv. Ther. 2021, 38, 1035–1054. [Google Scholar] [CrossRef]
- Nasrallah, H. A review of the effect of atypical antipsychotics on weight. Psychoneuroendocrinology 2003, 28, 83–96. [Google Scholar] [CrossRef]
- Patteet, L.; Maudens, K.E.; Stove, C.P.; Lambert, W.E.; Morrens, M.; Sabbe, B.; Neels, H. The use of dried blood spots for quantification of 15 antipsychotics and 7 metabolites with ultra-high performance liquid chromatography—Tandem mass spectrometry. Drug Test. Anal. 2015, 7, 502–511. [Google Scholar] [CrossRef]
- Ruggiero, C.; Ramirez, S.; Ramazzotti, E.; Mancini, R.; Muratori, R.; Raggi, M.A.; Conti, M. Multiplexed therapeutic drug monitoring of antipsychotics in dried plasma spots by LC-MS/MS. J. Sep. Sci. 2020, 43, 1440–1449. [Google Scholar] [CrossRef]
- Patteet, L.; Cappelle, D.; Maudens, K.E.; Crunelle, C.L.; Sabbe, B.; Neels, H. Advances in detection of antipsychotics in biological matrices. Clin. Chim. Acta 2015, 20, 11–22. [Google Scholar] [CrossRef]
- Dinis-Oliveira, R.J.; Carvalho, F.; Duarte, J.A.; Remião, F.; Marques, A.; Santos, A.; Magalhães, T. Collection of biological samples in forensic toxicology. Toxicol. Mech. Methods 2010, 20, 363–414. [Google Scholar] [CrossRef]
- Barbosa, J.; Faria, J.; Carvalho, F.; Pedro, M.; Queirós, O.; Moreira, R.; Dinis-Oliveira, R.J. Hair as an alternative matrix in bioanalysis. Bioanalysis 2013, 5, 895–914. [Google Scholar] [CrossRef]
- Elmongy, H.; Abdel-Rehim, M. Saliva as an alternative specimen to plasma for drug bioanalysis: A review. Trends Anal. Chem. 2016, 83, 70–79. [Google Scholar] [CrossRef]
- Patteet, L.; Maudens, K.E.; Morrens, M.; Sabbe, B.; Dom, G.; Neels, H. Determination of Common Antipsychotics in Quantisal-Collected Oral Fluid by UHPLC-MS/MS: Method Validation and Applicability for Therapeutic Drug Monitoring. Ther. Drug Monit. 2016, 38, 87–97. [Google Scholar] [CrossRef]
- Tan, A.; Boudreau, N.; Lévesque, A. Internal Standards in LC-MS Bioanalysis. In Handbook of LC-MS Bioanalysis, 1st ed.; Li, W., Zhang, J., Tse, F.L.S., Eds.; John Wiley & Sons Inc.: Hoboken, NJ, USA, 2013; Volume 1, pp. 217–227. [Google Scholar]
- Stokvis, E.; Rosing, H.; Beijnen, J. Stable isotopically labeled internal standards in quantitative bioanalysis using liquid chromatography/mass spectrometry: Necessity or not? Rapid Commun. Mass Spectrom. 2005, 19, 401–407. [Google Scholar] [CrossRef]
- Lanckmans, K.; Sarre, S.; Smolders, I.; Michotte, Y. Use of a structural analogue versus a stable isotope labeled internal standard for the quantification of angiotensin IV in rat brain dialysates using nano-liquid chromatography/tandem mass spectrometry. Rapid Commun. Mass Spectrom. 2007, 21, 1187–1195. [Google Scholar] [CrossRef]
- Wells, D.A. Protein precipitation: High throughput techniques and strategies for method development. In Progress in Pharmaceutical and Biomedical Analysis, 1st ed.; Wells, D.A., Ed.; Elsevier: Amsterdam, The Netherlands, 2003; Volume 5, pp. 199–254. [Google Scholar]
- Castro-Perez, J.; Prakash, C. Recent advances in mass spectrometric and other analytical techniques for the identification of drug metabolites. In Identification and Quantification of Drugs, Metabolites, Drug Metabolizing Enzymes, and Transporters, 2nd ed.; Ma, S., Chowdhury, S.K., Eds.; Elsevier Science; Elsevier, B.V.: Amsterdam, The Netherlands, 2020; Volume 2, pp. 39–71. [Google Scholar]
- Cao, Y.; Zhao, F.; Chen, J.; Huang, T.; Zeng, J.; Wang, L.; Sun, X.; Miao, Y.; Wang, S.; Chen, C. A simple and rapid LC-MS/MS method for the simultaneous determination of eight antipsychotics in human serum, and its application to therapeutic drug monitoring. J. Chromatogr. B. Analyt. Technol. Biomed. Life Sci. 2020, 1147, 122129. [Google Scholar] [CrossRef]
- Ansermot, N.; Brawand-Amey, M.; Kottelat, A.; Eap, C.B. Fast quantification of ten psychotropic drugs and metabolites in human plasma by ultra-high performance liquid chromatography tandem mass spectrometry for therapeutic drug monitoring. J. Chromatogr. A 2013, 1292, 160–172. [Google Scholar] [CrossRef]
- Lou, H.G.; Ruan, Z.R.; Jiang, B.; Chen, J.L. Simultaneous quantification of olanzapine and its metabolite N-desmethylolanzapine in human plasma by liquid chromatography tandem mass spectrometry for therapeutic drug monitoring. Biomed. Chromatogr. 2015, 29, 671–678. [Google Scholar] [CrossRef]
- Stone, J. Sample preparation techniques for mass spectrometry in the clinical laboratory. In Mass Spectrometry for the Clinical Laboratory, 1st ed.; Nair, H., Clarke, W., Eds.; Academic Press: Cambridge, MA, USA; Elsevier Inc.: New York, NY, USA, 2017; Volume 1, pp. 37–62. [Google Scholar]
- Andreassen, T.N.; Falcha, B.M.H.; Spigset, O. A UPLC–MSMS method for the analysis of olanzapine in serum—With particular emphasis on drug stability testing. J. Chromatogr. B Analyt. Technol. Biomed. Life Sci. 2015, 1006, 112–120. [Google Scholar] [CrossRef]
- Berk, Z. Liquid-liquid separation. In Food Process Engineering and Technology, 3rd ed.; Academic Press: Cambridge, MA, USA; Elsevier Inc.: New York, NY, USA, 2018; Volume 3, pp. 224–225. [Google Scholar]
- Humbert, L.; Hoizey, G.; Lhermitte, M. Drugs Involved in Drug-Facilitated Crimes (DFC): Analytical Aspects: 1-Blood and Urine. In Toxicological Aspects of Drug-Facilitated Crimes, 1st ed.; Kintz, P., Ed.; Academic Press: Cambridge, MA, USA; Elsevier Inc.: New York, NY, USA, 2014; Volume 1, pp. 159–176. [Google Scholar]
- Ni, X.J.; Wang, Z.Z.; Shang, D.W.; Lu, H.Y.; Zhang, M.; Wen, Y.G. Simultaneous analysis of olanzapine, fluoxetine, and norfluoxetine in human plasma using liquid chromatography-mass spectrometry and its application to a pharmacokinetic study. J. Chromatogr. B Analyt. Technol. Biomed. Life Sci. 2018, 1092, 506–514. [Google Scholar] [CrossRef]
- Miroshnichenko, I.I.; Baymeeva, N.V. Simultaneous Determination of Antipsychotic Drugs and Their Active Metabolites by LC–MS-MS and its Application to Therapeutic Drug Monitoring. J. Chromatogr. Sci. 2018, 56, 510–517. [Google Scholar] [CrossRef]
- Nirogi, R.V.S.; Kandikere, V.N.; Shukla, M.; Mudigonda, K.; Maurya, S.; Boosi, R.; Yerramilli, A. Development and validation of a sensitive liquid chromatography/electrospray tandem mass spectrometry assay for the quantification of olanzapine in human plasma. J. Pharm. Biomed. Anal. 2006, 41, 935–942. [Google Scholar] [CrossRef]
- Zhou, Z.; Li, X.; Li, K.; Xie, Z.; Cheng, Z.; Peng, W.; Wang, F.; Zhu, R.; Li, H. Simultaneous determination of clozapine, olanzapine, risperidone and quetiapine in plasma by high-performance liquid chromatography-electrospray ionization mass spectrometry. J. Chromatogr. B Analyt. Technol. Biomed. Life Sci. 2004, 802, 257–262. [Google Scholar] [CrossRef]
- Olesen, O.V.; Linnet, K. Determination of olanzapine in serum by high-performance liquid chromatography using ultraviolet detection considering the easy oxidability of the compound and the presence of other psychotropic drugs. J. Chromatogr. B Analyt. Technol. Biomed. Life Sci. 1998, 714, 309–315. [Google Scholar] [CrossRef]
- D’Arrigo, C.; Migliardi, G.; Santoro, V.; Spina, E. Determination of Olanzapine in Human Plasma by Reversed-phase High-performance Liquid Chromatography with Ultraviolet Detection. Ther. Drug Monit. 2006, 28, 388–393. [Google Scholar] [CrossRef]
- Titier, K.; Bouchet, S.; Pehourcq, F.; Moore, N.; Molimard, M. High-performance liquid chromatographic method with diode array detection to identify and quantify atypical antipsychotics and haloperidol in plasma after overdose. J. Chromatogr. B Analyt. Technol. Biomed. Life Sci. 2003, 788, 179–185. [Google Scholar] [CrossRef]
- Ravinder, A.; Bapuji, A.T.; Mukkanti, K.; Reddy, D.C. Simultaneous determination of olanzapine and fluoxetine in human plasma by LC-MS/MS and its application to pharmacokinetic study. J. Liq. Chromatogr. Relat. 2013, 36, 2651–2668. [Google Scholar] [CrossRef]
- da Mota Castelo Branco, D.; Tavares Cavalcanti Bedor, N.C.; Santos Silva, C.; Galindo Bedor, D.C.; Pimentel, M.F.; de Santana, D.P. Quality by design applied to olanzapine and quetiapine LC-MS/MS bioanalysis. J. Chromatogr. Sci. 2020, 58, 117–126. [Google Scholar] [CrossRef]
- Degreef, M.; Berry, E.M.; Maudens, K.E.K.; van Nuijs, A.L.N. Multi-analyte LC-MS/MS quantification of 38 antipsychotics and metabolites in plasma: Method validation & application to routine analyses. J. Chromatogr B Analyt. Technol. Biomed. Life Sci. 2021, 1179, 122867. [Google Scholar]
- Boulton, D.W.; Markowitz, J.S.; DeVane, C.L. A high-performance liquid chromatography assay with ultraviolet detection for olanzapine in human plasma and urine. J. Chromatogr. B Biomed. Sci. Appl. 2001, 759, 319–323. [Google Scholar] [CrossRef]
- Cao, J.; Zhang, Z.; Tian, Y.; Li, Y.; Rui, J. Liquid Chromatography-Mass Spectrometry Method for the Determination of Olanzapine in Human Plasma and Application to a Bioequivalence Study. Curr. Pharm. Anal. 2012, 8, 247–254. [Google Scholar] [CrossRef]
- Dusci, L.J.; Hackett, L.P.; Fellows, L.M.; Ilett, K.F. Determination of olanzapine in plasma by high-performance liquid chromatography using ultraviolet absorbance detection. J. Chromatogr. B Analyt. Technol. Biomed. Life Sci. 2002, 773, 191–197. [Google Scholar] [CrossRef]
- Berna, M.; Ackermann, B.; Ruterbories, K.; Glass, S. Determination of olanzapine in human blood by liquid chromatography–tandem mass spectrometry. J. Chromatogr. B Analyt. Technol. Biomed. Life Sci. 2002, 767, 163–168. [Google Scholar] [CrossRef]
- Bao, J.; Potts, B.D. Quantitative determination of olanzapine in rat brain tissue by high-performance liquid chromatography with electrochemical. J. Chromatogr. B Analyt. Technol. Biomed. Life Sci. 2001, 752, 61–67. [Google Scholar] [CrossRef]
- Kobylińska, K.; Buś, K.M.; Bukowska-Kiliszek, M. A high—Performance liquid chromatography with electrochemical detection for the determination of olanzapine in human plasma. Acta Pol. Pharm. 2008, 65, 759–762. [Google Scholar]
- Zhang, G.; Terry, A.V., Jr.; Bartlett, M.G. Simultaneous determination of five antipsychotic drugs in rat plasma by high performance liquid chromatography with ultraviolet detection. J. Chromatogr. B Analyt. Technol. Biomed. Life Sci. 2007, 856, 20–28. [Google Scholar] [CrossRef]
- Josefsson, M.; Roman, M.; Skogh, E.; Dahl, M.L. Liquid chromatography/tandem mass spectrometry method for determination of olanzapine and N-desmethylolanzapine in human serum and cerebrospinal fluid. J. Pharm. Biomed. Anal. 2010, 53, 576–582. [Google Scholar] [CrossRef]
- Fisher, D.S.; Partridge, S.J.; Handley, S.A.; Couchman, L.; Morgan, P.E.; Flanagan, R.J. LC–MS/MS of some atypical antipsychotics in human plasma, serum, oral fluid and haemolysed whole blood. Forensic Sci. Int. 2013, 229, 145–150. [Google Scholar] [CrossRef]
- Patteet, L.; Maudens, K.E.; Sabbe, B.; Morrens, M.; De Doncker, M.; Neels, H. High throughput identification and quantification of 16 antipsychotics and 8 major metabolites in serum using ultra-high performance liquid chromatography–tandem mass spectrometry. Clin. Chim. Acta 2014, 429, 51–58. [Google Scholar] [CrossRef]
- Bedor, N.C.T.C.; Bedor, D.C.G.; de Sousa, C.E.M.; Bonifácio, F.N.; da Mota Castelo Branco, D.; Bastos Leal, L.; de Santana, D.P. The development and validation of a method for quantifying olanzapine in human plasma by liquid chromatography tandem mass spectrometry and its application in a pharmacokinetic study. Clin. Exp. Pharmacol. Physiol. 2015, 42, 305–313. [Google Scholar] [CrossRef]
- Albayrak, M.; Kadioglu, Y.; Yaman, M.E.; Senol, O.; Oral, E. Determination of olanzapine for therapeutic drug monitoring in schizophrenia patients by LC/MS method. Biomed. Chromatogr. 2019, 33, e4468. [Google Scholar] [CrossRef]
- Raslan, M.; Eslam, M.S.; Sara, A.R.; Sabri, N.A. Determination of Olanzapine in Human Plasma by LC/MS/MS and its Clinical Applications. Acta Sci. Pharm. Sci. 2023, 7, 10–19. [Google Scholar]
- Roszkowska, A.; Plenis, A.; Kowalski, P.; Bączek, T.; Olędzka, I. Recent advancements in techniques for analyzing modern, atypical antidepressants in complex biological matrices and their application in biomedical studies. Trends Analyt. Chem. 2022, 152, 116609. [Google Scholar] [CrossRef]
- De Meulder, M.; Waldron, M.P.; Li, L.; Peay, M.G.; Tingler, M.J.; Hidy, B.J.; Verhaeghe, T.; Jenkins, R.G. Development and validation of HILIC–ESI/MS/MS methods for simultaneous quantitation of several antipsychotics in human plasma and blood. Bioanalysis 2016, 8, 765–794. [Google Scholar] [CrossRef]
- Naidu, C.G.; Rao, R.N.; Rao, A.V.P.; Kumar, K.N.; Padiya, R.; Rao, V.M. Supported liquid extraction and LC–MS-MS determination of iloperidone and olanzapine in rat plasma: Application to a pharmacokinetic study. J. Chromatogr. Sci. 2018, 56, 879–887. [Google Scholar] [CrossRef]
- Zheng, M.; Zhang, C.; Wang, L.; Wang, K.; Kang, W.; Lian, K.; Li, H. Determination of nine mental drugs in human plasma using solid-phase sup-ported liquid-liquid extraction and HPLC-MS/MS. Microchem. J. 2021, 160, 105647. [Google Scholar] [CrossRef]
- Ogawa, T.; Kondo, F.; Iwai, M.; Matsuo, T.; Kubo, K.; Seno, H. Novel extraction method using an ISOLUTE PLD+ protein and phospholipid removal column for liquid chromatography-tandem mass spectrometry analysis of 20 psychoactive drugs in postmortem whole blood samples. Forensic Sci. Int. 2022, 331, 111130. [Google Scholar] [CrossRef]
- Jiang, H.; Cao, H.; Zhang, Y.; Fast, D.M. Systematic evaluation of supported liquid extraction in reducing matrix effect and improving extraction efficiency in LC-MS/MS based bioanalysis for 10 model pharmaceutical compounds. J. Chromatogr. B Analyt. Technol. Biomed. Life Sci. 2012, 891–892, 71–80. [Google Scholar] [CrossRef]
- Petruczynik, A.; Waksmundzka-Hajnos, M. Analysis of basic psychotropic drugs in biological fluids and tissues by reversed-phase high performance liquid chromatography. Acta Pol. Pharm. 2017, 74, 331–346. [Google Scholar]
- Raggi, M.A.; Casamenti, G.; Mandrioli, R.; Volterra, R. A sensitive high-performance liquid chromatographic method using electrochemical detection for the analysis of olanzapine and desmethylolanzapine in plasma of schizophrenic patients using a new solid-phase extraction procedure. J. Chromatogr. B Analyt. Technol. Biomed. Life Sci. 2001, 750, 137–146. [Google Scholar] [CrossRef]
- Lu, M.L.; Lin, C.H.; Chen, Y.C.; Yang, H.C.; Wu, T.H. Determination of Olanzapine and N-desmethyl-olanzapine in Plasma Using a Reversed-Phase HPLC Coupled with Coulochemical Detection: Correlation of Olanzapine or N-desmethyl-olanzapine Concentration with Metabolic Parameters. PLoS ONE 2013, 8, e65719. [Google Scholar] [CrossRef]
- Berna, M.; Shugert, R.; Mullen, J. Determination of Olanzapine in Human Plasma and Serum by Liquid Chromatography/Tandem Mass Spectrometry. J. Mass Spectrom. 1998, 33, 1003–1008. [Google Scholar] [CrossRef]
- Bogusz, M.J.; Kruger, K.D.; Maier, R.D.; Erkwoh, R.; Tuchtenhagen, F. Monitoring of olanzapine in serum by liquid chromatography–atmospheric pressure chemical ionization mass spectrometry. J. Chromatogr. B Analyt. Technol. Biomed. Life Sci. 1999, 732, 257–269. [Google Scholar] [CrossRef]
- Gopinath, S.; Kumar, R.S.; Alexander, S.; Danabalc, P. Development of a rapid and sensitive SPE-LC-MS/MS method for the simultaneous estimation of fluoxetine and olanzapine in human plasma. Biomed. Chromatogr. 2012, 26, 1077–1082. [Google Scholar] [CrossRef]
- Sivsivadze, K.; Jokhadze, M.; Tushurashvili, P.; Murtazashvili, T.; Imnadze, N. Development of LC-MS/MS method for determination of the olanzapine in human plasma. Georgian Med. News 2017, 263, 118–123. [Google Scholar]
- Raggi, M.A.; Mandrioli, R.; Sabbioni, C.; Ghedini, N.; Fanali, S.; Volterra, V. Determination of Olanzapine and Desmethyl-olanzapine in the Plasma of Schizophrenic Patients by Means of an Improved HPLC Method with Amperometric Detection. Chromatographia 2001, 54, 203–207. [Google Scholar] [CrossRef]
- Saracino, M.A.; Gandolfi, O.; Dall’Olio, R.; Albers, L.; Kenndler, E.; Raggi, M.A. Determination of Olanzapine in rat brain using liquid chromatography with coulometric detection and a rapid solid-phase extraction procedure. J. Chromatogr. A 2006, 1122, 21–27. [Google Scholar] [CrossRef]
- Bonde, S.L.; Bhadane, R.P.; Gaikwad, A.; Gavali, S.R.; Katale, D.U.; Narendiran, A.S. Simultaneous determination of Olanzapine and Fluoxetine in human plasma by LC–MS/MS: Its pharmacokinetic application. J. Pharm. Biomed. Anal. 2014, 90, 64–71. [Google Scholar] [CrossRef] [PubMed]
- Khelfi, A.; Azzouz, M.; Abtroun, R.; Reggabi, M.; Alamir, B. Determination of Chlorpromazine, Haloperidol, Levomepromazine, Olanzapine, Risperidone, and Sulpiride in Human Plasma by Liquid Chromatography/Tandem Mass Spectrometry (LC-MS/MS). Int. J. Anal. Chem. 2018, 2018, 5807218. [Google Scholar] [CrossRef]
- Koller, D.; Zubiaur, P.; Saiz-Rodríguez, M.; Abad-Santos, F.; Wojnicz, A. Simultaneous determination of six antipsychotics, two of their metabolites and caffeine in human plasma by LC-MS/MS using a phospholipid-removal microelution-solid phase extraction method for sample preparation. Talanta 2019, 198, 159–168. [Google Scholar] [CrossRef] [PubMed]
- Patel, D.S.; Sharma, N.; Patel, M.C.; Patel, B.N.; Shrivastav, P.S.; Sanyal, M. LC–MS/MS assay for olanzapine in human plasma and its application to a bioequivalence study. Acta Pharm. Sin. B 2012, 2, 481–494. [Google Scholar] [CrossRef]
- Catlow, J.T.; Barton, R.D.; Clemens, M.; Gillespie, T.A.; Goodwin, M.; Swanson, S.P. Analysis of olanzapine in human plasma utilizing reversed phase high-performance liquid chromatography with electrochemical detection. J. Chromatogr. B Analyt. Technol. Biomed. Life Sci. 1995, 668, 85–90. [Google Scholar] [CrossRef]
- Chiu, J.A.; Franklin, R.B. Analysis and pharmacokinetics of olanzapine (LY170053) and two metabolites in rat plasma using reversed-phase HPLC with electrochemical detection. J. Pharm. Biomed. Anal. 1996, 14, 609–615. [Google Scholar] [CrossRef]
- Kasper, S.C.; Mattiuz, E.L.; Swanson, S.P.; Andre Chiu, J.; Johnson, J.T.; Garner, C.O. Determination of olanzapine in human breast milk by high-performance liquid chromatography with electrochemical detection. J. Chromatogr. B Analyt. Technol. Biomed. Life Sci. 1999, 726, 203–209. [Google Scholar] [CrossRef]
- Dziurkowska, E.; Wesolowski, M. Simultaneous Quantification of Antipsychotic and Antiepileptic Drugs and Their Metabolites in Human Saliva Using UHPLC-DAD. Molecules 2019, 24, 2953. [Google Scholar] [CrossRef] [PubMed]
- Chin, C.; Zhang, Z.P.; Karnes, H.T. A study of matrix effects on an LC/MS/MS assay for olanzapine and desmethyl olanzapine. J. Pharm. Biomed. Anal. 2004, 35, 1149–1167. [Google Scholar] [CrossRef] [PubMed]
- Choong, E.; Rudaz, S.; Kottelat, A.; Guillarme, D.; Veuthey, J.L.; Eap, C.B. Therapeutic drug monitoring of seven psychotropic drugs and four metabolites in human plasma by HPLC–MS. J. Pharm. Biomed. Anal. 2009, 50, 1000–1008. [Google Scholar] [CrossRef] [PubMed]
- Dziurkowska, E.; Jiménez-Morigosa, C.; López-Rivadulla, M.; Wesolowski, M. Development and validation of solid-phase extraction coupled with a liquid chromatography-tandem mass spectrometry method for quantitation of olanzapine in saliva. J. Chromatogr. B Analyt. Technol. Biomed. Life Sci. 2020, 1136, 121896. [Google Scholar] [CrossRef] [PubMed]
- Ramírez Fernández, M.D.M.; Baumgartner, W.A.; Wille, S.M.R.; Farabee, D.; Samyn, N.; Baumgartner, A.M. A different insight in hair analysis: Simultaneous measurement of antipsychotic drugs and metabolites in the protein and melanin fraction of hair from criminal justice patients. Forensic Sci. Int. 2020, 312, 110337. [Google Scholar] [CrossRef] [PubMed]
- Cobo-Golpe, M.; de-Castro-Ríos, A.; Cruz, A.; Páramo, M.; López-Rivadulla, M.; Lendoiro, E. Determination of antipsychotic drugs in nails and hair by liquid chromatography tandem mass spectrometry and evaluation of their incorporation into keratinized matrices. J. Pharm. Biomed. Anal. 2020, 189, 113443. [Google Scholar] [CrossRef] [PubMed]
- Hendrickx, S.; Uğur, D.Y.; Yilmaz, I.T.; Şener, E.; Schepdael, A.V.; Adams, E.; Broeckhoven, K.; Cabooter, D. A sensitive capillary LC-UV method for the simultaneous analysis of olanzapine, chlorpromazine and their FMO-mediated N-oxidation products in brain microdialysates. Talanta 2017, 162, 268–277. [Google Scholar] [CrossRef]
- Moein, M.M.; Said, R.; Abdel-Rehim, M. Microextraction by packed sorbent. Bioanalysis 2015, 7, 2155–2161. [Google Scholar] [CrossRef]
- Samanidou, V.; Stathatos, C.; Njau, S.; Kovatsi, L. Disposable pipette extraction for the simultaneous determination of biperiden and three antipsychotic drugs in human urine by GC–nitrogen phosphorus detection. Bioanalysis 2013, 5, 21–29. [Google Scholar] [CrossRef]
- Bordin, D.C.M.; Alves, M.N.R.; de Campos, E.G.; de Martinis, B.S. Disposable pipette tips extraction:Fundamentals, applications and stateof the art. J. Sep. Sci. 2016, 39, 1168–1172. [Google Scholar] [CrossRef]
- Carasek, E.; Morés, L.; Huelsmann, R.D. Disposable pipette extraction: A critical review of concepts, applications, and directions. Anal. Chim. Acta 2022, 1192, 339383. [Google Scholar] [CrossRef]
- Ahmad, S.; Kalra, H.; Gupta, A.; Raut, B.; Hussain, A.; Rahman, M.A. HybridSPE: A novel technique to reduce phospholipid-based matrix effect in LC–ESI-MS Bioanalysis. J. Pharm. Bioallied. Sci. 2012, 4, 267–275. [Google Scholar]
- Sampedro, M.C.; Unceta, N.; Gómez-Caballero, A.; Callado, L.F.; Morentin, B.; Goicolea, M.A.; Meana, J.J.; Barrio, R.J. Screening and quantification of antipsychotic drugs in human brain tissue by liquid chromatography–tandem mass spectrometry: Application to postmortem diagnostics of forensic interest. Forensic Sci. Int. 2012, 219, 172–178. [Google Scholar] [CrossRef] [PubMed]
- Weigmann, H.; Hartter, S.; Maehrlein, S.; Kiefer, W.; Kramer, G.; Dannhardt, G.; Hiemke, C. Simultaneous determination of olanzapine, clozapine and demethylated metabolites in serum by on-line column-switching high-performance liquid chromatography. J. Chromatogr. B Analyt. Technol. Biomed. Life Sci. 2001, 759, 63–71. [Google Scholar] [CrossRef]
- Sachse, J.; Köller, J.; Härtter, S.; Hiemke, C. Automated analysis of quetiapine and other antipsychotic drugs in human blood by high performance-liquid chromatography with column-switching and spectrophotometric detection. J. Chromatogr. B Analyt. Technol. Biomed. Life Sci. 2006, 830, 342–348. [Google Scholar] [CrossRef]
- Gracia, M.S.; Köppl, A.; Unholzer, S.; Haen, E. Development and validation of an HPLC-UV method for the simultaneous determination of the antipsychotics clozapine, olanzapine and quetiapine, several beta-blockers and their metabolites. Biomed. Chromatogr. 2017, 31, e3968. [Google Scholar]
- Kollroser, M.; Schober, C. Direct-injection high performance liquid chromatography ion trap mass spectrometry for the quantitative determination of olanzapine, clozapine and N-desmethylclozapine in human plasma. Rapid Commun. Mass Spectrom. 2002, 16, 1266–1272. [Google Scholar] [CrossRef] [PubMed]
- Zheng, Q.; Wang, F.; Li, H.; Xu, P.; Tang, H.; Li, L.; Cheng, R. Quantitative analysis of olanzapine in rat brain microdialysates by HPLC–MS/MS coupled with column-switching technique. J. Chromatogr. B Analyt. Technol. Biomed. Life Sci. 2012, 905, 127–132. [Google Scholar] [CrossRef]
- Fan, Y.; Shen, G.; Li, P.; Xi, X.; Wu, H.; Tian, H.; Lu, Y.; Yin, Z. A simple and automated online SPE-LC-MS/MS method for simultaneous determination of olanzapine, fluoxetine and norfluoxetine in human plasma and its application in therapeutic drug monitoring. RSC Adv. 2015, 45, 34342–34352. [Google Scholar] [CrossRef]
- Cruz, J.C.; de Souza, I.D.; Grecco, C.F.; Figueiredo, E.C.; Queiroz, M.E.C. Recent advances in column switching high-performance liquid chromatography for bioanalysis. Sustain. Chem. Pharm. 2021, 21, 100431. [Google Scholar] [CrossRef]
- Berrueta, L.A.; Gallo, B.; Vicente, V.A. Review of Solid Phase Extraction: Basic Principles and New Developments. Chromatographia 1995, 40, 474–483. [Google Scholar] [CrossRef]
- Kataoka, H. New trends in sample preparation for clinical and pharmaceutical analysis. TrAC Trends Anal. Chem. 2003, 22, 232–244. [Google Scholar] [CrossRef]
- Mao, Y.; Huang, M.Q. Online Extraction and Column Switching Techniques in LC-MS Bioanalysis. In Sample Preparation in LC-MS Bioanalysis, 1st ed.; Li, W., Jian, W., Fu, Y., Eds.; John Wiley & Sons Inc.: Hoboken, NJ, USA, 2019; Volume 1, pp. 31–44. [Google Scholar]
- Badawy, M.E.I.; El-Nouby, M.A.M.; Kimani, P.K.; Lim, L.W.; Rabea, E.I. A review of the modern principles and applications of solid-phase extraction techniques in chromatographic analysis. Anal. Sci. 2022, 38, 1457–1487. [Google Scholar] [CrossRef]
- Pan, J.; Zhang, C.; Zhang, Z.; Li, G. Review of online coupling of sample preparation techniques with liquid chromatography. Anal. Chim. Acta 2014, 815, 1–15. [Google Scholar] [CrossRef]
- Olesen, O.V.; Poulsen, B.; Linnet, K. Fully Automated On-Line Determination of Olanzapine in Serum for Routine Therapeutic Drug Monitoring. Ther. Drug Monit. 2001, 23, 51–55. [Google Scholar] [CrossRef] [PubMed]
- Andrade-Eiroa, A.; Canle, M.; Leroy-Cancellieri, V.; Cerdà, V. Solid phase extraction of organic compounds: A critical review. Part I. Trends Anal. Chem. 2015, 80, 655–667. [Google Scholar] [CrossRef]
- Zhang, G.; Terry, A.V.; Bartlett, M.G. Bioanalytical methods for the determination of antipsychotic drugs. Biomed. Chromatogr. 2008, 22, 671–687. [Google Scholar] [CrossRef] [PubMed]
- Sabbioni, C.; Saracino, M.A.; Mandrioli, R.; Albers, L.; Boncompagni, G.; Raggi, M.A. Rapid analysis of olanzapine and desmethylolanzapine in human plasma using high-performance liquid chromatography with coulometric detection. Anal. Chim. Acta 2004, 516, 111–117. [Google Scholar] [CrossRef]
- Karaca, S.A.; Uğur, D.Y. Development of a validated HPLC method for simultaneous determination of olanzapine and aripiprazole in human plasma. J. Pharm. Res. 2018, 22, 162–171. [Google Scholar]
- Fan, L.; An, J.; Gao, J.; Cui, Y.; Dong, Z. Determination of atypical antipsychotics in human plasma by UPLC-UV with polystyrene nanofibers as a solid-phase extraction sorbent. RSC Adv. 2022, 25, 16194–16202. [Google Scholar] [CrossRef] [PubMed]
- Nielsen, M.K.K.; Johansen, S.S. Determination of Olanzapine in Whole Blood Using Simple Protein Precipitation and Liquid Chromatography-Tandem Mass Spectrometry. J. Anal. Toxicol. 2009, 33, 212–217. [Google Scholar] [CrossRef]
- Park, D.; Choib, H.; Jangb, M.; Changa, H.; Wooc, S.; Yang, W. Simultaneous determination of 18 psychoactive agents and 6 metabolites in plasma using LC–MS/MS and application to actual plasma samples from conscription candidates. Forensic Sci. Int. 2018, 288, 283–290. [Google Scholar] [CrossRef] [PubMed]
- Du, P.; Li, P.; Zhao, R.; Liu, H.; Liu, L. Optimized UPLC–MS/MS method for the quantitation of olanzapine in human plasma: Application to a bioequivalence study. Bioanalysis 2019, 11, 1291–1302. [Google Scholar] [CrossRef] [PubMed]
- Günther, K.N.; Banner, J.; Linnet, K.; Johansen, S.S. Segmental hair analysis of olanzapine and N-desmethyl-olanzapine in postmortem hair from mentally ill patients by LC–MS/MS. J. Pharm. Biomed. Anal. 2020, 190, 113510. [Google Scholar] [CrossRef]
- Wang, X.; Johansen, S.S.; Nielsen, M.K.K.; Linnet, K. Targeted analysis of 116 drugs in hair by UHPLC–MS/MS and its application to forensic cases. Drug Test. Anal. 2017, 9, 1137–1151. [Google Scholar] [CrossRef] [PubMed]
- He, X.; Sun, T.; Wang, L.; Jiang, X. Pipette-tip micro-solid phase extraction based on melamine-foam@polydopamine followed by ultra-high-performance liquid chromatography–quadrupole–time-of-flight mass spectrometry for detection of psychotropic drugs in human serum. J. Chromatogr. B Analyt. Technol. Biomed. Life Sci. 2021, 1163, 122499. [Google Scholar] [CrossRef] [PubMed]
- Nozawa, H.; Minakata, K.; Hasegawa, K.; Yamagishi, I.; Miyoshi, N.; Suzuki, M.; Kitamoto, T.; Kondo, M.; Watanabe, K.; Suzuki, O. Quantifcation of olanzapine and its three metabolites by liquid chromatography–tandem mass spectrometry in human body fuids obtained from four deceased, and confrmation of the reduction from olanzapine N-oxide to olanzapine in whole blood in vitro. Forensic Toxicol. 2023, 41, 318–328. [Google Scholar] [CrossRef] [PubMed]
- Buszewski, B.; Noga, S. Hydrophilic interaction liquid chromatography (HILIC)—A powerful separation technique. Anal. Bioanal. Chem. 2012, 402, 231–247. [Google Scholar] [CrossRef]
- Alpert, A.J. Hydrophilic-interaction chromatography for the separation of peptides, nucleic acids and other polar compounds. J. Chromatogr. 1990, 499, 177–196. [Google Scholar] [CrossRef]
- McCalley, D.V. Evaluation of the properties of a superficially porous silica stationary phase in hydrophilic interaction chromatography. J. Chromatogr. A 2008, 1193, 85–91. [Google Scholar] [CrossRef]
- Chauve, B.; Guillarme, D.; Cléon, P.; Veuthey, J.L. Evaluation of various HILIC materials for the fast separation of polar compounds. J. Sep. Sci. 2021, 33, 752–764. [Google Scholar] [CrossRef]
- Gritti, F.; Dos Santos Pereira, A.; Pat, S.; Guiochon, G. Efficiency of the same neat silica column in hydrophilic interaction chromatography and per aqueous liquid chromatography. J. Chromatogr. A 2010, 1217, 683–688. [Google Scholar] [CrossRef] [PubMed]
- McCalley, D.V. Is hydrophilic interaction chromatography with silica columns a viable alternative to reversed-phase liquid chromatography for the analysis of ionisable compounds? J. Chromatogr. A 2007, 1171, 46–55. [Google Scholar] [CrossRef] [PubMed]
- Han, D.; Loukianoff, S.; McLaughlin, L. Oxidative stress indices: Analytical aspects and significance. In Handbook Oxidants and Antioxidants in Exercise, 1st ed.; Sen, C.K., Packer, L., Hänninen, O.O.P., Eds.; Elsevier Science: Amsterdam, The Netherlands, 2000; Volume 1, pp. 433–483. [Google Scholar]
- Rocklin, R.D. Electrochemical detection. In A Practical Guide to HPLC Detection, 1st ed.; Parriot, D., Ed.; Academic Press: Cambridge, MA, USA; Elsevier Inc.: New York, NY, USA, 1993; Volume 1, pp. 145–173. [Google Scholar]
- Khalikova, M.; Jireš, J.; Horáček, O.; Douša, M.; Kučera, R.; Nováková, L. What is the role of current mass spectrometry in pharmaceutical analysis? Mass Spectrom. Rev. 2023, 28, 1–50. [Google Scholar] [CrossRef] [PubMed]
- Rockwood, A.L.; Kushnir, M.M.; Clarke, N.J. Mass Spectrometry. In Principles and Applications of Clinical Mass Spectrometry, Small Molecules, Peptides, and Pathogens; Rifai, N., Witter, C.T., Horvath, A.R., Eds.; Elsevier Inc.: Amsterdam, The Netherlands, 2018; Volume 1, pp. 33–65. [Google Scholar]
- Goodwin, R.M.; Barton, R.D.; Gillespie, T.A. Professional Association Management. In Proceedings of the 41st ASMS Conference on Mass Spectrometry, San Francisco, CA, USA, 31 May–4 June 1993. [Google Scholar]
- Jenkins, A.J.; Sarconi, K.M.; Raaf, H.N. Determination of Olanzapine in a Postmortem Case. J. Anal. Toxicol. 1998, 22, 605–609. [Google Scholar] [CrossRef] [PubMed]
- Merrick, T.C.; Felo, J.A.; Jenkins, A.J. Tissue Distribution of Olanzapine in a Postmortem Case. Am. J. Forensic Med. Pathol. 2001, 22, 270–274. [Google Scholar] [CrossRef] [PubMed]
- Ulrich, S. Assay of Olanzapine in Human Plasma by a Rapid and Sensitive Gas Chromatography-Nitrogen Phosphorus Selective Detection (GC-NPD) Method Validation and Comparison with High-Performance Liquid Chromatography-Coulometric Detection. Ther. Drug Monit. 2005, 27, 463–468. [Google Scholar] [CrossRef] [PubMed]
- Ikeda, K.; Ikawa, K.; Kozumi, T.; Yokoshige, S.; Horikawa, S.; Morikawa, N. Development and validation of a GC-EI-MS method with reduced adsorption loss for the quantification of olanzapine in human plasma. Anal. Bioanal. Chem. 2012, 403, 1823–1830. [Google Scholar] [CrossRef] [PubMed]
- Rosado, T.; Oppolzer, D.; Cruz, B.; Barroso, M.; Varela, S.; Oliveira, V.; Leitão, C.; Gallardo, E. Development and validation of a gas chromatography/tandem mass spectrometry method for simultaneous quantitation of several antipsychotics in human plasma and oral fluid. Rapid Commun. Mass Spectrom. 2018, 32, 2081–2095. [Google Scholar] [CrossRef]
- Beale, D.J.; Pinu, F.R.; Kouremenos, K.A.; Poojary, M.M.; Narayana, V.K.; Boughton, B.A.; Kanojia, K.; Dayalan, S.; Jones, O.A.H.; Dias, D.A. Review of recent developments in GC–MS approaches to metabolomics-based research. Metabolomics 2018, 14, 152. [Google Scholar] [CrossRef]
- Gómez-Rioja, R.; Martínez-Espartosa, D.M.; Segovia, M.; Ibarz, M.; Llopis, M.A.; Bauça, J.M.; Marzana, I.; Barba, N.; Ventura, M.; García del Pino, I.; et al. Laboratory sample stability. Is it possible to define a consensus stability function? An example of five blood magnitudes. Clin. Chem. Lab. Med. 2018, 56, 1806–1818. [Google Scholar] [CrossRef] [PubMed]
- Nováková, L.; Vlcková, H. A review of current trends and advances in modern bio-analytical methods: Chromatography and sample preparation. Anal. Chim. Acta 2009, 656, 8–35. [Google Scholar] [CrossRef] [PubMed]
- Murray, L.P.; Baillargeon, K.R.; Bricknell, J.R.; Mace, C.R. Determination of sample stability for whole blood parameters using formal experimental design. Anal. Methods 2019, 11, 930–935. [Google Scholar] [CrossRef]
- Aravagiri, M.; Ames, D.; Wirshing, W.C.; Marder, S.R. Plasma level monitoring of olanzapine in patients with schizophrenia: Determination by high-performance liquid chromatography with electrochemical detection. Ther. Drug Monit. 1997, 19, 307–313. [Google Scholar] [CrossRef] [PubMed]
- Fisher, D.S.; Partridge, S.J.; Handley, S.A.; Flanagan, R.J. Stability of some atypical antipsychotics in human plasma, haemolysed whole blood, oral fluid, human serum and calf serum. Forensic Sci. Int. 2013, 229, 151–156. [Google Scholar] [CrossRef] [PubMed]
- Saar, E.; Gerostamoulos, D.; Drummer, O.H.; Beyer, J. Identification of 2-hydroxymethyl-olanzapine as a novel degradation product of olanzapine. Forensic Sci. Int. 2012, 220, 74–79. [Google Scholar] [CrossRef]
- Heller, S.; Hiemke, C.; Stroba, G.; Rieger-Gies, A.; Daum-Kreysch, E.; Sachse, J.; Härtter, S. Assessment of storage and transport stability of new antidepressant and antipsychotic drugs for a nationwide TDM service. Ther. Drug Monit. 2004, 26, 459–461. [Google Scholar] [CrossRef]
- Karinen, R.; Øiestad, E.L.; Andresen, W.; Smith-Kielland, A.; Christophersen, A. Comparison of ethanol and other drugs of abuse concentrations in whole blood stored in venoject glass and plastic and venosafe plastic evacuated tubes. J. Anal. Toxicol. 2010, 34, 420–428. [Google Scholar] [CrossRef]


 olanzapine,
  matrix components,
  proteins.
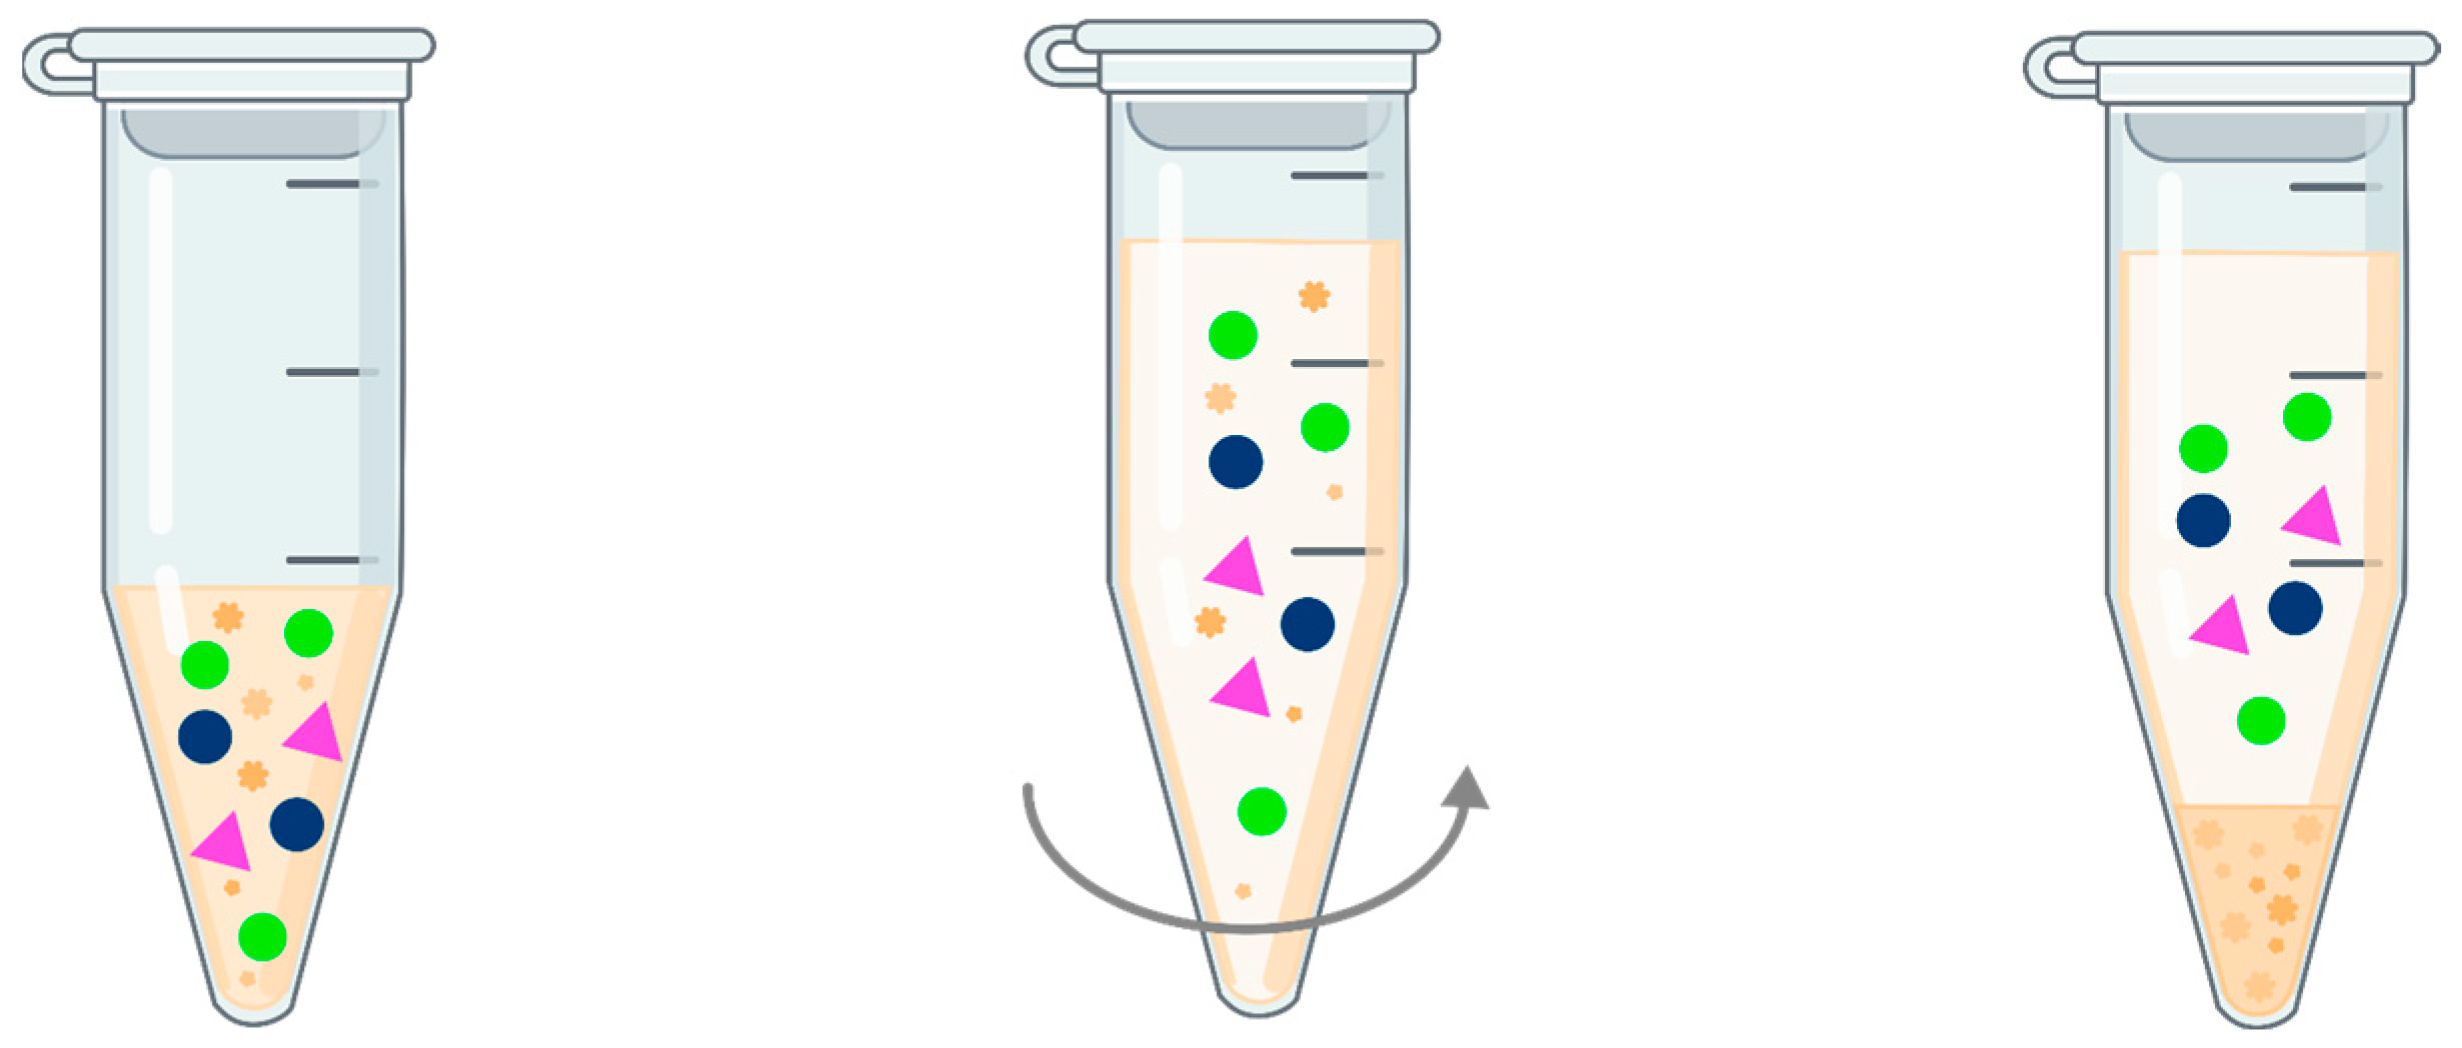
 olanzapine,
  matrix components.
 olanzapine,
  matrix components,
  diatoms.
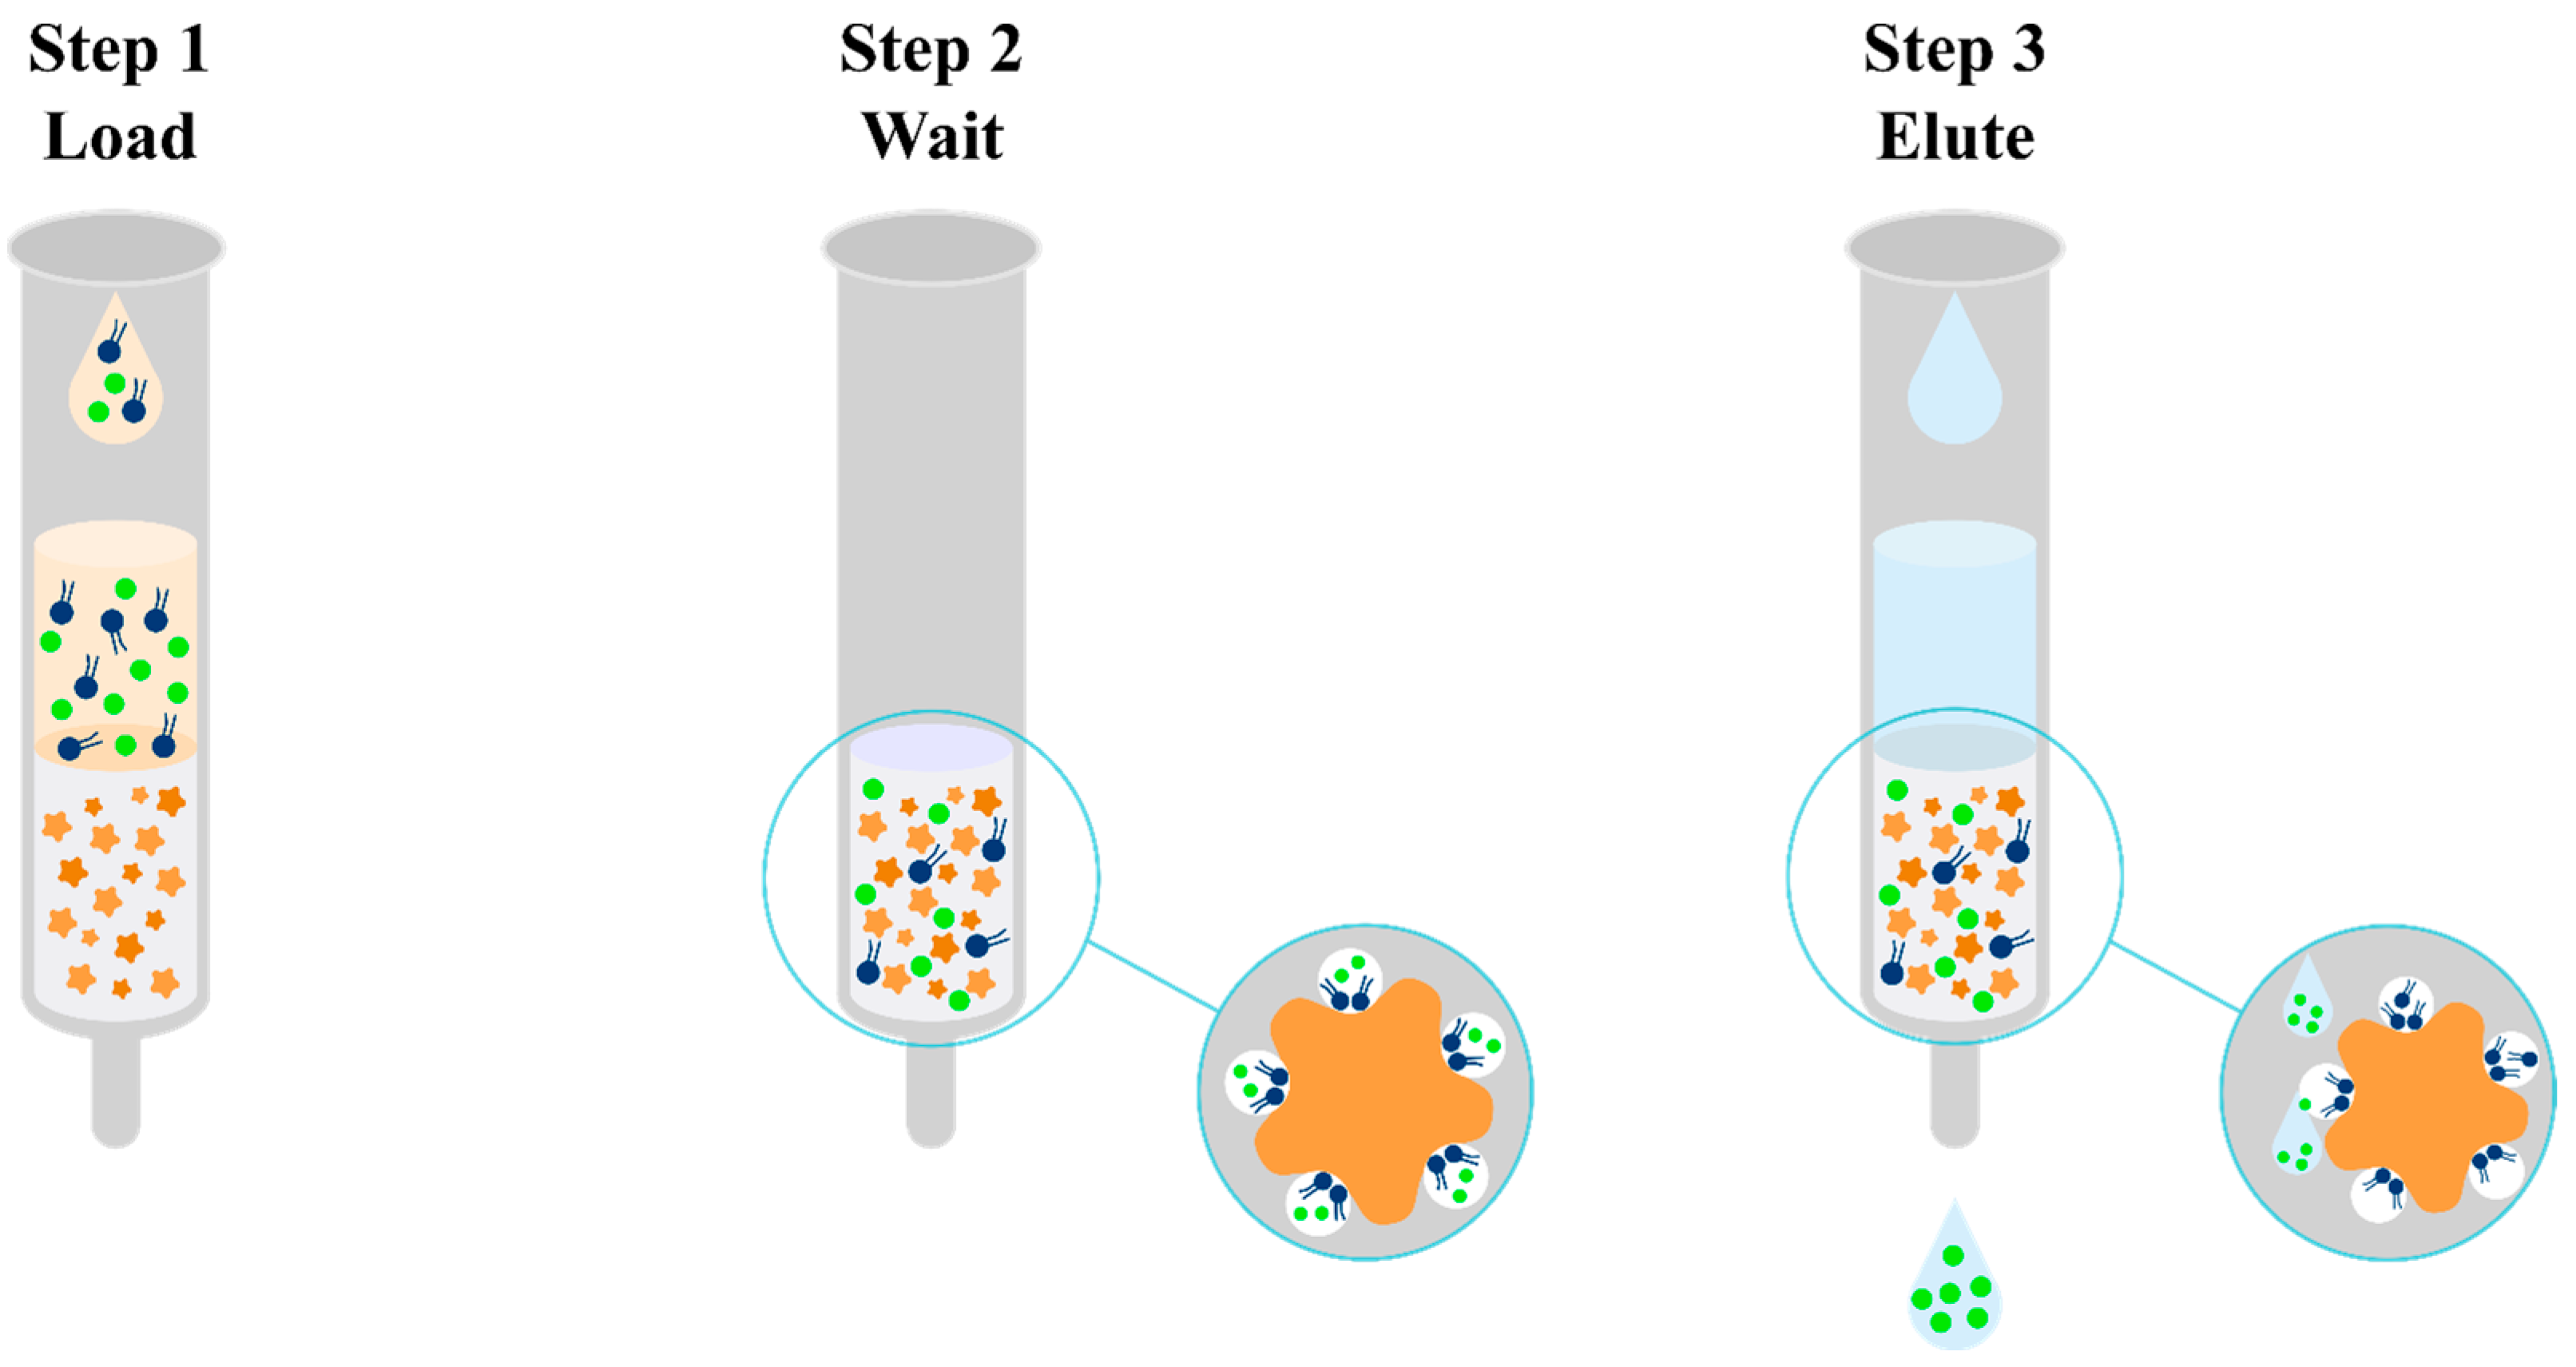
 olanzapine,
  matrix components.
 olanzapine,
  matrix components.
 olanzapine,
  matrix components,
  loose resin.
 olanzapine,
  phospholipids,
  proteins.
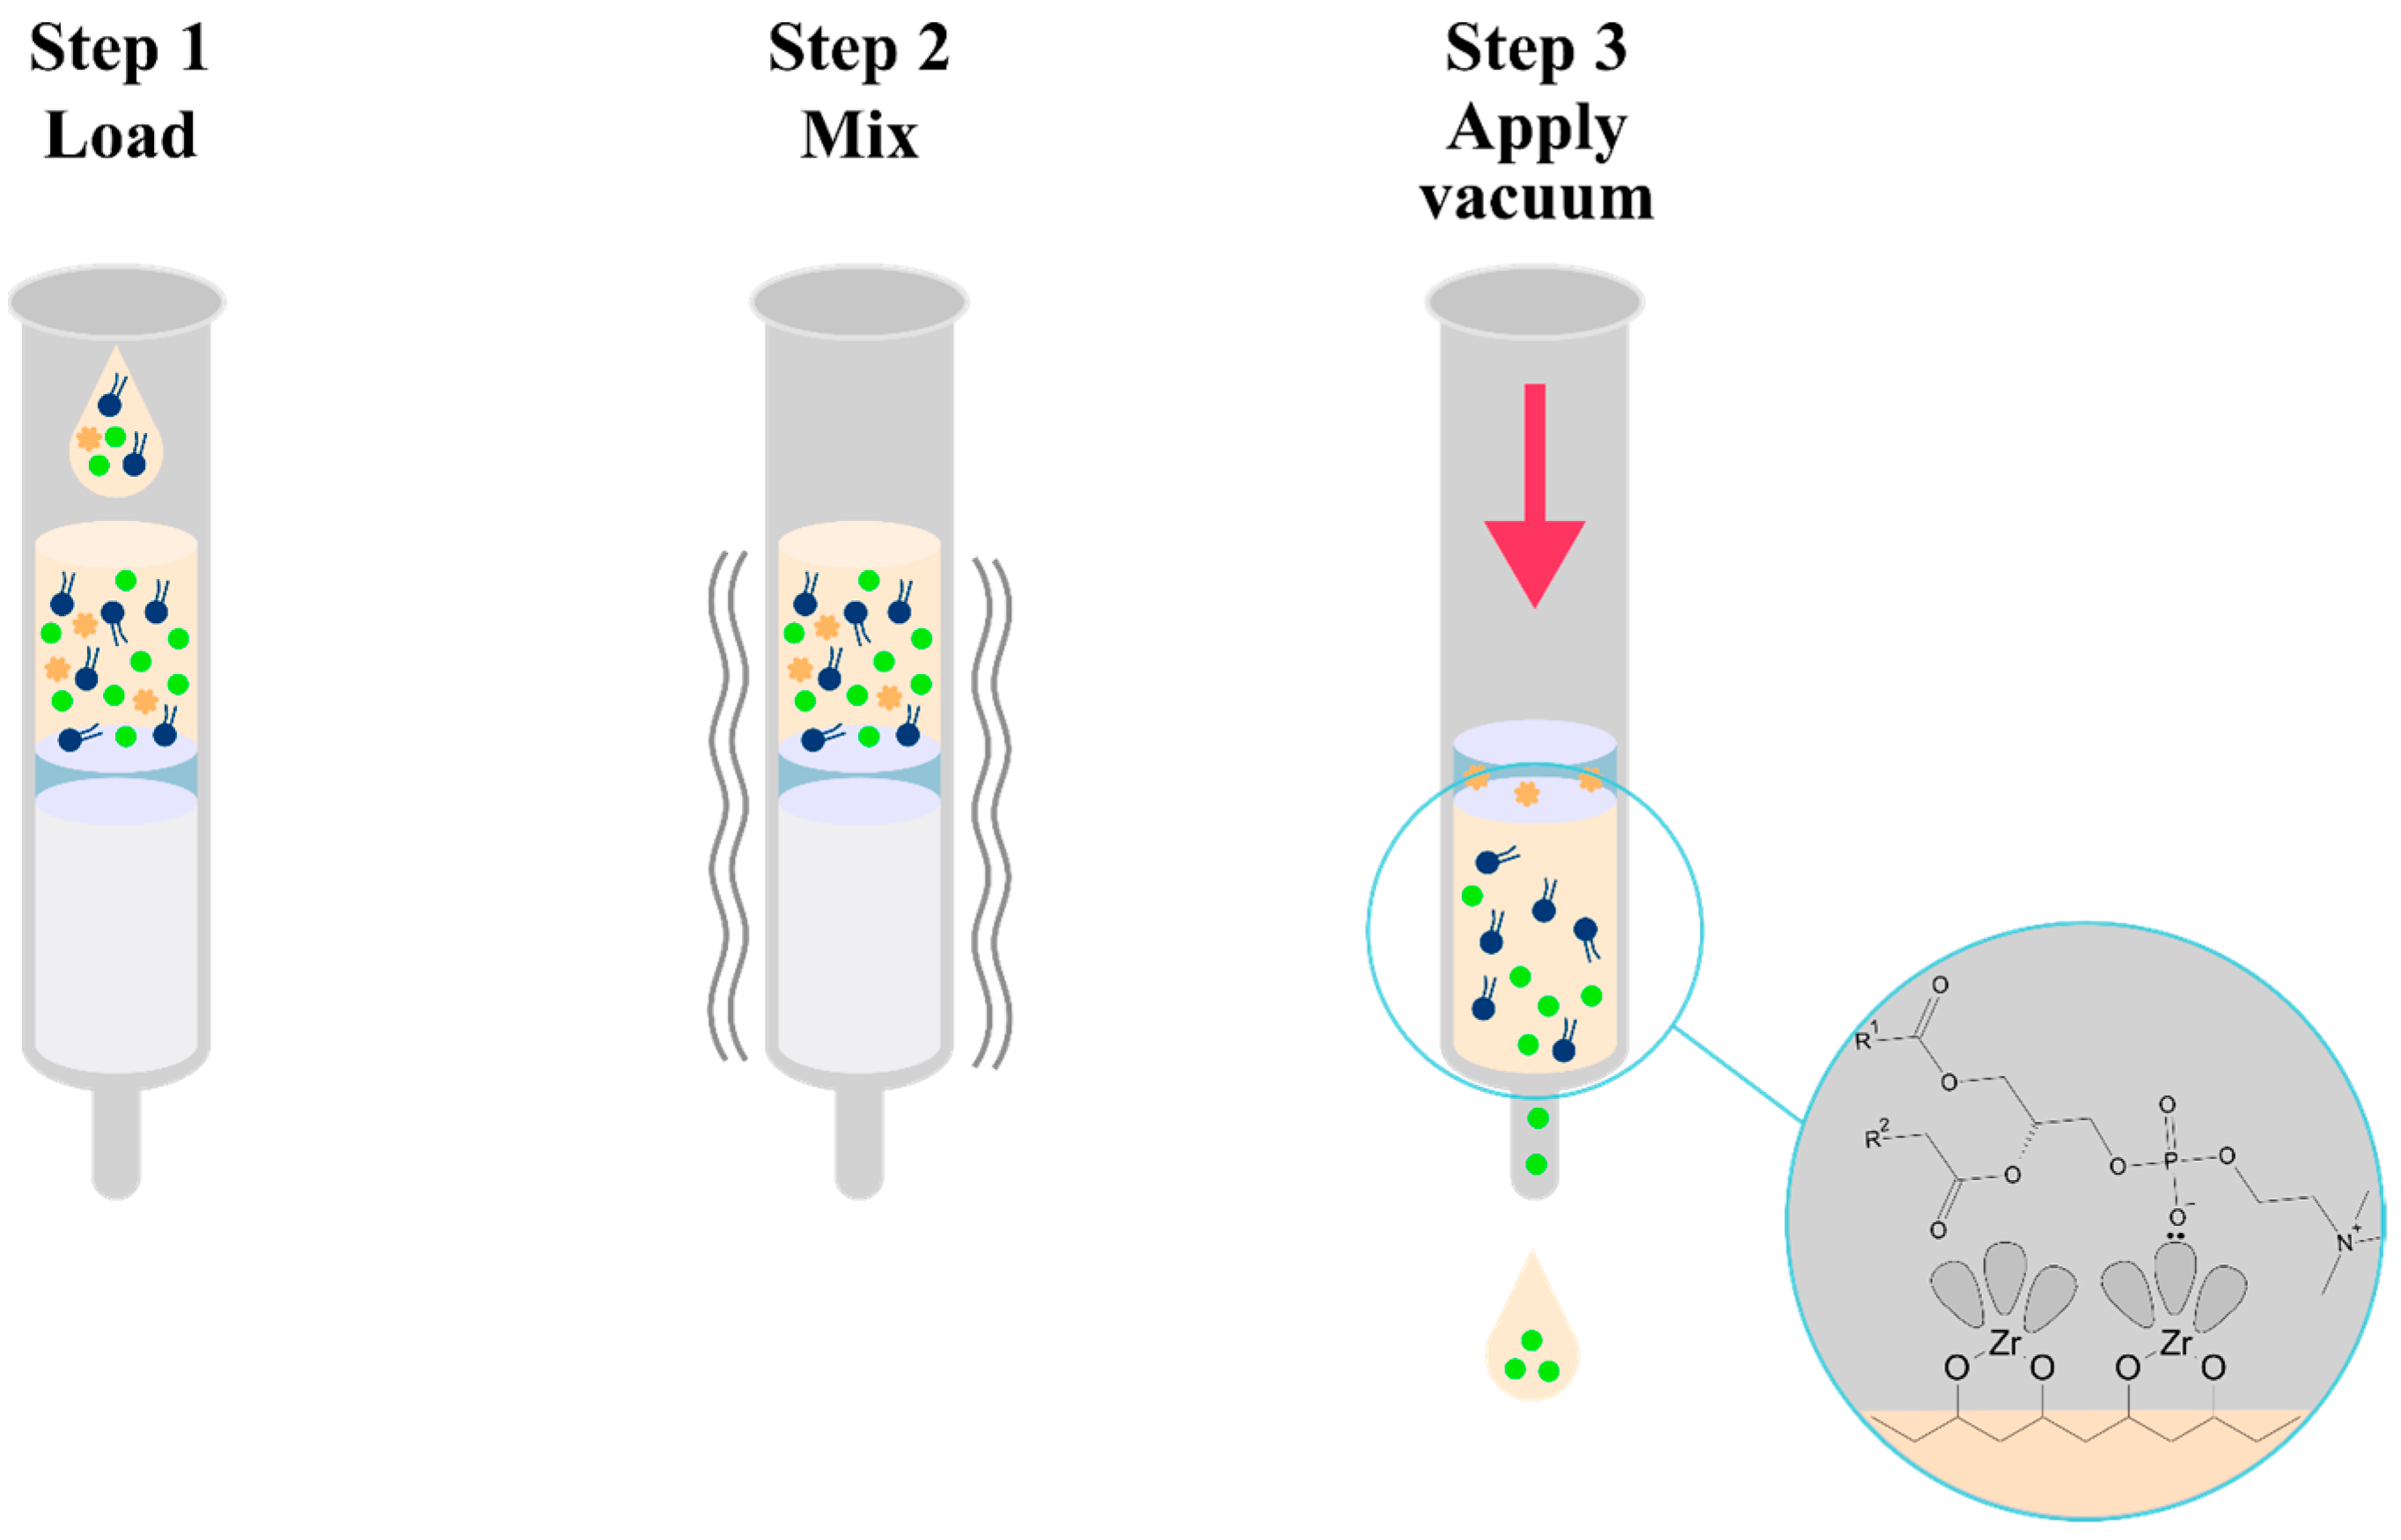


| Matrix | Sample Volume [mL] | Preparation | Mobile Phase | Elution, Flow | Analytes (Retention Time) | IS (Retention Time) | Linearity Range for Olanzapine [ng/mL], Correlation Coefficient for Olanzapine | Application, Reference, Matrix |
|---|---|---|---|---|---|---|---|---|
| human plasma | 1.0 | SPE | phosphate buffer (75 mM, pH 7)/MeOH/ACN (48:26:26) | isocratic 1.2 mL/min | olanzapine (7.0 min) | LY170222 (10.5 min) | 0.25–50 >0.997 | clinical research [74] |
| rat plasma | - | SPE | phosphate buffer (75 mM, pH 7)/MeOH/ACN (48:26:26) | isocratic 1.2 mL/min | 2-hydroxymethylolanzapine (2.9 min) N-desmethyl olanzapine (3.9 min) olanzapine (6.6 min) | LY170222 (9.6 min) | 1–100 >0.9912 | pharmacokinetic studies [75] |
| human milk | 1.0 | SPE | phosphate buffer (75 mM, pH 7)/MeOH/ACN (48:26:26) | isocratic 1.2 mL/min | olanzapine (7.5 min) | LY170222 (11.5 min) | 0.25–100 ≥0.9992 | - [76] |
| rat brain tissue (homogenized) | 0.5 | LLE | phosphate buffer (75 mM, pH 7)/MeOH/ACN (48:26:26) | isocratic 1.2 mL/min | olanzapine (7.5 min) | LY170158 (10.5 min) | 0.5–100 ≥0.9995 | pharmacokinetic studies [46] |
| human plasma | 0.5 | SPE | phosphate buffer (15.4 mM, pH 3.8) + triethylamine (19.7 mM)/ACN (80:20) | isocratic 1.2 mL/min | N-desmethyl olanzapine (3.9 min) olanzapine (6.1 min) | LY170222 (12.6 min) | 5–150 0.9996 | therapeutic drug monitoring [62] |
| human plasma | 0.25 | SPE | phosphate buffer (8.9 mM) + triethylamine (7.18 mM)/MeOH/ACN (79.3:11:9.7) | isocratic 0.7 mL/min | N-desmethyl olanzapine (5.7 min) olanzapine (6.8 min) | LY170222 (15.6 min) | 0.5–75 0.979 | therapeutic drug monitoring [68] |
| human plasma | 0.25 | SPE | phosphate buffer (50 mM) + 0.175% triethylamine/MeOH (70:30) | isocratic 1.2 mL/min | N-desmethyl olanzapine (3.1 min) olanzapine (4.2 min) | LY170222 (6.9 min) | 0.4–40 0.9993 | therapeutic drug monitoring [105] |
| rat brain tissue (homogenized) | 0.25 | SPE | phosphate buffer (44 mM, pH 3.5) + 0.175% triethylamine/MeOH (79:21) | isocratic 1.2 mL/min | olanzapine (7.0 min) | LY170222 (13.8 min) | 0.2–100 0.99993 | pharmacokinetic studies [69] |
| human plasma | 0.5 | LLE | ammonium acetate (0.06 M, pH 5.9)/ACN/MeOH (40:41:37) | isocratic 0.69 mL/min | olanzapine (4.9 min) | clozapine (8.2 min) | 0.313–25.00 =0.997 | bioequivalence studies [47] |
| human plasma | 0.5 | SPE | phosphate buffer (50 mM, pH 5.7)/ACN/MeOH (67:22:11) | isocratic 1 mL/min | N-desmethyl olanzapine (5.88 min) olanzapine (8.04 min) | clozapine (26.27 min) | 1–100 >0.999 | therapeutic drug monitoring [63] |
| Matrix | Sample Volume [mL] | Preparation | Mobile Phase | Elution, Flow | Analytes (Retention Time) | IS (Retention Time) | Linearity Range for Olanzapine [ng/mL], Correlation Coefficient for Olanzapine | Application, Reference |
|---|---|---|---|---|---|---|---|---|
| human plasma | 1.0 | LLE | ammonium acetate (50 mM, pH 9.9)/MeOH (15:85) | isocratic 1.1 mL/min | olanzapine (3.58 min) | trifluoperazine (4.20 min) | 0–469 1.0000 | therapeutic drug monitoring [36] |
| human serum | 1.2 | on-line SPE | ammonium acetate (50 mM, pH 9.9)/MeOH (15:85) | isocratic 1.1 mL/min | olanzapine (3.58 min) | trifluoperazine (4.20 min) | 0–1200 nmol/L 1.0000 | therapeutic drug monitoring [102] |
| human plasma human urine | 1.0 | LLE | phosphate buffer (50 mM, pH 6.0)/ACN/MeOH (65:25:10) | isocratic 1.0 mL/min | olanzapine (approx. 9 min) | LY170222 (approx. 11 min) | 1–5000 >0.98 | bioequivalence and pharmacokinetic studies [42] |
| human plasma | 0.1 | on-line SPE (column switching) | H2O/ACN/tetramethylethylenediamine (62.6:37:0.4) | isocratic 1.5 mL/min | N-demethyl olanzapine (3.68 min) olanzapine (4.46 min) | fluperlapine (11.18 min) | 10–180 >0.993 | therapeutic drug monitoring [90] |
| human plasma | 1.0 | LLE | H2O/ACN/H3PO4/TEA (85.7:14:0.25:0.05) | isocratic 1.0 mL/min | olanzapine (5.4 min) | N- desmethyl clozapine (11.2 min) | 2–150 µg/L ≥0.999 | therapeutic drug monitoring [44] |
| human plasma | 0.5 | LLE | A: phosphate buffer (50 mM, pH 3.8) B: ACN | gradient 1.5 mL/min | olanzapine (4.0 min) | methylrisperidone (7.4 min) | 10–1000 >0.997 | clinical research [38] |
| human plasma | 1.0 | LLE | H2O:ACN (55:45) + heptanesulfonic acid sodium salt (0.009 M) and KH2PO4 (0.06 M, pH 2.7) | isocratic 1.0 mL/min | olanzapine (3.6 min) | clozapine (5.7 min) | 5–100 1.0000 | therapeutic drug monitoring [37] |
| human serum | 0.099 | on-line SPE (column switching) | H2O/ACN/tetramethylethylenediamine (62.1:37.5:0.4) | isocratic 1.3 mL/min | olanzapine (9.16 min) | fluperlapine (15.57 min) | 10–170 ≥0.9807 | therapeutic drug monitoring [91] |
| rat plasma | 1.0 | LLE | A: ammonium acetate (30 mM) + 0.05% TEA (pH 5.86) B: ACN | gradient 1.0 mL/min | olanzapine (5.90 min) | imipramine (12.05 min) | 2–500 >0.9988 | therapeutic drug monitoring [48] |
| human serum | 0.25 | on-line SPE (column switching) | A: potassium dihydrogen phosphate (pH 3.1)/MeOH (90:10) B: ACN | gradient | N-desmethyl olanzapine (10.22 min) olanzapine (10.89 min) | 2.5–320 1.000 0 | therapeutic drug monitoring [92] | |
| rat brain tissue (microdialysates) | 0.020 | MEPS | A: ammonium acetate (10 mM) + 0.05% TEA (pH 3.00) B: ACN | gradient 4 μL/min | olanzapine (approx. 14.5 min) olanzapine N-oxide (approx. 17.5 min) | - | 0.5–250 nmol/L >0.9950 | therapeutic drug monitoring [83] |
| human plasma | - | protein precipitation | A: phosphate buffer (20 mM, pH 3.14) B: ACN | gradient 0.8 bmL/min | olanzapine (2.34 min) | carbamazepine (approx. 6.30 min) | 0.125–50.0 µg/mL 0.9999 | - [106] |
| human saliva | 1.0 | SPE | A: H2O + FA (pH 3.5) + 0.1% TEA B: ACN | gradient 0.6 mL/min | N-demethyl olanzapine (about 4.5 min) olanzapine (approx. 7 min) | chlordiazepoxide (approx. 18 min) | 10–1000 0.9948 | therapeutic drug monitoring [77] |
| human plasma | 0.09 | SPE | A: potassium dihydrogen phosphate (50 mM) B: ACN | gradient 1 mL/min | olanzapine (approx. 8.5 min) | - | 1–50 0.9961 | - [107] |
| Matrix | Sample Volume [mL] | Preparation | Mobile Phase | Elution, Flow | Source Type (Ionization) Mass Spectrometer Scan Types | Analytes (Retention Time) | IS (Retention Time) | Linearity Range for Olanzapine [ng/mL], Correlation Coefficient for Olanzapine | Application, Reference |
|---|---|---|---|---|---|---|---|---|---|
| human plasma human serum | 0.5 | SPE | A: ammonium acetate (100 mM) B: MeOH/iPOH (80:20) | gradient 1 mL/min | APCI(+)–MS/MS Multiple Reaction Monitoring (MRM) (m/z) precursor ion → (m/z) product ion 313.4 → 256.2 (OLA) 327.3 → 270.1 (IS) | olanzapine (approx. 6.5 min) | LY170222 (approx. 7 min) | 0.25–50 >0.9859 | - [64] |
| human serum | 1.0 | SPE | ACN: ammonium formate (50 mM, pH 3.0) (25:75) | isocratic 0.3 mL/min | APCI(+)–MS Selected ion monitoring (SIM) (m/z) precursor ion [OLA+H]+ 313 [IS+H]+ 327 | olanzapine (approx. 3.48 min) | LY170222 (approx. 6.10 min) | 1–1000 mg/L 0.9997 | therapeutic drug monitoring [65] |
| human blood | 0.25 | LLE | A: ammonium acetate (100 mM) B: MeOH/iPOH:H2O (60:16:4) | gradient 1 mL/min | APCI(+)–MS/MS Multiple Reaction Monitoring (MRM) (m/z) precursor ion → (m/z) product ion 313.4 → 256.2 (OLA) 327.3 → 270.1 (IS) | olanzapine (approx. 5.90 min) | LY170158 (approx. 6.30 min) | 5–500 ≥0.9983 | - [45] |
| human plasma | - | On-line SPE (column switching) | ACN:0.1% FA (20:80) | isocratic 0.5 mL/min | ESI(+)–MS/MS Selected Reaction Monitoring (SRM) (m/z) precursor ion → (m/z) product ion 313 → 256 (OLA) 296 → 251 (IS) | olanzapine (2.44 min) N-demethyl clozapine (2.61 min) | dibenzepin (3.31 min) | 5–300 µg/L ≥0.991 | - [93] |
| human plasma | 0.05 | LLE | ammonium acetate (10 mM) + FA (2.7 mM)/CAN (53:47) | isocratic 0.16 mL/min | ESI(+)–MS Selected ion monitoring (SIM) (m/z) precursor ion [OLZ+H]+ 313 [IS+H]+ 286 | olanzapine (4.80 min) | diazepam (7.44 min) | 1–50 0.9993 | therapeutic drug monitoring can be used in pharmacokinetic studies [35] |
| human serum with different anticoagulants | 0.2 | SPE | A: ACN/acetate ammonium (20 mM) (52:48) B: FA/ACN (0.1:100) | gradient 0.4 mL/min | ESI(+)–MS/MS Multiple Reaction Monitoring (MRM) (m/z) precursor ion → (m/z) product ion 312.9 → 256.0 (OLA) 316.1 → 256.0 (IS OLA) | N- desmethyl olanzapine (1.35 min) olanzapine (1.50 min) | N- desmethyl olanzapine-D8 (1.35 min) olanzapine-D3 (1.50 min) | 0.1–50 0.9993 | - [78] |
| human plasma | 0.5 | LLE | 10 mM ammonium acetate + ACN (10:90) | isocratic 0.8 mL/min | ESI(+)–MS/MS Multiple Reaction Monitoring (MRM) (m/z) precursor ion → (m/z) product ion 313 → 256 (OLA) 383 → 337 (IS) | olanzapine (1.0 min) | loratadine (1.3 min) | 0.1–30 0.998 | studies of bioavailability and bioequivalence [34] |
| rat brain tissue (homogenized) | 0.2 | LLE | A: ammonium solution (5 mM, pH 6.1) B: ACN | gradient 0.3 mL/min | ESI (+)–MS/MS Multiple Reaction Monitoring (MRM) (m/z) precursor ion → (m/z) product ion 313→256 (OLA) 326→291 (IS) | olanzapine (6.70 min) | midazolam (7.96 min) | 0.208–416.0 ng/g >0.997 | - [48] |
| human blood | 0.2 g | protein precipitation | A: ammonium hydroxide (5 mM, pH 9.0)/ACN (95:5) B: ACN | gradient 0.2 mL/min | ESI (+)–MS/MS Multiple Reaction Monitoring (MRM) (m/z) precursor ion → (m/z) product ion 313 → 256 (OLA) 296 → 251 (IS) | olanzapine (8.75) min | dibenzepin (8.77 min) | 0–0.5 mg/kg >0.99 | - [108] |
| human plasma | 0.5 | SPE | A: ammonium acetate (20 mM, pH 8.1) B: ACN | gradient 0.3 mL/min | ESI(+)–MS Selected ion monitoring (SIM) (m/z) precursor ion [OLZ+H]+ 313 [IS+H]+ 372 | olanzapine (8.1 min) | remoxipride (6.2 min) | 2–200 | therapeutic drug monitoring [79] |
| human serum human cerebrospinal fluid | 0.2 | LLE | A: ammonium formate (10 mM) + 0.05% FA B: 0.05% FA in MeOH | gradient 0.3 mL/min | ESI(+)–MS/MS Multiple Reaction Monitoring (MRM) (m/z) precursor ion → (m/z) product ion 313 → 256 (OLA) 316 → 256 (IS) | N-demethyl olanzapine (1.9 min) olanzapine (2.1 min) | olanzapine-D3 (2.1 min) | 5–100 serum 0.2–30 cerebrospinal fluid >0.999 | therapeutic drug monitoring [49] |
| human plasma | 0.5 | SPE | ACN/H2O + 2% FA (70:30) | isocratic 0.5 mL/min | ESI(+)–MS/MS Multiple Reaction Monitoring (MRM) (m/z) precursor ion → (m/z) product ion 313.15 → 256.14 (OLA) 298.1 → 153.97 (IS) | olanzapine (2.17 min) | duloxetine (1.80 min) | 0.12–25.03 0.9928 | therapeutic drug monitoring [66] |
| human plasma | 0.2 | SPE | ACN/0.01% ammonia in ammonium formate solution (2 mM, pH 6.6) (85:15) | isocratic 0.9 mL/min | ESI(+)–MS/MS Multiple Reaction Monitoring (MRM) (m/z) precursor ion → (m/z) product ion 313.2 → 256.2 (OLA) 384.2 → 253.2 (IS) | olanzapine (2.36 min) | quetiapine (2.06 min) | 0.1–40 ≥0.9996 | bioequivalence studies [73] |
| rat brain tissue (homogenized) | 0.02 | on-line SPE (column-switching) | MeOH/ACN/H2O + 0.1% ammonium acetate (43:43:14) | isocratic 0.3 mL/min | ESI(+)–MS/MS Multiple Reaction Monitoring (MRM) (m/z) precursor ion → (m/z) product ion 313 →256 (OLA) 385 → 253 (IS) | olanzapine (approx. 4.0 min) | quetiapine (approx. 4.1 min) | 0.085–17.34 0.9983 | pharmacokinetic studies [94] |
| human plasma | 0.5 | LLE | ammonium acetate (10 mM, pH 4.0)/ACN (44:56) | isocratic 0.2 mL/min | ESI(+)–MS/MS Selected ion monitoring (SIM) (m/z) precursor ion [OLZ+H]+ 313.15 [IS+H]+ 383.00 | olanzapine (4.2 min) | loratadine (3.1 min) | 0.5–50 0.9987 | bioequivalence studies [43] |
| human brain tissue | 100 mg | precipitation +SPE | A: ammonium formate (pH 8.2) B: ACN | gradient 0.4 mL/min (0–9 min) 0.5 mL/min (9–25 min) 0.4 mL/min (25–30 min) | ESI (+)–MS/MS Multiple Reaction Monitoring (MRM) (m/z) precursor ion → (m/z) product ion 313 → 256 (OLA) 380 → 169 (IS) | olanzapine (8.8 min) | haloperidol-D4 (10.7 min) | 2–8000 ng/g 0.996 | toxicological studies [89] |
| human plasma | 0.2 | SPE | MeOH/acetate ammonium (2 mM) (90:10) | isocratic 1.0 mL/min | ESI(+)–MS/MS Multiple Reaction Monitoring (MRM) (m/z) precursor ion → (m/z) product ion 313 → 256 (OLA) 316 → 256 (ISOLA) | olanzapine (1.05 min) | oanzapine-D3 (1.05 min) | 0.1–20 0.9991 | pharmacokinetic studies [70] |
| human plasma | 0.25 | LLE | ACN/H2O + 30 mM ammonium formate (pH 5.0, 90:10) | isocratic 0.400 mL/min | ESI(+)–MS/MS Multiple Reaction Monitoring (MRM) (m/z) precursor ion → (m/z) product ion 313.19 → 256.12 (OLA) 298.14 → 154.09 (IS) | olanzapine (1.69 min) | duloxetine (1.72 min) | 0.10–50 ≥0.99 | pharmacokinetic studies [39] |
| human plasma | 0.25 | protein precipitation | A: 10 mM ammonium formate in H2O (pH 3.0) B: ACN | gradient 0.4 mL/min | ESI(+)–MS/MS Multiple Reaction Monitoring (MRM) (m/z) precursor ion → (m/z) product ion 313.2 → 256.2 (OLA) 321.2 → 261.2 (ISOLA) | olanzapine (0.63 min) | olanzapine-D3 (0.62 min) | 0.5–400 0.997 | therapeutic drug monitoring [26] |
| human plasma, serum, oral fluid, and hemolyzed whole blood | 0.2 | LLE | acetate ammonium in MeOH (50 mM, pH 6.0) | isocratic 0.5 mL/min | APCI(+)–MS/MS Selected Reaction Monitoring (SRM) (m/z) precursor ion → (m/z) product ion 313.2 → 256.2 (OLA) 321.2 → 261.2 (IS OLA) | olanzapine (5.17 min) | LY170222 (4.42 min) | 2–200 >0.99 | therapeutic drug monitoring [50] |
| human serum | 0.2 | LLE | A: ammonium acetate (10 mM, pH 3.7) B: ACN | gradient 0.5 mL/min | ESI(+)–MS/MS Multiple Reaction Monitoring (MRM) (m/z) precursor ion → (m/z) product ion 313.2 → 256.0 (OLA) 316.2 → 256.0 (ISOLA) | N-demethyl olanzapine (0.79 min) olanzapine (0.91 min) | N-demethyl olanzapine-D8 (0.78 min) olanzapine-D3 (0.90 min) | 1–300 >0.99 | therapeutic drug monitoring [51] |
| human plasma | 0.4 | LLE | A: 0.1% FA in H2O B: 0.1% FA in ACN (50:50) | isocratic 1.2 mL/min | ESI(+)–MS/MS Multiple Reaction Monitoring (MRM) (m/z) precursor ion → (m/z) product ion 313.1 → 256.1 (OLA) 278.1 → 260.2 (IS) | olanzapine (0.78 min) | venlafaxine (1.04 min) | 1–20 ng/mL 0.9976 | pharmacokinetic studies [52] |
| human plasma | 0.05 | protein precipitation | A: ammonium acetate (10 mM) + 0.05% FA (pH 3.5) B: MeOH + 0.05% FA | gradient 0.3 mL/min | ESI(+)–MS/MS Selected Reaction Monitoring (SRM) (m/z) precursor ion → (m/z) product ion 313.3 → 256.1 (OLA) 230.0 → 213.1 (IS) | olanzapine (3.11 min) N-desmethyl olanzapine (3.00 min) | 4-amino-2-methyl-10H -thieno[2,3-b][1,5]-benzodiazepine (3.28 min) | 0.2–120 0.9996 | therapeutic drug monitoring [27] |
| human serum | 0.1 | protein precipitation | A: 0.1% FA in H2O B: MeOH | gradient 0.5 mL/min | ESI(+)–MS/MS Multiple Reaction Monitoring (MRM) (m/z) precursor ion → (m/z) product ion 313.1 → 256.1 (OLA) 316.1 → 256.1 (IS) | olanzapine (0.86 min) | olanzapine-D3 (0.86 min) | 5–500 nM ≥0.9990 | therapeutic drug monitoring [29] |
| human plasma | 0.2 | on-line SPE (column-switching) | A: ACN+ ammonium formate (10 mM) C: H2O + 0.01% FA | gradient 1.0 mL/min | ESI (+)–MS/MS Multiple Reaction Monitoring (MRM) (m/z) precursor ion → (m/z) product ion 313.0 → 256.2 (OLA) 256.2 → 167.2 (IS) | olanzapine (5.99 min) | diphenhydramine (7.35 min) | 0.25–50 0.9998 | therapeutic drug monitoring [95] |
| human oral fluid | 0.5 | LLE | A: ammonium acetate (10 mM, pH 3.7) B: ACN | gradient 0.5 mL/min | ESI(+)–MS/MS Multiple Reaction Monitoring (MRM) (m/z) precursor ion → (m/z) product ion 313.2 → 256.0 (OLA) 316.2 → 256.0 (ISOLA) | N-demethyl olanzapine (0.8 min) olanzapine (0.9 min) | N-demethyl olanzapine-D8 (0.8 min) olanzapine-D3 (0.9 min) | 1.6–480 ≥0.995 | therapeutic drug monitoring [19] |
| human plasma human blood | 0.025 (human blood) 0.015 (human plasma) | SLE | A: ACN/H2O/TFA/acetic acid (85:15:0.025:0.5) B: ACN/H2O/TFA/acetic acid (95:5:0.025:0.5) (25:75) | isocratic 0.5 mL/min | ESI(+)–MS/MS Selected Reaction Monitoring (SRM) (m/z) precursor ion → (m/z) product ion 313.2 → 256.1 (OLA) 317.2 → 212.7 (ISOLA) | olanzapine (3.37 min) | olanzapine-D4 (3.36 min) | 0.100–100 quantified in human plasma only 0.9994 | therapeutic drug monitoring [56] |
| human plasma | 1.0 | SPE | H2O + 0.1% FA: ACN + 0.1% FA (70:30) | isocratic 0.4 mL/min | ESI(+)–MS/MS Multiple Reaction Monitoring (MRM) (m/z) precursor ion → (m/z) product ion 313 → 256 (OLA) 411 → 191 (IS) | olanzapine (1.21 min) | risperidone (0.78 min) | 5–50 0.9971 | toxicological studies [67] |
| human plasma | 0.2 | LLE | MeOH/ammonium formate (20 mM) (82.5:17.5) | isocratic 1.0 mL/min | ESI(+)–MS/MS Multiple Reaction Monitoring (MRM) (m/z) precursor ion → (m/z) product ion 313.10 → 256.05 (OLA) 316.05 → 256.05 (ISOLA) | olanzapine (2.68 min) | olanzapine-D3 (2.66 min) | 0.2–25 >0.9900 | pharmacokinetic studies [32] |
| human plasma | 0.45 | LLE | A: ACN B: 0.2% FA in H2O | gradient 0.6 mL/min | ESI(+)–MS/MS Multiple Reaction Monitoring (MRM) (m/z) precursor ion → (m/z) product ion 313.0 → 256.0 (OLA) 294.2 → 225.1 (IS) | olanzapine (2.65 min) | anastrozole (7.45 min) | 0.5–100 0.998 | therapeutic drug monitoring [33] |
| human plasma | 0.5 | SPE | A: ammonium formate (2 mM, pH 2.7) B: ACN | gradient 0.8 mL/min | ESI (+) Multiple Reaction Monitoring (MRM) (m/z) precursor ion → (m/z) product ion 313.2 → 198.2 (OLZ) 453.3 → 230.2 (IS) | olanzapine (2.34 min) | repaglinide | 5–150 0.99915 | therapeutic drug monitoring [71] |
| human plasma | 0.2 | protein precipitation | A: ammonium formate (2 mM) + 0.2% FA B: ACN + ammonium formate (2 mM) + 0.2% FA | gradient 0.4 mL/min | WHEN (+)/WHEN (−)–MS/MS Multiple Reaction Monitoring (MRM). (m/z) precursor ion → (m/z) product ion 313.1 → 256.2 (OLA) 298.3 → 103.0 (IS OLA) | olanzapine (3.50 min) | topiramate-D12 (6.0 min) trimipramine-D3 (6.51 min) | 0.01–0.5 0.9997 | - [109] |
| rat plasma | 0.1 | SLE | ACN/ammonium formate (15 mM) + 0.05% TFA (60:40) | isocratic 1 mL/min | ESI(+)–MS Selected ion monitoring (SIM) (m/z) precursor ion [OLZ+H]+ 313 [IS+H]+ 441 | olanzapine (5.82 min) | risperidone (3.10 min) | 2–5000 ng/mL 0.9989 | therapeutic drug monitoring [57] |
| human plasma | 0.095 | protein precipitation | A: MeOH B: 0.005% heptafluorobutyric acid + ammonium formate (10 mM) | gradient 0.5 mL/min | ESI(+)–MS/MS Multiple Reaction Monitoring (MRM) (m/z) precursor ion → (m/z) product ion 313.2 → 256.1 (OLA) 316.2 → 256.1 (IS OLA) | olanzapine (1.97 min) | olanzapine-D3 (1.97 min) | 0.1–20 0.9989 | bioequivalence studies [110] |
| human plasma | 0.5 | LLE | H2O + 0.1% trifluoroacetic acid/ACN (20:80) | isocratic 1 mL/min | ESI(+)–MS Selected ion monitoring (SIM) (m/z) precursor ion [OLZ+H]+ 313.1 [IS+H]+ 429.4 | olanzapine (1.53 min) | irbesartan (2.12 min) | 2–300 >0.9993 | therapeutic drug monitoring [53] |
| human plasma | 0.2 | µSPE | A: 0.2% formic acid (pH 3.0) D: 0.2% formic acid/ACN (65:35) | gradient 0.6 mL/min | APCI(+)–MS/MS Selected Reaction Monitoring (SRM) (m/z) precursor ion → (m/z) product ion 313.2 → 256.2 (OLA) 317.3 → 256.2 (IS OLA) | olanzapine (1.941 min) | olanzapine-13C-D3 (1.940 min) | 0.70–60 ng/mL >0.99 | therapeutic drug monitoring [72] |
| human plasma | 0.09 | LLE | formate ammonium (5 M, pH of 4.7) and 85.5% of acetonitrile | isocratic 1.2 mL/min | ESI(+)–MS/MS Multiple Reaction Monitoring (MRM) (m/z) precursor ion → (m/z) product ion 313.1 → 256.1 (OLA) 278.2 → 260.2 (IS) | olanzapine (4.0 min) | venlafaxine (about 2.9 min) | 1.0–20 | bioequivalence and pharmacokinetic studies [40] |
| human saliva | 0.5 | SPE | A: ammonium formate (2 mM) B: ACN | gradient 0.25 mL/min | ESI(+)–MS/MS Multiple Reaction Monitoring (MRM) (m/z) precursor ion → (m/z) product ion 313.5 → 256.3 (OLA) 321.5 → 261.3 (IS) | olanzapine (2.41 min) | olanzapine-D8 (2.41 min) | 1–500 >0.9980 | therapeutic drug monitoring [80] |
| human serum | 0.050 | protein precipitation | A: ammonium formate (2 mM) B: MeOH | gradient 0.5 mL/min | ESI(+)–MS/MS Multiple Reaction Monitoring (MRM) (m/z) precursor ion → (m/z) product ion 313.2 → 256.1 (OLA) 321.2 → 261.2 (ISOLA) | olanzapine (1.30 min) | olanzapine-D8 (1.26 min) | 5–500 ≥0.9946 | therapeutic drug monitoring [25] |
| protein and melanin hair fraction | 10 mg | SPE | A: 0.1% FA in H2O B: ACN | gradient 0.8 mL/min | ESI(+)–MS/MS Multiple Reaction Monitoring (MRM) (m/z) precursor ion → (m/z) product ion 313.2→256.1 (OLA) 321.2→260.1 (IS OLA) | desmethyl olanzapine (0.82 min) olanzapine (0.83 min) | N-desmetyl olanzapine-D8 (0.73 min) olanzapine-D8 (0.83 min) | 40–1600 | therapeutic drug monitoring [81] |
| human hair | 10 mg | LSE | A: ammonium formate (5 mM, pH 3.0) B: 0.1% FA in ACN | gradient 0.4 mL/min | ESI (+)–MS/MS Multiple Reaction Monitoring (MRM) (m/z) precursor ion → (m/z) product ion 313 → 256 (OLA) 316 → 87 (IS) | olanzapine N-desmethyl olanzapine | olanzapine-D3 | 0.005–10.0 | therapeutic drug monitoring [111,112] |
| dry plasma spots | 100 µL plasma per disk | protein precipitation | A: 0.2% ammonium acetate (1M) + H2O/MeOH (95:5) B: 0.2% ammonium acetate (1M) + H2O/MeOH (5:95) | lower gradient 0.5 mL/min | ESI (+)–MS/MS Multiple Reaction Monitoring (MRM). (m/z) precursor ion → (m/z) product ion 313.1→256.1 (OLA) 316.1→256.1 (IS OLA) | olanzapine (1.04 min) | olanzapine-D3 (1.04 min) | 7.3–151.0 >0.980 | therapeutic drug monitoring [14] |
| nails hair | 30 mg of nails 25 mg hair | SPE | A: ammonium formate + 0.1% FA B: ACN | gradient 0.3 mL/min | ESI(+)–MS/MS Multiple Reaction Monitoring (MRM) (m/z) precursor ion → (m/z) product ion 313.23→256.2 (OLA) 321.37→261.3 (ISOLA) | olanzapine (1.2 min) | olanzapine-D8 (1.3 min) | 10–10,000 pg/mg ≥0.99 | therapeutic drug monitoring [82] |
| human plasma | 0.1 | SLE | A: H2O + 0.1% FA B: MeOH | gradient 0.3 mL/min | ESI(+)–MS/MS Multiple Reaction Monitoring (MRM) (m/z) precursor ion → (m/z) product ion 313.2→256.1 (OLA) 415.3→195.2 (IS OLA) | olanzapine (3.322 min) | risperidone-D4 (6.929 min) | 1–100 >0.995 | therapeutic drug monitoring [58] |
| human plasma | 0.2 | LLE | A: H2O + 0.1% FA B: ACN/H2O + 0.1% FA (9:1) | gradient 0.5 mL/min. | ESI(+)–MS/MS Multiple Reaction Monitoring (MRM) (m/z) precursor ion → (m/z) product ion 313.2→256.0 (OLA) 316.2→256.0 (ISOLA) | desmethyl olanzapine (1.88 min) olanzapine (1.93 min) | desmethyl olanzapine-D8 (1.91 min) olanzapine-D3 (1.95 min) | 1.0–512.0 | therapeutic drug monitoring [41] |
| human serum | 1.0 | Pipette-tip micro-SPE | A: 0.1% FA + ammonium acetate (10 mM) B: ACN | gradient 0.3 mL/min | ESI (+)–MS Selected ion monitoring (SIM) (m/z) precursor ion [OLZ+H]+ 313.1476 | olanzapine (2.9 min) | - | 0.5–400 0.996 | therapeutic drug monitoring [113] |
| postmortem human blood | 0.1 | SLE | A: 0.1% FA + ammonium formate (10 mM) B:0.1% FA + ammonium formate (10 mM) in MeOH | gradient 0.5 mL/min | ESI (+)/ESI (−)–MS/MS Selected Reaction Monitoring (SRM). (m/z) precursor ion → (m/z) product ion 313.2 → 84.3 (OLA) 290.2 → 198.2 (IS OLA) | olanzapine (2.36 min) | diazepam-D5 (4.52 min) | 5–5000 0.998 | toxicological studies [59] |
| human plasma | 0.5 | LLE | MeOH/0.5% FA (60:40) | isocratic 0.5 mL/min | ESI(+)–MS/MS Multiple Reaction Monitoring (MRM) (m/z) precursor ion → (m/z) product ion 313.2→256.1 (OLA) 327→270 (ISOLA) | olanzapine (0.9 min) | clozapine (1 min) | 1–20 0.9976 | bioequivalence studies [54] |
| human body fluids (blood, pericardial fluid, gastric contents, bile, and urine) | 0.04 | 1. protein precipitation 2. LLE | A: ammonium acetate (10 mM) B: MeOH | gradient 0.2 mL/min | ESI(+)–MS/MS Multiple Reaction Monitoring (MRM) (m/z) precursor ion → (m/z) product ion 313→256 (OLA) 321.2→261.1 (IS) | olanzapine N- desmethyl olanzapine 2- OH-methylolanzapine olanzapine N- oxide | olanzapine-D8 | 0.05–10 >0.99 | - [114] |
| Reference | Matrix | Conditions | Result |
|---|---|---|---|
| [75] | rat plasma | −70 °C (19 weeks) | stable |
| [64] | human plasma | room temperature (24 h) −70 °C (59 days) freeze–thaw (3 cycles) extracts (24 h) | stable |
| human serum | room temperature (24 h) −70 °C (59 days) freeze–thaw (3 cycles) extracts (24 h) | ||
| propanol solutions | −20 °C (35 days) | ||
| [76] | human milk | −70 °C (10 months) freeze–thaw (3 cycles) extracts (48 h) | stable |
| [65] | human serum | −20 °C (30 days) extracts: −20 °C (30 days) | stable |
| [36] | human serum (with 0.25% ascorbic acid) | room temperature (24 h) 4–8 °C (2 weeks) | unstable without ascorbic acid after 1 week at 4–8 °C and 24 h at ambient temperature |
| [68] | methanol solutions | −20 °C (2 months) | stable |
| [46] | rat brain (homogenized) | room temperature (2 h, 4 h) −70 °C (100 days) freeze–thaw (2 cycles) extracts (48 h) | unstable at room temperature after 4 h |
| [44] | human plasma | 4 °C (7 days) −20 °C (3 months) | stable |
| [45] | human hemolyzed whole blood (with ascorbic acid, 333 mM) | room temperature (24 h) −70 °C (7 days) extracts (48 h) | stable |
| propanol solutions | −20 °C (35 days) freeze–thaw (2 cycles) | ||
| [38] | human plasma | room temperature (24 h) 4 °C (72 h) −20 °C (30 days) freeze–thaw (3 cycles) extracts: 4 °C (24 h) | unstable at ambient temperature in daylight after 24 h |
| [47] | human plasma | −70 °C (5 months) room temperature (4 h) freeze–thaw (3 cycles) | stable |
| reconstituted sample | room temperature (18 h) | ||
| [69] | methanol solutions | −80 °C (1 year) | stable |
| [105] | methanol solutions | −80 °C (1 year) | stable |
| [138] | human plasma | room temperature (14 days) −20 °C (12 months, repeated freeze–thaw) | unstable at room temperature after 7 days and at −20 °C with repeated freezing and thawing |
| [35] | human plasma (with 2.5% ascorbic acid) | room temperature (24 h) −20 °C (30 days) freeze–thaw (3 cycles) | unstable without ascorbic acid at room temperature after 24 h, and in repeated freeze–thaw cycles |
| methanol solution | −20 °C (3 months) | ||
| [91] | human plasma | room temperature (7 days) 20 °C (3 months) | unstable at ambient temperature after 7 days |
| [34] | human plasma | −50 °C (3 weeks) | stable |
| methanol solutions | 4–8 °C (4 months) | ||
| [48] | solutions in 5 mM ammonium formate–acetonitrile | −20 °C (3 months) | unstable at room temperature after 12 h |
| rat brains (homogenized) | room temperature (2 h, 12 h) freeze–thaw (3 cycles) 24 h extracts | ||
| [108] | human whole blood (with 0.5% ascorbic acid) | −20 °C (12 months) extract: room temperature (3 days) | stable |
| [79] | human plasma | room temperature (24 h, 72 h) 4 °C (72 h) −20 °C (2 months) freeze and thaw (1 cycle, 3 cycles) extracts: room temperature (36 h) 4 °C (36 h) | unstable at room temperature and 4 °C after 72 h, in extracts at room temperature, at 4 °C after 36 h, and after 3 freeze–thaw cycles |
| [49] | human plasma | −20 °C (12 months) freeze–thaw (3 cycles) | unstable extracts after a freeze–thaw or storage cycle fridge 4 °C (24 h) |
| [139] | methanol solutions | room temperature 4–8 °C (1 year) | unstable after 1 month at ambient temperature and after 3 months at 4–8 °C |
| [73] | human plasma | room temperature (24 h) 20 °C (90 days) freeze–thaw (6 cycles) | stable |
| methanol solutions | 4 °C (41 days) extracts: room temperature (45 h) 4 °C (97 h) | ||
| [137] | whole human blood | 20 °C (10 weeks) 4 °C (10 weeks) −20 °C (10 weeks) −60 °C (10 weeks) | unstable in all conditions |
| [66] | human plasma | room temperature (6 h) freezing and thawing (5 cycles) 10 °C (24 h) −70 °C (45 days) | stable |
| dry extract | 2–8 °C (24 h) | ||
| [94] | Ringer’s fluid | room temperature (12 h) −70 °C (45 days) freezing and thawing (3 cycles) | stable |
| [43] | human plasma | room temperature (8 h) −20 °C (15 days) 15 °C (24 h) | stable |
| methanol solutions | room temperature (24 h) 4 °C (15 days) | ||
| [89] | propanol solutions human brains (homogenized) | −70 °C (3 months) extracts (24 h) freezing and thawing (3 cycles) | unstable calibration solutions at −42 °C after 24 h |
| [70] | methanol solutions | room temperature (23 h) 2–8° (5 days) | stable |
| human plasma | room temperature (7 h) −20 °C (21 days) −80 °C (6 days) freezing and thawing (5 cycles) extracts (58 h) | ||
| [39] | human plasma | room temperature (5.22 h) −70 °C (22 days) freezing and thawing (4 cycles) extract (24 h) dry extract (24 h) wet extract (24 h) | stable |
| [26] | human blood (K3-EDTA anticoagulant) | room temperature (72 h) 4 °C (72 h) | stable |
| human blood (anticoagulant lithium heparin) human plasma | room temperature (72 h) 4 °C (72 h) room temperature (72 h) 4 °C (72 h) −20 °C (3 months) freezing and thawing (3 cycles) extracts: 10 °C (72 h) | ||
| [51] | human serum | room temperature (2 h, 3 h) −20 °C (3 months) freezing and thawing (4 cycles) extracts (every 24 h for 5 days) | stable |
| [52] | human plasma | room temperature (6 h) 4 °C (5 days) −70 °C (56 days) freezing and thawing (3 cycles) extracts (8 h) | stable |
| [27] | human plasma | room temperature (2 h) freezing and thawing (3 cycles) −70 °C (40 days) extracts: 4 °C (18 h) | stable |
| [29] | enriched human serum | room temperature, darkness and 3000 lux (0 h, 2 h, 4 h, 8 h, 24 h, 48 h) 4–8°, dark and 550 lux (0 h, 24 h, 48 h, 4 days, 7 days) −20 °C darkness (3 months, 6 months) freezing and thawing (3 cycles) −70 °C (40 days) extracts: 4–8 °C (24 h, 72 h) | unstable in spiked serum at room temperature, 3000 lux after 4 h, at 4–8 °C, 550 lux after 7 days, in patient serum at room temperature, 3000 lux after 48 h, and at 4–8 °C, 550 lux after 7 days |
| whole human blood | room temperature, darkness and 3000 lux (0 h, 2 h, 4 h, 8 h, 24 h, 48 h) | ||
| serum collected from patients | room temperature, darkness and 3000 lux (0 h, 2 h, 4 h, 8 h, 24 h, 48 h) 4–8 °C, dark (0 h, 24 h, 48 h, 8 days) 4–8 °C, 550 lux (0 h, 72 h, 7 days, 14 days) −35 °C, dark (0 h, 24 h, 48 h, 72 h, 96 h) | ||
| [95] | human plasma | room temperature (6 h) 4 °C (24 h) −80 °C (30 days) freezing and thawing (3 cycles) | stable |
| [13] | saliva | 4 °C (2 days, 5 days, 7 days) | stable |
| [56] | human plasma | room temperature (6 h) on ice (31 h) −20 °C (614 days) −70 °C (614 days) freeze and thaw, −20 °C (5 cycles) freeze and thaw, −70 °C (5 cycles) extract 2–8 °C (267 h) | stable |
| whole human blood | on ice (24 h) −20 °C (108 days) −70 °C (18 days) freeze and thaw, −20 °C (5 cycles) freeze and thaw, −70 °C (5 cycles) extract 2–8 °C (61 h) | ||
| [67] | human plasma | −20 °C (12 months) | stable |
| [32] | human plasma | room temperature (24 h) −70 °C (21 days) freezing and thawing (3 cycles) extracts (48 h) | stable |
| [33] | human serum | freezing and thawing (3 cycles) | stable |
| [71] | human plasma | room temperature (6 h) −20 °C (1 month) freezing and thawing (4 cycles) extracts (24 h) | stable |
| [57] | rat plasma | room temperature (6 h) −20 °C (30 days) freeze and thaw, −20 °C to 25 °C (1 cycle) extracts (24 h) | stable |
| [110] | human plasma | room temperature (24 h) freeze and thaw, −80 °C (4 cycles) −80 °C (62 days) extracts (31 h) | stable |
| [53] | human plasma | room temperature (24 h, 48 h, 72 h) 4 °C (24 h, 48 h, 72 h) −20 °C (24 h, 48 h, 72 h) freezing and thawing (4 cycles) | unstable at room temperature after 48 h |
| [72] | human plasma | room temperature (24 h) 4 °C (24 h) −80 °C (1 month, 62 days) freeze and thaw, −80 °C (3 cycles) extracts 19 °C | stable |
| [80] | saliva | 8 °C (72 h) –21 °C (72 h) extracts: 6 °C (72 h) | stable |
| [25] | human serum | room temperature (24 h) −20 °C (8 days) freezing and thawing (3 cycles) extracts: 4 °C (24 h) | stable |
| [58] | human serum | room temperature (24 h) 4 °C (24 h, 48 h) −20 °C (7 days) | sable |
| [81] | extract of hair | 4–8 °C (3 days) | stable |
| [14] | dried papers plasma spots | room temperature (0 days, 3 days, 8 days) | stable |
| [82] | nails and hair extracts | 6 °C (72 h) | stable |
| [41] | human plasma | room temperature (3 h) −20 °C (3 months) freezing and thawing (3 cycles) extracts (72 h) | stable |
| [113] | human serum | room temperature (12 h) 4 °C (7 days) | stable |
| [59] | whole human blood | room temperature (4 h) −80 °C (28 days) freezing and thawing (3 cycles) | stable |
| [114] | urine (sodium ascorbate, 3 mM) | room temperature (1 day, 2 days, 4 days, 7 days) 4 °C (1 day, 2 days, 4 days, 7 days) −30 °C (3 months) freezing and thawing (3 cycles) extracts: 4 °C (7 days) 10 °C (4 days) | |
| whole blood (sodium ascorbate, 3 mM) | room temperature (1 day, 2 days, 4 days, 7 days) 4 °C (1 day, 2 days, 4 days, 7 days) −30 °C (3 months) freezing and thawing (3 cycles) extracts: 4 °C (7 days) 10 °C (4 days) | unstable with ascorbate addition at room temperature after 1 day | |
| urine | room temperature (1 day, 2 days, 4 days, 7 days) 4 °C (1 day, 2 days, 4 days, 7 days) −30 °C (3 months) freezing and thawing (3 cycles) | ||
| full blood | room temperature (1 day, 2 days, 4 days, 7 days) 4 °C (1 day, 2 days, 4 days, 7 days) −30 °C (3 months) | unstable in whole blood without ascorbate addition at room temperature | |
| [83] | Ringer’s solution | 5 °C (24 h) −80 °C (20 days) freezing and defrosting (3 cycles) | stable |
| [107] | human plasma | room temperature (24 h) −20 °C (2 weeks) freezing and thawing (3 cycles) | stable |
| [77] | saliva | 8 °C (-) −21 °C (-) extracts: 15 °C (72 h) | stable |
| [107] | human plasma | 4 °C (24 h) −20 °C (7 days) freeze and thaw, −20 °C to 25 °C (1 cycle) | stable |
| [129] | human plasma | −40 °C (0 days, 15 days, 30 days, 90 days) | stable |
| [128] | human plasma | room temperature, darkness (4 days) −18 °C (4 days) | unstable at room temperature after 7 days |
| [85] | human urine | room temperature (15 h, 48 h, 88 h) −24 °C (3 weeks) freezing and thawing (6 cycles) | unstable at room temperature after 48 h |
| [136] | methanolic stock solutions | 2–8 °C (6 months) −20 °C (1 year) | not stable in methanol solution at 2–8 °C after 6 months |
| human plasma | room temperature (5 days) 2–8 °C (1 month) −20 °C (1 year, 2 years) freezing and thawing (3 cycles) | not stable in human plasma at room temperature after 4 days, at 2–8 °C after 3 weeks, at −20 °C after 2 years | |
| hemolyzed whole blood | room temperature (5 days) 2–8 °C (1 month) −20 °C (1 year, 2 years) freezing and thawing (3 cycles) | not stable in hemolyzed whole blood at room temperature after 2 days, at 2–8 °C after 1 week, at −20 °C after 2 months, and after three freeze–thaw cycles | |
| hemolyzed whole blood (ascorbic acid, 300 mg/L)/(DTT, 300 mg/L)/(TCEP, 300 mg/L) | −20 °C (1 month) freezing and thawing (3 cycles) | the ascorbic acid-added solutions showed the lowest loss of olanzapine after 23 days at −20 °C and freeze–thaw compared to the DTT and TCEP solutions, which were similar to the unsupplemented solutions | |
| oral fluid | room temperature (2 days) 2–8 °C (1 week) −20 °C (2 months) freezing and thawing (3 cycles) | not stable in oral fluid at room temperature after 2 days, at 2–8 °C after 1 week, at −20 °C after 2 months, and after three freeze–thaw cycles | |
| human serum and calf serum | room temperature (2 days) 2–8 °C (1 week, 1 month) −20 °C (9 months) | not stable in human serum and calf serum at room temperature after 2 days unstable in human serum at 2–8 °C after 5 days and in calf serum after 3 weeks unstable in human serum at −20 °C after 9 months |
Disclaimer/Publisher’s Note: The statements, opinions and data contained in all publications are solely those of the individual author(s) and contributor(s) and not of MDPI and/or the editor(s). MDPI and/or the editor(s) disclaim responsibility for any injury to people or property resulting from any ideas, methods, instructions or products referred to in the content. |
© 2024 by the authors. Licensee MDPI, Basel, Switzerland. This article is an open access article distributed under the terms and conditions of the Creative Commons Attribution (CC BY) license (https://creativecommons.org/licenses/by/4.0/).
Share and Cite
Czyż, A.; Zakrzewska-Sito, A.; Kuczyńska, J. A Review of Advances in Bioanalytical Methods for the Detection and Quantification of Olanzapine and Its Metabolites in Complex Biological Matrices. Pharmaceuticals 2024, 17, 403. https://doi.org/10.3390/ph17030403
Czyż A, Zakrzewska-Sito A, Kuczyńska J. A Review of Advances in Bioanalytical Methods for the Detection and Quantification of Olanzapine and Its Metabolites in Complex Biological Matrices. Pharmaceuticals. 2024; 17(3):403. https://doi.org/10.3390/ph17030403
Chicago/Turabian StyleCzyż, Anna, Alicja Zakrzewska-Sito, and Julita Kuczyńska. 2024. "A Review of Advances in Bioanalytical Methods for the Detection and Quantification of Olanzapine and Its Metabolites in Complex Biological Matrices" Pharmaceuticals 17, no. 3: 403. https://doi.org/10.3390/ph17030403