
Flash Glucose Monitoring in Croatia: The Optimal Number of Scans per Day to Achieve Good Glycemic Control in Type 1 Diabetes
 ,
,
Abstract
:1. Introduction
2. Materials and Methods
2.1. Study Population and Data Collection
2.2. Data Analysis
2.3. Outcomes
2.4. Statistical Analysis
3. Results
3.1. Data Analysis According to Bins of Scanning Frequency
3.2. Data Analysis According to Bins of TIR
3.3. Croatian and Worldwide Data Analysis According to Bins of TIR
4. Discussion
5. Conclusions
Author Contributions
Funding
Informed Consent Statement
Data Availability Statement
Conflicts of Interest
References
- Stratton, I.M.; Adler, A.I.; Neil, H.A.; Matthews, D.R.; Manley, S.E.; Cull, C.A.; Hadden, D.; Turner, R.C.; Holman, R.R. Association of glycemia with macrovascular and microvascular complications of type 2 diabetes (UKPDS 35): Prospective observational study. BMJ 2000, 321, 405–412. [Google Scholar] [CrossRef] [PubMed]
- Khunti, K.; Davies, M.; Majeed, A.; Thorsted, B.L.; Wolden, M.L.; Paul, S.K. Hypoglycemia and risk of cardiovascular disease and all cause mortality in insulin-treated people with type 1 and type 2 diabetes: A cohort study. Diabetes Care 2015, 38, 316–322. [Google Scholar] [CrossRef] [PubMed]
- Miller, K.M.; Beck, R.W.; Bergenstal, R.M.; Goland, R.S.; Haller, M.J.; McGill, J.B.; Rodriguez, H.; Simmons, J.H.; Hirsch, I.B.; T1D Exchange Clinic Network. Evidence of a strong association between frequency of self-monitoring of blood glucose and hemoglobin A1c levels in T1D exchange clinic registry participants. Diabetes Care 2013, 36, 2009–2014. [Google Scholar] [CrossRef] [PubMed]
- Heinemann, L. Finger pricking and pain: A never ending story. J. Diabetes Sci. Technol. 2008, 2, 919–921. [Google Scholar] [CrossRef]
- Lind, M.; Polonsky, W.; Hirsch, I.B.; Heise, T.; Bolinder, J.; Dahlqvist, S.; Schwarz, E.; Ólafsdóttir, A.F.; Frid, A.; Wedel, H.; et al. Continuous glucose monitoring vs conventional therapy for glycemic control in adults with type 1 diabetes treated with multiple daily insulin injections: The gold randomized clinical trial. JAMA 2017, 317, 379–387. [Google Scholar] [CrossRef]
- Danne, T.; Nimri, R.; Battelino, T.; Bergenstal, R.M.; Close, K.L.; DeVries, J.H.; Garg, S.; Heinemann, L.; Hirsch, I.; Amiel, S.A.; et al. International consensus on use of continuous glucose monitoring. Diabetes Care 2017, 40, 1631–1640. [Google Scholar] [CrossRef]
- Chico, A.; Aguilera, E.; Ampudia-Blasco, F.J.; Bellido, V.; Cardona-Hernández, R.; Escalada, F.J.; Fernández, D.; Gómez-Peralta, F.; González Pérez de Villar, N.; Gorgojo, J.J.; et al. Clinical approach to flash glucose monitoring: An expert recommendation. J. Diabetes Sci. Technol. 2020, 14, 155–164. [Google Scholar] [CrossRef]
- Reddy, N.; Verma, N.; Dungan, K. Monitoring Technologies-Continuous Glucose Monitoring, Mobile Technology, Biomarkers of Glycemic Control. In Endotext [Internet]; Feingold, K.R., Anawalt, B., Blackman, M.R., Boyce, A., Chrousos, G., Corpas, E., de Herder, W.W., Dhatariya, K., Dungan, K., Hofland, J., et al., Eds.; Endotext [Internet]: South Dartmouth, MA, USA, 2023. [Google Scholar]
- Laffel, L.M.; Bailey, T.S.; Christiansen, M.P.; Reid, J.L.; Beck, S.E. Accuracy of a Seventh-Generation Continuous Glucose Monitoring System in Children and Adolescents with Type 1 Diabetes. J. Diabetes Sci. Technol. 2023, 17, 962–967. [Google Scholar] [CrossRef]
- Bolinder, J.; Antuna, R.; Geelhoed-Duijvestijn, P.; Kröger, J.; Weitgasser, R. Novel glucosesensing technology and hypoglycaemia in type 1 diabetes: A multicentre, non-masked, randomised controlled trial. Lancet 2016, 388, 2254–2263. [Google Scholar] [CrossRef]
- Haak, T.; Hanaire, H.; Ajjan, R.; Hermanns, N.; Riveline, J.-P.; Rayman, G. Use of Flash Glucose-Sensing Technology for 12 months as a Replacement for Blood Glucose Monitoring in Insulin-treated Type 2 Diabetes. Diabetes Ther. 2017, 8, 573–586. [Google Scholar] [CrossRef]
- Canecki Varzic, S.; Steiner, K.; Gradinjan Centner, M.; Grgurevic, M.; Cigrovski Berkovic, M.; Klobucar Majanovic, S.; Radman, M.; Milicevic, T.; Rahelic, D.; Bilic Curcic, I. Assessment of FreeStyle Libre Flash Glucose Monitoring System Implementation in Real Life Clinical Setting: A Prospective Observational Study. Diagnostics 2021, 11, 305. [Google Scholar] [CrossRef] [PubMed]
- Battelino, T.; Danne, T.; Bergenstal, R.M.; Amiel, S.A.; Beck, R.; Biester, T.; Bosi, E.; Buckingham, B.A.; Cefalu, W.T.; Close, K.L.; et al. Clinical Targets for Continuous Glucose Monitoring Data Interpretation: Recommendations from the International Consensus on Time in Range. Diabetes Care 2019, 42, 1593–1603. [Google Scholar] [CrossRef]
- Bergenstal, R.M.; Beck, R.W.; Close, K.L.; Grunberger, G.; Sacks, D.B.; Kowalski, A.; Brown, A.S.; Heinemann, L.; Aleppo, G.; Ryan, D.B.; et al. Glucose Management Indicator (GMI): A New Term for Estimating A1C From Continuous Glucose Monitoring. Diabetes Care 2018, 41, 2275–2280. [Google Scholar] [CrossRef] [PubMed]
- Charleer, S.; De Block, C.; Van Huffel, L.; Broos, B.; Fieuws, S.; Nobels, F.; Mathieu, C.; Gillard, P. Quality of life and Glucose Control After 1 Year of Nationwide Reimbursement of Intermittently Scanned Glucose Monitoring in Adults Living with Type 1 Diabetes (FUTURE): A prospective Observational Real-World Cohort Study. Diabetes Care 2020, 43, 389–397. [Google Scholar] [CrossRef] [PubMed]
- Dunn, T.C.; Xu, Y.; Hayter, G.; Ajjan, R.A. Real-world flash glucose monitoring patterns and associations between self-monitoring frequency and glycaemic measures: A European analysis of over 60 million glucose tests. Diabetes Res. Clin. Pract. 2018, 137, 37–46. [Google Scholar] [CrossRef]
- Lameijer, A.; Lommerde, N.; Dunn, T.C.; Fokkert, M.J.; Edens, M.A.; Kao, K.; Xu, Y.; Gans, R.O.B.; Bilo, H.J.G.; van Dijk, P.R. Flash Glucose Monitoring in the Netherlands: Increased monitoring frequency is associated with improvement of glycemic parameters. Diabetes Res. Clin. Pract. 2021, 177, 108897. [Google Scholar] [CrossRef]
- Gomez-Peralta, F.; Dunn, T.; Landuyt, K.; Xu, Y.; Merino-Torres, J.F. Flash glucose monitoring reduces glycemic variability and hypoglycemia: Real-world data from Spain. BMJ Open Diabetes Res. Care 2020, 8, e001052. [Google Scholar] [CrossRef]
- Calliari, L.E.P.; Krakauer, M.; Vianna, A.G.D.; Ram, Y.; Barbieri, D.E.; Xu, Y.; Dunn, T.C. Real-world flash glucose monitoring in Brazil: Can sensors make a difference in diabetes management in developing countries? Diabetol. Metab. Syndr. 2020, 12, 3. [Google Scholar] [CrossRef]
- Hohendorff, J.; Gumprecht, J.; Mysliwiec, M.; Zozulinska-Ziolkiewicz, D.; Tadeusz Malecki, M. Intermittently Scanned Continuous Glucose Monitoring Data of Polish Patients from Real-Life Conditions: More Scanning and Better Glycemic Control Compared to Worldwide Dana. Diabetes Technol. Ther. 2021, 23, 577–585. [Google Scholar] [CrossRef]
- Jangam, S.; Dunn, T.; Xu, Y.; Hayter, G.; Ajjan, R.A. Flash glucose monitoring improves glycemia in higher risk patients: A longitudinal, observational study under real-life settings. BMJ Open Diabetes Res. Care 2019, 7, e000611. [Google Scholar] [CrossRef]
- Boscari, F.; Ferretto, S.; Cavallin, F.; Fadini, G.P.; Avogaro, A.; Bruttomesso, D. Effectiveness of adding alarms to flash glucose monitoring in adults with type 1 diabetes under routine care. Acta Diabetol. 2022, 59, 921–928. [Google Scholar] [CrossRef] [PubMed]
- Buoite Stella, A.; Assaloni, R.; Tonutti, L.; Manca, E.; Tortul, C.; Candido, R.; Francescato, M.P. Strategies used by Patients with Type 1 Diabetes to Avoid Hypoglycemia in a 24 × 1-Hour Marathon: Comparison with the Amounts of Carbohydrates Estimated by a Customizable Algorithm. Can. J. Diabetes 2017, 41, 184–189. [Google Scholar] [CrossRef] [PubMed]
- Riddell, M.C.; Milliken, J. Preventing exercise-induced hypoglycemia in type 1 diabetes using real-time continuous glucose monitoring and a new carbohydrate intake algorithm: An observational field study. Diabetes Technol. Ther. 2011, 13, 819–825. [Google Scholar] [CrossRef] [PubMed]
- Elian, V.; Popovici, V.; Ozon, E.A.; Musuc, A.M.; Fița, A.C.; Rusu, E.; Radulian, G.; Lupuliasa, D. Current Technologies for Managing Type 1 Diabetes Mellitus and Their Impact on Quality of Life—A Narrative Review. Life 2023, 13, 1663. [Google Scholar] [CrossRef] [PubMed]
- Cappon, G.; Vettoretti, M.; Sparacino, G.; Facchinetti, A. Continuous Glucose Monitoring Sensors for Diabetes Management: A Review of Technologies and Applications. Diabetes Metab. J. 2019, 43, 383–397. [Google Scholar] [CrossRef]


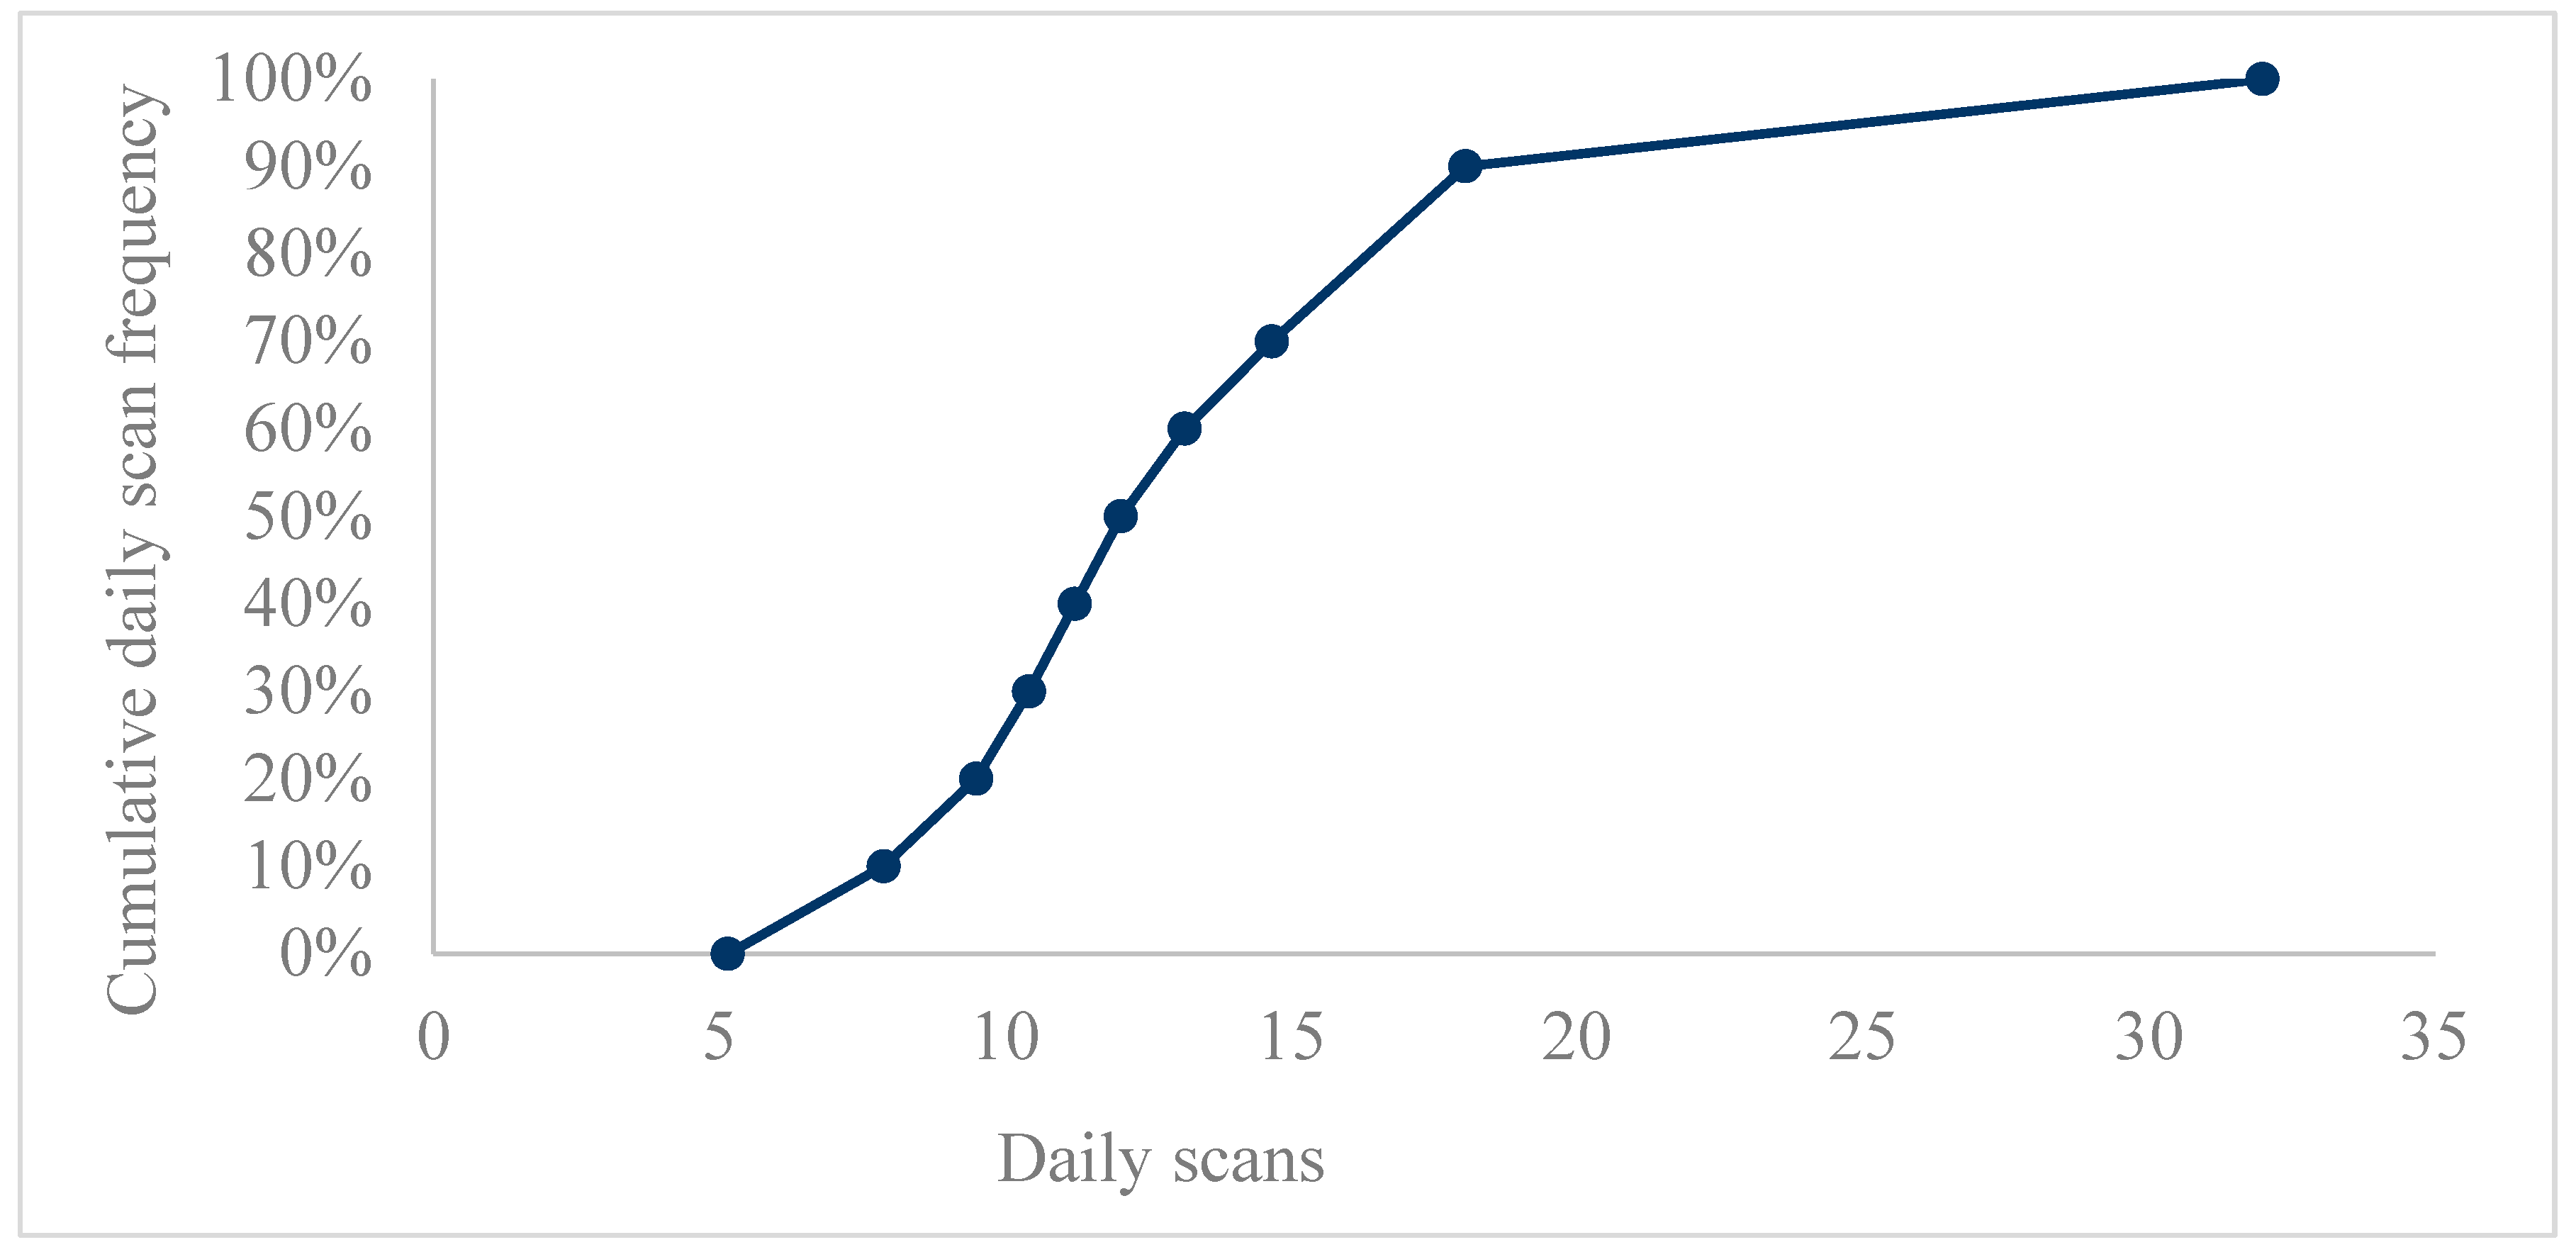
| Mean | Std. Deviation | Minimum | Maximum | Percentiles | |||
|---|---|---|---|---|---|---|---|
| 25th | 50th (Median) | 75th | |||||
| Daily Scans Mean | 13.40073 | 7.438523 | 5.149 | 31.981 | 9.08825 | 11.62062 | 15.51041 |
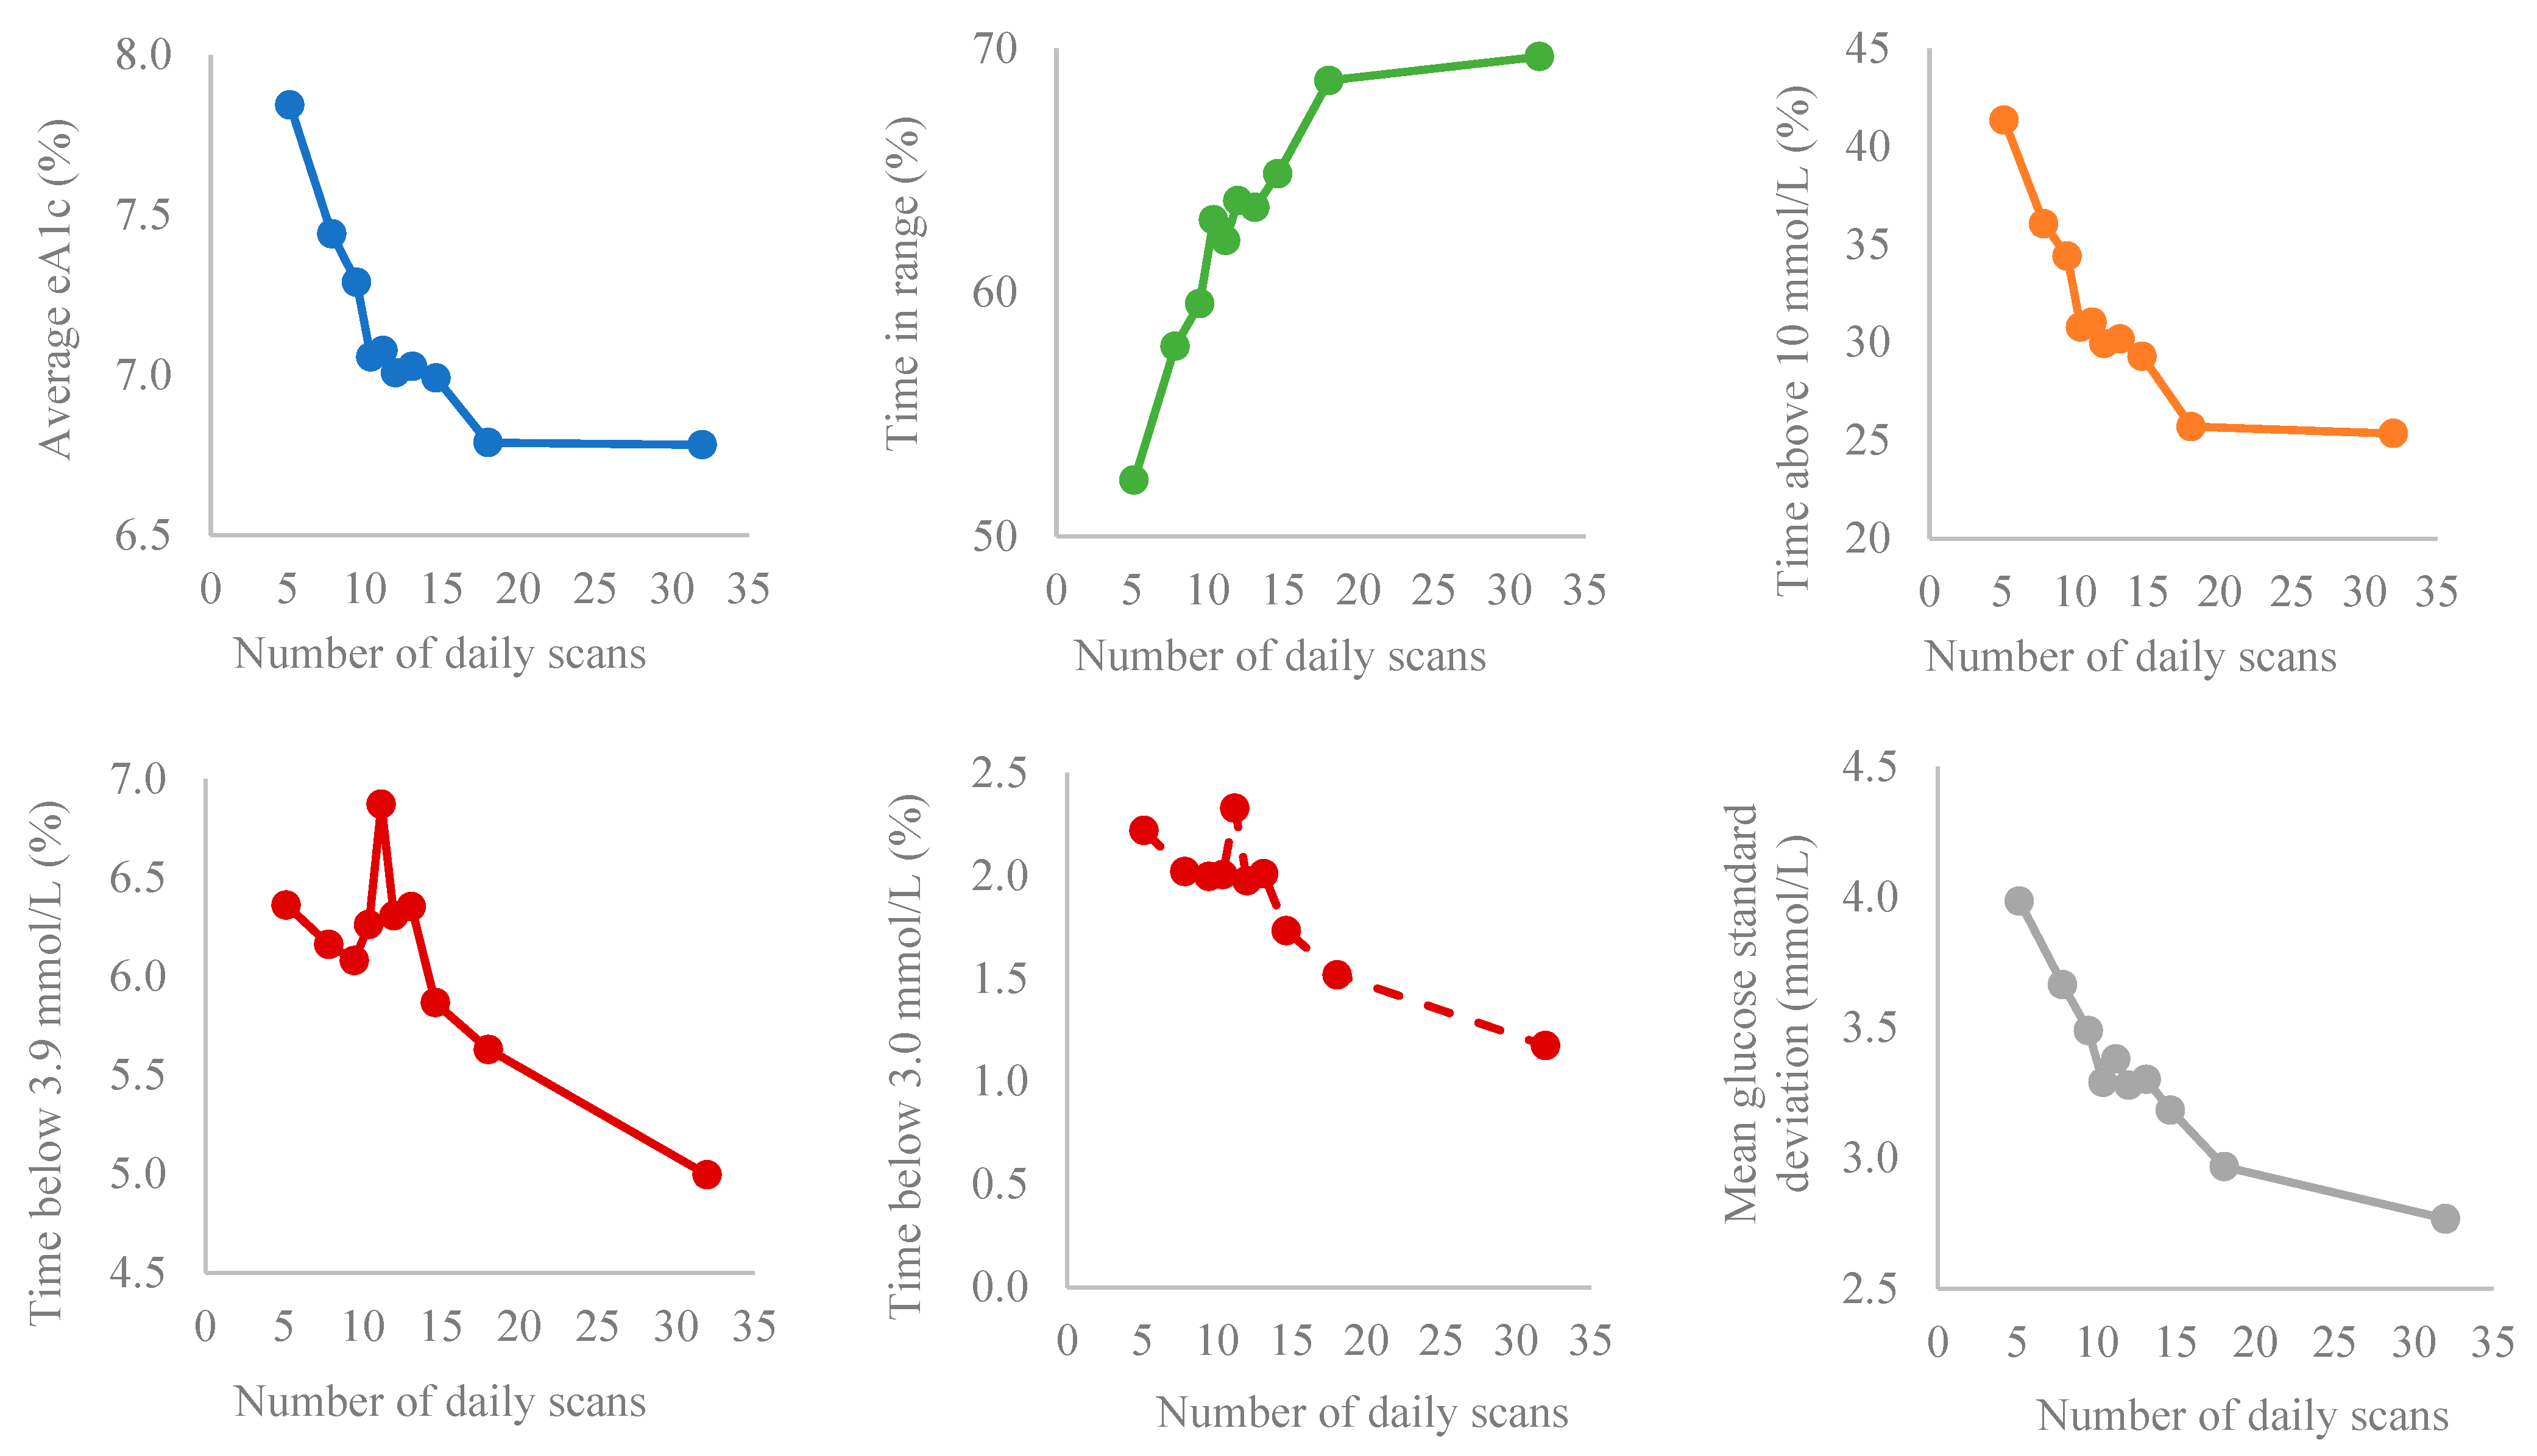
| Groups (Bins by Deciles) | Scan Rate (Scans/Day) | Average Glucose (mmol/L) | GMI (%) | Time in Range (%) | Glucose Standard Deviation (mmol/L) | CV (%) | ||||||
|---|---|---|---|---|---|---|---|---|---|---|---|---|
| Mean | SD | Mean | SD | Mean | SD | Mean | SD | Mean | SD | Mean | SD | |
| 1 | 5.15 | 1.07 | 9.91 | 2.71 | 7.84 | 1.70 | 52.31 | 21.59 | 3.98 | 1.49 | 39.74 | 10.24 |
| 2 | 7.87 * | 0.63 | 9.27 * | 2.26 | 7.44 * | 1.42 | 57.79 * | 20.05 | 3.66 * | 1.31 | 38.93 | 9.41 |
| 3 | 9.49 * | 0.31 | 9.03 | 1.98 | 7.29 | 1.24 | 59.53 | 17.93 | 3.49 | 1.09 | 38.30 | 7.98 |
| 4 | 10.42 | 0.24 | 8.66 * | 1.85 | 7.06 * | 1.16 | 62.96 * | 17.11 | 3.29 * | 0.99 | 37.71 | 7.94 |
| 5 | 11.22 | 0.22 | 8.69 | 1.89 | 7.08 | 1.18 | 62.11 | 16.62 | 3.38 | 0.96 | 38.78 | 7.16 |
| 6 | 12.02 | 0.28 | 8.58 | 1.69 | 7.01 | 1.06 | 63.75 | 16.12 | 3.28 | 0.92 | 38.01 | 7.13 |
| 7 | 13.14 | 0.37 | 8.61 | 1.81 | 7.03 | 1.14 | 63.47 | 16.73 | 3.30 | 1.00 | 38.03 | 7.82 |
| 8 | 14.66 * | 0.59 | 8.55 | 1.87 | 6.99 | 1.17 | 64.84 | 17.58 | 3.18 | 1.02 | 36.91 | 7.94 |
| 9 | 18.05 * | 1.42 | 8.23 | 1.88 | 6.79 | 1.18 | 68.67 * | 18.27 | 2.97 * | 1.07 | 35.36 | 8.53 |
| 10 | 31.98 * | 13.53 | 8.22 | 2.12 | 6.78 | 1.33 | 69.65 | 19.90 | 2.77 * | 1.11 | 32.94 | 8.78 |
| Groups (Bins by Deciles) | Time Below Range (%) | Time Above Range (%) | ||||||||
|---|---|---|---|---|---|---|---|---|---|---|
| <2.5 mmol/L | <3.0 mmol/L | <3.9 mmol/L | >10.0 mmol/L | >13.9 mmol/L | ||||||
| Mean | SD | Mean | SD | Mean | SD | Mean | SD | Mean | SD | |
| 1 | 1.06 | 2.24 | 2.22 | 3.57 | 6.36 | 7.54 | 41.33 | 22.94 | 19.11 | 17.53 |
| 2 | 0.94 | 1.84 | 2.02 | 2.85 | 6.16 | 5.62 | 36.05 * | 20.97 | 14.67 | 14.51 |
| 3 | 0.92 | 1.51 | 2.00 | 2.66 | 6.08 | 5.58 | 34.39 | 19.30 | 12.24 | 12.40 |
| 4 | 0.92 | 1.59 | 2.00 | 2.69 | 6.26 | 5.53 | 30.77 * | 18.42 | 9.89 | 10.60 |
| 5 | 1.11 | 1.90 | 2.33 | 3.15 | 6.87 | 6.15 | 31.02 | 18.25 | 10.25 | 11.63 |
| 6 | 0.91 | 1.67 | 1.98 | 2.78 | 6.31 | 5.58 | 29.94 | 17.38 | 9.21 | 9.89 |
| 7 | 0.95 | 1.72 | 2.01 | 2.77 | 6.35 | 5.86 | 30.18 | 18.11 | 9.78 | 10.57 |
| 8 | 0.78 | 1.58 | 1.73 | 2.68 | 5.87 | 5.73 | 29.29 | 18.84 | 9.30 | 11.04 |
| 9 | 0.64 | 1.33 | 1.52 | 2.47 | 5.63 | 6.12 | 25.70 * | 18.93 | 7.86 | 10.19 |
| 10 | 0.46 * | 1.12 | 1.17 * | 2.31 | 4.99 | 6.73 | 25.36 | 21.04 | 7.89 | 11.75 |
| TIR Bins (Deciles) | Scan Rate (Scans/Day) | Average Glucose (mmol/L) | GMI | TIR (%) | Glucose Standard Deviation (mmol/L) | CV (%) | ||||||
|---|---|---|---|---|---|---|---|---|---|---|---|---|
| Mean | SD | Mean | SD | Mean | SD | Mean | SD | Mean | SD | Mean | SD | |
| 1 | 11.01 | 6.98 | 12.98 | 1.75 | 9.77 | 1.10 | 28.01 | 8.32 | 4.86 | 1.18 | 37.58 | 8.52 |
| 2 | 11.31 | 6.19 | 10.65 * | 0.83 | 8.31 * | 0.52 | 42.61 * | 2.63 | 4.52 * | 0.82 | 42.56 | 7.83 |
| 3 | 12.15 | 7.44 | 9.68 * | 0.85 | 7.70 * | 0.53 | 50.04 * | 1.78 | 4.07 * | 0.63 | 42.29 | 7.32 |
| 4 | 12.70 | 7.49 | 9.10 * | 0.76 | 7.34 * | 0.48 | 55.68 * | 1.44 | 3.82 * | 0.48 | 42.29 | 6.77 |
| 5 | 13.50 | 6.98 | 8.55 * | 0.84 | 6.99 * | 0.53 | 60.60 * | 1.37 | 3.49 * | 0.44 | 41.25 | 6.36 |
| 6 | 13.52 | 7.15 | 8.09 * | 0.90 | 6.70 * | 0.56 | 65.33 * | 1.29 | 3.22 * | 0.36 | 40.21 | 5.55 |
| 7 | 13.58 | 6.95 | 7.80 * | 0.86 | 6.52 * | 0.54 | 69.95 * | 1.45 | 2.96 * | 0.33 | 38.22 * | 4.95 |
| 8 | 14.03 | 7.70 | 7.45 * | 0.84 | 6.30 * | 0.53 | 75.58 * | 1.88 | 2.65 * | 0.34 | 35.77 * | 4.43 |
| 9 | 15.88 * | 11.89 | 7.11 * | 0.76 | 6.09 * | 0.48 | 83.25 * | 2.57 | 2.24 * | 0.32 | 31.57 * | 3.96 |
| 10 | 16.35 * | 10.57 | 6.32 * | 0.75 | 5.59 * | 0.47 | 94.09 * | 3.49 | 1.47 * | 0.40 | 22.97 * | 4.94 |
| Groups (Deciles) | Time below Range (%) | Time above Range (%) | ||||||||
|---|---|---|---|---|---|---|---|---|---|---|
| <2.5 mmol/L | <3.0 mmol/L | <3.9 mmol/L | >10.0 mmol/L | >13.9 mmol/L | ||||||
| Mean | SD | Mean | SD | Mean | SD | Mean | SD | Mean | SD | |
| 1 | 0.47 | 1.14 | 0.94 | 2.02 | 2.47 | 4.37 | 69.52 | 10.20 | 39.40 * | 13.23 |
| 2 | 1.10 * | 2.31 | 2.08 * | 3.31 | 5.37 * | 5.90 | 52.02 * | 6.61 | 22.79 * | 5.51 |
| 3 | 1.12 | 2.09 | 2.36 | 3.38 | 6.50 * | 6.69 | 43.46 * | 6.98 | 15.49 * | 4.00 |
| 4 | 1.23 | 1.86 | 2.59 | 3.13 | 7.07 | 5.91 | 37.25 * | 6.22 | 11.56 * | 3.24 |
| 5 | 1.42 | 2.15 | 2.88 | 3.42 | 7.97 | 6.62 | 31.44 * | 6.73 | 7.97 * | 2.79 |
| 6 | 1.31 | 1.97 | 2.87 | 3.36 | 8.60 | 6.90 | 26.07 * | 7.07 | 5.53 * | 2.31 |
| 7 | 1.00 * | 1.48 | 2.37 * | 2.74 | 8.02 | 6.48 | 22.04 * | 6.65 | 3.85 * | 1.88 |
| 8 | 0.69 * | 1.03 | 1.78 * | 2.08 | 7.27 | 5.91 | 17.15 * | 6.06 | 2.37 * | 1.45 |
| 9 | 0.27 * | 0.49 | 0.85 * | 1.13 | 5.10 * | 4.45 | 11.64 * | 4.94 | 1.09 * | 0.87 |
| 10 | 0.08 | 0.26 | 0.26 * | 0.49 | 2.51 * | 2.46 | 3.40 * | 3.11 | 0.12 * | 0.22 |
Disclaimer/Publisher’s Note: The statements, opinions and data contained in all publications are solely those of the individual author(s) and contributor(s) and not of MDPI and/or the editor(s). MDPI and/or the editor(s) disclaim responsibility for any injury to people or property resulting from any ideas, methods, instructions or products referred to in the content. |
© 2023 by the authors. Licensee MDPI, Basel, Switzerland. This article is an open access article distributed under the terms and conditions of the Creative Commons Attribution (CC BY) license (https://creativecommons.org/licenses/by/4.0/).
Share and Cite
Canecki-Varzic, S.; Prpic-Krizevac, I.; Cigrovski Berkovic, M.; Rahelic, D.; Schonberger, E.; Gradiser, M.; Bilic-Curcic, I. Flash Glucose Monitoring in Croatia: The Optimal Number of Scans per Day to Achieve Good Glycemic Control in Type 1 Diabetes. Medicina 2023, 59, 1893. https://doi.org/10.3390/medicina59111893
Canecki-Varzic S, Prpic-Krizevac I, Cigrovski Berkovic M, Rahelic D, Schonberger E, Gradiser M, Bilic-Curcic I. Flash Glucose Monitoring in Croatia: The Optimal Number of Scans per Day to Achieve Good Glycemic Control in Type 1 Diabetes. Medicina. 2023; 59(11):1893. https://doi.org/10.3390/medicina59111893
Chicago/Turabian StyleCanecki-Varzic, Silvija, Ivana Prpic-Krizevac, Maja Cigrovski Berkovic, Dario Rahelic, Ema Schonberger, Marina Gradiser, and Ines Bilic-Curcic. 2023. "Flash Glucose Monitoring in Croatia: The Optimal Number of Scans per Day to Achieve Good Glycemic Control in Type 1 Diabetes" Medicina 59, no. 11: 1893. https://doi.org/10.3390/medicina59111893