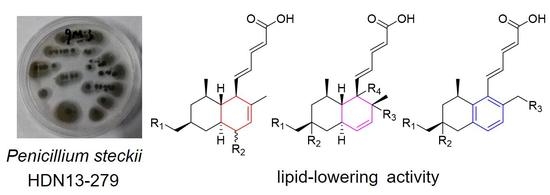
Lipid-Lowering Polyketides from the Fungus Penicillium Steckii HDN13-279
by
 , ,
, ,
Guihong Yu
1,†, 
Shuai Wang
2,†,
Lu Wang
1,
Qian Che
1,
Tianjiao Zhu
1,
Guojian Zhang
1,3,
Qianqun Gu
1,
Peng Guo
2,* and
Dehai Li
1,3,* 1
Key Laboratory of Marine Drugs, Chinese Ministry of Education, School of Medicine and Pharmacy, Ocean University of China, Qingdao 266003, China
2
Institute of Medicinal Plant Development, Chinese Academy of Medical Sciences & Peking Union Medical College, Beijing 100193, China
3
Laboratory for Marine Drugs and Bioproducts of Qingdao National Laboratory for Marine Science and Technology, Qingdao 266237, China
*
Authors to whom correspondence should be addressed.
†
These authors contributed equally to this work.
Mar. Drugs 2018, 16(1), 25; https://doi.org/10.3390/md16010025
Submission received: 2 November 2017
/
Revised: 2 December 2017
/
Accepted: 8 January 2018
/
Published: 12 January 2018
(This article belongs to the Collection Marine Drugs in the Management of Metabolic Diseases)
Abstract
:Seven new polyketides, named tanzawaic acids R–X (1–6, 11), along with seven known analogues (7–10 and 12–14), were isolated from Penicillium steckii HDN13-279. Their structures, including the absolute configurations, were elucidated by NMR, MS, X-ray diffraction, circular dichroism (CD) analyses and chemical derivatization. Five compounds (2, 3, 6, 10 and 12) significantly decreased the oleic acid (OA)-elicited lipid accumulation in HepG2 liver cells at the concentration of 10 μM, among which, four compounds (3, 6, 10 and 12) significantly decreased intracellular total cholesterol (TC) levels and three Compounds (3, 6, and 10) significantly decreased intracellular triglyceride (TG) levels. Moreover, the TG-lowering capacities of compounds 6 and 10 were comparable with those of simvastatin, with the TG levels being nearly equal to blank control. This is the first report on the lipid-lowering activity of tanzawaic acid derivatives.
1. Introduction
Metabolic syndrome (MetS), including obesity, insulin resistance (IR), dyslipidemia and hypertension, have long been a worldwide problem [1,2,3]. Dyslipidemia, as one of the most common causes of MetS, can further result in atherosclerosis, myocardial infarction and cerebrovascular diseases, seriously threatening human life [4,5,6]. Due to the current undesirable side-effects of lipid-regulating drugs, it is urgent to find new classes of bioactive compounds with lipid-lowering capacity and a safer profile [7,8,9,10]. Famous drugs for the treatment of dyslipidemia are lovastatin analogues, reported to be produced by various fungal species, including Aspergillus spp., Penicillium citrinum, Pleurotus spp., and Monascus ruber, thus, suggesting fungi as promising sources for the discovery of new drug leads against MetS [11,12].
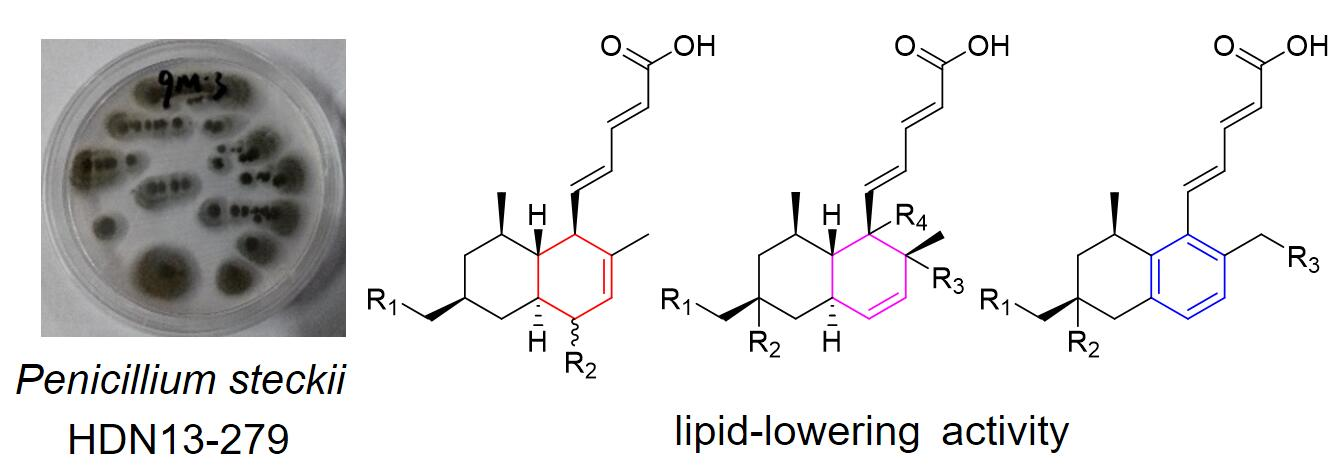
In our ongoing search for new bioactive metabolites from natural sources [13,14], Penicillium steckii HDN13-279 was selected for investigation due to the interesting HPLC–UV profile of its ethyl acetate extract. This species, widely distributed through marine and terrestrial environments, has been reported as an important producer of tanzawaic acids [15,16,17,18]. Tanzawaic acid derivatives are a class of polyketides characterized by a core structure with a poly-hydrogenated naphthalene ring and a penta-2,4-dienoic acid side chain. Several bioactivities have been reported for these compounds, namely anticoccidial, cytotoxic, anti-inflammatory, and capacity to inhibit protein tyrosine phosphatase 1B (PTP1B) and superoxide anion production [18,19,20,21,22,23,24]. In the present study, we report the isolation and structure elucidation of seven new polyketides and seven analogues isolated from P. steckii HDN13-279. The capacities of the isolated compounds to decrease oleic acid (OA)-elicited lipid accumulation in HepG2 liver cells were also reported.
2. Results and Discussion
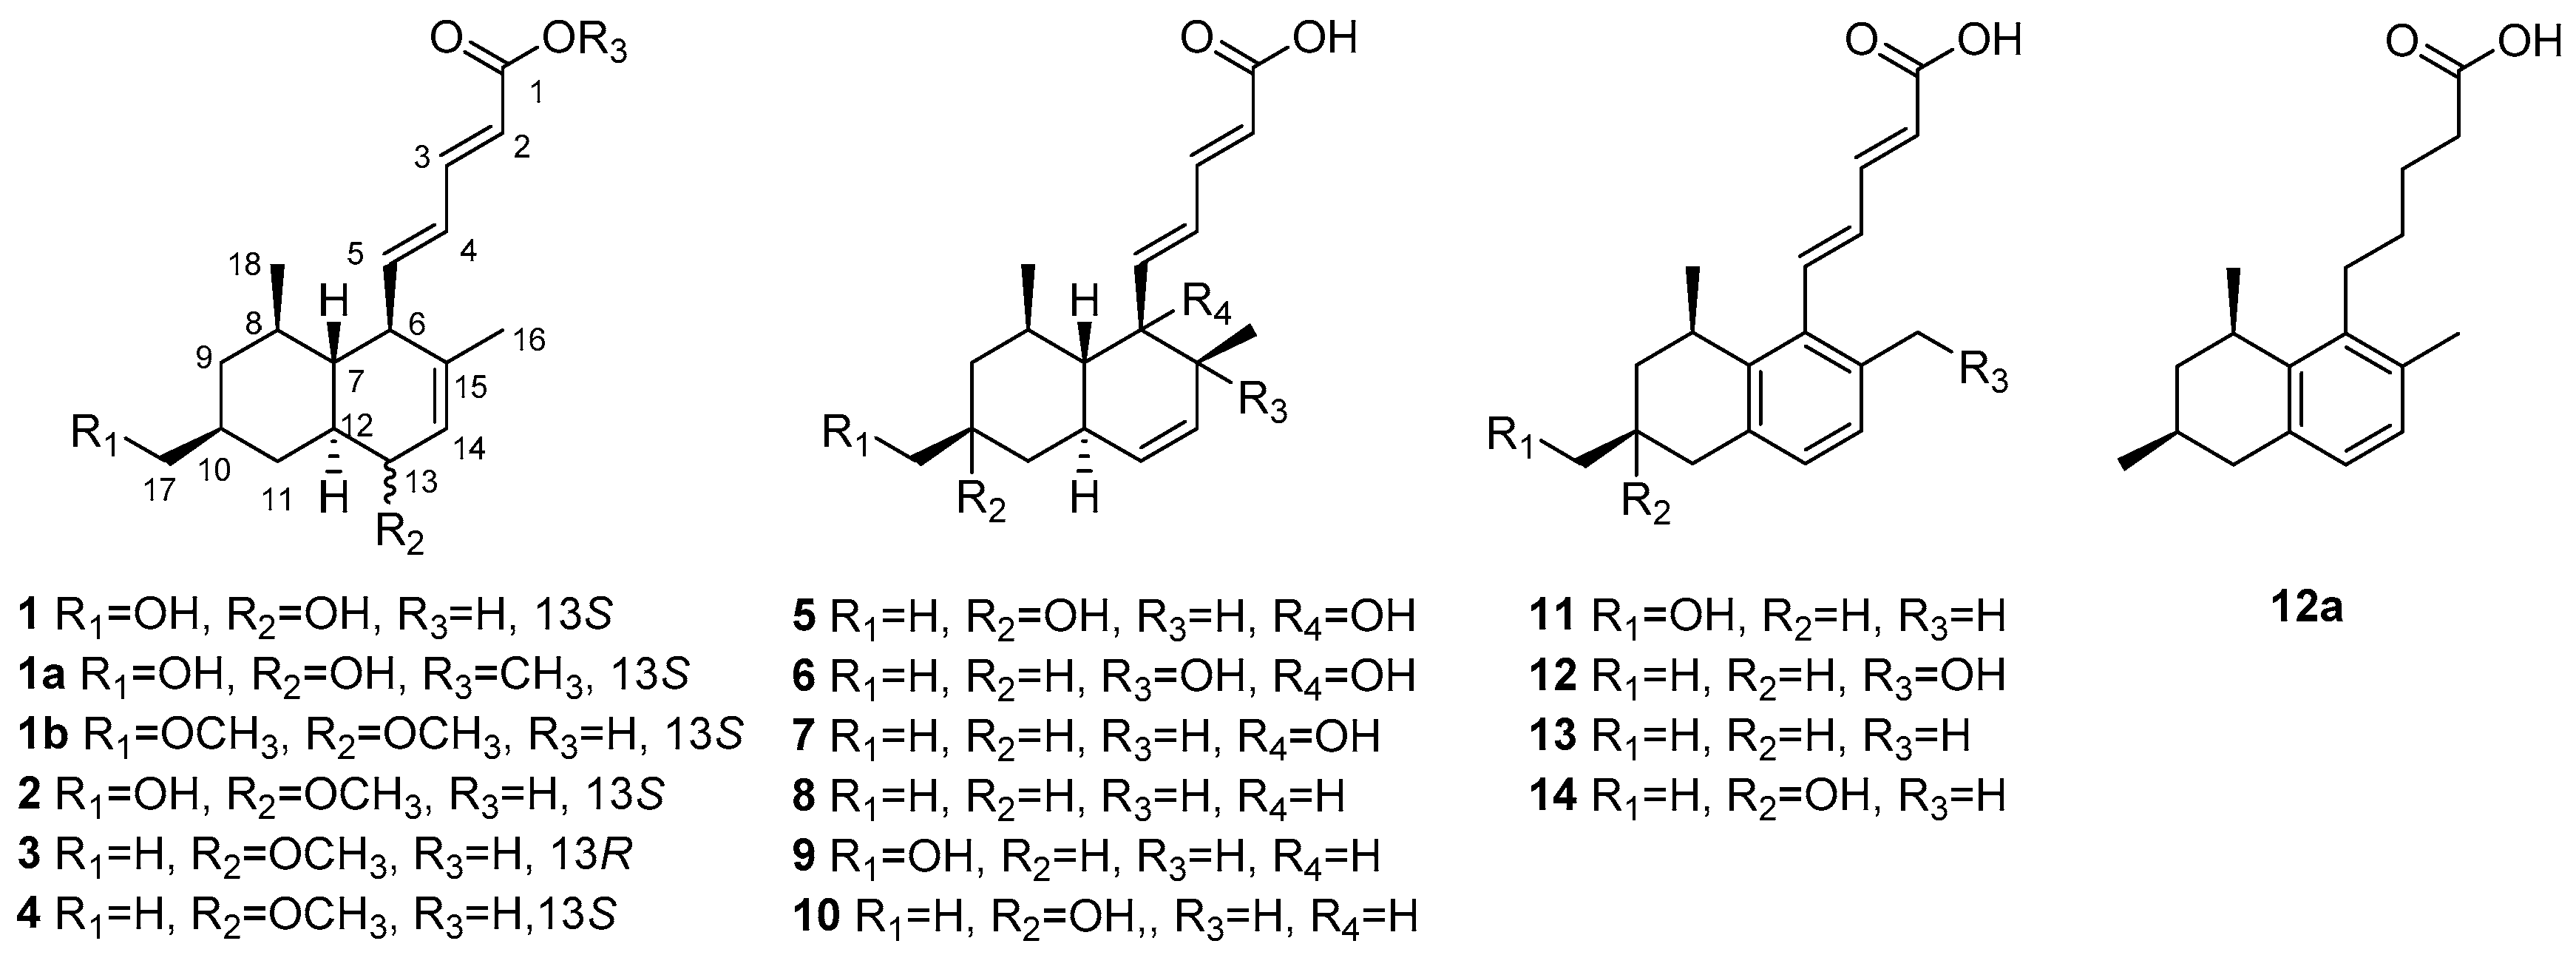
The fungal strain P. steckii HDN13-279 was fermented (45 L) under shaking conditions at 28 °C for 9 days. The EtOAc extract (40 g) was fractionated by silica gel vacuum liquid chromatography (VLC), C-18 ODS column chromatography, Sephadex LH-20 column chromatography, ODS MPLC, and finally HPLC to yield Compounds 1–14 (Figure 1).
Tanzawaic acid R (1) was obtained as a pale yellow oil with the molecular formula C18H26O4 analyzed by HRESIMS. The 1D NMR data (Table 1) indicated the presence of two methyls, three methylenes (with one oxygenized), 11 methines (including five sp2 methines and one oxymethine), and two non-protonated carbons (including one carbonyl). The planar structure of Compound 1 was proved to be the same as tanzawaic acid H [25], supported by the similar 1D NMR and 2D NMR data (Figure 2). The clear differences in 1D NMR spectra (see Supplementary Materials), especially those at CH2-11 (δC 32.6; δH 1.66, 1.13 in 1 vs. δC 33.7; δH 2.32, 0.65 in tanzawaic acid H), CH-12 (δC 42.6, δH 1.29 in 1 vs. δC 47.3, δH 1.13 in tanzawaic acid H), CH-13 (δC 67.0, δH 3.83 in 1 vs. δC 72.4, δ 3.70 in tanzawaic acid H) and CH-14 (δC 125.5, δH 5.83 in 1 vs. δC 130.9, δH 5.55 in tanzawaic acid H) [25], suggested they have different stereochemistry.
The relative configuration of 1 was assigned by NOESY spectroscopic data. The NOESY correlations from H-5 to H-7/H3-18, H-6 to H-8/H-12 indicated a trans fusion of the rings and placed H-7, Me-18 and the penta-2,4-dienoic acid moiety on the same side of the decalin ring, while H-6, H-8, H-12 on the other side. In addition, the NOESY correlations between H-9a (δH 1.69) and H-8/H-11a (δH 1.66), H-9b (δH 0.74) and H-7, H-10 and H-8/H-12, H-11a and H-12/H-13, H-12 and H-13 indicate that the hydroxymethyl at C-10 and the hydroxyl at C-13 were located at the same side as the penta-2,4-dienoic acid moiety (Figure 3). Thus, the NOESY data suggested that Compound 1 was a C-13 epimer of tanzawaic acid H. In a previous report [25], the absolute configuration of tanzawaic acid H was deduced based on the proposed biogenetic pathway. To make a solid evidence, we determined the absolute configuration of 1 by X-ray diffraction following chemical derivatization. Firstly, Compound 1 was esterified to generate the methyl ester (1a) and then the single crystal (CCDC 1537543) of 1a was successfully obtained (Figure 4) with Flack parameter = 0.02 (11). Consequently, the absolute configuration of 1 was elucidated to be 6R, 7R, 8R, 10S, 12S, 13S (Figure 1).
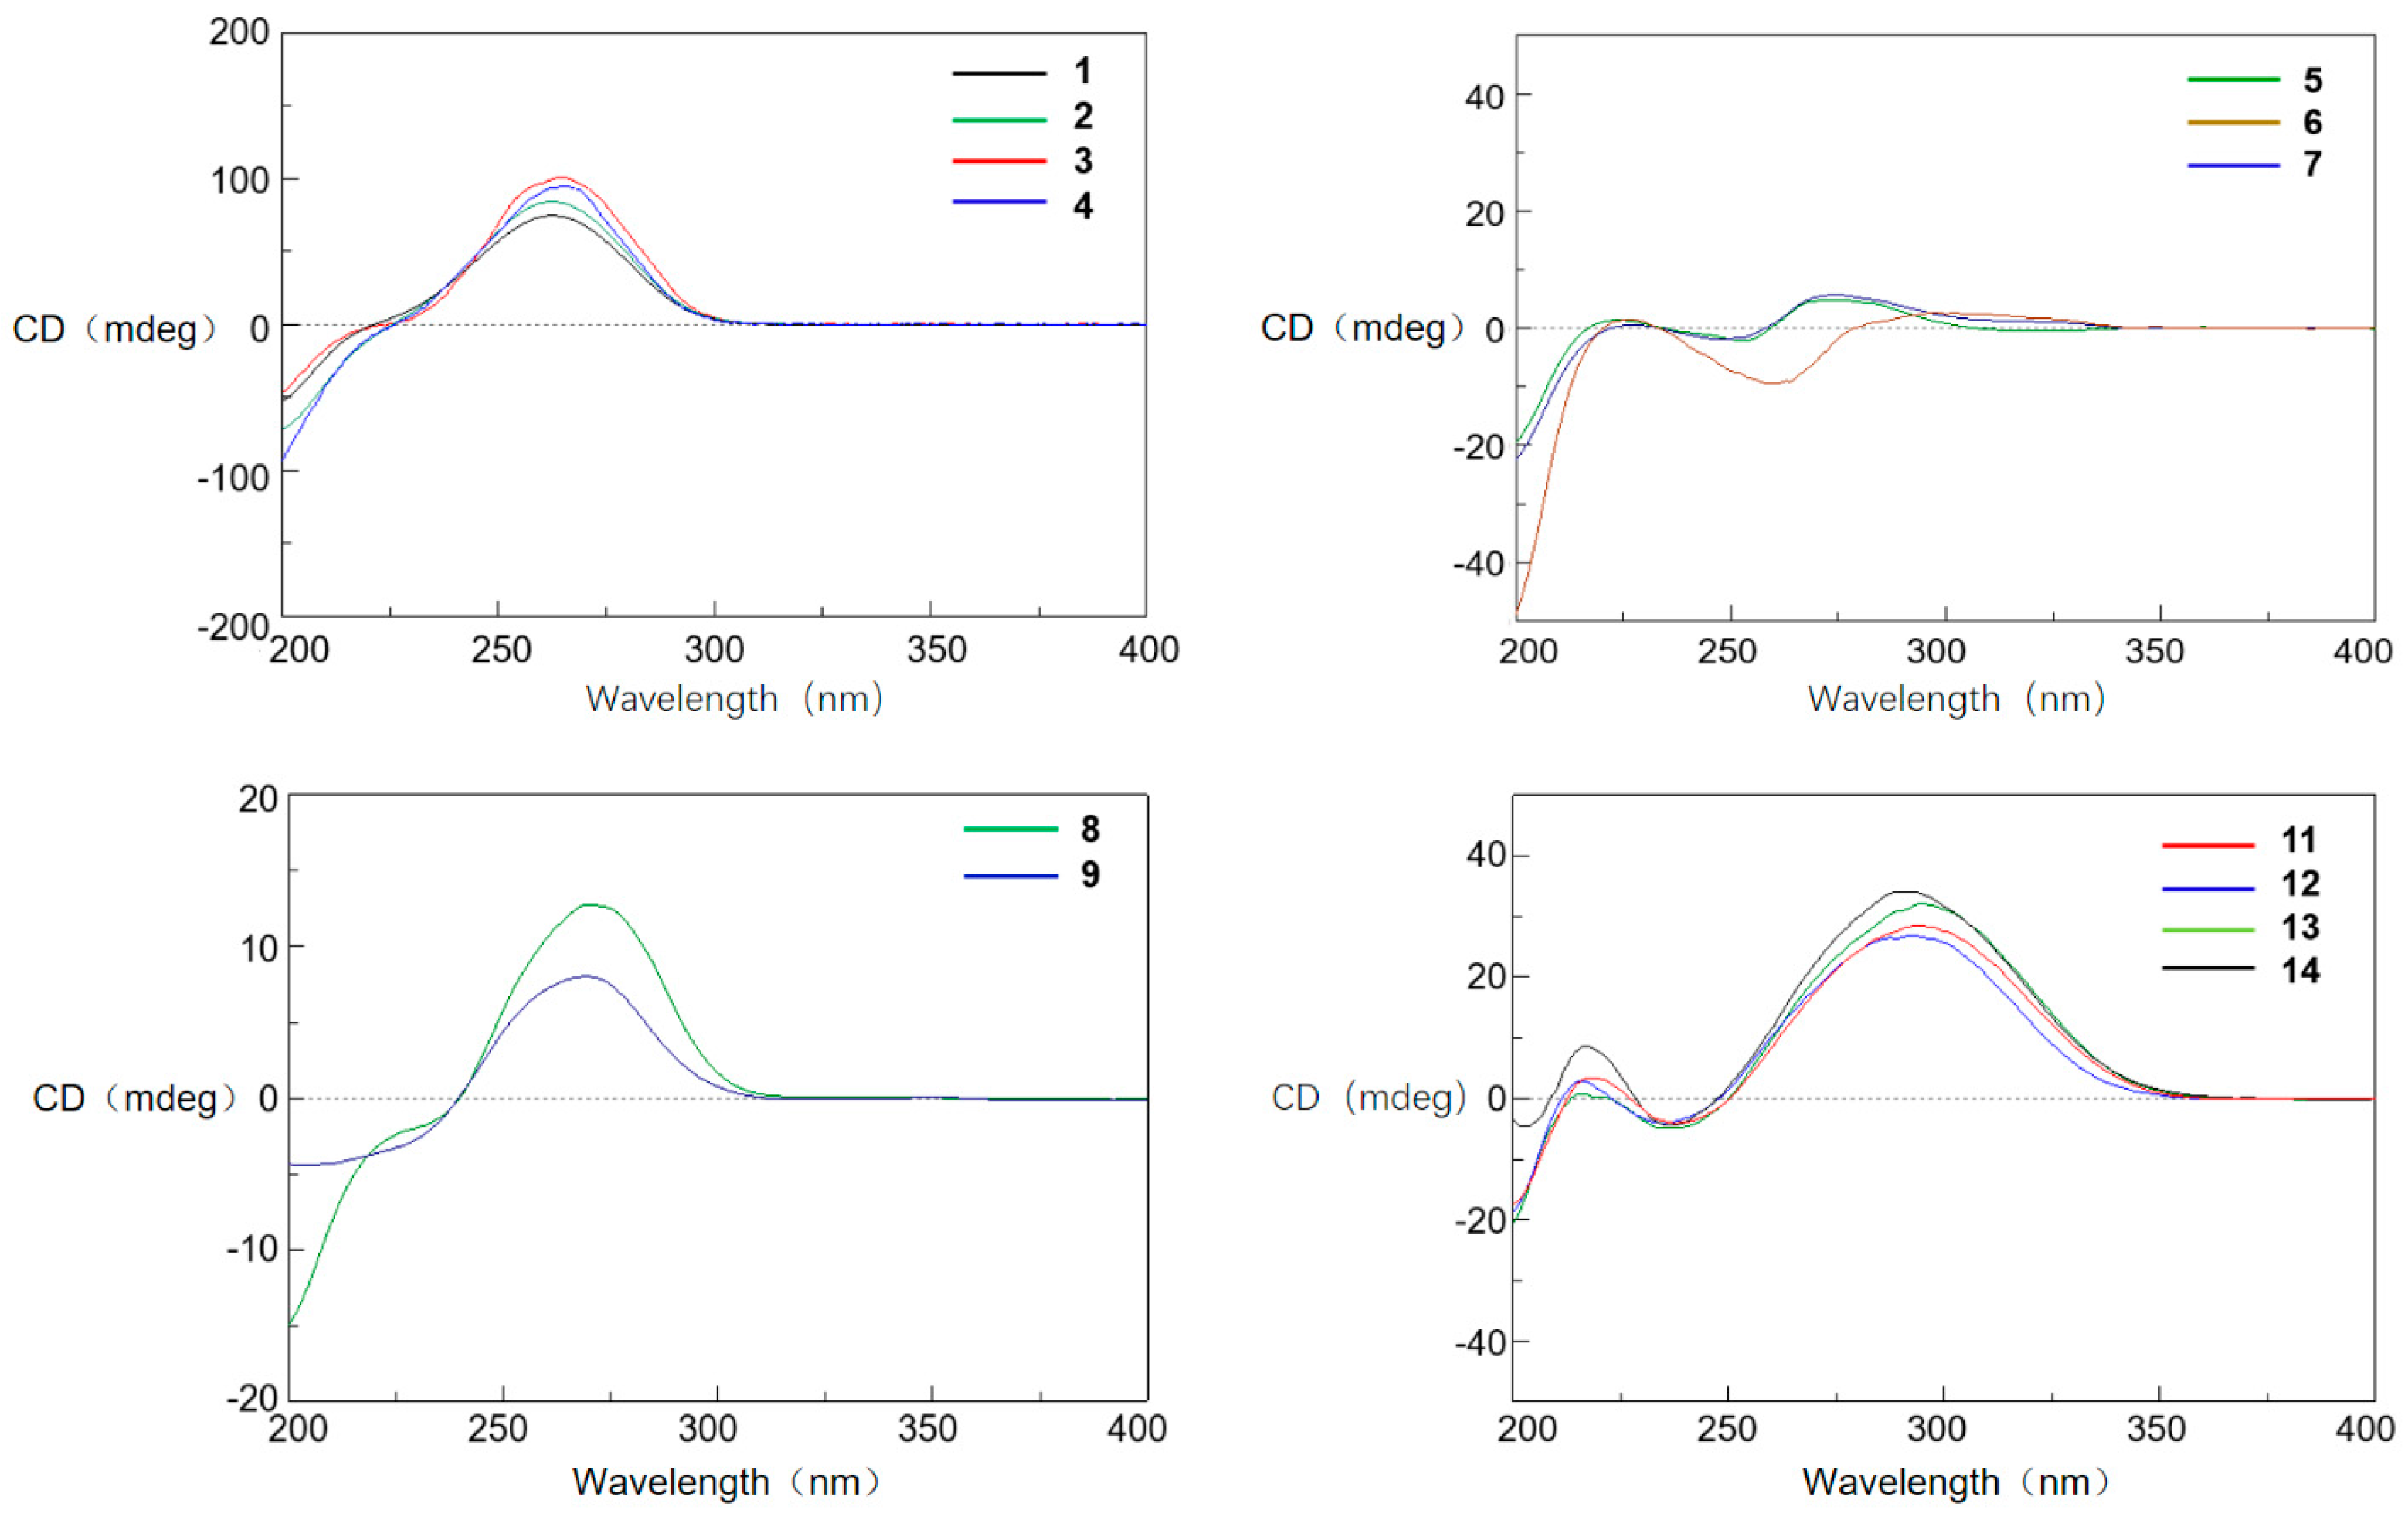
Tanzawaic acid S (2) was isolated as a pale yellow oil. The molecular formula of 2 was established as C19H28O4 according to the HRESIMS ions detected at m/z 319.1906 [M − H]−. The 1H NMR data of 2 was similar to those of 1 (Table 1), and the only difference was the existence of signal for an additional methoxy (δH 3.33). Further analysis of the 2D NMR spectra indicated the additional methoxy was attached at C-13 (δH 76.3) in 2 (Figure 2). The relative configuration of 2 cannot be completely assigned by NOESY data as the signals for H-7, H-8 and H-12 were overlapped. We further resorted to chemical derivatization. Both Compounds 1 and 2 were successfully transformed into Compound 1b when methylated by NaH and CH3I in DMF solution, which suggested they share the same relative configuration. Moreover, 1 and 2 showed almost the same CD curve (Figure 5), further confirming their same absolute configuration.
Tanzawaic acids T (3) and U (4) were obtained as pale yellow oil, and had the same molecular formula (C19H28O3), established based on the same HRESIMS ions both detected at m/z 303.1962 [M − H]−. Their 1D NMR data (Table 2) suggested that they possessed similar tanzawaic acid scaffold to Compound 2. Further analysis of the 2D NMR spectra indicated that Compounds 3 and 4 shared the same planar structure (Figure 2), and the structural difference between 3 (or 4) and 2 was that the hydroxymethyl in 2 was replaced by a methyl in 3 and 4 (δH 0.89 in 3, δH 0.88 in 4). The NOESY spectroscopic data of 3 and 4 indicated that they are C-13 epimers (Figure 3). The NOESY correlations between H-7 and H-13 suggested the β orientation of H-13 in Compound 3. The NOESY correlations between H-13 and H-11a (δH 1.57), H-11a and H-10, and between H-11b (δH 1.16) and H3-17/13-OCH3 in Compound 4 indicated an α oriented H-13 in 4 (Figure 3). Although the relative configuration of C-13 in Compound 3 was different from 1, the CD curves of them are almost identical (Figure 5), indicating that the cotton effects, especially those at 270 nm, were predominated by the (2E, 4E)-penta-2,4-dienoic acid moiety. Consequently, the absolute configurations of 3 and 4 were deduced as 6R, 7R, 8R, 10S, 12S, 13R and 6R, 7R, 8R, 10S, 12S, 13S, respectively.
Tanzawaic acid V (5) was isolated as a pale yellow oil with the molecular formula of C18H26O4 based on the HRESIMS ions detected at m/z 305.1751 [M − H]−. The 1D NMR data (Table 3) indicated the presence of three methyls, two methylene, ten methines (including six sp2 methines), and three non-protonated carbons (including one carbonyl and two oxygenated carbons). These data are similar to those of the isolated known compound, tanzawaic acid C (7) [19], except for the appearance of an additional oxygenated non-protonated carbon and the absence of a methine in 5, indicating that Compound 5 is a hydroxylated analogue of 7. Analysis of the 2D NMR spectra located the additional hydroxyl group on C-10 (Figure 2), and the methyl group on C-10 in 5 oriented to the same side as in Compound 7 according to the NOESY correlation between H3-17 and H3-18 (Figure 3). The absolute configuration of 5 was determined by comparing CD with that of 7 whose absolute configuration was determined using X-ray diffraction with Flack parameter = 0.06 (9) in this work (Figure 4). Their identical CD curve indicated the same absolute configuration (Figure 5).
Tanzawaic acid W (6) was isolated as a pale yellow oil, whose molecular formula was established as identical to that of Compound 5 based on the HRESIMS ions detected at m/z 305.1752 [M − H]−. The 1D and 2D NMR spectra indicated that the difference to 5 was the lack of the hydroxyl group at C-10 and its presence at C-15, and the methyl on C-15 faced to the same orientation to H-7 according to the NOESY correlations between H-7 and H3-16. Compound 6 also had similar CD curve with 7, which indicated the same absolute configuration (Figure 5).
Tanzawaic acid X (11) was isolated as pale yellow oil with the molecular formula of C18H22O3 based on the HRESIMS ions detected at m/z 285.1493 [M − H]−. The 1D NMR data (Table 3) indicated the presence of two methyls, three methylenes (with one oxygenated), eight methines (including six sp2 ones), and five non-protonated carbons (including one carbonyl). Further analysis of the 2D NMR spectra indicated that the planar structure 11 was similar to tanzawaic acid A (13) [19] and the only difference was the methyl at C-10 in 13 was replaced by a hydroxymethyl. The relative configuration of 11 was determined by NOESY correlations between H-8 (δH 3.26) and H-10 (δH 1.85), which suggested the cofacial of H-8 and H-10. Moreover, the coincident CD curves of 11 and 13 indicated the 8R, 9S absolute configuration of 11 (Figure 5).
The seven known Compounds 7–10 and 12–14 were identified (Figure 1) as tanzawaic acid C (7), tanzawaic acid B (8), tanzawaic acid M (9), tanzawaic acid E (10), arohynapene B (12), tanzawaic acid A (13) and tanzawaic acid D (14) by comparing NMR data and optical rotation with those reported in the literature [15,19,20,21,22,26]. As determining the absolute configuration of tanzawaic acid derivatives always be a challenging work, the stereochemistry of Compounds 7–9, 12 and 14 were not confirmed by solid evidence in literature reports. Herein, we present the determination of the absolute configurations assisted by X-ray differentiation, CD data and chemical transformation. The absolute configurations of Compounds 7 and 8 were determined under X-ray (CCDC numbers 1537544 and 1537542) with the Flack parameters = 0.06 (9) and 0.07 (10), respectively (Figure 4). The absolute configurations of Compounds 9 and 14 were determined by comparing CD spectra with Compounds 8 and 13, respectively (Figure 5). The absolute configuration of Compound 12 was assigned by chemical transformation. We found the Pd/C reduction products (established as 12a) of Compounds 12 and 13 showed the same 1D NMR data and similar optical rotations (−7.78 (c 0.042, MeOH) and −6.09 (c 0.042, MeOH), respectively), which suggested Compounds 12 and 13 had the same relative and absolute configurations, which is also in accord with the same CD curves of 12 and 13 (Figure 5).
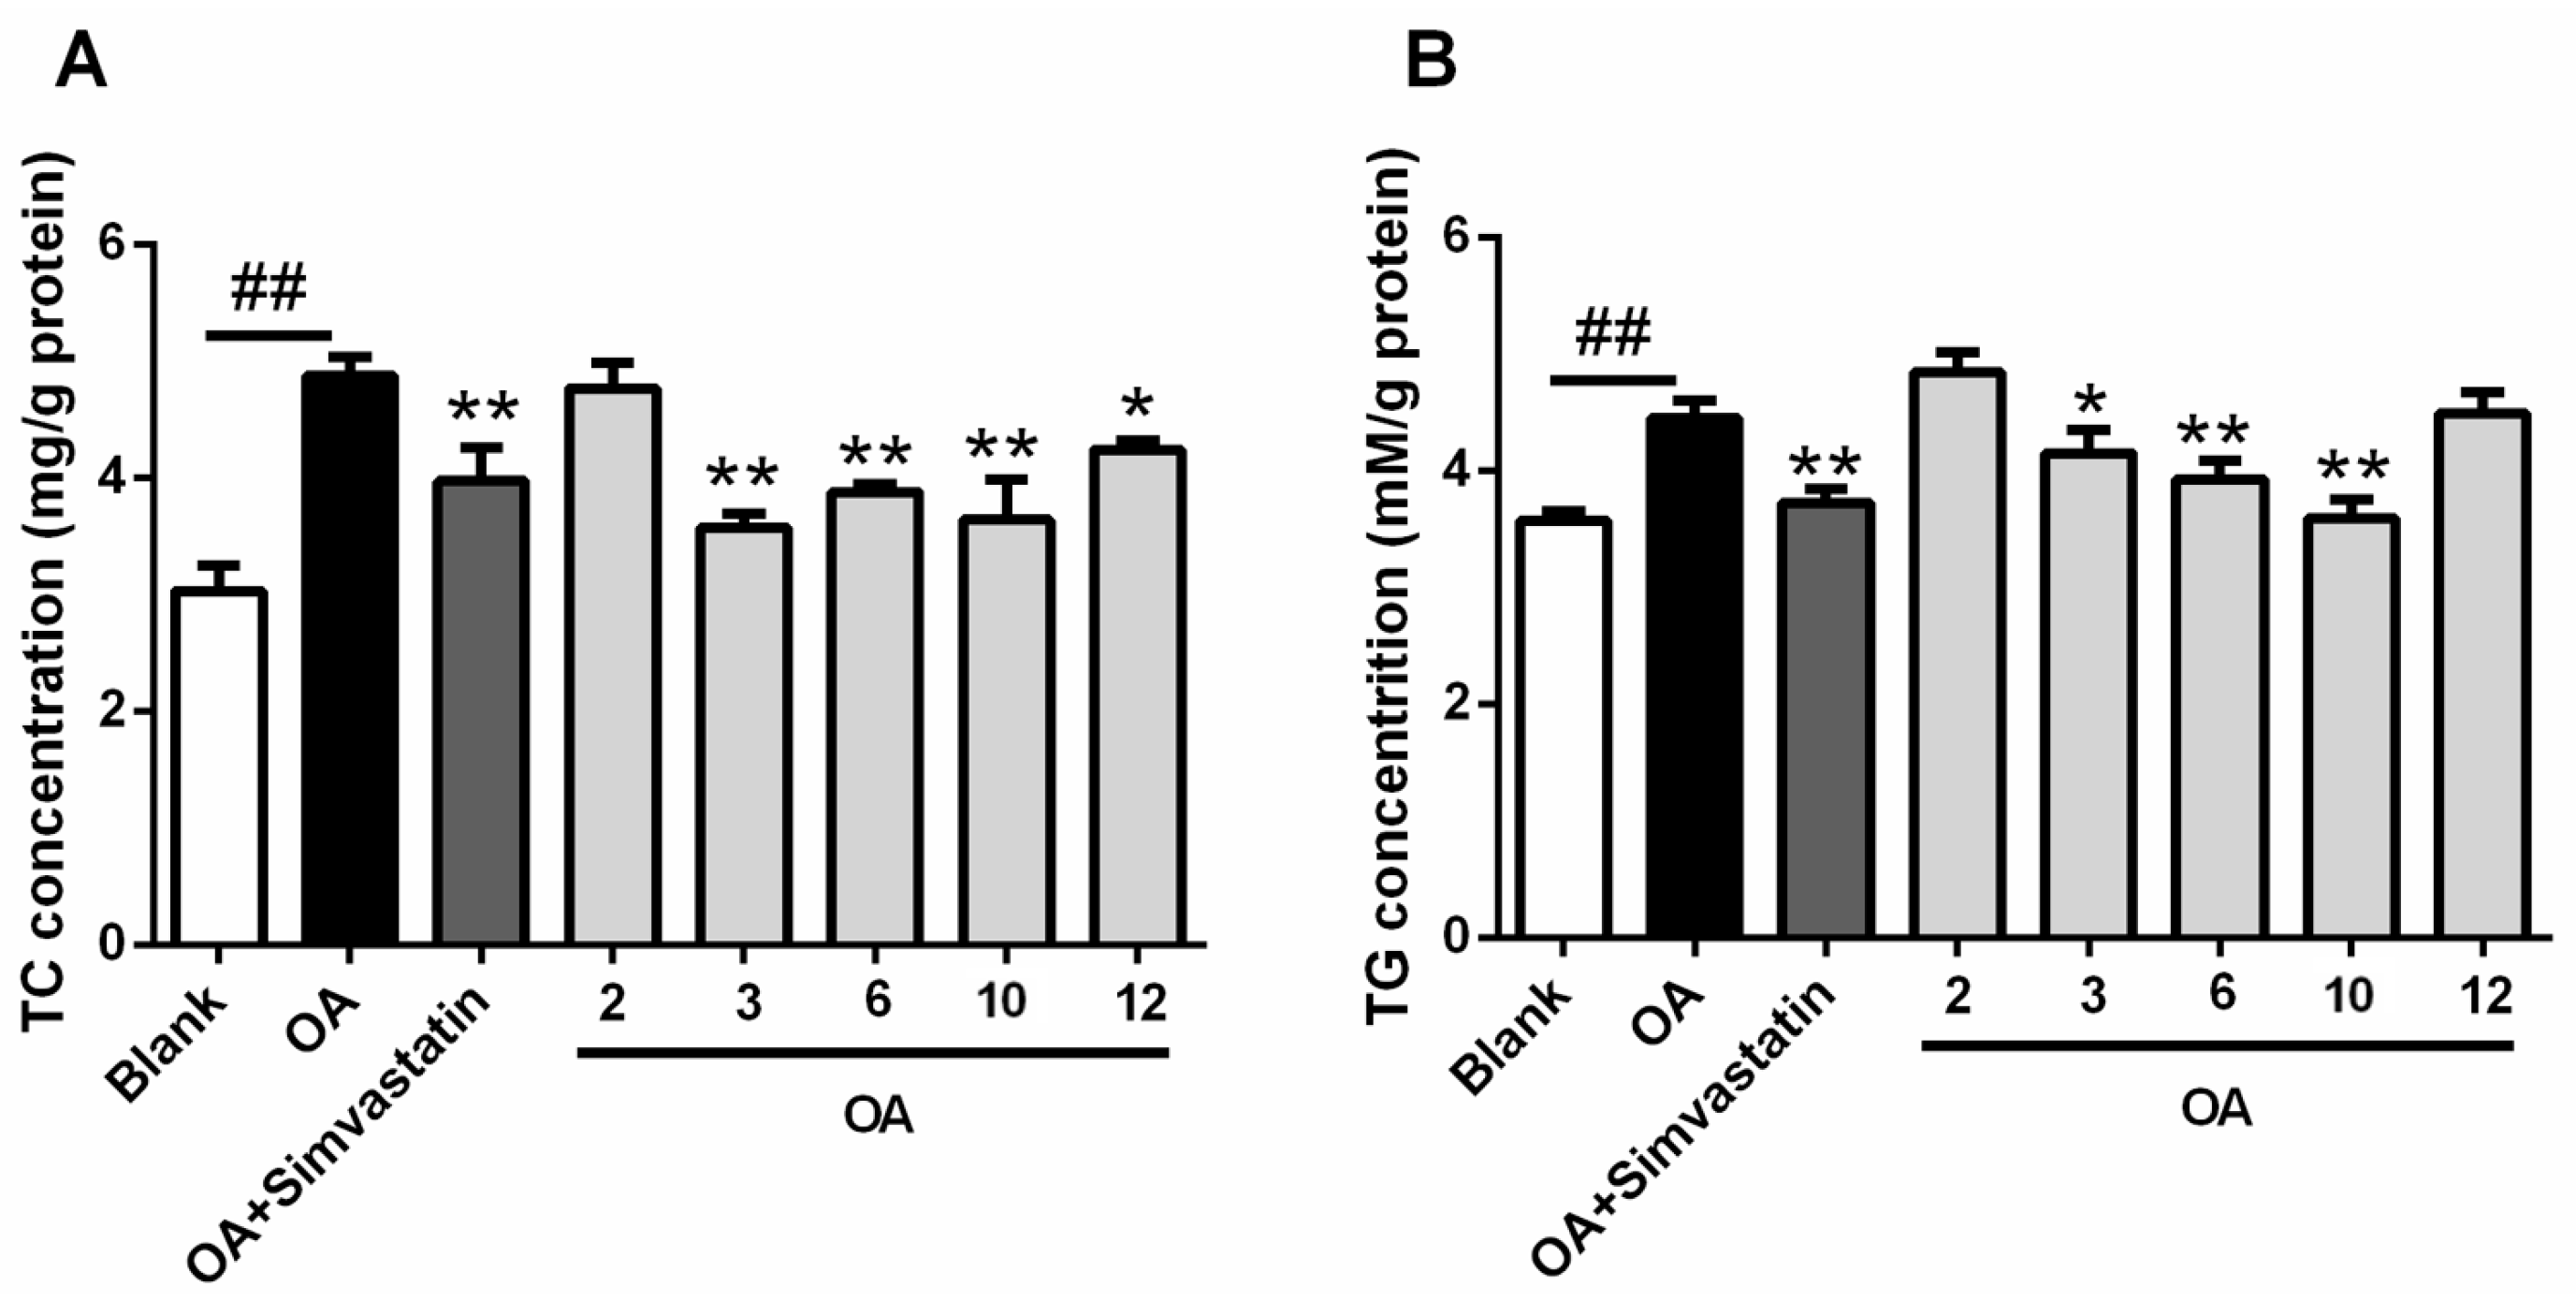
All the compounds were evaluated for their cytotoxicity (on HL-60, HCT-116, K562, Hela and A549 cell lines), but none of them presented a cytotoxic effect at 30 μM. The antiviral (influenza A H1N1 virus) and NF-κB inhibitory activities were also evaluated, with no activity detected under the concentration of 30 μM. In light of the structural similarity with lovastatin, with the exception of Compound 9 (limited quantity), all the compounds were evaluated for their lowering effects against oleic acid (OA)-elicited lipid accumulation in HepG2 liver cells. Five compounds (2, 3, 6, 10 and 12) significantly decreased the lipid accumulation elicited by OA, determined by oil-red O staining, at the concentration of 10 μM. Compounds 6 and 12 showed comparable efficiency with simvastatin (Figure 6). Additionally, four compounds (3, 6, 10 and 12) could significantly decreased intracellular total cholesterol (TC) levels and three compounds (3, 6, and 10) significantly decreased intracellular triglyceride (TG) levels (Figure 7). It’s worth mentioning that the TG-lowering efficiency of Compounds 6 and 10 were comparable with simvastatin and the TG levels were nearly equal to blank control (p > 0.05) (Figure 7B).
3. Materials and Methods
3.1. General Experimental Procedures
UV spectra were recorded on Beckman DU 640 spectrophotometer (Beckman Coulter Inc., Brea, CA, USA). IR spectra were taken on Bruker tensor-27 spectrophotometer in KBr discs (Bruker Corporation, Billerica, MA, USA). Specific rotations were measured on JASCO P-1020 digital polarimeter (JASCO Corporation, Tokyo, Japan). ESIMS were obtained on Thermo Scientific LTQ Orbitrap XL mass spectrometer (Thermo Fisher Scientific, Waltham, MA, USA) or Micromass Q-TOF ULTIMA GLOBAL GAA076 LC Mass spectrometer (Wasters Corporation, Milford, MA, USA). CD spectra were measured on JASCO J-715 spectropolarimeter (JASCO Corporation, Tokyo, Japan). NMR spectra were recorded on Agilent 500 MHz DD2 spectrometer using TMS as internal standard and chemical shifts were recorded as δ-values (Agilent Technologies Inc., Santa Clara, CA, USA). Semi-preparative HPLC was performed on an ODS column (HPLC (YMC-Pack ODS-A, 10 × 250 mm, 5 μm, 3 mL/min)) (YMC Co., Ltd., Kyoto, Japan). Medium-pressure preparation liquid chromatography (MPLC) was performed on a Bona-Agela CHEETAHTM HP100 (Beijing Agela Technologies Co., Ltd., Beijing, China). Column chromatography (CC) were performed with silica gel (200–300 mesh, Qingdao Marine Chemical Inc., Qingdao, China), and Sephadex LH-20 (Amersham Biosciences, San Francisco, CA, USA), respectively [27].
3.2. Fungal Material
The fungal strain P. steckii HDN13-279 was isolated from the leaf of Sonneratia caseolaris collected from mangrove conservation area of Hainan, China. It was identified by ITS sequence and the sequence data have been submitted to GenBank (accession number: KY399997). The voucher specimen was deposited in our laboratory at −20 °C.
3.3. Fermentation and Extraction
The fungus P. steckii HDN13-279 was cultured at 28 °C on a rotary platform shakers at 180 rpm for 9 days in 500 mL Erlenmeyer flasks containing 150 mL of liquid culture medium, composed of maltose (20.0 g/L), mannitol (20.0 g/L), glucose (10.0 g/L), monosodium glutamate (10.0 g/L), MgSO4·7H2O (0.3 g/L), KH2PO4 (0.5 g/L), yeast extract (3.0 g/L), corn steep liquor (1.0 g/L), and seawater (Huiquan Bay, Yellow Sea, Qingdao, China). After 9 days of cultivation, 45 L of whole broth was filtered through cheesecloth to separate the supernatant from the mycelia. The supernatant was extracted three times with EtOAc. The water-containing mycelia was extracted three times with acetone, and the mixed solution was concentrated under reduced pressure to afford an aqueous solution without acetone, then extracted three times with EtOAc. Both EtOAc solutions were combined and concentrated under reduced pressure to give the organic extract (40 g) [28].
3.4. Isolation
The organic extract was subjected to vacuum liquid chromatography over a silica gel column using a gradient elution with petroleum ether-CHCl3-MeOH to give six fractions (fractions 1–6). Fraction 3 (5.1 g) eluted with 98:2 CH2Cl2-MeOH was applied on a C-18 ODS column using a stepped gradient elution of MeOH-H2O yielding five subfractions (fractions 3.1–3.5). Fraction 3.3 that eluted with 50:50 MeOH-H2O was separated by semi-preparative HPLC using a stepped gradient elution of CH3CN-H2O (25:75 to 65:35, 3 mL/min) to furnish Compounds 1 (10.0 mg, tR 14.5 min), 11 (7.0 mg, tR 16.7 min), 5 (4.0 mg, tR 19.2 min), 10 (5.0 mg, tR 23.8 min), 2 (4.0 mg, tR 25.5 min), and 9 (4.0 mg, tR 28.2 min). Fraction 3.4 that eluted with 75:25 MeOH-H2O was chromatographed on Sephadex LH-20 CH2Cl2-MeOH (1:1) and further separated by MPLC (C-18 ODS) using MeOH-H2O (70:30) to furnish four subfractions (fractions 3.4.1–3.4.4). Fraction 3.4.1 was purified by semi-preparative HPLC (63:37 MeCN:H2O, 3 mL/min) to afford Compounds 3 (14.0 mg, tR 20.5 min) and 4 (15.0 mg, tR 24.2 min). Fraction 3.4.2 was purified by semi-preparative HPLC (73:27 MeOH:H2O, 3 mL/min) to afford Compounds 14 (8.0 mg, tR 15.4 min), 6 (5.0 mg, tR 21.4 min), 12 (10.0 mg, tR 24.4 min), and 7 (18.0 mg, tR 27.5 min). Fraction 3.4.4 was purified by semi-preparative HPLC (80:20 MeOH:H2O, 3 mL/min) to afford Compounds 13 (20.0 mg , tR 16.4 min) and 8 (25.0 mg, tR 20.4 min).
Tanzawaic acid R (1): Pale yellow oil; +49.4 (c 0.57, MeOH); CD (1.63 × 10⁻³ M, MeOH) λ [nm] (Δε): 263 (76.2), 219 (−2.9); IR (KBr) νmax 3415, 2921, 1685, 1413, 1207, 1005, 724 cm−1; UV (MeOH) λmax (log ε): 221 (1.10), 268 (4.06) nm; 1H and 13C NMR data, see Table 1; HRESIMS [M − H]− m/z 305.1750 (calcd. for C18H25O4, 305.1747).
Tanzawaic acid S (2): pale yellow oil; +126.4 (c 0.25, MeOH); CD (1.56 × 10⁻³ M, MeOH) λ [nm] (Δε): 263 (85.8), 220 (−10.1); IR (KBr) νmax 3414, 2927, 1684, 1412, 1006, 622 cm−1; UV (MeOH) λmax (log ε): 221 (1.04), 268 (4.01) nm; 1H and 13C NMR data, see Table 1; HRESIMS [M − H]− m/z 319.1906 (calcd. C19H27O4, 319.1915).
Tanzawaic acid T (3): pale yellow oil; +98.2 (c 0.27, MeOH); CD (1.64 × 10⁻³ M, MeOH) λ [nm] (Δε): 266 (102.4), 216 (−5.6); IR (KBr) νmax 3416, 2910, 1688, 1453, 1272, 1092, 1003, 562 cm−1; UV (MeOH) λmax (log ε): 221 (1.05), 261 (3.99) nm; 1H and 13C NMR data, see Table 2; HRESIMS [M − H]− m/z 303.1962 (calcd. C19H27O3, 303.1955).
Tanzawaic acid U (4): pale yellow oil; +66.9 (c 0.20, MeOH); CD (1.64 × 10⁻³ M, MeOH) λ [nm] (Δε): 266 (96.0), 220 (−10.1); IR (KBr) νmax 2949, 2910, 1688, 1417, 1272, 1092, 1003 cm−1; UV (MeOH) λmax (log ε): 221 (1.02), 261 (3.96) nm; 1H and 13C NMR data, see Table 2; HRESIMS [M − H]− m/z 303.1962 (calcd. C19H27O3, 303.1955).
Tanzawaic acid V (5): pale yellow oil; +18.9 (c 0.30, MeOH); CD (1.63 × 10⁻³ M, MeOH) λ [nm] (Δε): 275 (4.9), 253 (−2.2), 224 (1.4); IR (KBr) νmax 3396, 2929, 1689, 1377, 1152, 1011, 732 cm−1; UV (MeOH) λmax (log ε): 221 (2.30), 239 (3.56) nm, 284 (4.06) nm; 1H and 13C NMR data, see Table 3; HRESIMS [M − H]− m/z 305.1751 (calcd. for C18H25O4, 305.1758).
Tanzawaic acid W (6): pale yellow oil; −5.9 (c 0.17, MeOH); CD (1.63 × 10⁻³ M, MeOH) λ [nm] (Δε): 298 (2.6), 258 (−9.6), 227 (1.5); IR (KBr) νmax 3416, 2924, 1702, 1459, 1377, 1261, 1013, 748 cm−1; UV (MeOH) λmax (log ε): 221 (1.20), 264 (4.09) nm; 1H and 13C NMR data, see Table 3; HRESIMS [M − H]− m/z 305.1752 (calcd. for C18H25O4, 305.1747).
Tanzawaic acid C (7): CD (1.72 × 10⁻³ M, MeOH) λ [nm] (Δε): 251 (−1.7), 227 (0.5), 220 (−3.2).
Tanzawaic acid B (8): CD (1.82 × 10⁻³ M, MeOH) λ [nm] (Δε): 270 (12.7), 220 (−3.2).
Tanzawaic acid M (9): CD (1.72 × 10⁻³ M, MeOH) λ [nm] (Δε): 269 (8.0), 220 (−3.7).
Tanzawaic acid X (11): pale yellow oil; +131.1 (c 0.20, MeOH); CD (1.75 × 10⁻³ M, MeOH) λ [nm] (Δε): 294 (28.5), 238 (−4.0), 218 (3.3); IR (KBr) νmax 3392, 2925, 1695, 1390, 1273, 996, 871, 808 cm−1; UV (MeOH) λmax (log ε): 221 (2.32), 239 (3.50) nm, 293 (4.09) nm; 1H and 13C NMR data, see Table 3; HRESIMS [M − H]− m/z 285.1493 (calcd. for C18H21O3, 285.1485).
Arohynapene B (12): CD (1.75 × 10⁻³ M, MeOH) λ [nm] (Δε): 292 (26.5), 235 (−3.6), 217 (1.6).
Tanzawaic acid A (13): CD (1.85 × 10⁻³ M, MeOH) λ [nm] (Δε): 295 (31.5), 236 (−4.6), 217 (0.1).
Tanzawaic acid D (14): CD (1.75 × 10⁻³ M, MeOH) λ [nm] (Δε): 291 (33.7), 237 (−3.7), 218 (7.1).
3.5. Crystal Data for 1a
Orthorhombic, C19H28O4, space group P212121, a = 7.69910 (10) Å, b = 12.8933 (2) Å, c = 18.6839 (3) Å, V = 1854.69 (5) Å3, Z = 4, T = 290 (2) K, μ (CuKα) = 0.635 mm−1, Dcalcd. = 1.147 g/cm3, 13,363 reflections measured (8.332° ≤ 2θ ≤ 139.834°), 3474 unique (Rint = 0.0298, Rsigma = 0.0268) which were used in all calculations. The final R1 was 0.0383 and wR2 was 0.0955 (I > 2σ(I)). Flack parameter = 0.02 (11).
3.6. Crystal Data for 7
Orthorhombic, C18H26O3, space group P212121, a = 7.1226 (2) Å, b = 12.8012 (3) Å, c = 37.9453 (12) Å, V = 3459.77 (17) Å3, Z = 8, T = 291 (2) K, μ (CuKα) = 0.589 mm−1, Dcalcd. = 1.115 g/cm3, 30,947 reflections measured (7.288° ≤ 2θ ≤ 142.662°), 6596 unique (Rint = 0.0332, Rsigma = 0.0254) which were used in all calculations. The final R1 was 0.0408 and wR2 was 0.0982 (I > 2σ(I)). Flack parameter = 0.06 (9).
3.7. Crystal Data for 8
Orthorhombic, C18H26O2, space group P212121, a = 7.2748 (2) Å, b = 12.7225 (3) Å, c = 36.8100 (12) Å, V = 3406.90 (17) Å3, Z = 8, T = 289 (2) K, μ (CuKα) = 0.527 mm−1, Dcalcd. = 1.070 g/cm3, 22,920 reflections measured (7.352° ≤ 2θ ≤ 140.302°), 6368 unique (Rint = 0.0271, Rsigma = 0.0284) which were used in all calculations. The final R1 was 0.0448 and wR2 was 0.1130 (I > 2σ(I)). Flack parameter = 0.07 (10).
3.8. X-ray Crystallographic Analysis of Compound 1a, 7 and 8
Crystals of 1a, 7 and 8 were obtained in the mixed solvent of CHCl3-MeOH, and crystallographic data for 1a, 7 and 8 (Cu Kα radiation) have been deposited in the Cambridge Crystallographic Data Center with the deposition numbers CCDC 1537543, 1537544 and 1537542, respectively. These data can be obtained free of charge from the Cambridge Crystallographic Data Centre via the link of reference [29].
3.9. Esterification of 1
To a solution of 1 (3.8 mg) in MeOH (0.5 mL) was added excess TMS-CHN2 in n-hexane (300 µL), and the mixture was stirred at r. t. for 30 min. Then the reaction mixture was concentrated in vacuo and the residue was purified by preparative HPLC (MeOH: H2O = 50–100%) to yield methyl ester 1a (2.0 mg). 1a: 1H NMR (500 MHz, Methanol-d4) δ 7.26 (1H, dd, J = 11.1, 15.4 Hz, H-3), 6.33 (1H, dd, J = 11.0, 15.3 Hz, H-4), 6.05 (1H, dd, J = 9.5, 15.3 Hz, H-5), 5.85 (1H, d, J = 15.4 Hz, H-2), 5.82 (1H, d, J = 6.5 Hz, H-14), 3.82 (1H, dd, J = 1.7, 6.5 Hz, H-13), 3.71 (3H, s, -CH3), 3.36 (2H, d, J = 6.3 Hz, H2-17), 2.61 (1H, t, J = 7.9 Hz, H-6), 1.68 (1H, overlap, H-11a), 1.66 (1H, overlap, H-9a), 1.60 (3H, s, H3-16), 1.60 (1H, overlap, H-10), 1.36 (1H, overlap, H-8), 1.33 (1H, overlap, H-7), 1.28 (1H, overlap, H-12), 1.12 (1H, q, J = 12.1 Hz, H-11b), 0.96 (3H, d, J = 6.3 Hz, H3-18), 0.73 (1H, q, J = 12.0 Hz, H-9b).
3.10. Methylation of 1 and 2
To a solution of 1 (1.6 mg) or 2 (1.6 mg) and excess NaH in DMF (0.2 mL) were added excess CH3I, and the mixtures were stirred at 80 °C for 6 h. Then the reaction mixtures were filtered and purified by preparative HPLC (MeOH:H2O = 50–100%) to yield 1b (0.8 mg from 1 and 0.7 from 2), respectively. 1b: 1H NMR (500 MHz, Methanol-d4) δ 7.24 (1H, dd, J = 11.6, 15.3 Hz, H- 3), 6.30 (1H, dd, J = 11.0, 15.3 Hz, H-4), 5.96 (1H, overlap, H-14), 5.96 (1H, overlap, H-5), 5.81 (1H, d, J = 15.4 Hz, H-2), 3.45 (1H, d, J = 5.9 Hz, H-13), 3.33 (3H, s, OCH3-13), 3.31 (3H, s, OCH3-17), 3.21 (2H, d, J = 6.3 Hz, H2-17), 2.61 (1H, dd, J = 4.6, 8.8 Hz, H-6), 1.70 (1H, overlap, H-11a), 1.68 (1H, overlap, H-9a), 1.64 (3H, s, H3-16), 1.61 (1H, overlap, H-10), 1.31 (1H, overlap, H-8), 1.31 (1H, overlap, H-7), 1.31 (1H, overlap, H-12), 1.19 (1H, q, J = 11.6 Hz, H-11b), 0.95 (3H, d, J = 5.7 Hz, H3-18), 0.75 (1H, q, J = 10.8 Hz, H-9b). 13C NMR (125 MHz, Methanol-d4) δ 174.7, 144.9, 140.4, 139.6, 130.4, 127.0, 123.1, 78.3, 76.3, 57.6, 55.3, 50.0, 44.5, 42.5, 39.7, 39.7, 37.5, 33.0, 21.2, 21.1. ESI-MS [M − H]− m/z 333.45.
3.11. Reduction of 12 and 13
To a solution of 12 (2.0 mg) or 13 (2.0 mg) in MeOH (300 µL) were added Pd/C (0.2 mg) under hydrogen atmosphere. After stirring at r.t. for 2 h, the reaction mixtures were evaporated in vacuo, and 12a (0.6 mg ( −7.78 (c 0.042, MeOH)) from 12 and 0.6 mg ( −6.09 (c 0.042, MeOH)) from 13) were obtained by semi-preparative HPLC using a gradient solvent system of 30−100% CH3CN/H2O over 30 min, respectively. 12a: 1H NMR (500 MHz, CDCl3) δ 6.90 (1H, d, J = 7.6 Hz), 6.83 (1H, d, J = 7.6 Hz), 3.22 (1H, m), 2.72–2.59 (2H, overlap), 2.58 (1H, m), 2.41 (2H, t, J = 7.5 Hz), 2.36 (1H, dd, J = 12.4, 14.1 Hz), 2.29 (3H, s), 2.19 (1H, m), 1.77 (2H, m), 1.63 (1H, m), 1.51 (2H, m), 1.18 (3H, d, J = 7.1 Hz), 1.14 (1H, m), 1.07 (1H, d, J = 6.6 Hz). 13C NMR (125 MHz, CDCl3) δ 178.7, 140.4, 137.9, 136.9, 134.0, 127.5, 126.1, 40.1, 39.0, 33.7, 30.0, 29.9, 29.8, 28.6, 25.6, 25.3, 22.9, 19.8.
3.12. Cell-Based Lipid Accumulation Assay
HepG2 cells, seeded in a 96 wells plate at the concentration of 1 × 10⁵ cells/well, were cultured in high glucose DMEM medium containing 10% fetal bovine serum (FBS) at 37 °C and 5% CO2. After reaching 90% confluence, cells were incubated with the indicated concentration of compounds (10 µM) or with simvastatin (10 μM) in high glucose DMEM containing OA (100 μM) for 24 h. The blank group was incubated with serum-free high glucose DMEM alone. Oil red O staining was performed as previous reported [30] and the intracellular contents of total cholesterol and triglyceride were determined by kits according to manufacturer’s instructions.
3.13. Assay of Cytotoxicity, Antiviral Activity and NF-κB Inhibitory Activity
3.14. Statistical Analysis
The data of lipid lowering effect were expressed as mean ± SEM, representing at least three different experiments with n = 8 in each test. SPSS 17.0 software (SPSS, Chicago, IL, USA) was used for statistical analysis. Differences were assessed by an unpaired t-test. A probability level (p) of 0.05 was considered significant.
4. Conclusions
In summary, seven new tanzawaic acid derivatives, along with seven known compounds were isolated from Penicillium steckii HDN13-279. The absolute configurations of all the compounds (including the known compounds of which the absolute configurations were not confirmed in the literature) were determined by NMR, X-ray diffraction, CD analyses, as well as chemical derivatization. In addition, for the first time, we evaluated the lowering effects against oleic acid (OA)-elicited lipid accumulation in HepG2 liver cells of this kinds of compounds, and five (2, 3, 6, 10 and 12) showed pharmaceutical potential with lipid-lowering activity.
Supplementary Materials
The following are available online at www.mdpi.com/1660-3397/16/1/25/s1, 1D and 2D NMR spectra, IR spectra of 1–6, 11; 1H NMR spectrum of 1a; 1D NMR spectra of 1b and 12a. Figures S1–S7: 1D, 2D NMR, NOESY and HRESIMS spectra of tanzawaic acid R (1), Figures S8–S14: 1D, 2D NMR, NOESY and HRESIMS spectra of tanzawaic acid S (2), Figures S15–S21: 1D, 2D NMR, NOESY and HRESIMS spectra of tanzawaic acid T (3), Figures S22–S28: 1D, 2D NMR, NOESY and HRESIMS spectra of tanzawaic acid U (4), Figures S29–S35: 1D, 2D NMR, NOESY and HRESIMS spectra of tanzawaic acid V (5), Figures S36–S42: 1D, 2D NMR, NOESY and HRESIMS spectra of tanzawaic acid W (6), Figures S43–S49: 1D, 2D NMR, NOESY and HRESIMS spectra of tanzawaic acid X (11), Figure S50: 1H NMR spectrum of 1a, Figures S51–S52: 1D NMR spectra of 1b, Figures S53–S54: 1D NMR spectra of 12a, Figures S55–S61: IR spectrum of tanzawaic acids R–X (1–6, 11).
Acknowledgments
This work was financially supported by the National Natural Science Foundation of China (21372208), the Shandong Provincial Natural Science Fund for Distinguished Young Scholars (JQ201422), AoShan Talents Program Supported by Qingdao National Laboratory for Marine Science and Technology (2015ASTP-ES09), NSFC-Shandong Joint Fund for Marine Science Research Centers (U1606403), Shandong province key research and development program (2016GSF201204), Fundamental Research Funds for the Central Universities (201564026), the Scientific and Technological Innovation Project Financially Supported by Qingdao National Laboratory for Marine Science and Technology (2015ASKJ02).
Author Contributions
The contributions of the respective authors are as follows: Guihong Yu and Shuai Wang drafted the work. Guihong Yu and Lu Wang performed the fermentation, extraction, isolation, and structural elucidation of the constituents. Shuai Wang was performed the biological evaluations. Qian Che, Tianjiao Zhu, Guojian Zhang and Qianqun Gu contributed to checking and confirming all of the procedures of the isolation and the structural elucidation. Dehai Li and Peng Guo designed the study, supervised the laboratory work, and contributed to the critical reading of the manuscript and also were involved in structural determination and bioactivity elucidation. All the authors have read the final manuscript and approved the submission.
Conflicts of Interest
The authors declare no conflict of interest.
References
- Chen, W.; Lu, H.; Yang, J.; Xiang, H.; Peng, H. Sphingosine 1-phosphate in metabolic syndrome. Int. J. Mol. Med. 2016, 38, 1030–1038. [Google Scholar] [CrossRef] [PubMed]
- Wilson, P.W.; D’Agostino, R.B.; Parise, H.; Sullivan, L.; Meigs, J.B. Metabolic syndrome as a precursor of cardiovascular disease and type 2 diabetes mellitus. Circulation 2005, 112, 3066–3072. [Google Scholar] [CrossRef] [PubMed]
- Mendonça, F.M.; de Sousa, F.R.; Barbosa, A.L.; Martins, S.C.; Araújo, R.L.; Soares, R.; Abreu, C. Metabolic syndrome and risk of cancer: Which link? Metabolism 2015, 64, 182–189. [Google Scholar] [CrossRef] [PubMed]
- Lusis, A.J. Atherosclerosis. Nature 2000, 407, 233–241. [Google Scholar] [CrossRef] [PubMed]
- Thygesen, K.; Alpert, J.S.; White, H.D. Universal definition of myocardial infarction. J. Am. Coll. Cardiol. 2007, 50, 2173–2195. [Google Scholar] [CrossRef] [PubMed]
- Wald, N.J.; Law, M.R. Serum cholesterol and ischemic heart disease. Atherosclerosis 1995, 118, S1–S5. [Google Scholar] [CrossRef]
- Studer, M.; Briel, M.; Leimenstoll, B.; Glass, T.R.; Bucher, H.C. Effect of different antilipidemic agents and diets on mortality: A systematic review. Arch. Intern. Med. 2005, 165, 725–730. [Google Scholar] [CrossRef] [PubMed]
- Brugts, J.J.; Yetgin, T.; Hoeks, S.E.; Gotto, A.M.; Shepherd, J.; Westendorp, R.G.J.; de Craen, A.J.M.; Knopp, R.H.; Nakamura, H.; Ridker, P.; et al. The benefits of statins in people without established cardiovascular disease but with cardiovascular risk factors: Meta-analysis of randomised controlled trials. Br. Med. J. 2009, 338. [Google Scholar] [CrossRef] [PubMed]
- Jun, M.; Foote, C.; Lv, J.; Neal, B.; Patel, A.; Nicholls, S.J.; Grobbee, D.E.; Cass, A.; Chalmers, J.; Perkovic, V. Effects of fibrates on cardiovascular outcomes: A systematic review and meta-analysis. Lancet 2010, 375, 1875–1884. [Google Scholar] [CrossRef]
- Last, A.R.; Ference, J.D.; Falleroni, J. Pharmacologic treatment of hyperlipidemia. Am. Fam. Physician 2011, 84, 551–558. [Google Scholar] [PubMed]
- Upendra, R.S.; Khandelwal, P.; Amiri, Z.R.; Shwetha, L.; Mohammed, A.S. Screening and molecular characterization of natural fungal isolates producing lovastatin. J. Microb. Biochem. Technol. 2013, 5. [Google Scholar] [CrossRef]
- Phainuphong, P.; Rukachaisirikul, V.; Saithong, S.; Phongpaichit, S.; Bowornwiriyapan, K.; Muanprasat, C.; Srimaroeng, C.; Duangjai, A.; Sakayaroj, J. Lovastatin Analogues from the Soil-Derived Fungus Aspergillus sclerotiorum PSU-RSPG178. J. Nat. Prod. 2016, 79, 1500–1507. [Google Scholar] [CrossRef] [PubMed]
- Yu, G.H.; Zhou, G.L.; Zhu, M.L.; Wang, W.; Zhu, T.J.; Gu, Q.Q.; Li, D.H. Neosartoryadins A and B, Fumiquinazoline Alkaloids from a Mangrove-Derived Fungus Neosartorya udagawae HDN13-313. Org. Lett. 2016, 18, 244–247. [Google Scholar] [CrossRef] [PubMed]
- Wu, G.W.; Yu, G.H.; Kurtán, T.; Mándi, A.; Peng, J.X.; Mo, X.M.; Liu, M.; Li, H.; Sun, X.H.; Li, J.; et al. Versixanthones A-F, Cytotoxic Xanthone-Chromanone Dimers from the Marine-Derived Fungus Aspergillus versicolor HDN1009. J. Nat. Prod. 2015, 78, 2691–2698. [Google Scholar] [CrossRef] [PubMed]
- Malmstrøm, J.; Christophersen, C.; Frisvad, J.C. Secondary metabolites characteristic of Penicillium citrinum, Penicillium steckii and related species. Phytochemistry 2000, 54, 301–309. [Google Scholar] [CrossRef]
- Sabat, J.; Gupta, N. Nutritional factors affecting the antifungal activity of Penicillium steckii of mangrove origin. Afr. J. Microbiol. Res. 2010, 4, 126–135. [Google Scholar]
- Cox, R.H.; Hernandez, O.; Dorner, J.W.; Cole, R.J.; Fennell, D.I. A new isochroman mycotoxin isolated from penicillium steckii. J. Agric. Food Chem. 1979, 27, 999–1001. [Google Scholar] [CrossRef] [PubMed]
- Shin, H.J.; Pil, G.B.; Heo, S.J.; Lee, H.S.; Lee, J.S.; Lee, Y.J.; Lee, J.; Won, H.S. Anti-inflammatory activity of tanzawaic acid derivatives from a marine-derived fungus Penicillium steckii 108YD142. Mar. Drugs 2016, 14. [Google Scholar] [CrossRef] [PubMed]
- Kuramoto, M.; Yamada, K.; Shikano, M.; Yazawa, K.; Arimoto, H.; Okamura, T.; Uemura, D. Tanzawaic acid A, B, C, and D: Inhibitors of superoxide anion production from Penicillium citrinum. Chem. Lett. 1997, 26, 885–886. [Google Scholar] [CrossRef]
- Cardoso-Martínez, F.; de la Rosa, J.M.; Díaz-Marrero, A.R.; Darias, J.; Cerella, C.; Diederich, M.; Cueto, M. Tanzawaic acids isolated from a marine-derived fungus of the genus Penicillium with cytotoxic activities. Org. Biomol. Chem. 2015, 13, 7248–7256. [Google Scholar] [CrossRef] [PubMed]
- Quang, T.H.; Ngan, N.T.T.; Ko, W.; Kim, D.C.; Yoon, C.S.; Sohn, J.H.; Yim, J.H.; Kim, Y.; Oh, H. Tanzawaic acid derivatives from a marine isolate of Penicillium sp. (SF-6013) with anti-inflammatory and PTP1B inhibitory activities. Bioorg. Med. Chem. Lett. 2014, 24, 5787–5791. [Google Scholar] [CrossRef] [PubMed]
- Masuma, R.; Tabata, N.; Tomoda, H.; Haneda, K.; Iwai, Y.; Omura, S. Arohynapenes A and B, new anticoccidial agents produced by Penicillium sp. Taxonomy, fermentation, and structure elucidation. J. Antibiot. 1994, 47, 46–53. [Google Scholar] [CrossRef] [PubMed]
- Tabata, N.; Tomoda, H.; Masuma, R.; Haneda, K.; Iwai, Y.; Omura, S. Hynapenes A, B and C, new anticoccidial agents produced by Penicillium sp. I. Production, isolation and physico-chemical and biological properties. J. Antibiot. 1993, 46, 1849–1853. [Google Scholar] [CrossRef] [PubMed]
- Ondeyka, J.G.; Giacobbe, R.A.; Bills, G.F.; Cuadrillero, C.; Schmatz, D.; Goetz, M.A.; Zink, D.L.; Singh, S.B. Coprophilin: An anticoccidial agent produced by a dung inhabiting fungus. Bioorg. Med. Chem. Lett. 1998, 8, 3439–3442. [Google Scholar] [CrossRef]
- El-Neketi, M.; Ebrahim, W.; Lin, W.; Gedara, S.; Badria, F.; Saad, H.E.A.; Lai, D.; Proksch, P. Alkaloids and Polyketides from Penicillium citrinum, an Endophyte Isolated from the Moroccan Plant Ceratonia siliqua. J. Nat. Prod. 2013, 76, 1099–1104. [Google Scholar] [CrossRef] [PubMed]
- Arimoto, H.; Nishimura, K.; Kuramoto, M.; Uemura, D. Synthesis and absolute stereochemistry of tanzawaic acid (GS-1302). Tetrahedron Lett. 1998, 39, 9513–9516. [Google Scholar] [CrossRef]
- Wu, G.W.; Ma, H.Y.; Zhu, T.J.; Li, J.; Gu, Q.Q.; Li, D.H. Penilactones A and B, two novel polyketides from Antarctic deep-sea derived fungus Penicillium crustosum PRB-2. Tetrahedron 2012, 68, 9745–9749. [Google Scholar] [CrossRef]
- Peng, J.X.; Zhang, X.M.; Du, L.; Wang, W.; Zhu, T.J.; Gu, Q.Q.; Li, D.H. Sorbicatechols A and B, antiviral sorbicillinoids from the marine-derived fungus Penicillium chrysogenum PJX-17. J. Nat. Prod. 2014, 77, 424–428. [Google Scholar] [CrossRef] [PubMed]
- Access Structures. Available online: http://www.ccdc.cam.ac.uk/data_request/cif (accessed on 13 March 2017).
- Zhang, X.P.; Wu, C.M.; Wu, H.F.; Sheng, L.H.; Su, Y.; Zhang, X.; Luan, H.; Sun, G.; Sun, X.B.; Tian, Y.; et al. Anti-hyperlipidemic effects and potential mechanisms of action of the caffeoylquinic acid-rich Pandanus tectorius fruit extract in hamsters fed a high fat-diet. PLoS ONE 2013, 8. [Google Scholar] [CrossRef] [PubMed]
- Du, L.; Zhu, T.J.; Liu, H.B.; Fang, Y.C.; Zhu, W.M.; Gu, Q.Q. Cytotoxic polyketides from a marine-derived fungus, Aspergillus glaucus. J. Nat. Prod. 2008, 71, 1837–1842. [Google Scholar] [CrossRef] [PubMed]
- Peng, J.X.; Jiao, J.Y.; Li, J.; Wang, W.; Gu, Q.Q.; Zhu, T.J.; Li, D.H. Pyronepolyene C-glucosides with NF-κB inhibitory and anti-influenza A viral (H1N1) activities from the sponge-associated fungus Epicoccum sp. JJY40. Bioorg. Med. Chem. Lett. 2012, 22, 3188–3190. [Google Scholar] [CrossRef] [PubMed]
Figure 1.
Structures of Compounds 1–14, 1a, 1b and 12a.

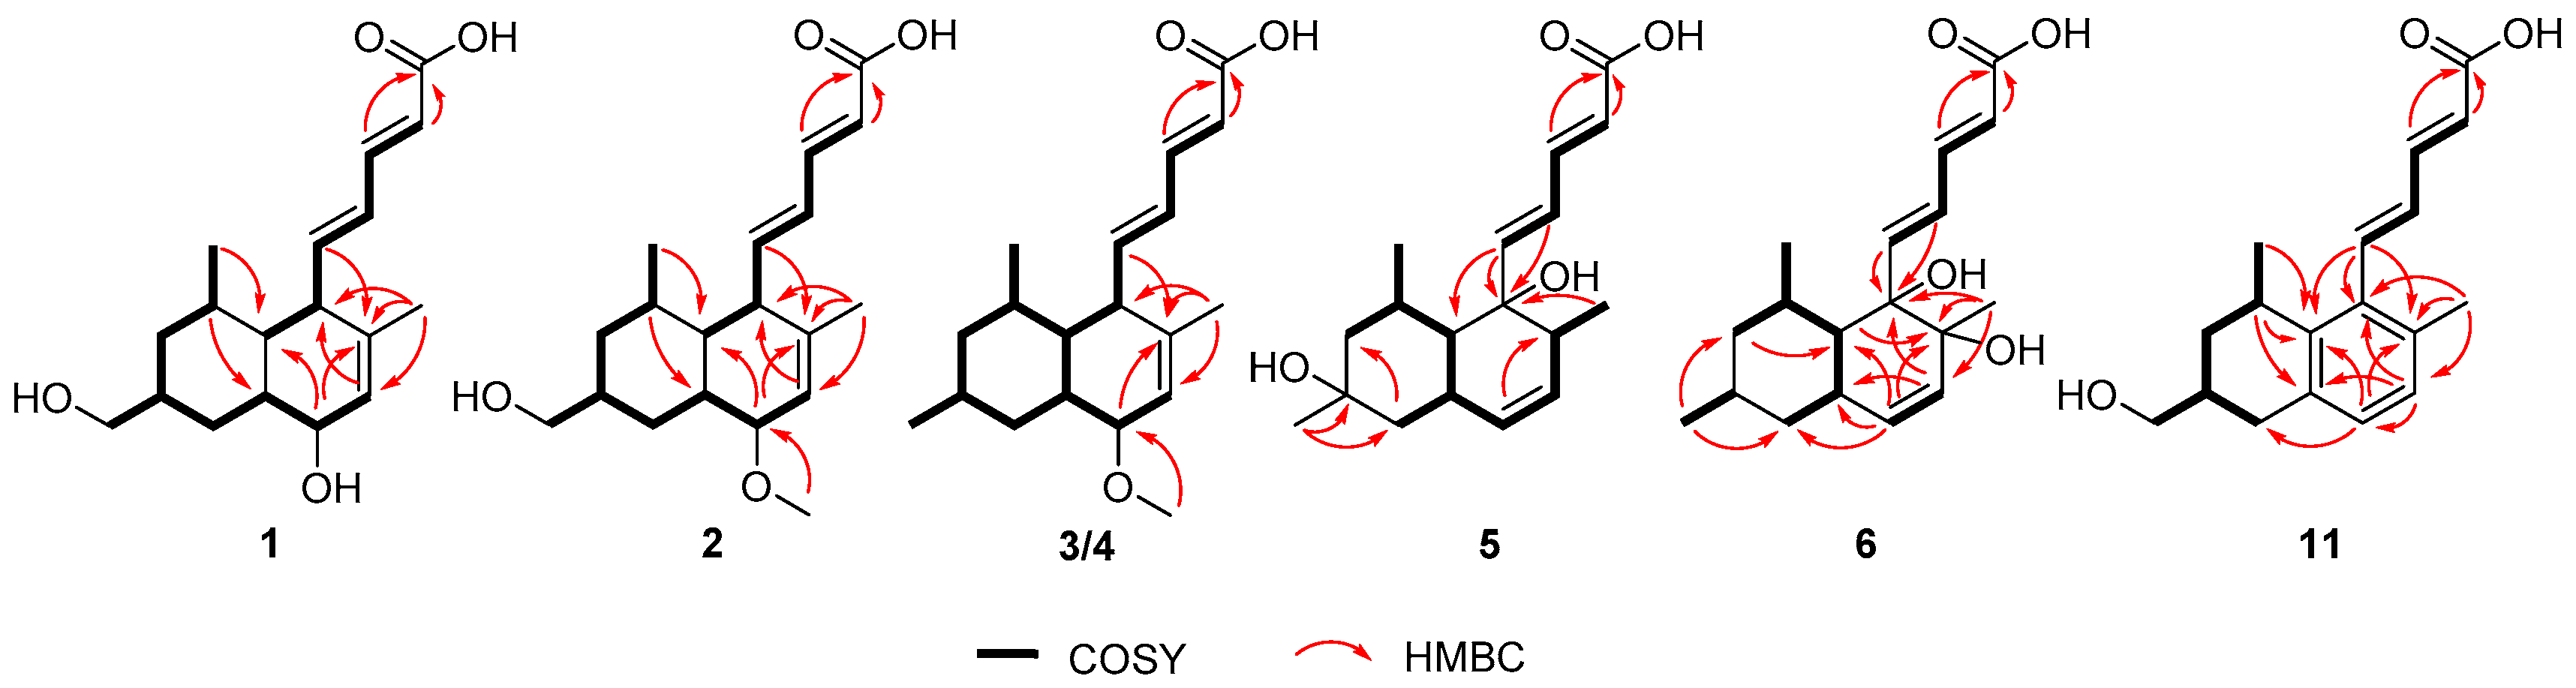
Figure 2.
Key COSY and HMBC correlations of Compounds 1–6, and 11.

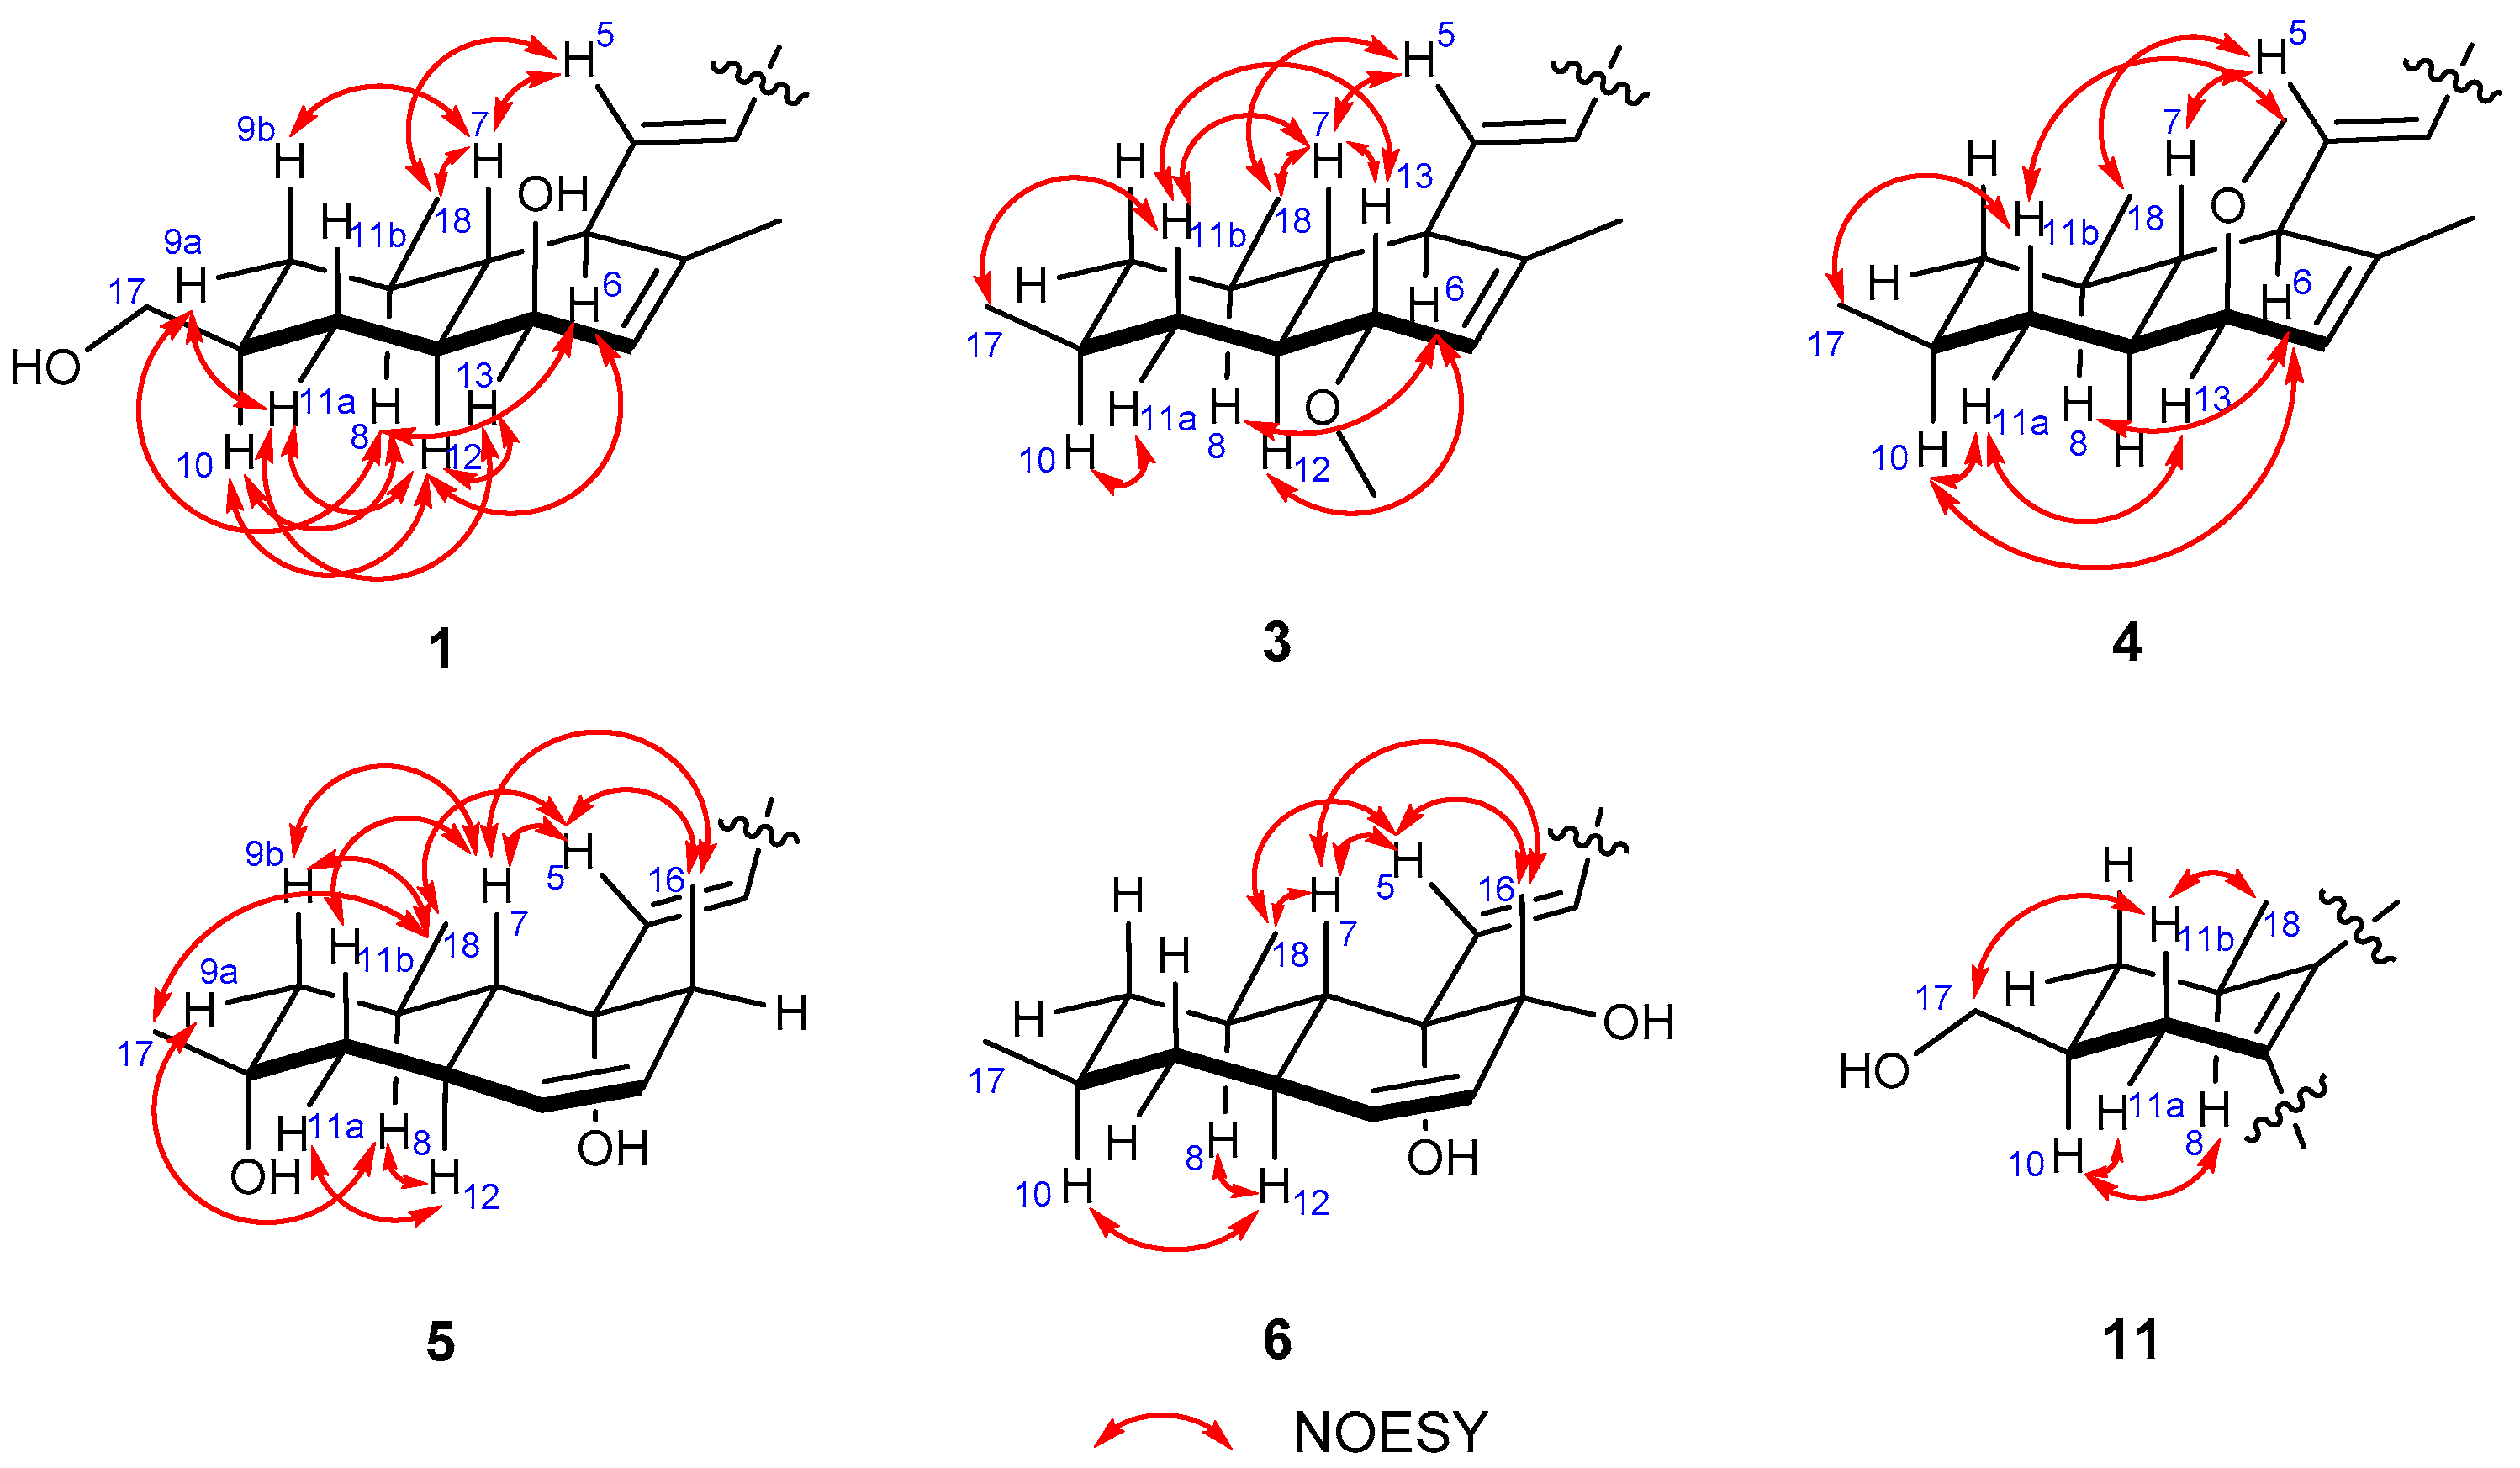
Figure 3.
Key NOESY correlations of Compounds 1, 3–6, and 11.

Figure 4.
X-ray crystallographic structures of 1a, 7, and 8 (black, blue and red on behalf of the elements of C, H, O, respectively).
Figure 4.
X-ray crystallographic structures of 1a, 7, and 8 (black, blue and red on behalf of the elements of C, H, O, respectively).
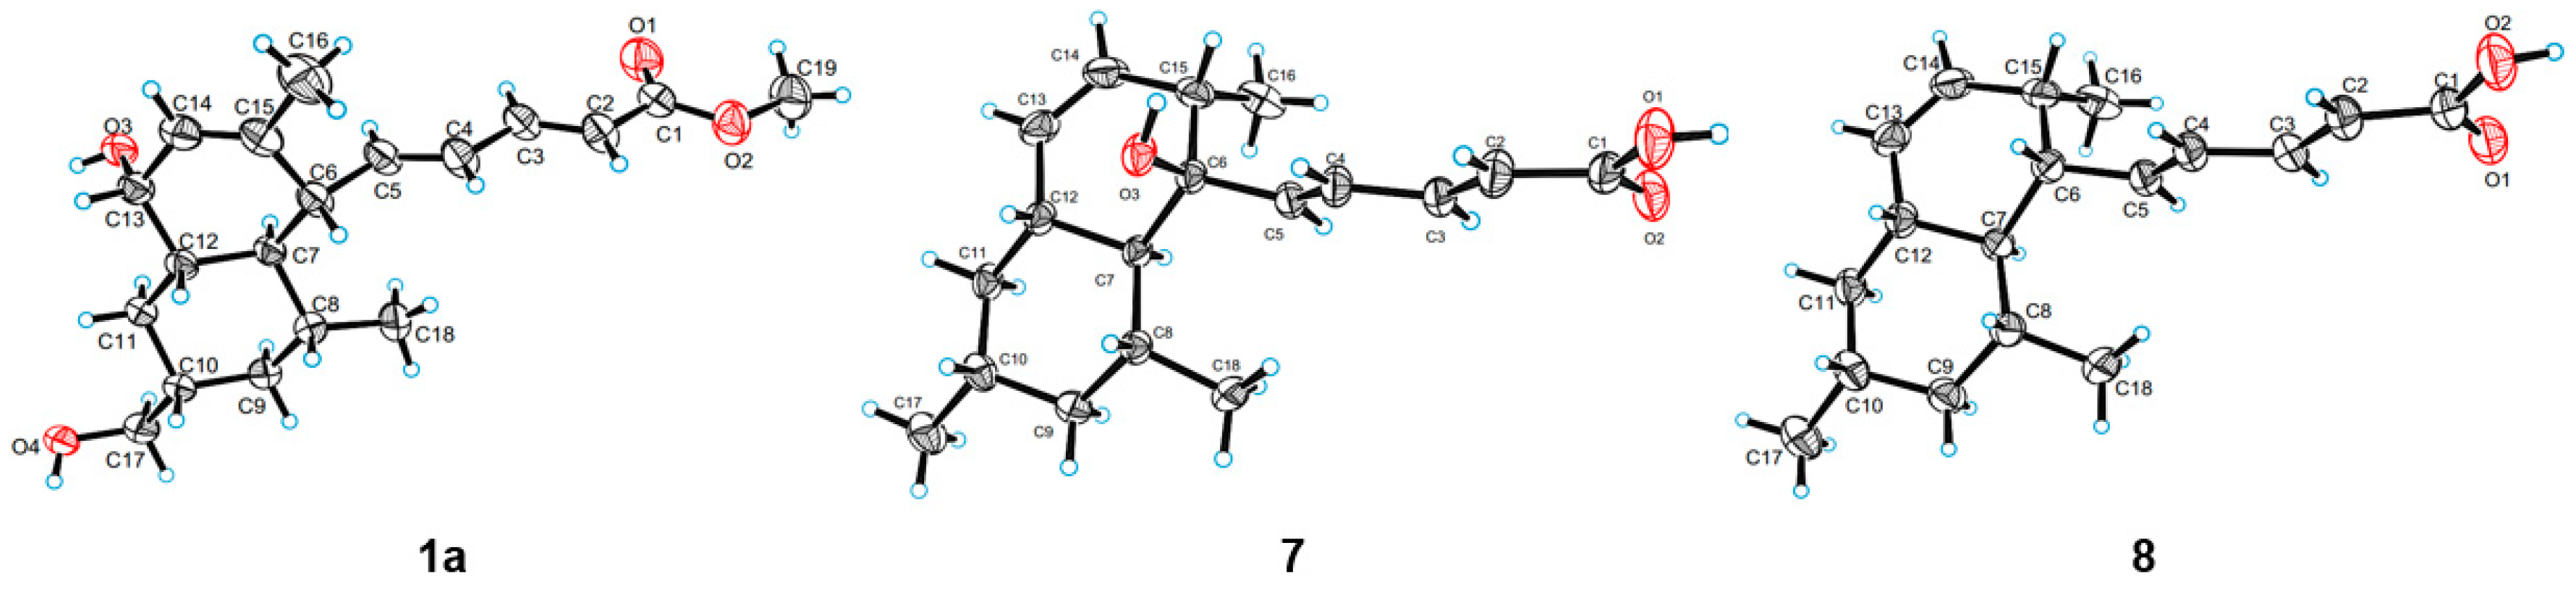
Figure 5.
Experimental ECD spectra of Compounds 1–9 and 11–14.

Figure 6.
Effects of compounds on OA-elicited intracellular lipid accumulation. Cells were treated with 10 μM of indicated compounds or simvastatin (as positive control) in DMEM + 100 μM OA or with DMEM alone (as blank) or DMEM + 100 μM OA (as negative control) for 24 h Neutral lipids were determined by spectrophotometry at 358 nm after oil-red O staining. Bars depict the means ± SEM of at least three experiments. ## p < 0.01, OA versus Blank; * p < 0.05, ** p < 0.01, test group versus OA group. OA: oleic acid.
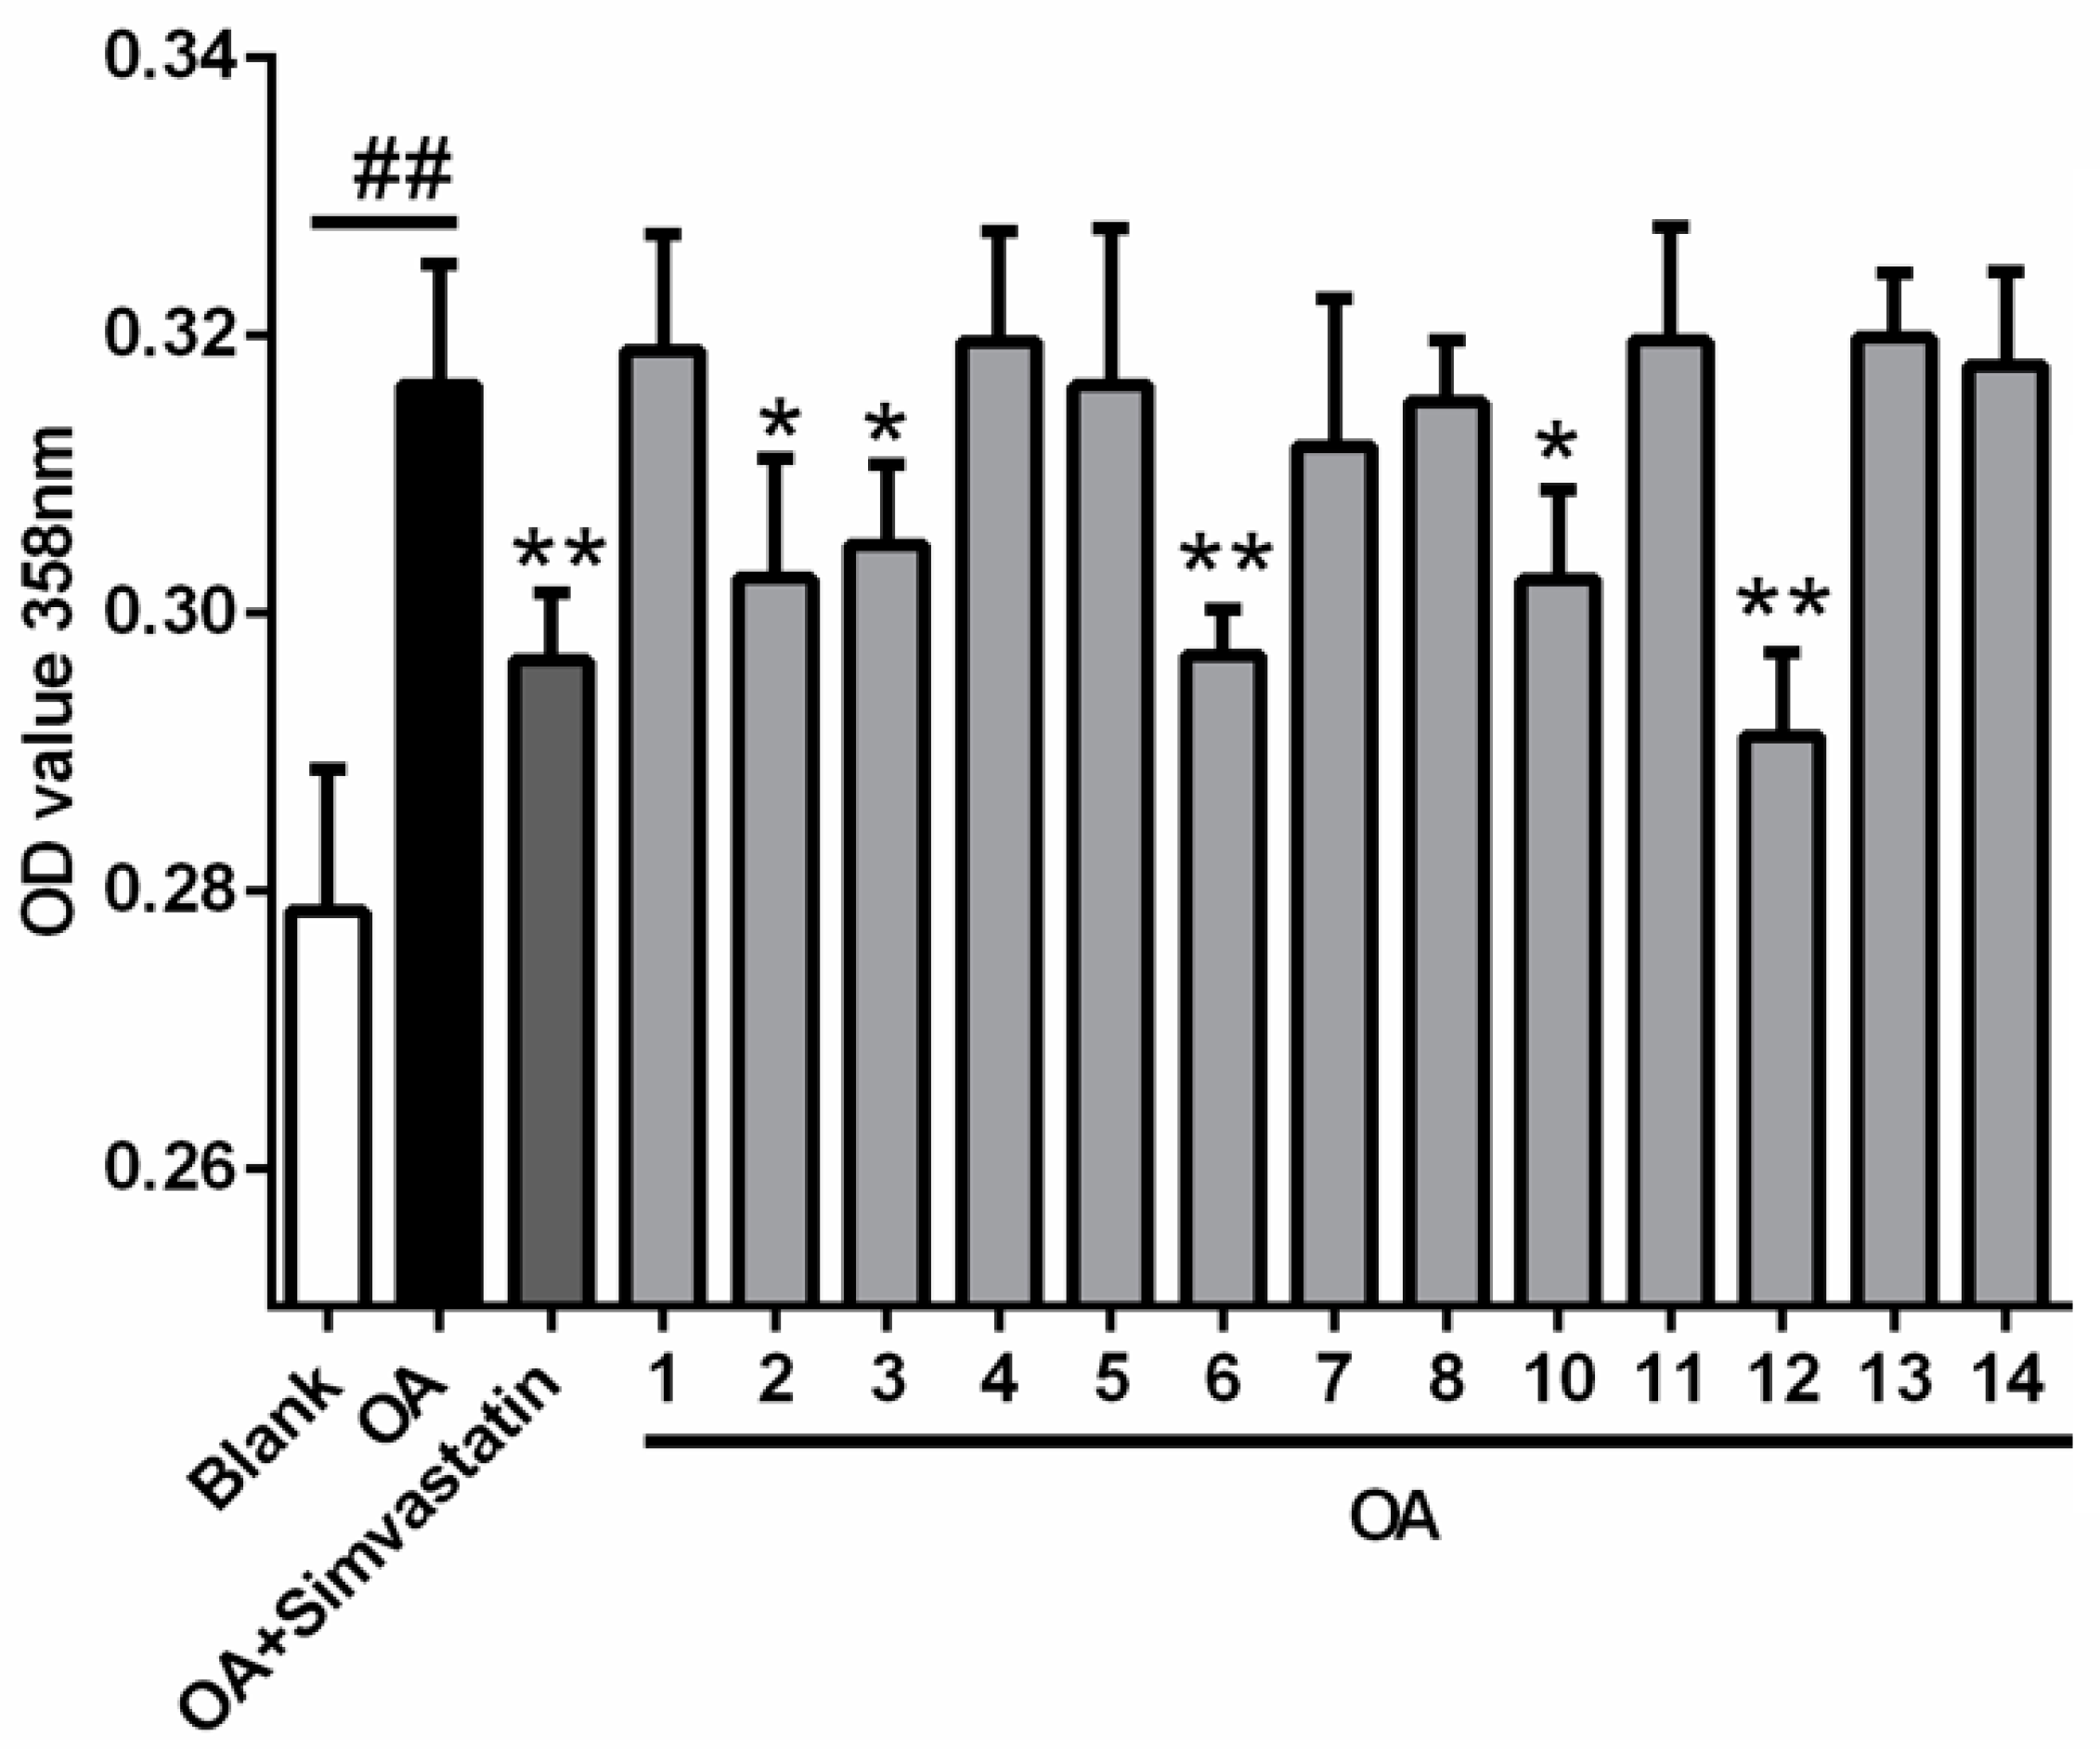
Figure 7.
Inhibitory effects of compounds on intracellular (A) total cholesterol (TC) and (B) triglycerides (TG). Cells were treated with 10 μM of indicated compounds or simvastatin (as positive control) in DMEM + 100 μM OA or with DMEM alone (as blank) or DMEM + 100 μM OA (as negative control) for 24 h. Intracellular TC and TG concentration were measured by kits according to the manufacturer’s instructions. Bars depict the means ± SEM of at least three experiments. ## p < 0.01, OA versus blank; * p < 0.05, ** p < 0.01, test group versus OA group. OA: oleic acid.

Table 1.
1H (500 MHz) and 13C (125 MHz) NMR Data of Compounds 1 and 2 (Methanol-d4, δ ppm).
| No. | 1 | 2 | ||
|---|---|---|---|---|
| δC | δH (J in Hz) | δC | δH (J in Hz) | |
| 1 | 170.1 | - | 169.3 | - |
| 2 | 120.3 | 5.82 overlap | 119.4 | 5.80 d (15.3) |
| 3 | 144.6 | 7.22 dd (11.1, 15.3) | 145.1 | 7.23 dd (11.0, 15.3) |
| 4 | 129.8 | 6.32 dd (10.6, 15.3) | 129.4 | 6.29 dd (11.0, 15.3) |
| 5 | 149.1 | 6.00 dd (9.4, 15.3) | 149.3 | 5.96 overlap |
| 6 | 50.3 | 2.61 t (8.0) | 50.1 | 2.61 dd (4.7, 9.0) |
| 7 | 43.7 | 1.33 m | 44.5 | 1.32 overlap |
| 8 | 39.6 | 1.37 m | 39.7 | 1.32 overlap |
| 9 | 39.6 | 1.69 overlap | 39.5 | 1.69 overlap |
| 0.74 q (12.2) | 0.72 q (11.8) | |||
| 10 | 39.9 | 1.61 overlap | 39.9 | 1.57 m |
| 11 | 32.6 | 1.66 overlap | 32.7 | 1.68 overlap |
| 1.13 q (12.1) | 1.17 q (12.2) | |||
| 12 | 42.6 | 1.29 m | 42.4 | 1.32 overlap |
| 13 | 67.0 | 3.83 dd (2.3, 6.4) | 76.3 | 3.46 d (6.1) |
| 14 | 125.5 | 5.83 overlap | 123.7 | 5.96 overlap |
| 15 | 138.2 | - | 139.7 | - |
| 16 | 21.1 | 1.61 s | 21.1 | 1.63 s |
| 17 | 67.3 | 3.37 d (6.2) | 67.3 | 3.35 d (6.6) |
| 18 | 21.5 | 0.97 d (6.1) | 21.1 | 0.95 d (5.8) |
| 13-OCH3 | - | - | 55.5 | 3.33 s |
Table 2.
1H (500 MHz) and 13C (125 MHz) NMR Data of Compounds 3 and 4 (CDCl3, δ ppm).
| No. | 3 | 4 | ||
|---|---|---|---|---|
| δC | δH (J in Hz) | δC | δH (J in Hz) | |
| 1 | 172.0 | - | 172.3 | - |
| 2 | 118.5 | 5.80 d (15.4) | 118.5 | 5.79 d (15.3) |
| 3 | 147.0 | 7.33 dd (10.9, 15.1) | 147.2 | 7.33 dd (11.0, 15.3) |
| 4 | 129.0 | 6.19 dd (11.0, 15.2) | 129.0 | 6.21 dd (11.2, 15.3) |
| 5 | 150.7 | 5.92 dd (9.4, 15.2) | 151.0 | 6.04 dd (9.4, 15.3) |
| 6 | 49.9 | 2.57 t (8.4) | 50.3 | 2.53 d (5.9, 8.1) |
| 7 | 48.7 | 0.94 m | 44.1 | 1.30 overlap |
| 8 | 39.7 | 1.38 m | 40.1 | 1.30 overlap |
| 9 | 45.7 | 1.62 overlap | 45.2 | 1.55 overlap |
| 0.75 q (12.3) | 0.77 q (11.9) | |||
| 10 | 31.5 | 1.44 m | 32.3 | 1.46 m |
| 11 | 38.2 | 2.19 d (3.2, 12.6) | 38.5 | 1.57 overlap |
| 0.61 q (12.2) | 1.16 q (12.0) | |||
| 12 | 43.9 | 1.23 m | 42.8 | 1.30 overlap |
| 13 | 80.6 | 3.32 d (10.2) | 76.4 | 3.41 d (6.2) |
| 14 | 126.0 | 5.66 s | 124.3 | 5.92 d (5.9) |
| 15 | 134.7 | - | 139.5 | - |
| 16 | 21.8 | 1.58 s | 22.5 | 1.61 s |
| 17 | 22.5 | 0.89 overlap | 22.4 | 0.88 overlap |
| 18 | 22.4 | 0.89 overlap | 21.8 | 0.88 overlap |
| 13-OCH3 | 56.0 | 3.37 s | 56.7 | 3.35 s |
Table 3.
1H (500 MHz) and 13C (125 MHz) NMR Data of Compounds 5, 6 and 11 (δ ppm).
| No. | 5 a | 6 b | 11 b | |||
|---|---|---|---|---|---|---|
| δC | δH (J in Hz) | δC | δH (J in Hz) | δC | δH (J in Hz) | |
| 1 | 169.8 | - | 171.5 | - | 171.6 | - |
| 2 | 120.0 | 5.84 d (15.3) | 120.0 | 5.90 d (15.6) | 119.8 | 5.94 d (15.3) |
| 3 | 144.9 | 7.34 dd (10.0, 15.4) | 145.9 | 7.42 dd (11.6, 14.4) | 147.1 | 7.58 dd (11.0, 15.2) |
| 4 | 122.3 | 6.47 dd (9.9, 15.4) | 125.4 | 6.51 dd (11.5, 14.4) | 131.2 | 6.43 dd (11.0, 15.8) |
| 5 | 153.5 | 6.52 d (15.3) | 149.0 | 6.40 d (15.2) | 141.4 | 7.12 d (15.9) |
| 6 | 75.8 | - | 77.9 | - | 135.0 | - |
| 7 | 49.1 | 1.18 overlap | 51.9 | 1.35 t (9.8) | 140.8 | - |
| 8 | 29.0 | 2.00 m | 33.7 | 1.69 m | 30.4 | 3.26 m |
| 9 | 50.1 | 1.62 dt (3.2, 14.1) | 47.1 | 1.66 overlap | 35.0 | 2.18 m |
| 1.23 overlap | 0.81 overlap | 1.19 m | ||||
| 10 | 69.1 | - | 32.6 | 1.56 m | 37.3 | 1.85 m |
| 11 | 45.3 | 1.72 dt (3.0, 13.4) | 41.4 | 1.78 d (12.2) | 33.6 | 2.77 dt (3.05,14.5) |
| 1.25 m | 0.83 overlap | 2.46 dd (11.9, 15.1) | ||||
| 12 | 33.4 | 2.58 m | 38.3 | 2.21 t (10.7) | 135.2 | - |
| 13 | 130.1 | 5.36 d (9.8) | 132.5 | 5.49 d (9.9) | 128.7 | 6.98 overlap |
| 14 | 129.1 | 5.50 m | 130.1 | 5.40 d (9.9) | 127.8 | 6.98 overlap |
| 15 | 45.7 | - | 75.0 | - | 134.1 | - |
| 16 | 18.3 | 0.97 d (7.1) | 27.4 | 1.27 s | 21.1 | 2.28 s |
| 17 | 30.1 | 1.18 s | 22.2 | 0.88 d (6.5) | 68.0 | 3.66 overlap |
| 3.65 overlap | ||||||
| 18 | 22.0 | 0.91 d (6.6) | 23.5 | 0.95 d (6.1) | 24.0 | 1.16 d (7.0) |
a The NMR data were recorded in Methanol-d4; b the NMR data were recorded in CDCl3.
© 2018 by the authors. Licensee MDPI, Basel, Switzerland. This article is an open access article distributed under the terms and conditions of the Creative Commons Attribution (CC BY) license (http://creativecommons.org/licenses/by/4.0/).
Share and Cite
MDPI and ACS Style
Yu, G.; Wang, S.; Wang, L.; Che, Q.; Zhu, T.; Zhang, G.; Gu, Q.; Guo, P.; Li, D. Lipid-Lowering Polyketides from the Fungus Penicillium Steckii HDN13-279. Mar. Drugs 2018, 16, 25. https://doi.org/10.3390/md16010025
AMA Style
Yu G, Wang S, Wang L, Che Q, Zhu T, Zhang G, Gu Q, Guo P, Li D. Lipid-Lowering Polyketides from the Fungus Penicillium Steckii HDN13-279. Marine Drugs. 2018; 16(1):25. https://doi.org/10.3390/md16010025
Chicago/Turabian StyleYu, Guihong, Shuai Wang, Lu Wang, Qian Che, Tianjiao Zhu, Guojian Zhang, Qianqun Gu, Peng Guo, and Dehai Li. 2018. "Lipid-Lowering Polyketides from the Fungus Penicillium Steckii HDN13-279" Marine Drugs 16, no. 1: 25. https://doi.org/10.3390/md16010025
Note that from the first issue of 2016, this journal uses article numbers instead of page numbers. See further details here.