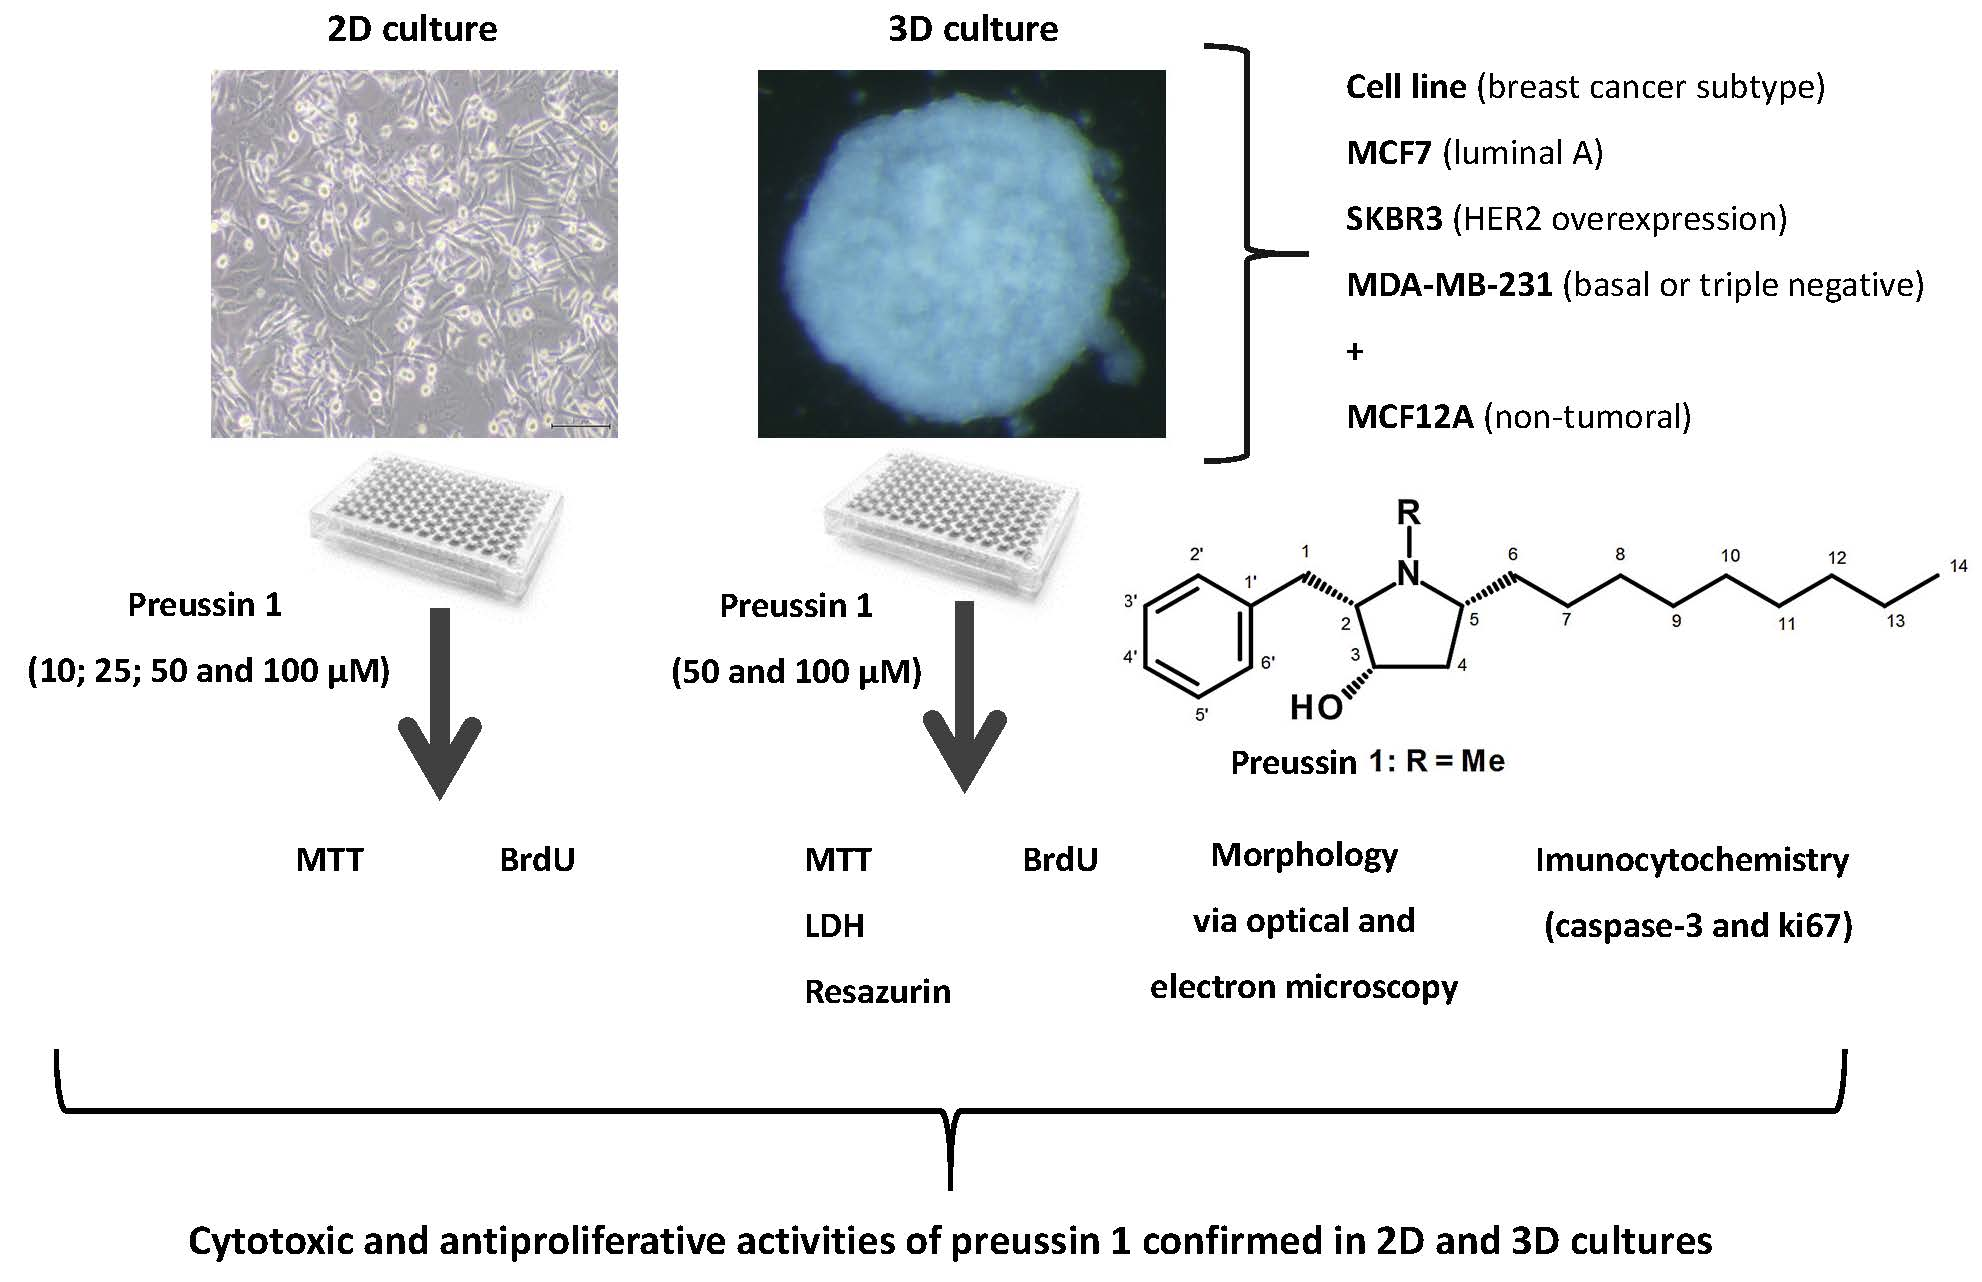
Cytotoxic and Antiproliferative Effects of Preussin, a Hydroxypyrrolidine Derivative from the Marine Sponge-Associated Fungus Aspergillus candidus KUFA 0062, in a Panel of Breast Cancer Cell Lines and Using 2D and 3D Cultures

 ,
,  ,
,  and
and 
Abstract
:
1. Introduction
2. Results
2.1. Cells Exposure in 2D
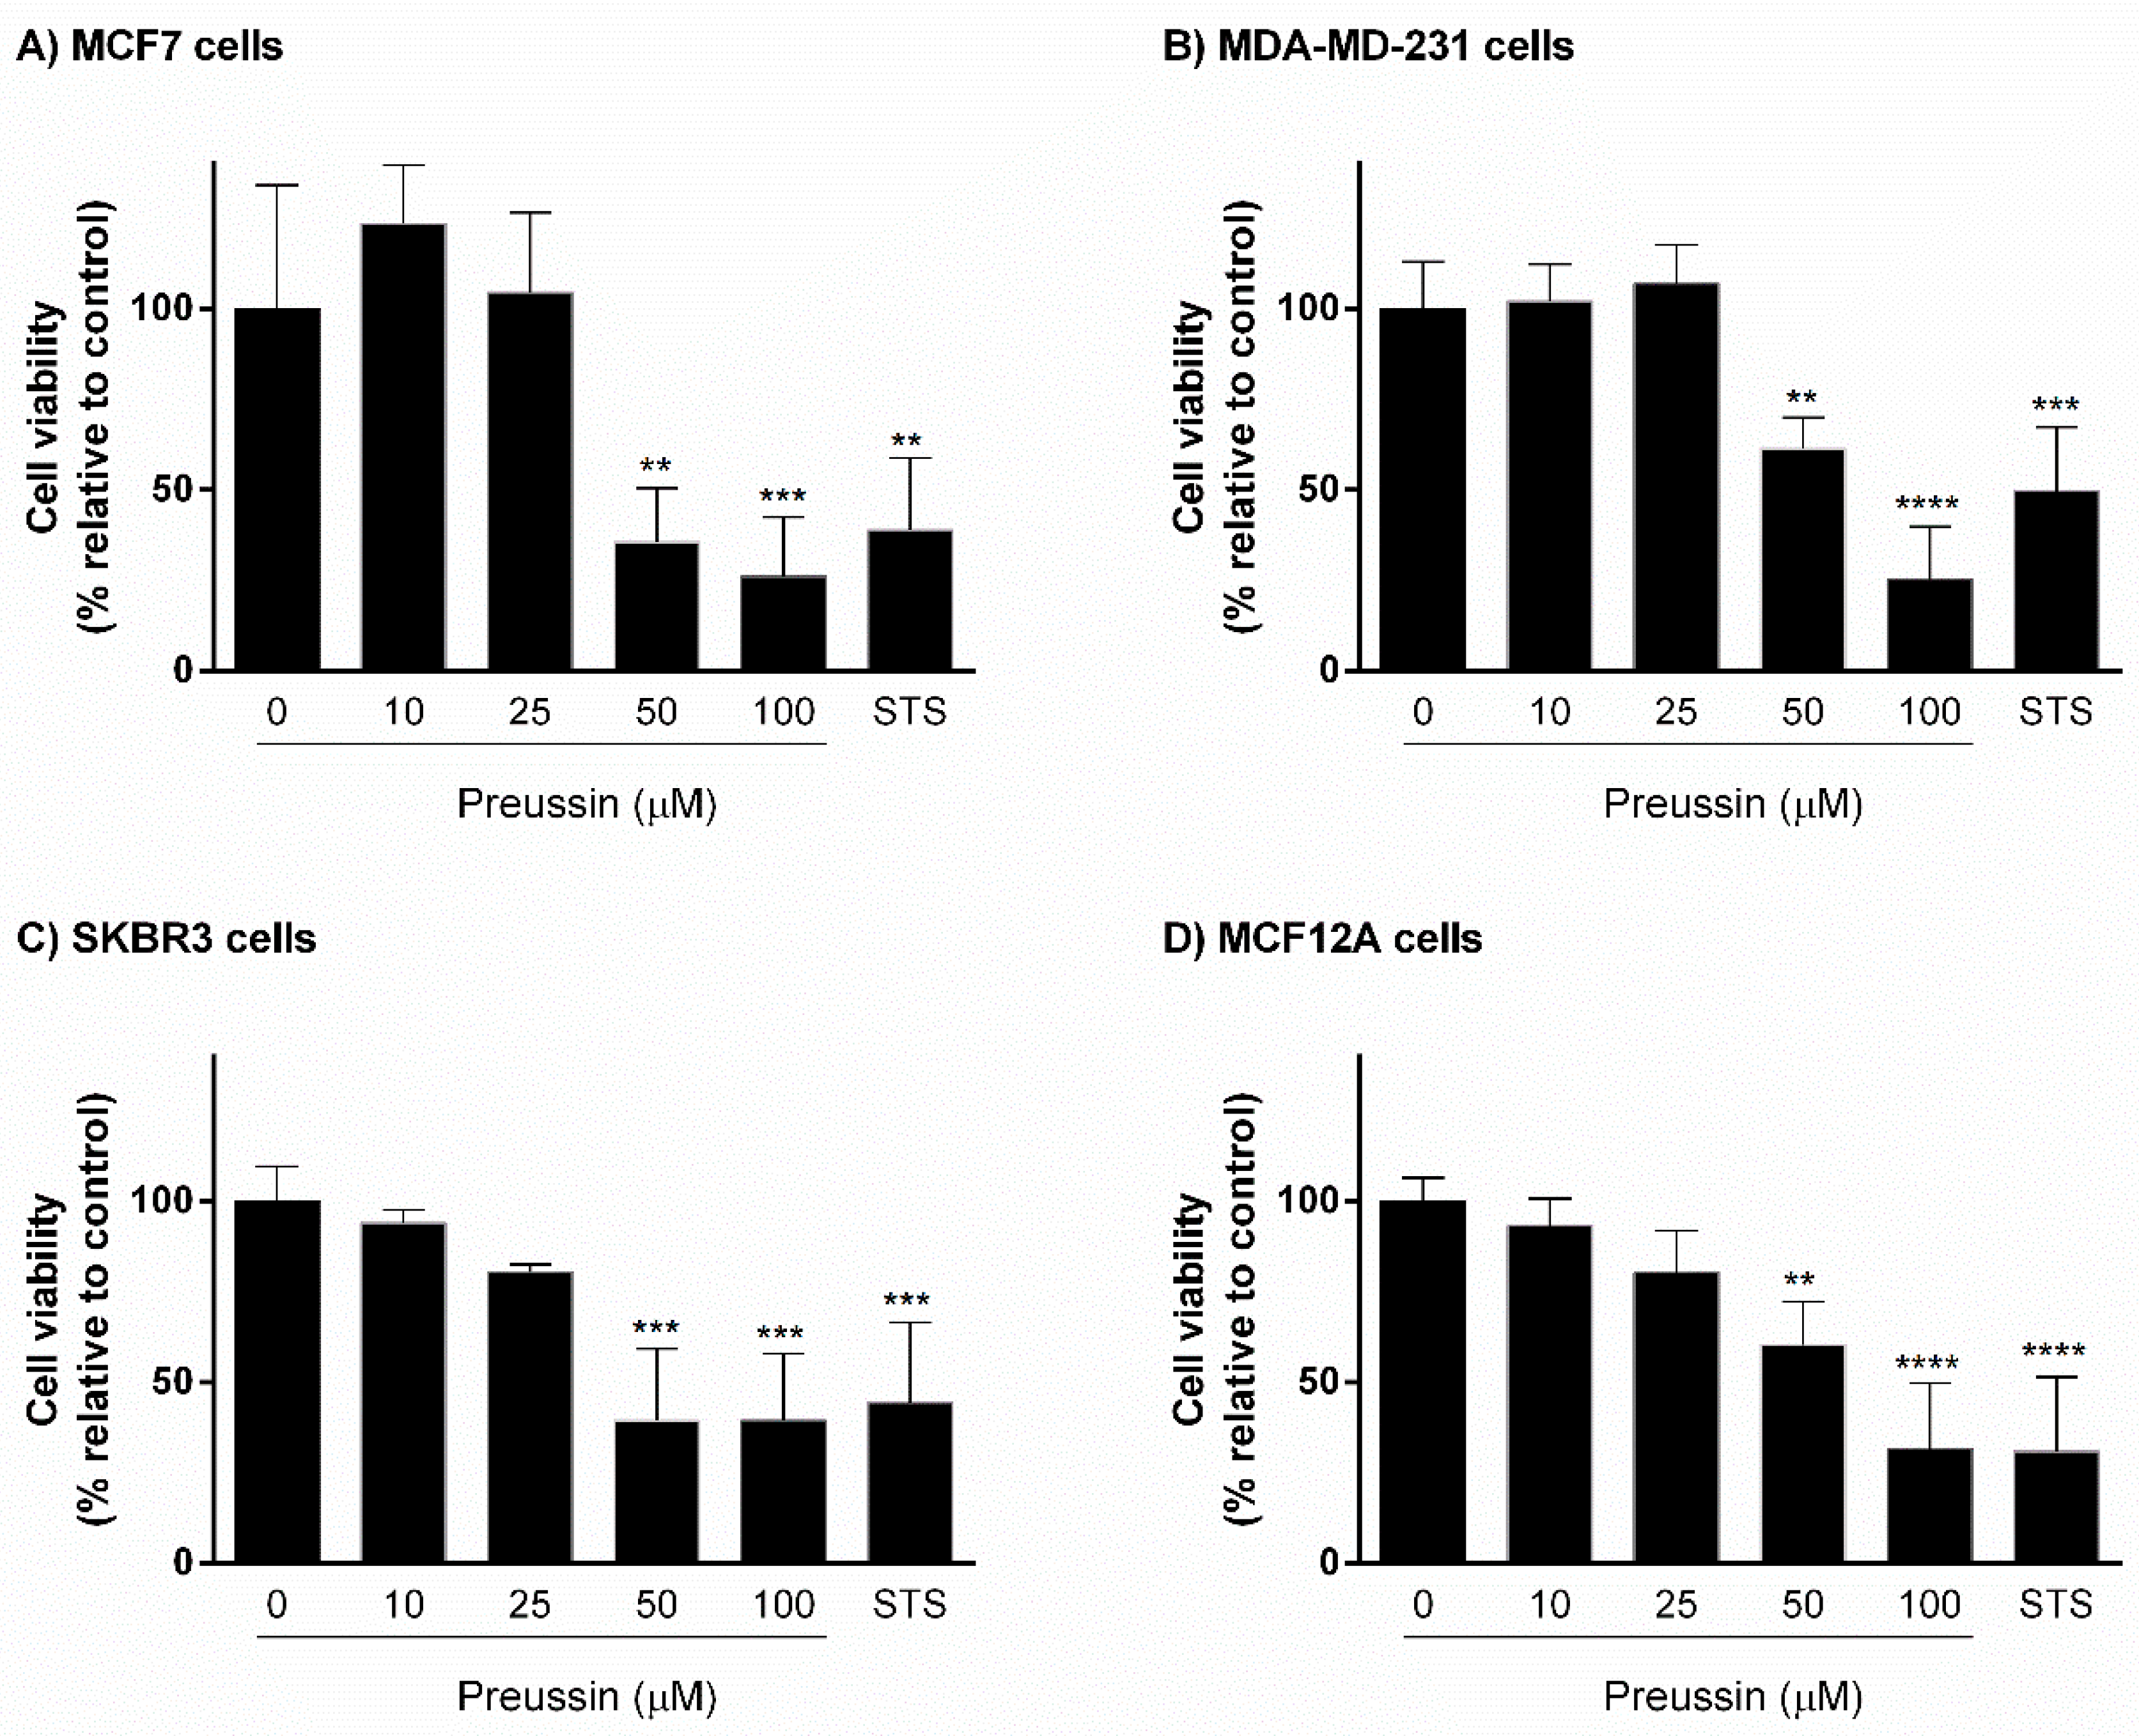
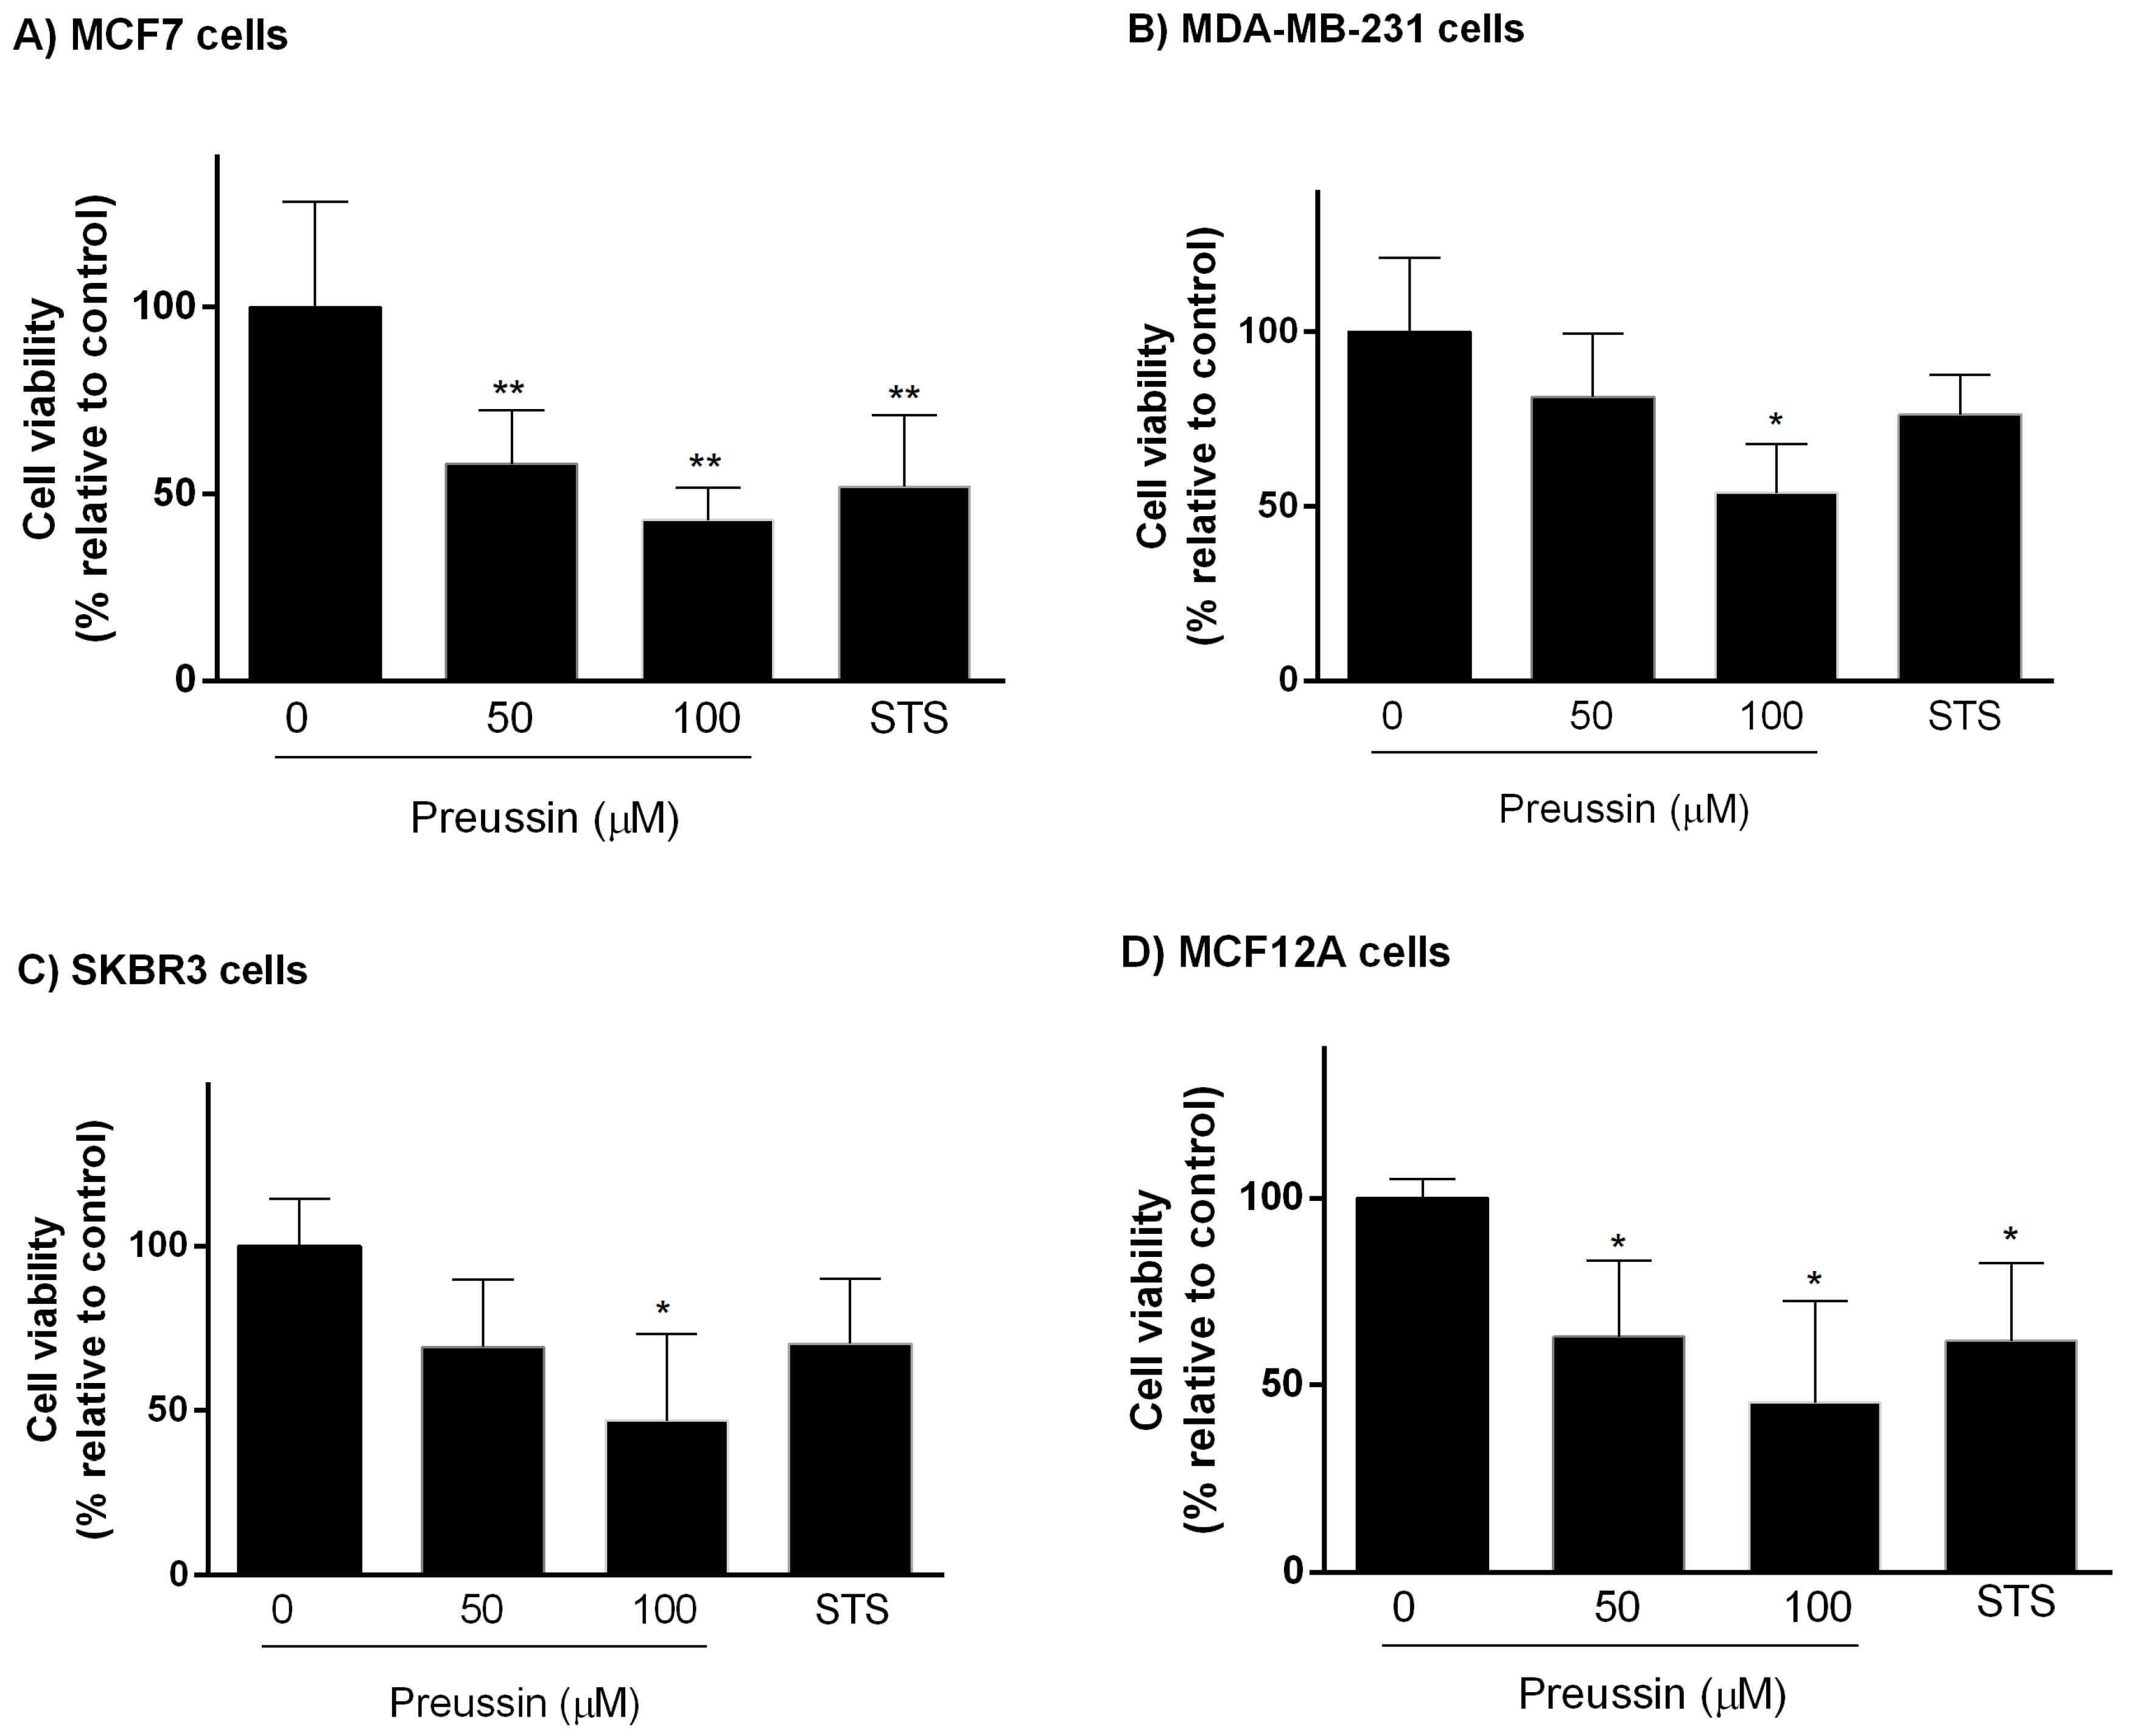
2.1.1. Analysis of Cell Viability—MTT Assay
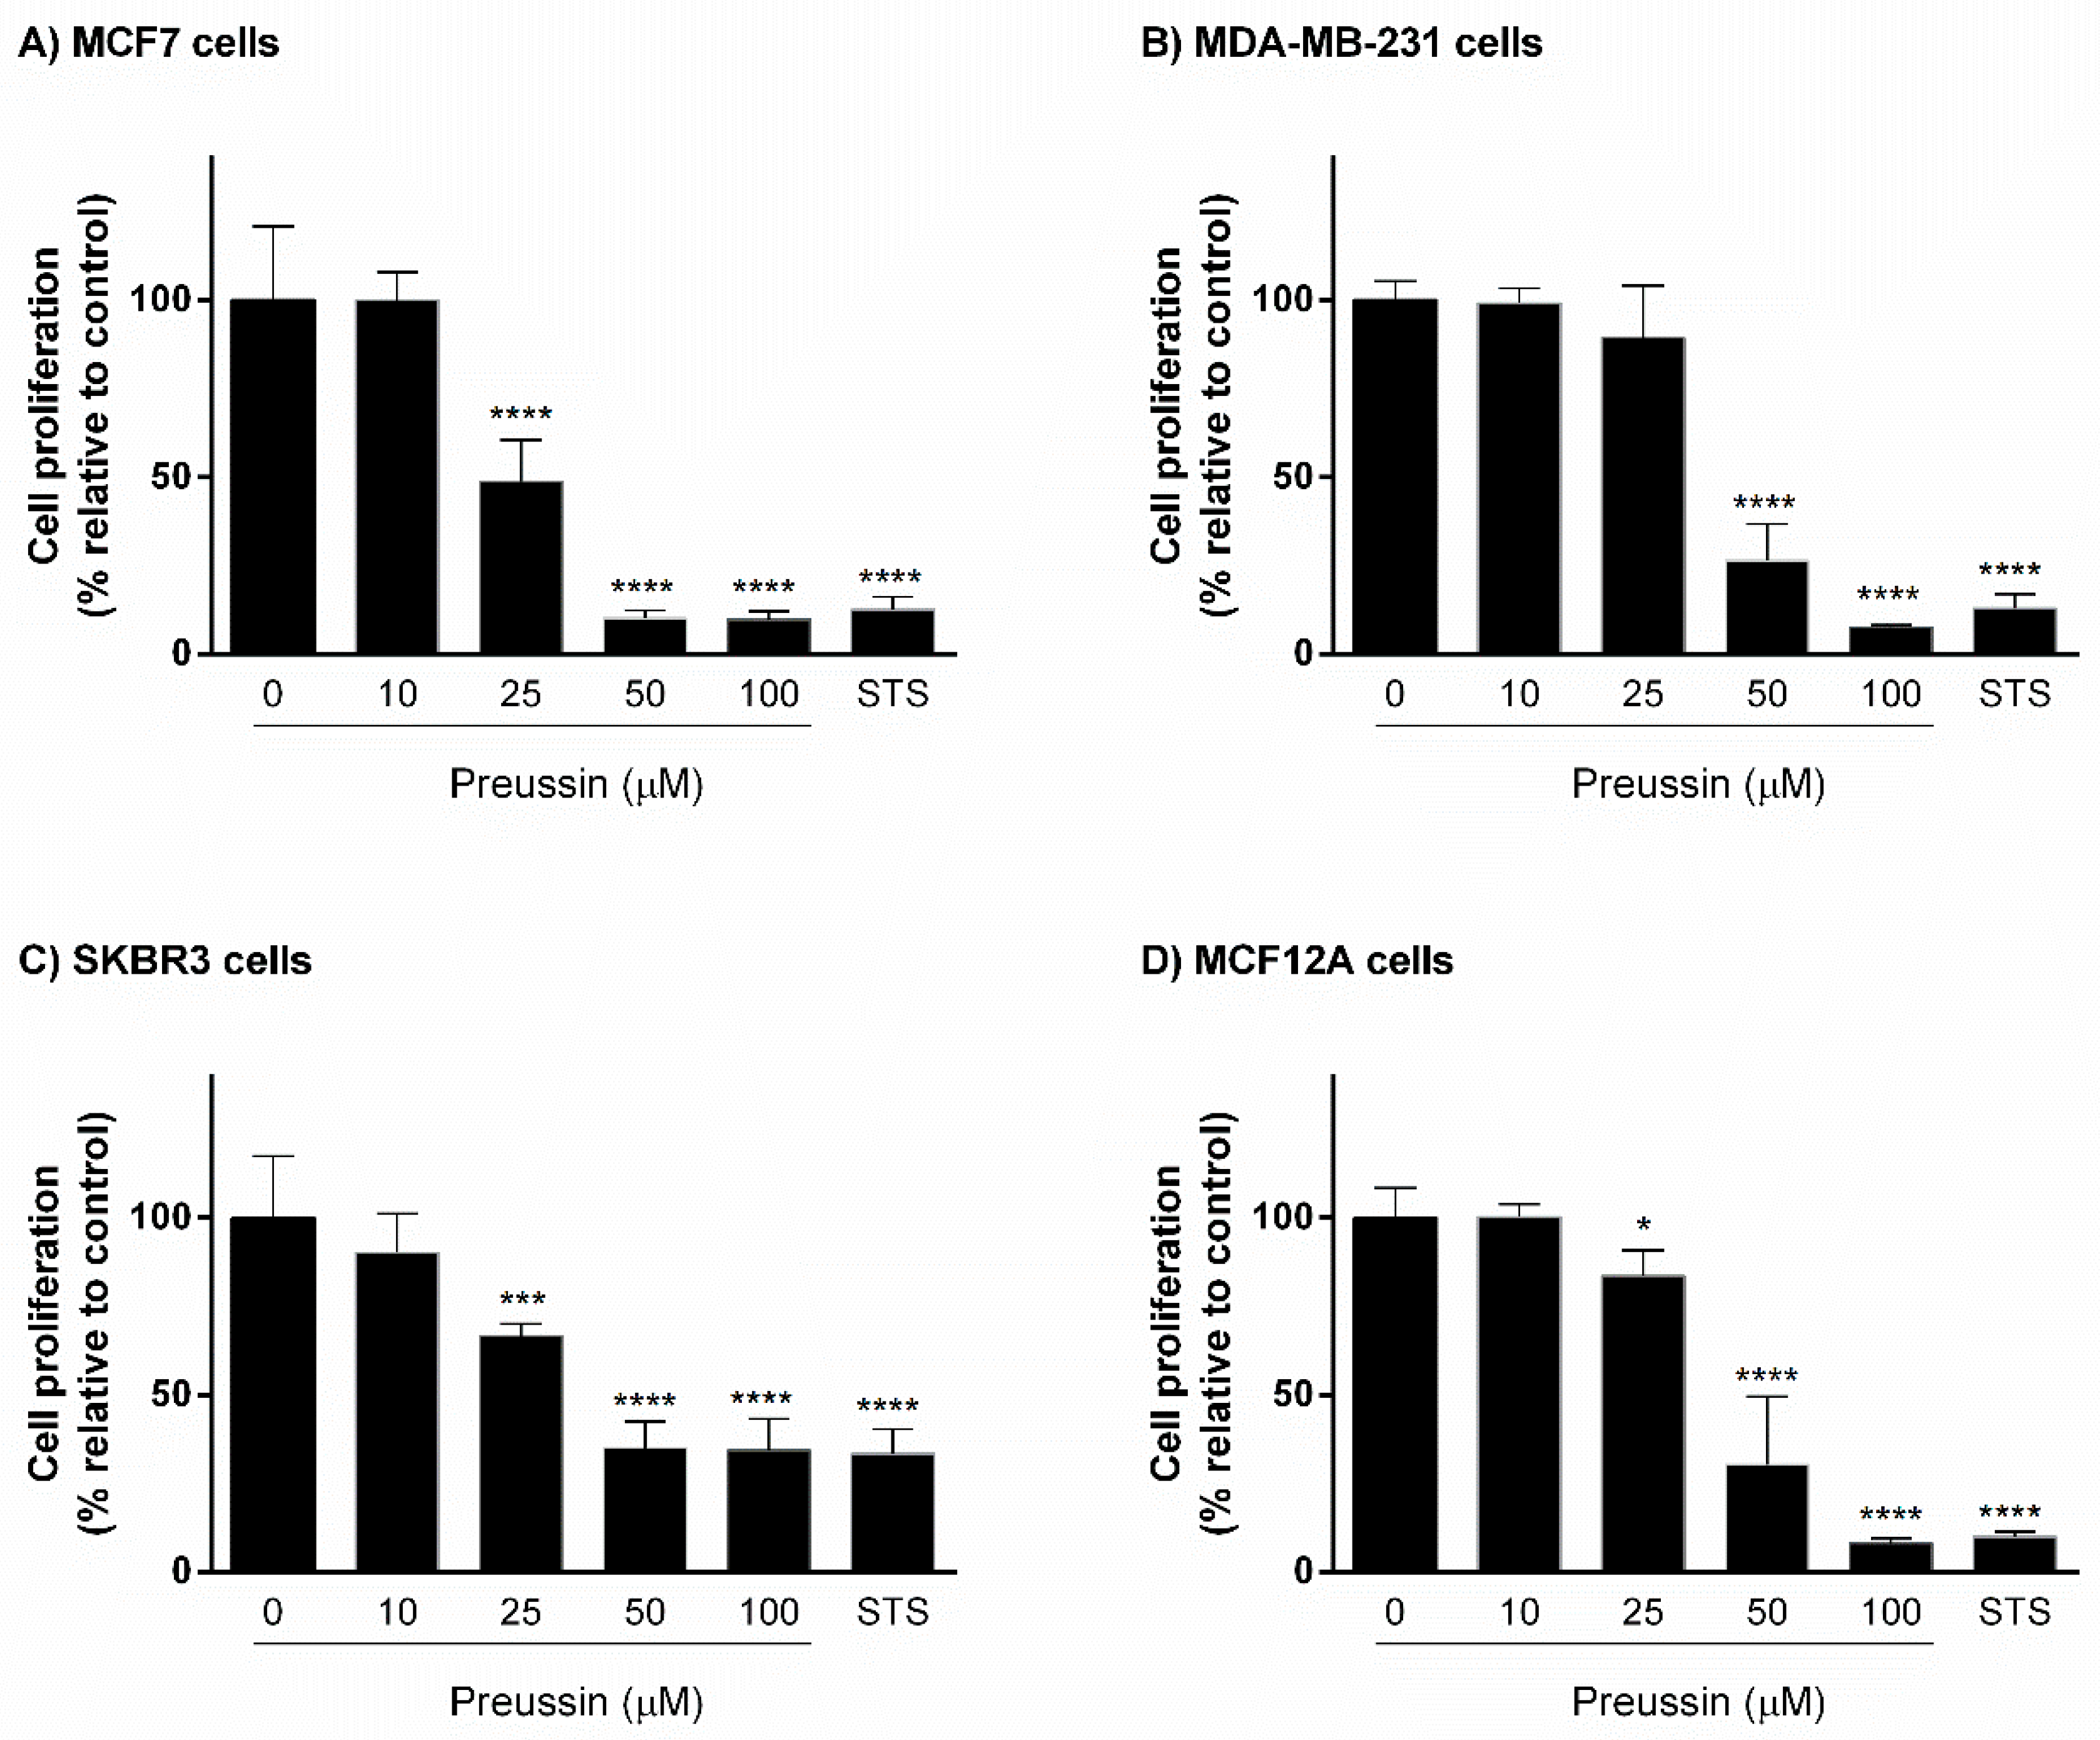
2.1.2. Analysis of Cell Proliferation—5-bromo-2′-deoxyuridine (BrdU) Assay
2.1.3. Cell Morphology
2.2. Cells Exposure in 3D
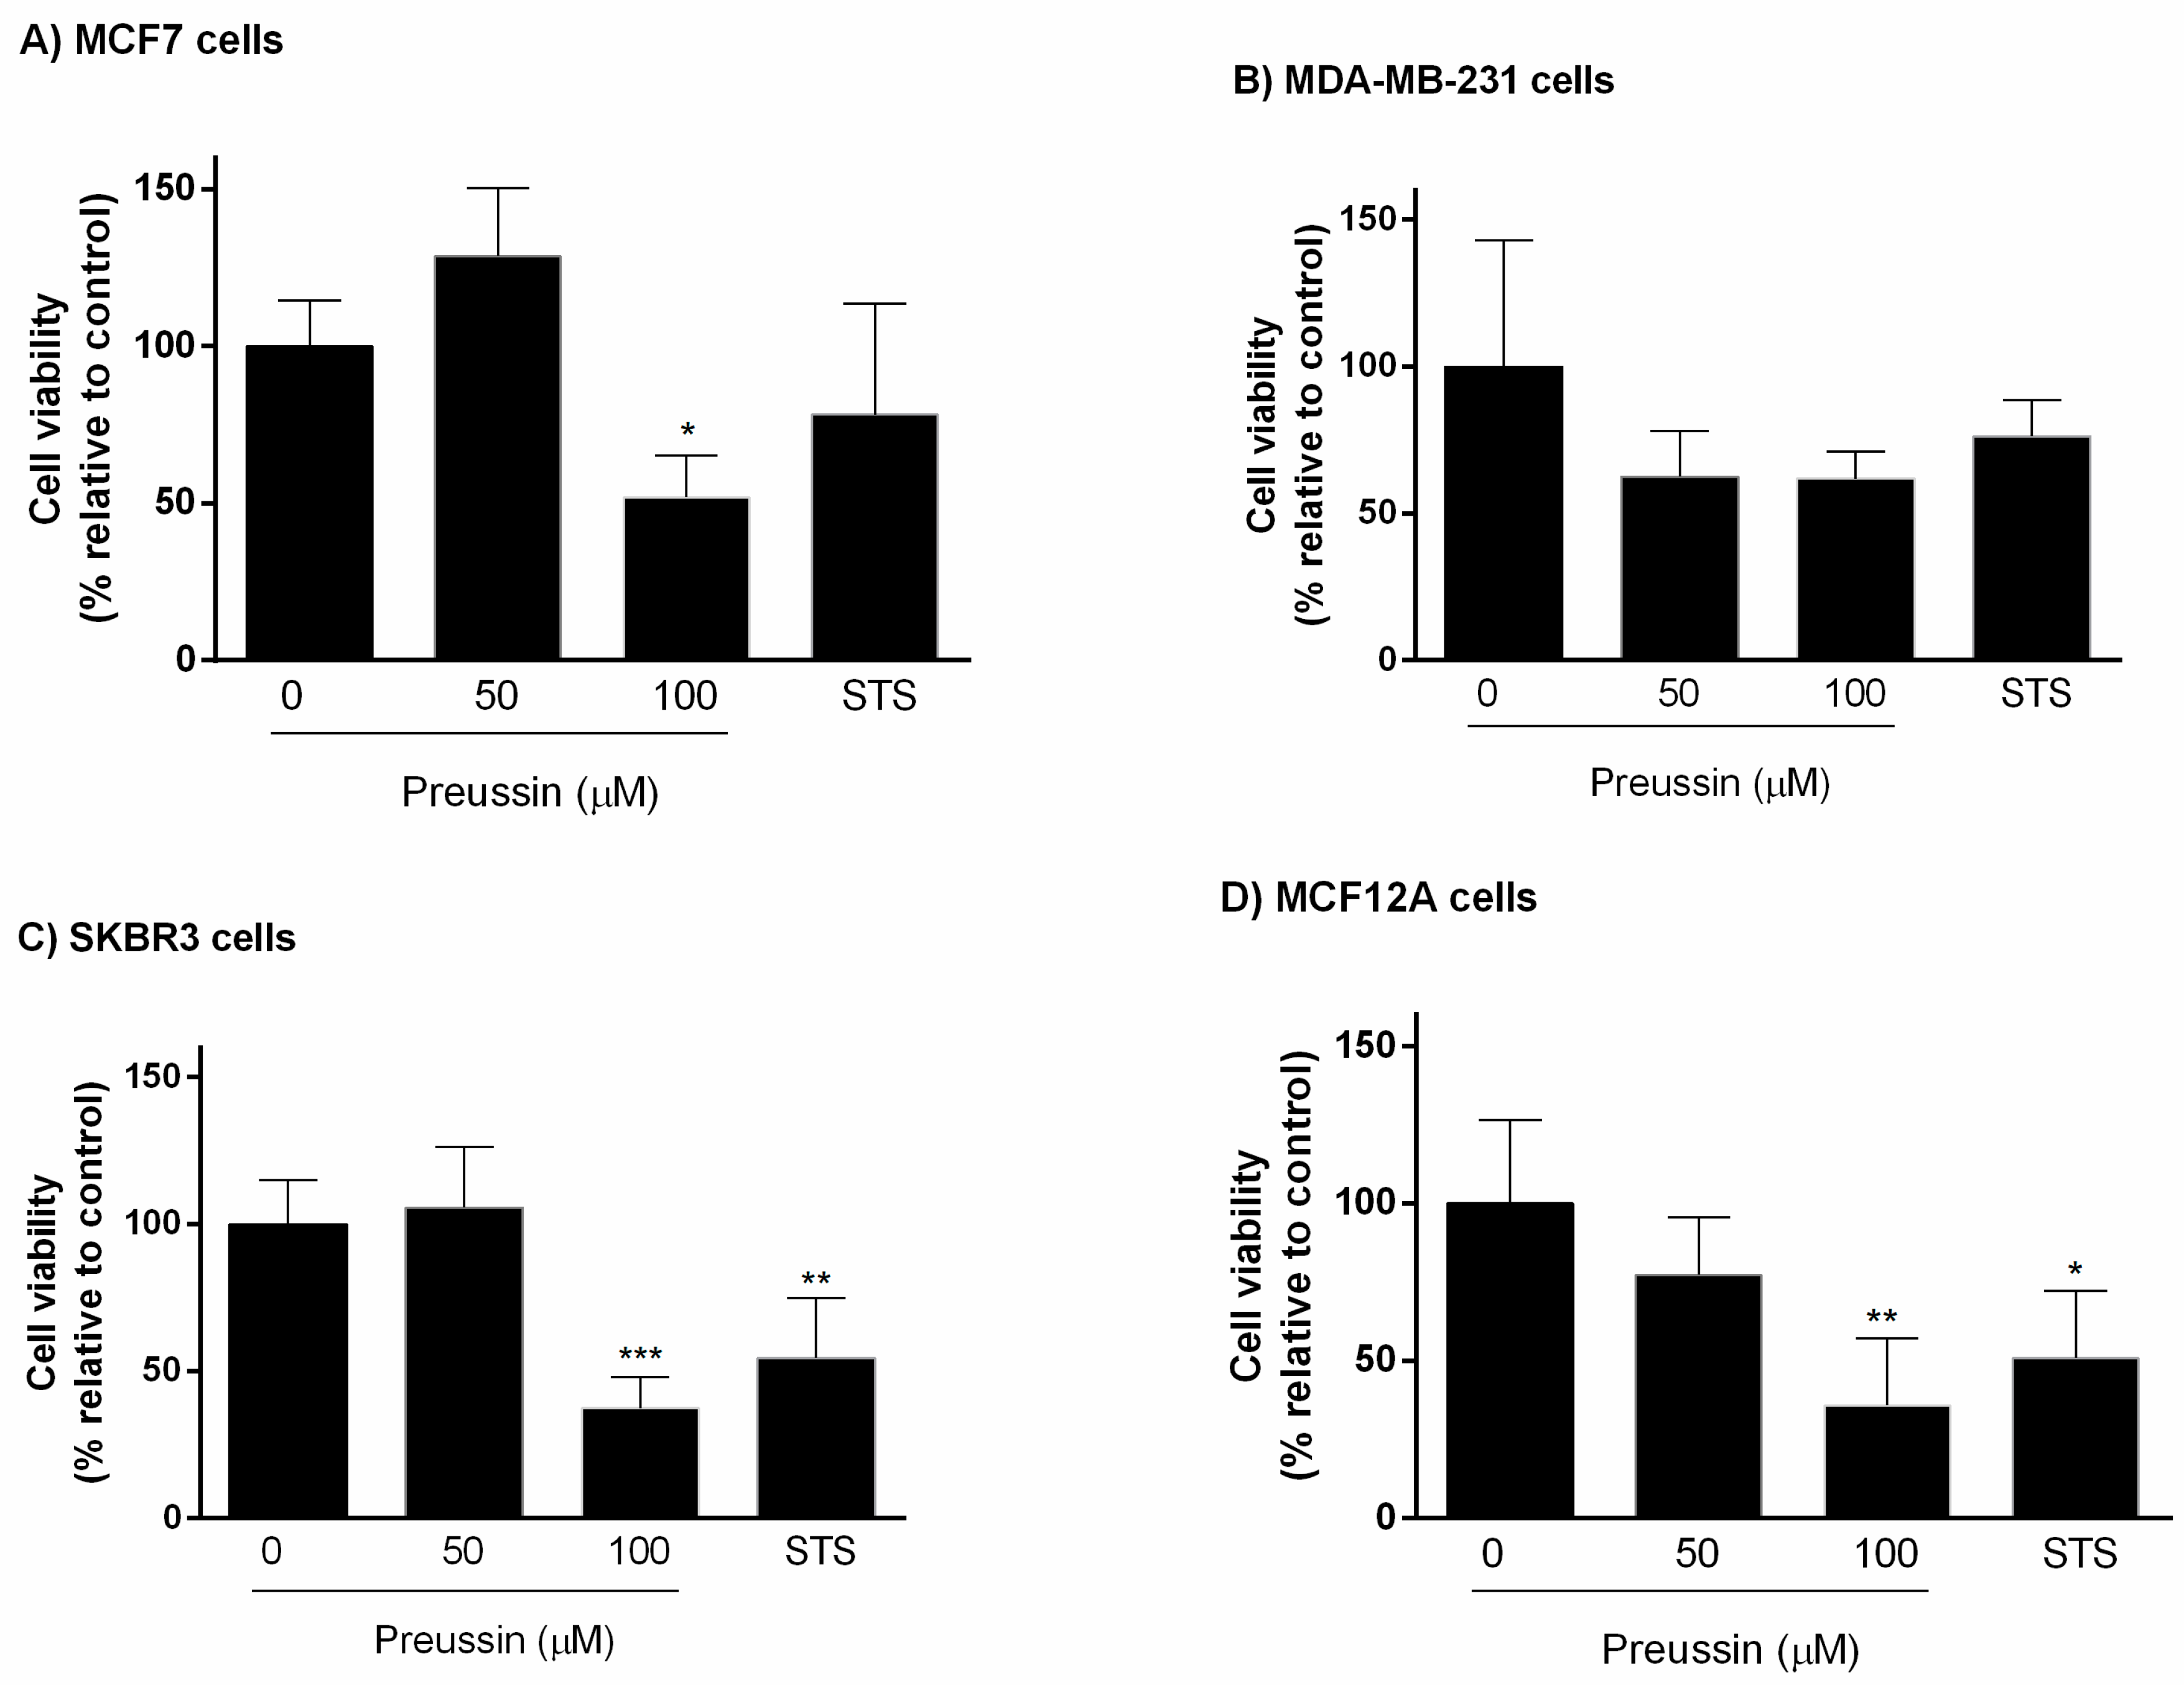
2.2.1. Analysis of Cell Viability
MTT Assay
Resazurin Assay
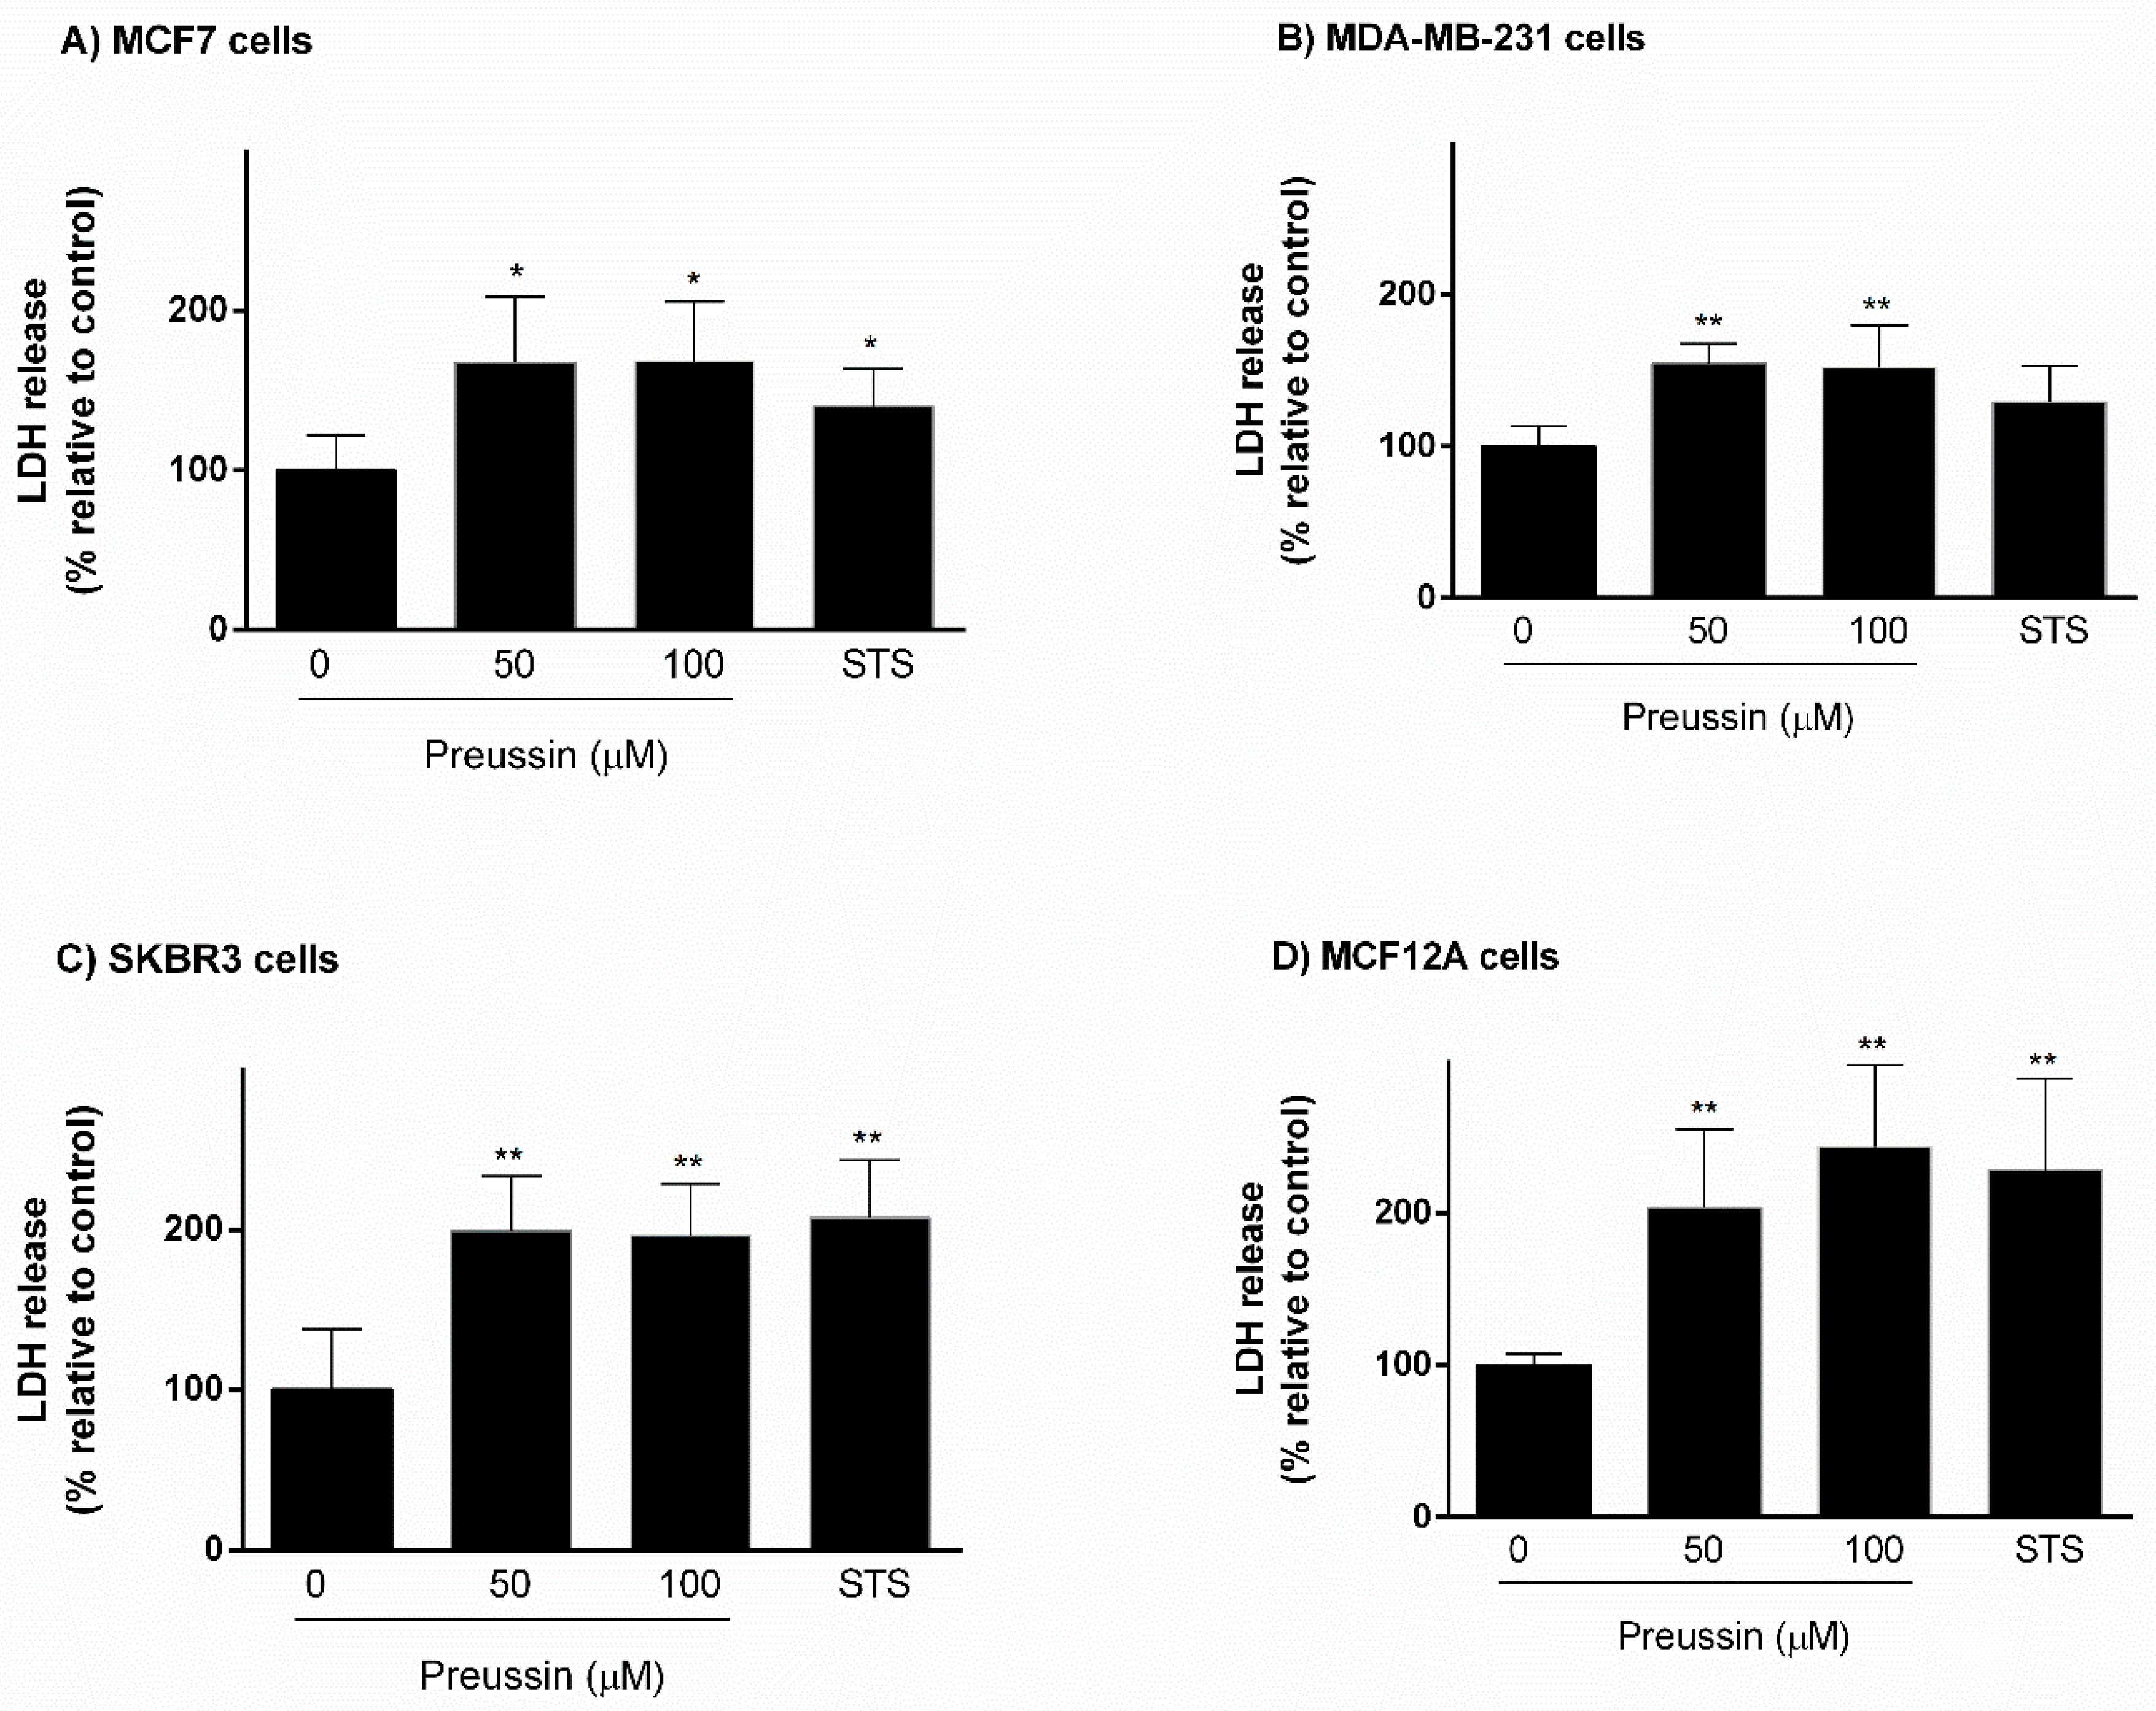
LDH
2.2.2. BrdU Proliferation Assay
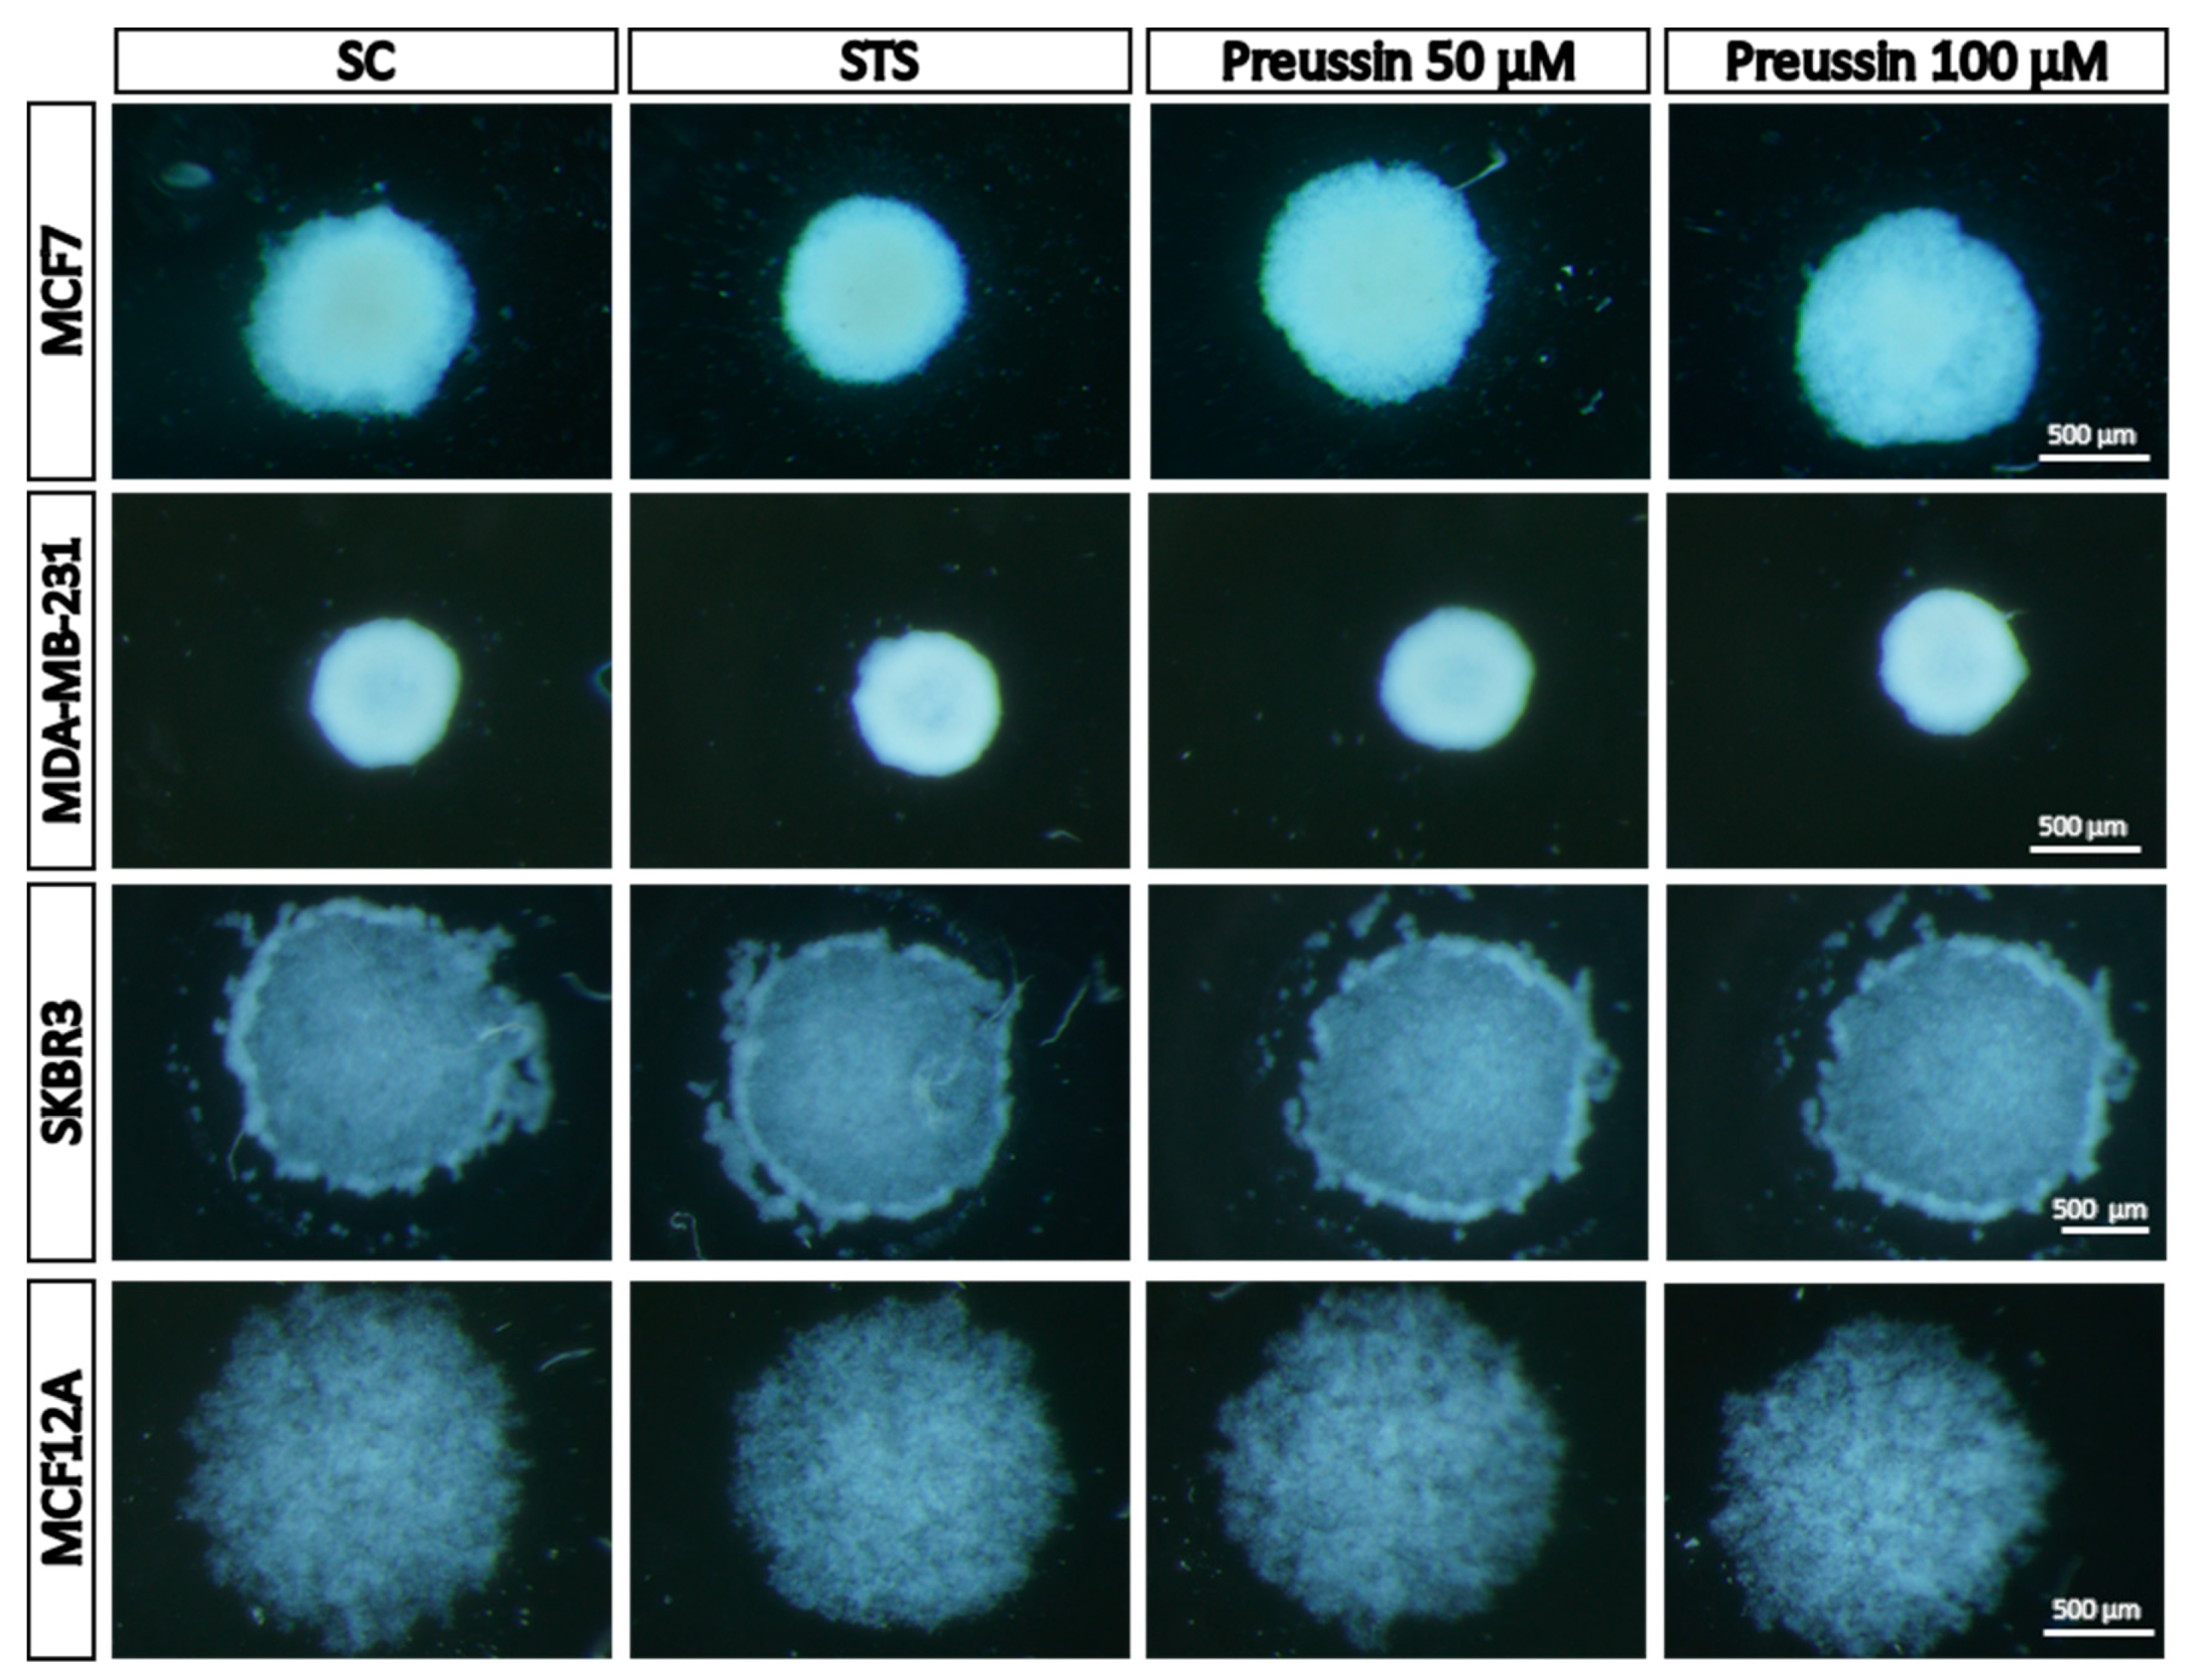
2.2.3. Analysis of Multicellular Aggregates (MCAs) Morphology in 3D Culture
Stereomicroscopy Analysis
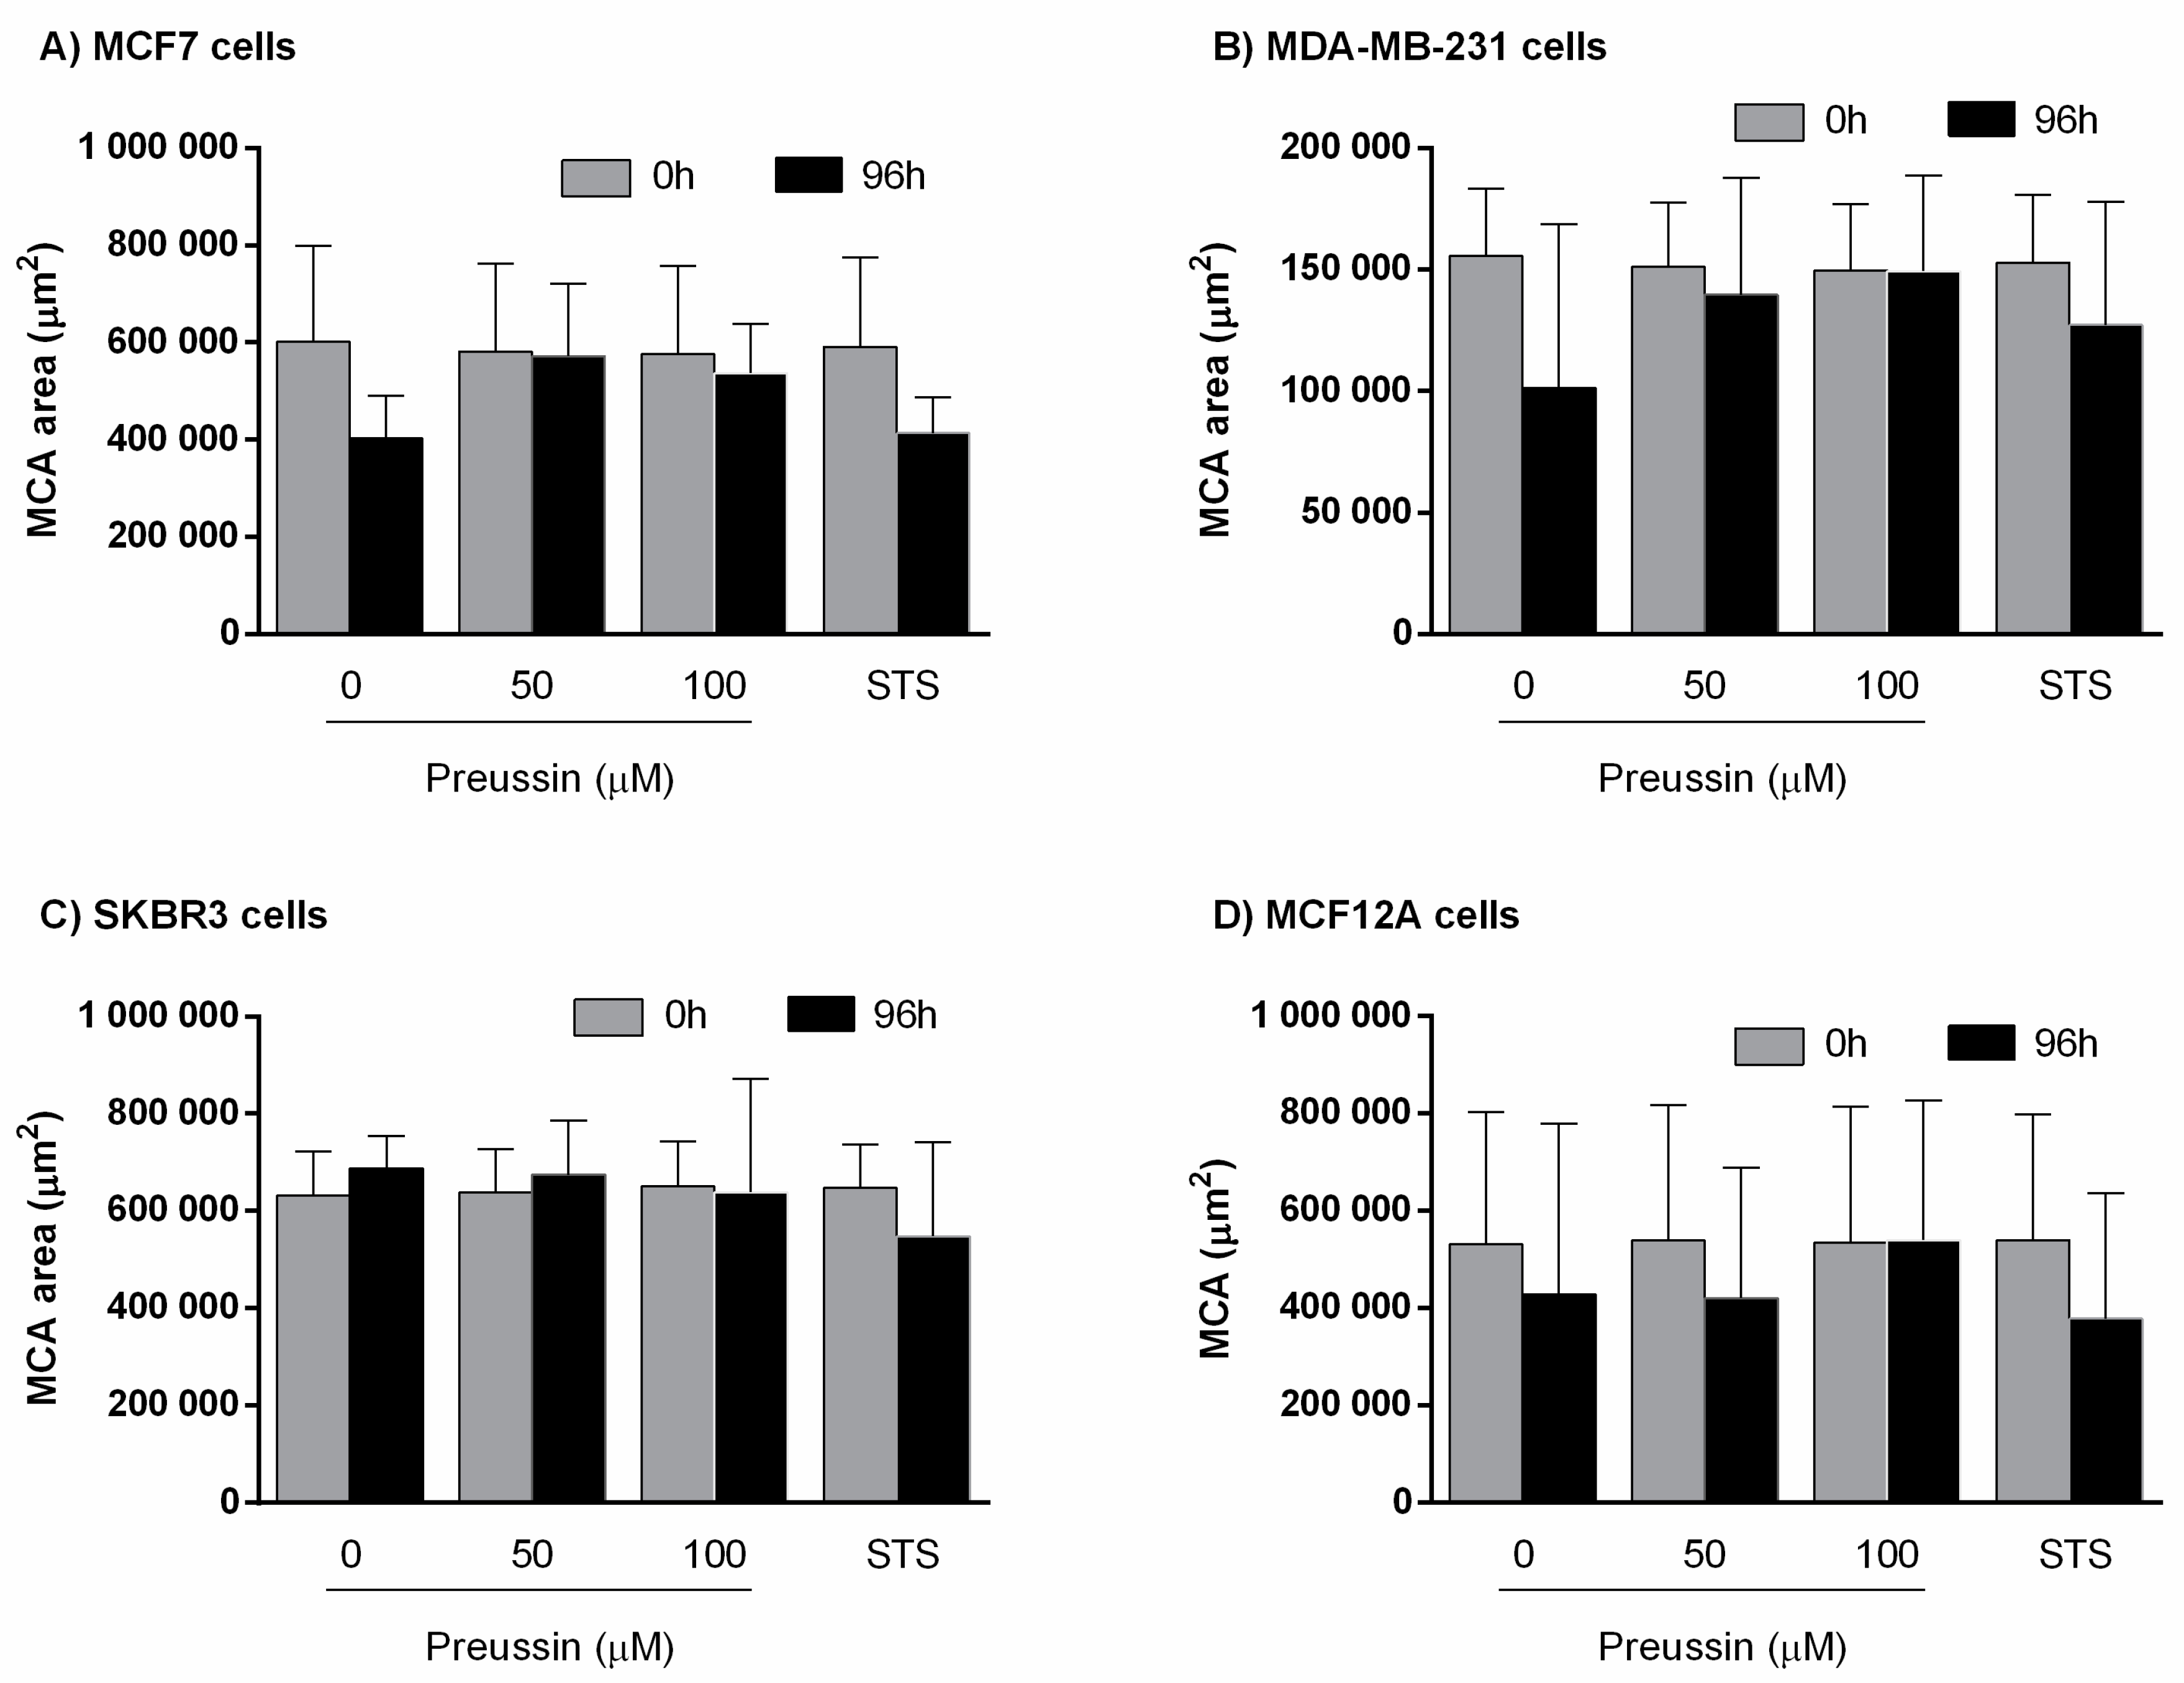
Multicellular Aggregate Measurements
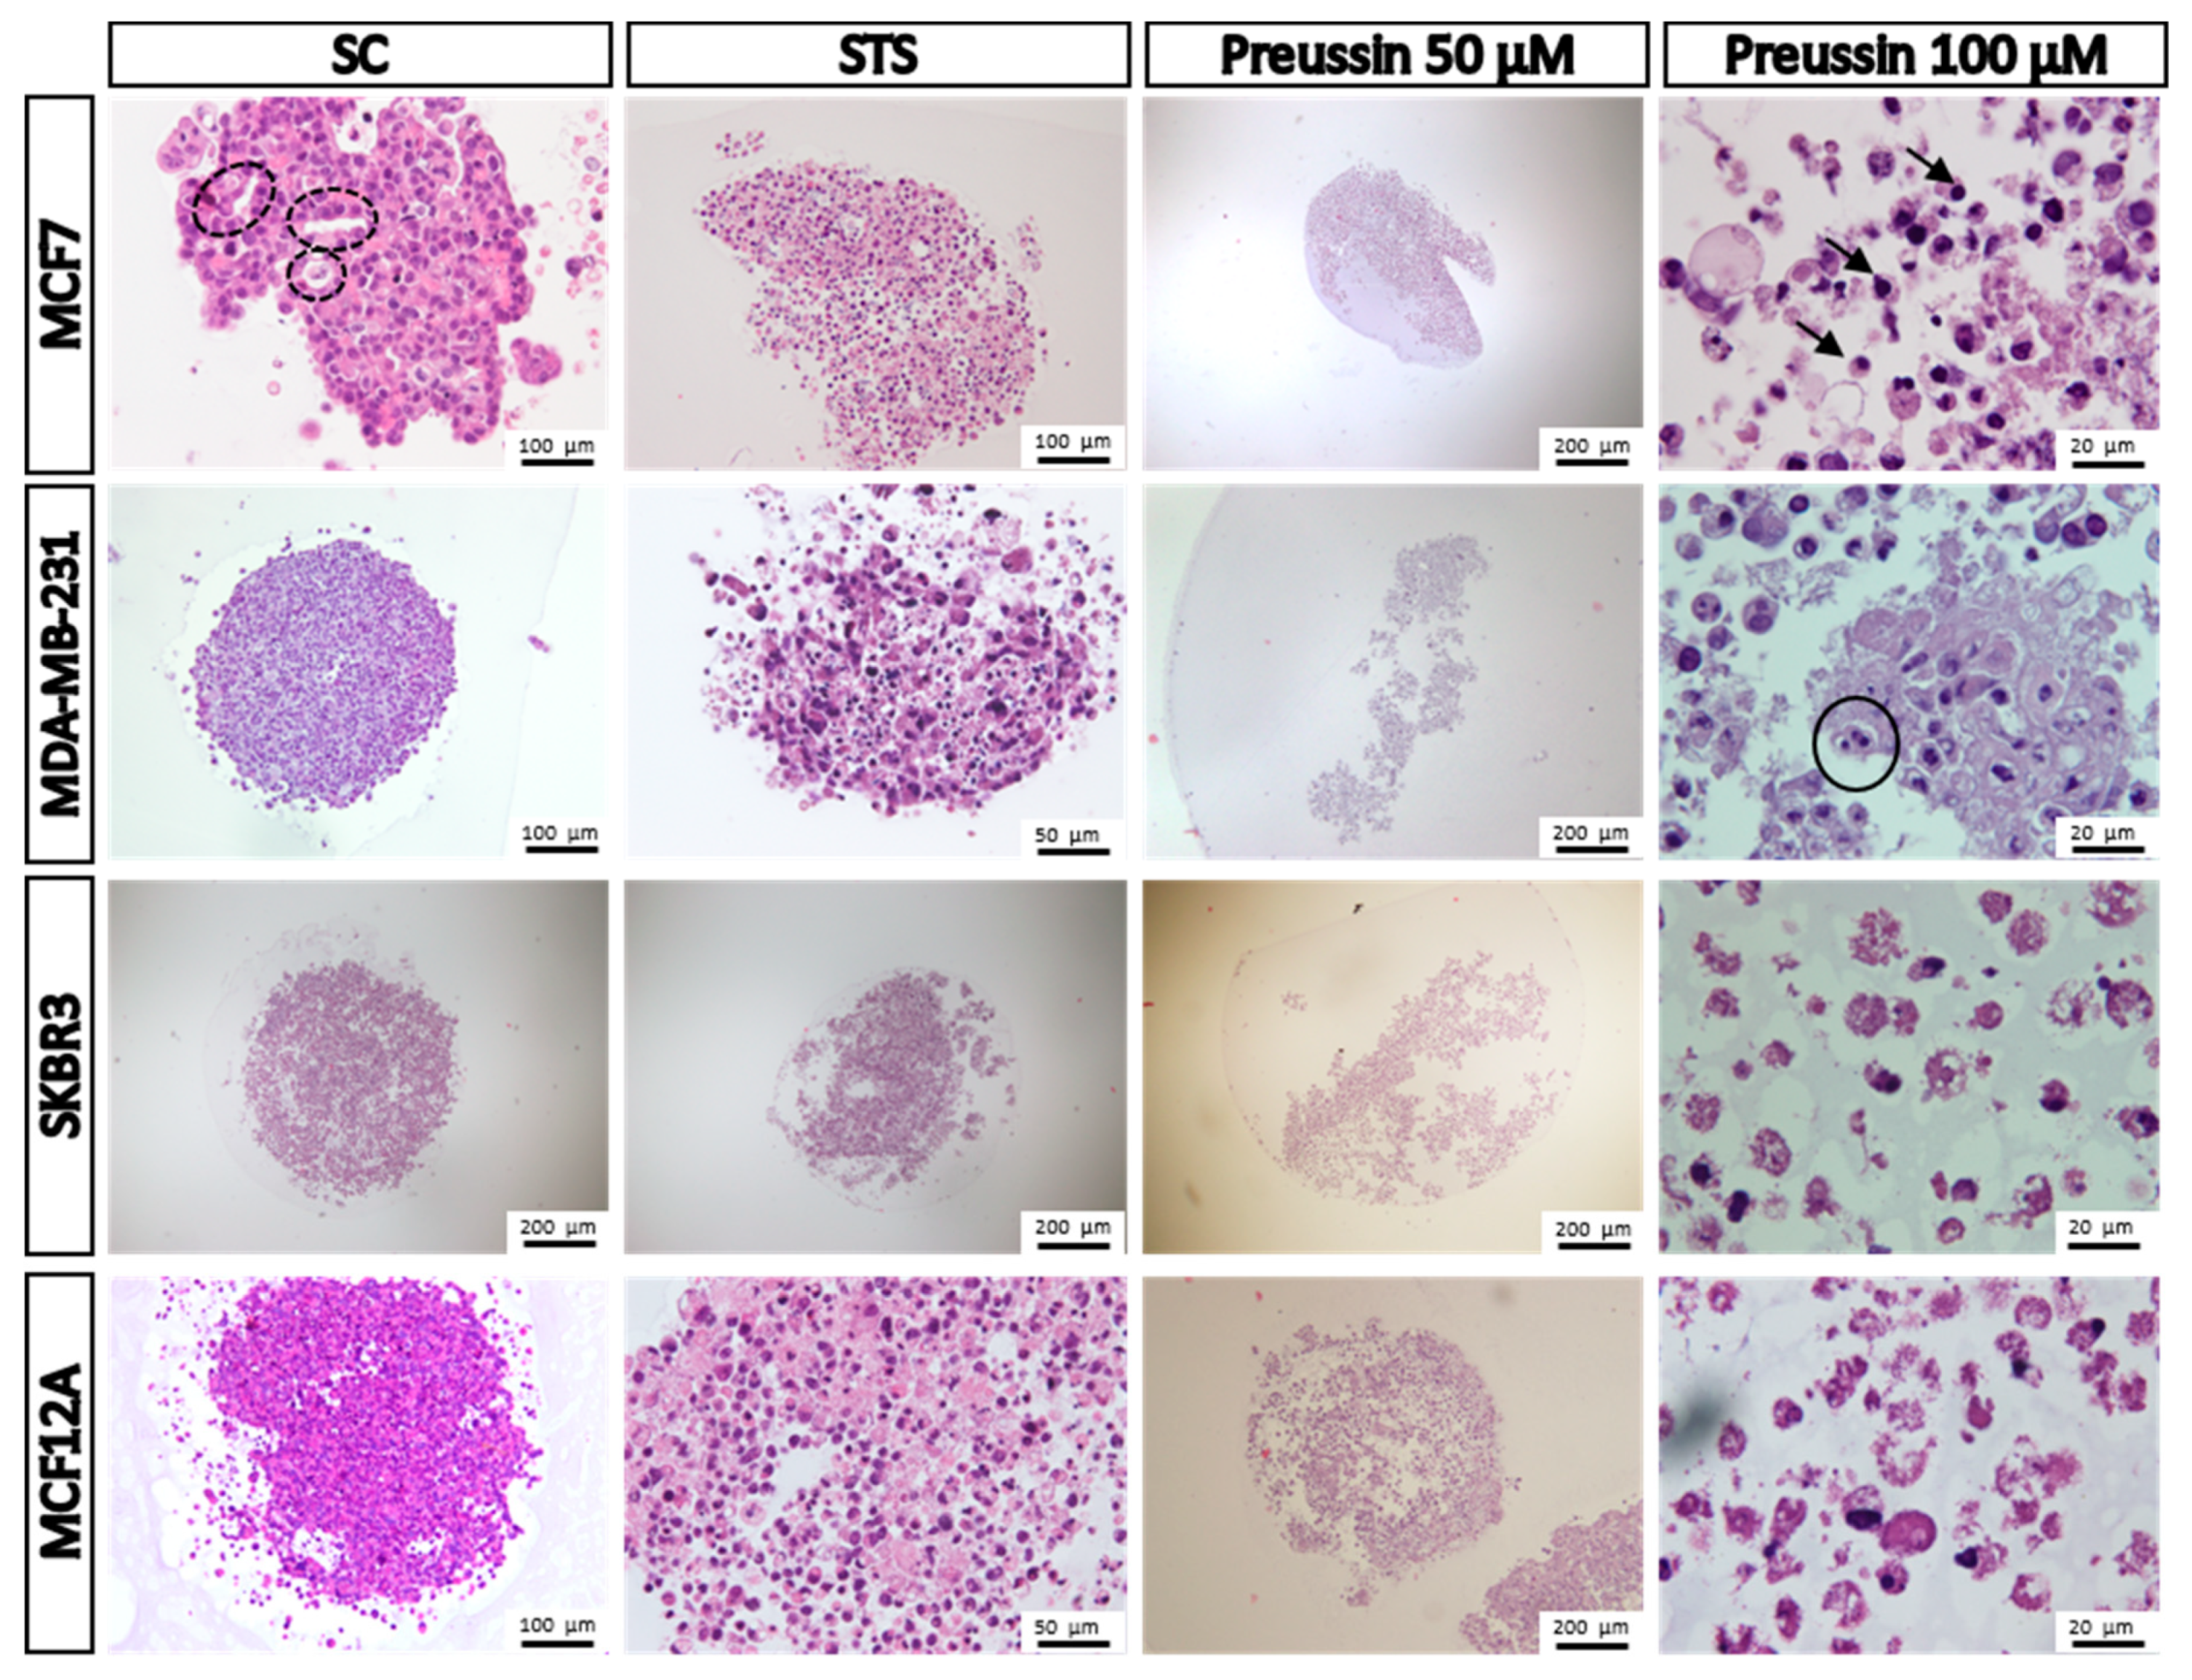
Morphology
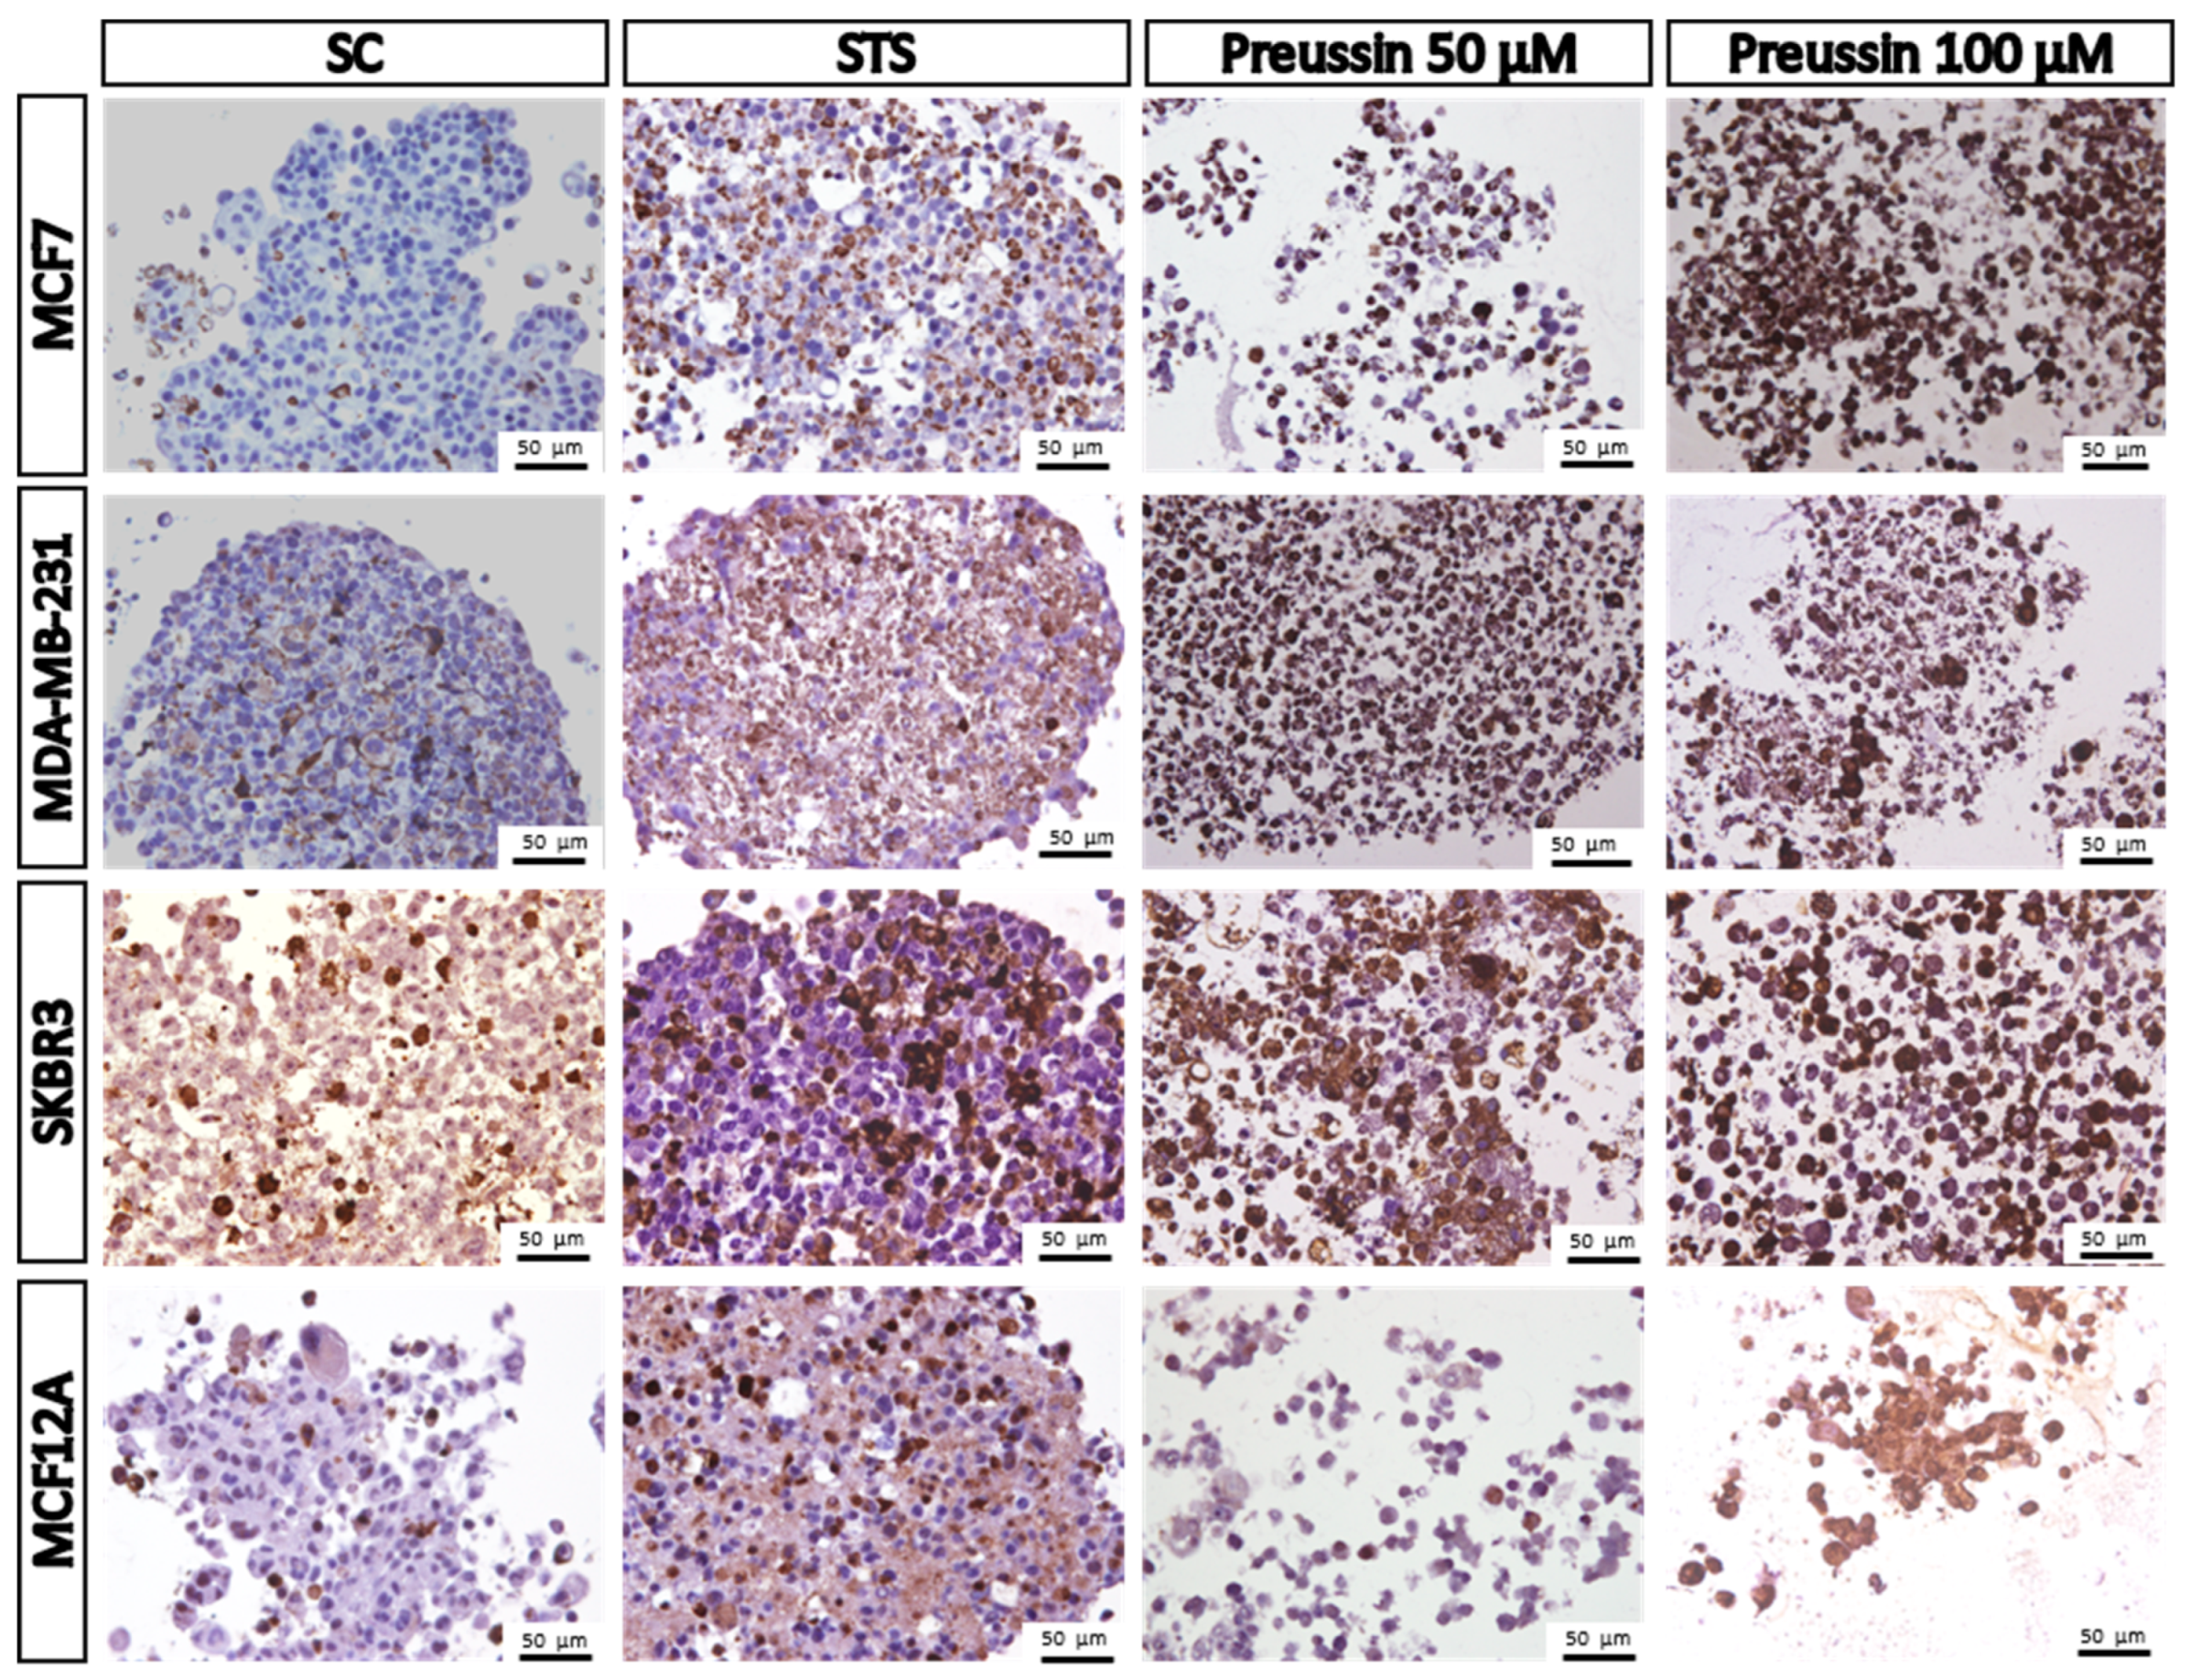
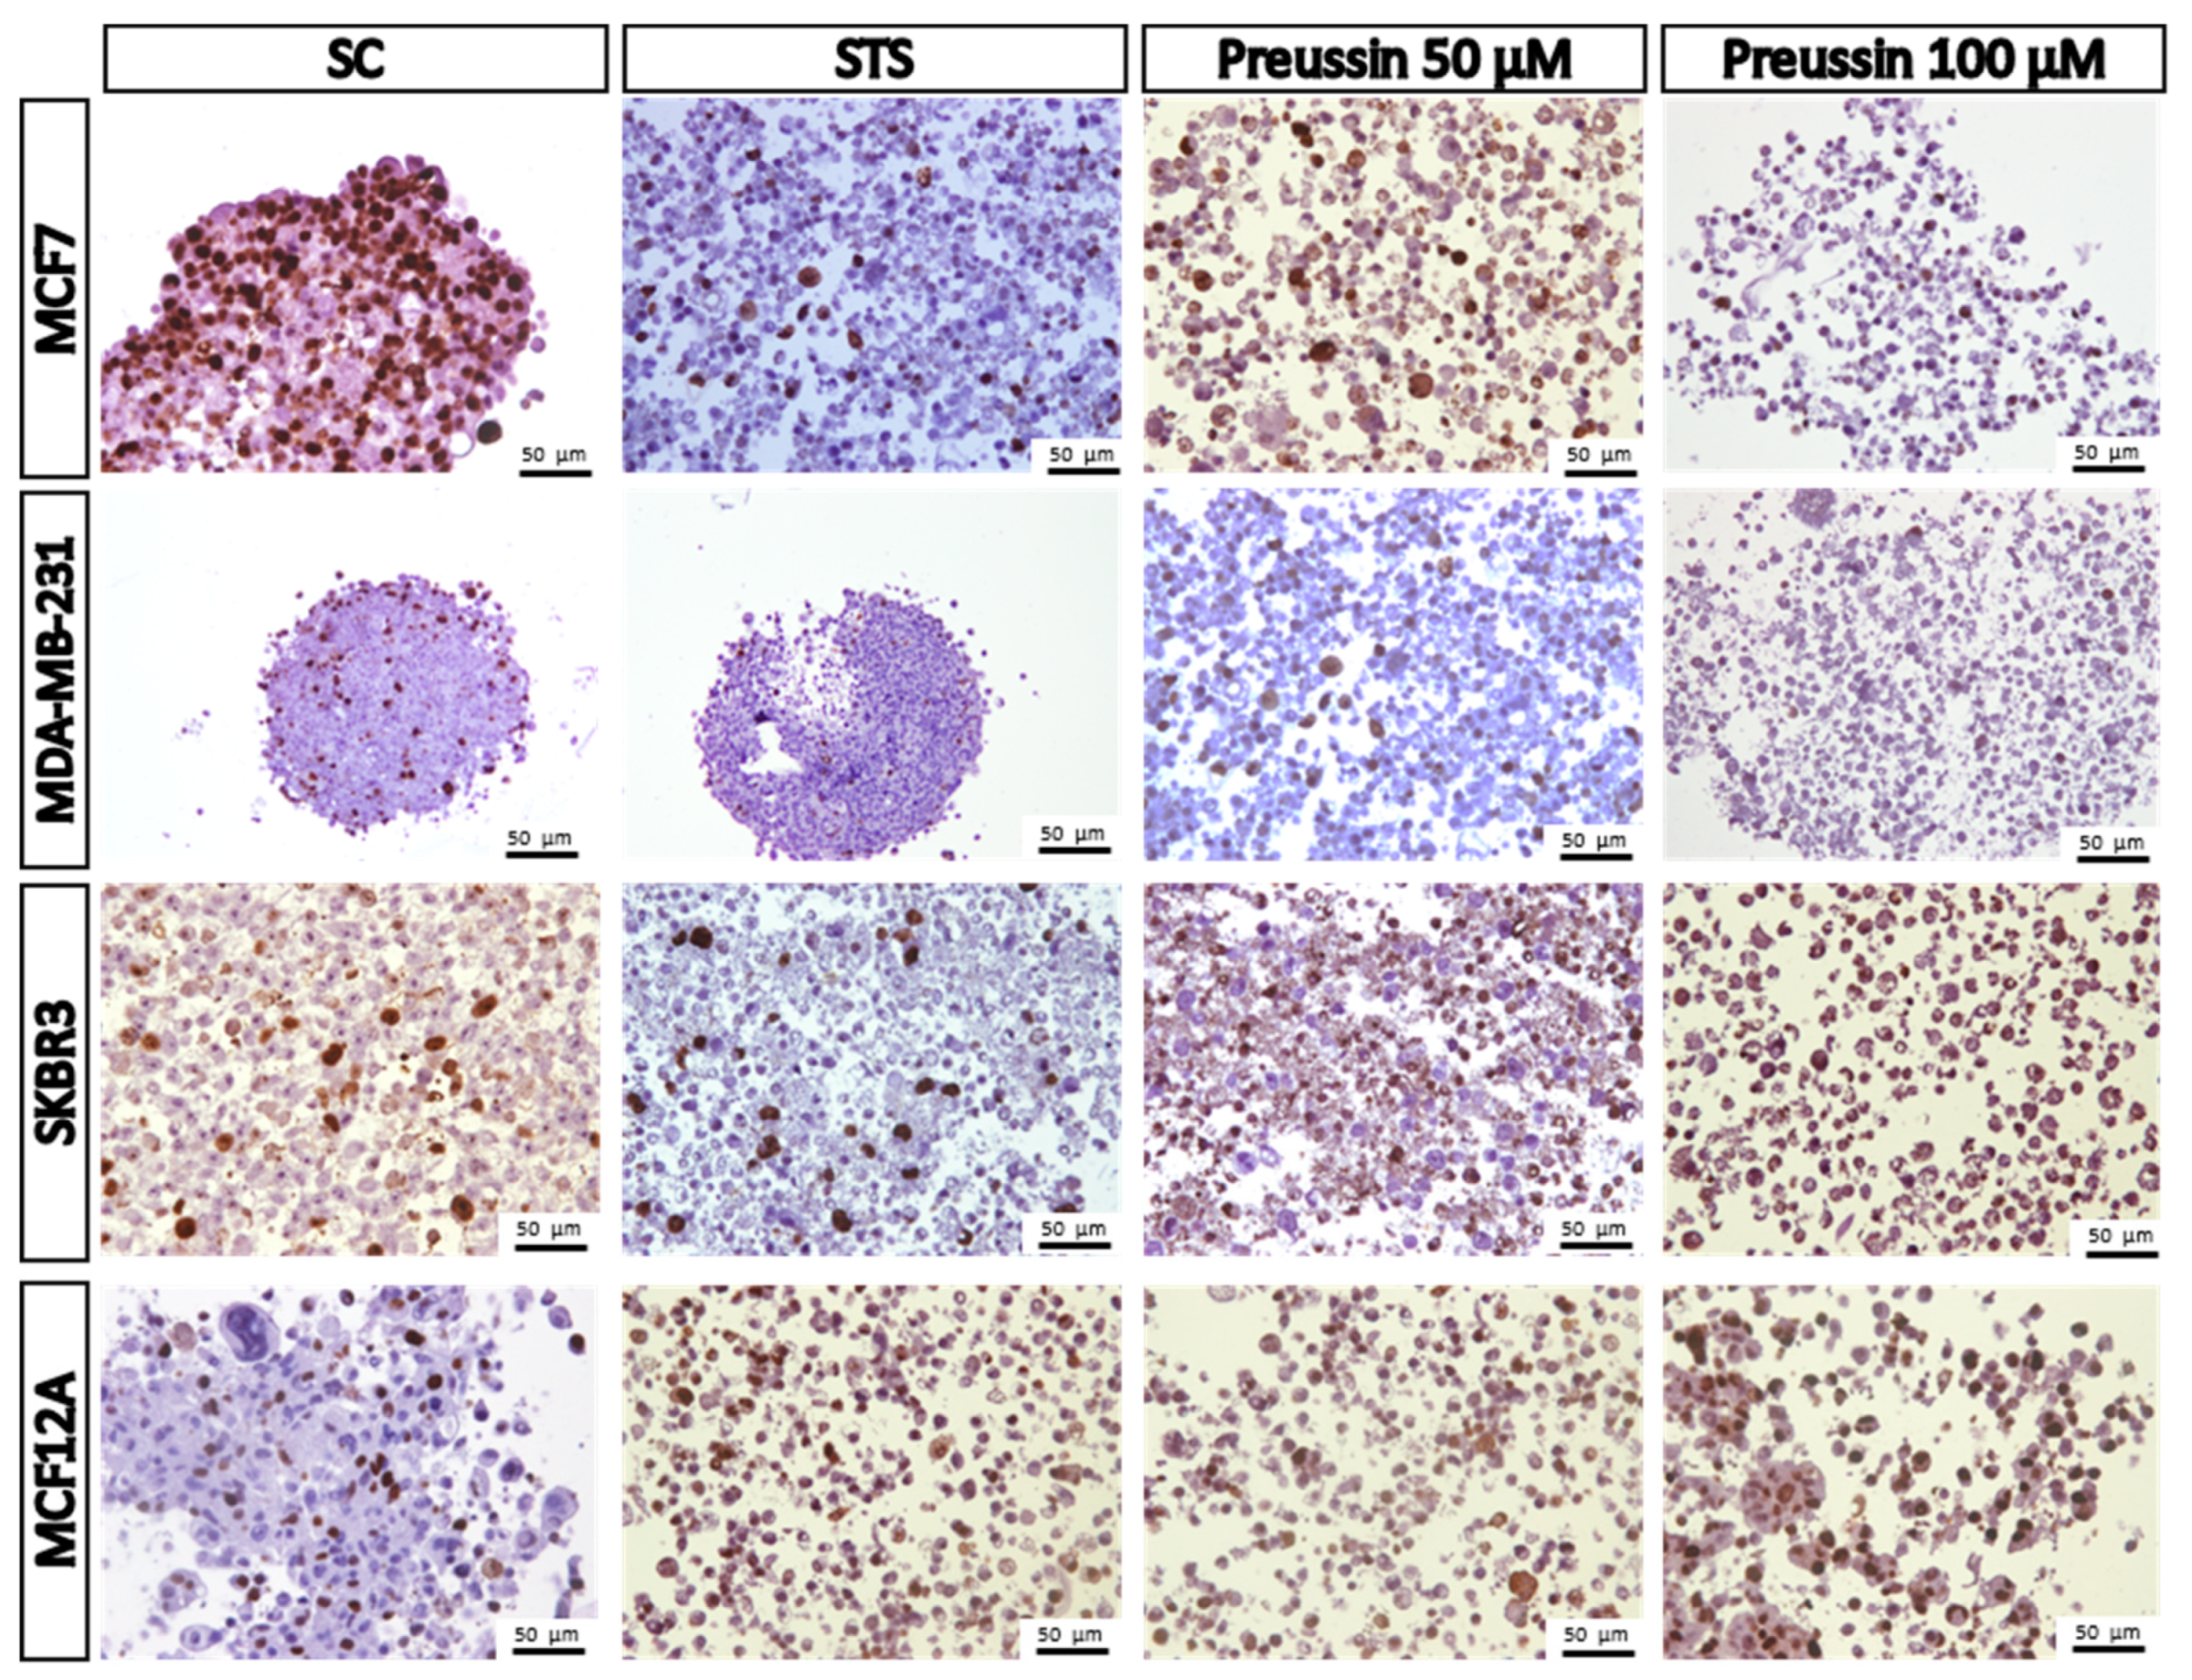
MCA Immunocytochemical Analysis
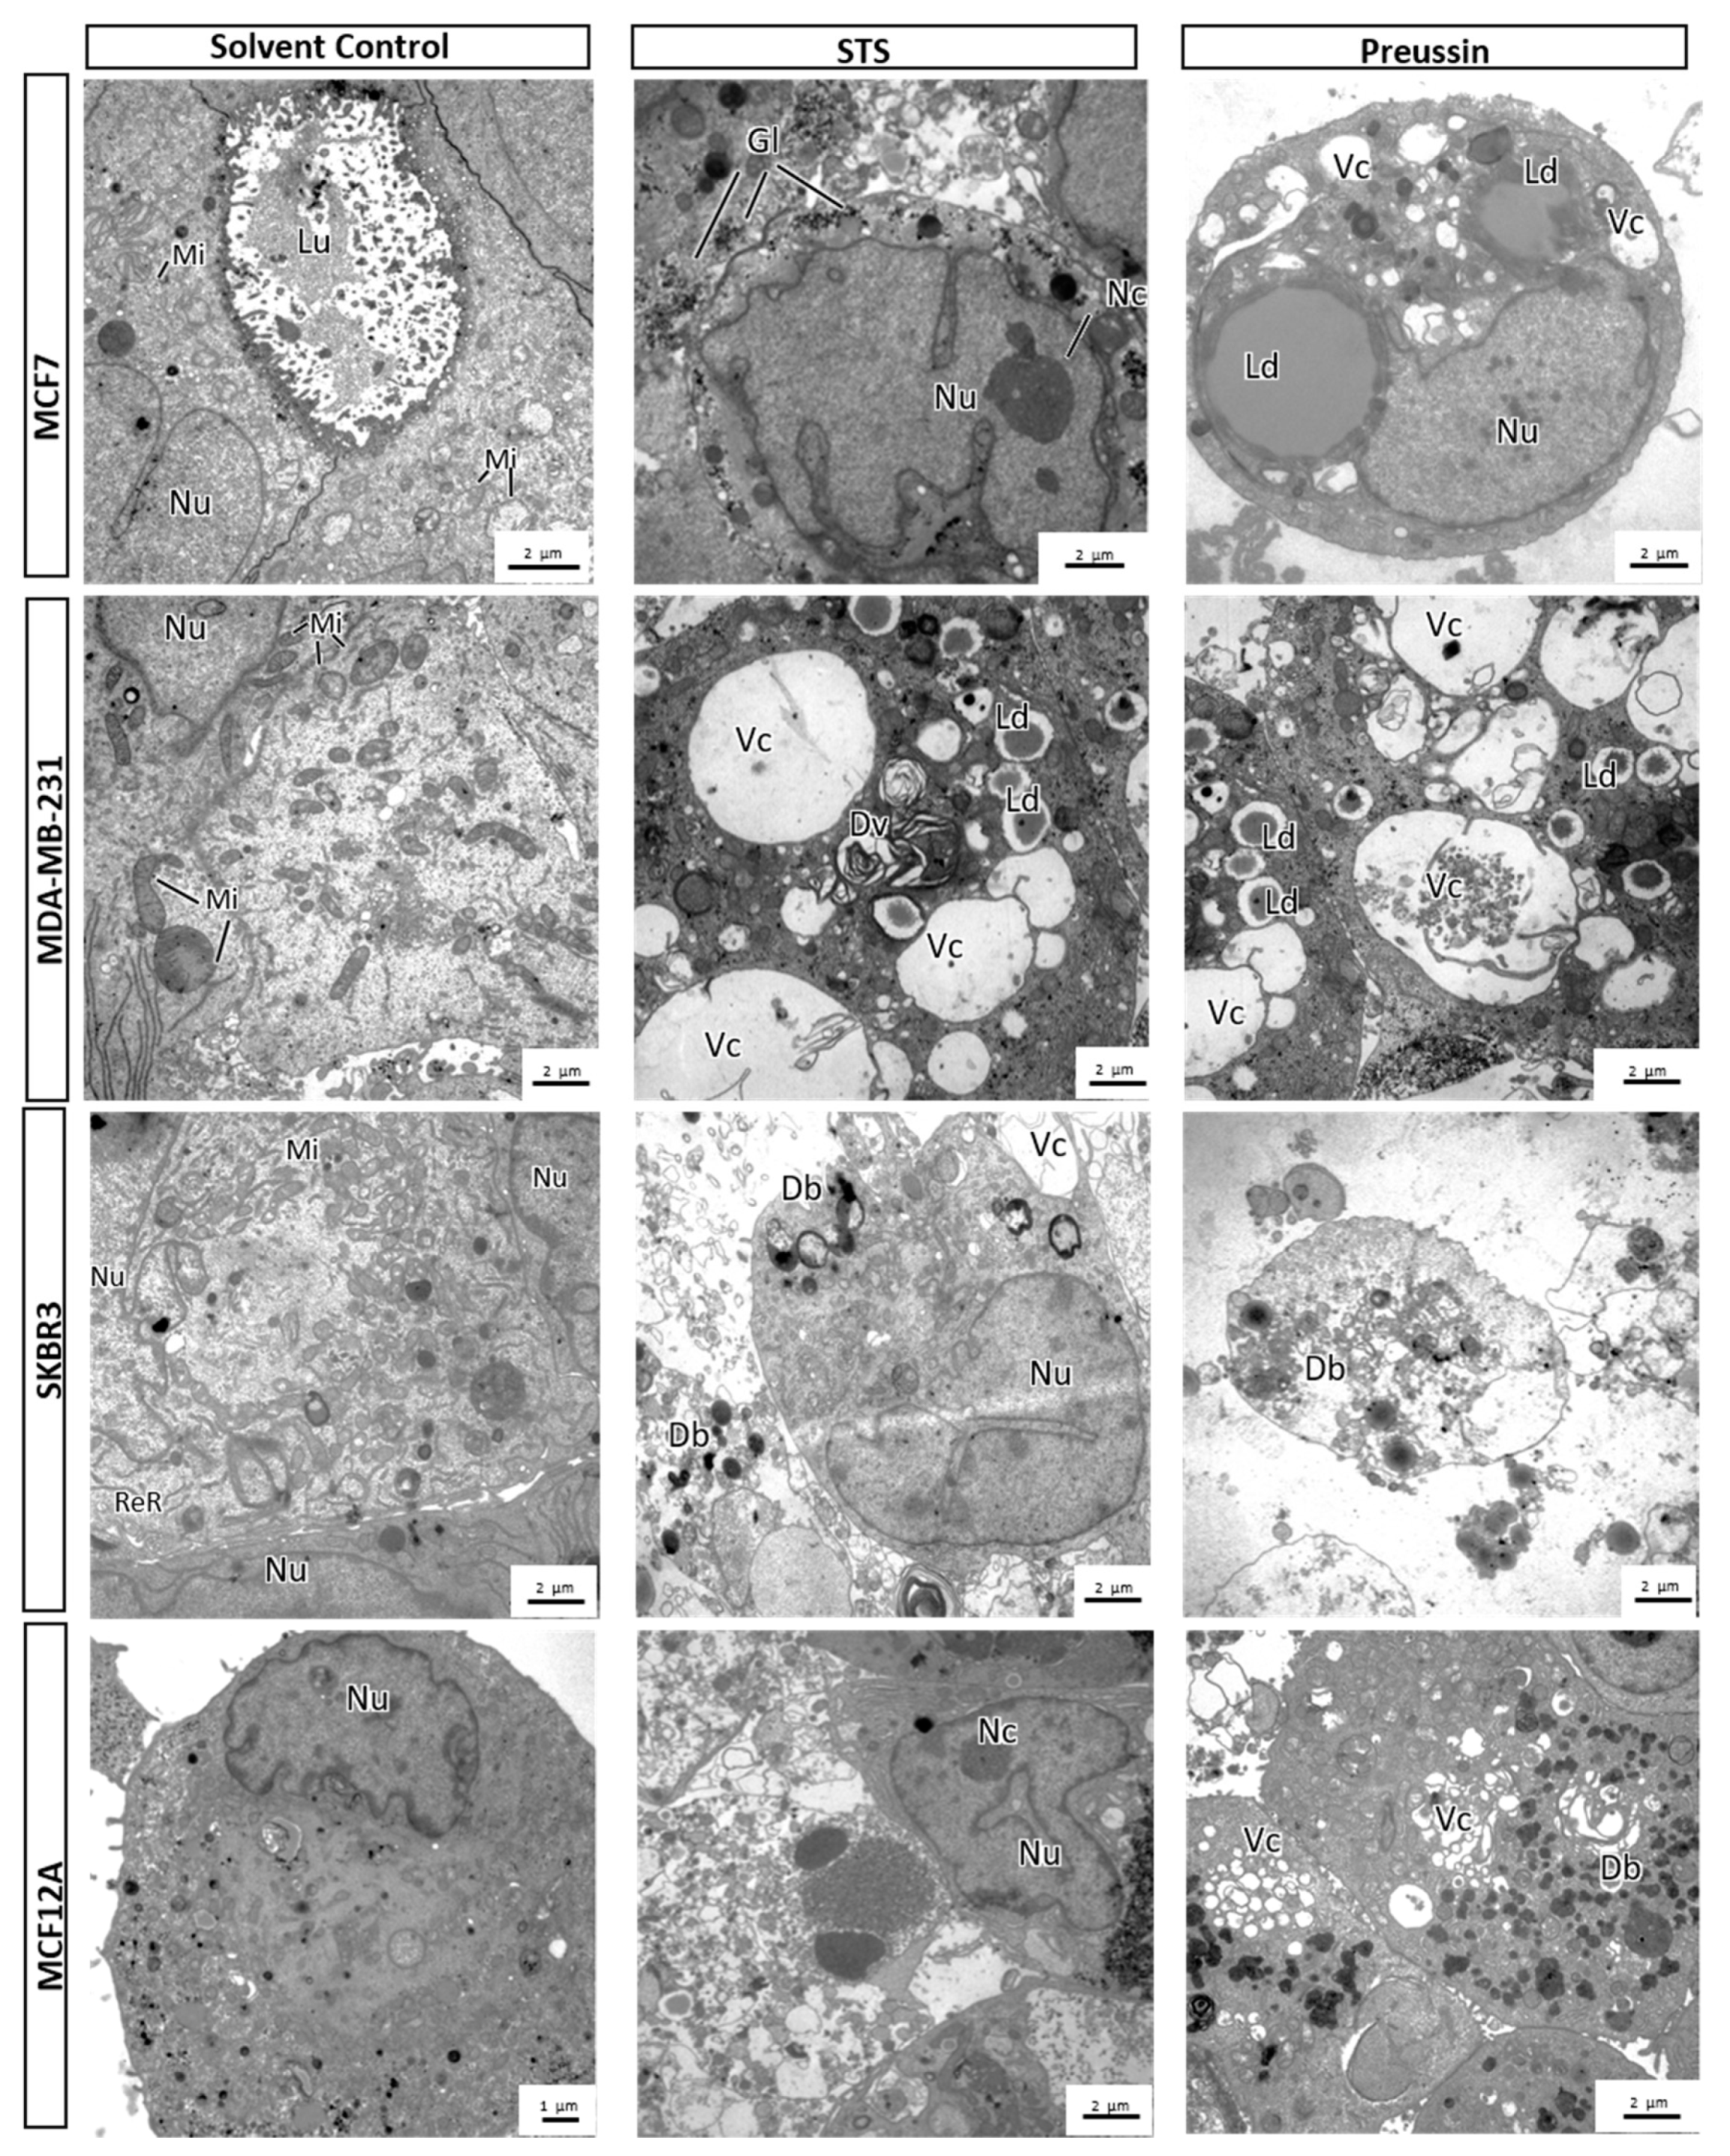
MCA Electron Microscopy
3. Discussion
4. Materials and Methods
4.1. Cell Lines Cultivation
4.2. Chemicals and Cell Culture Reagents
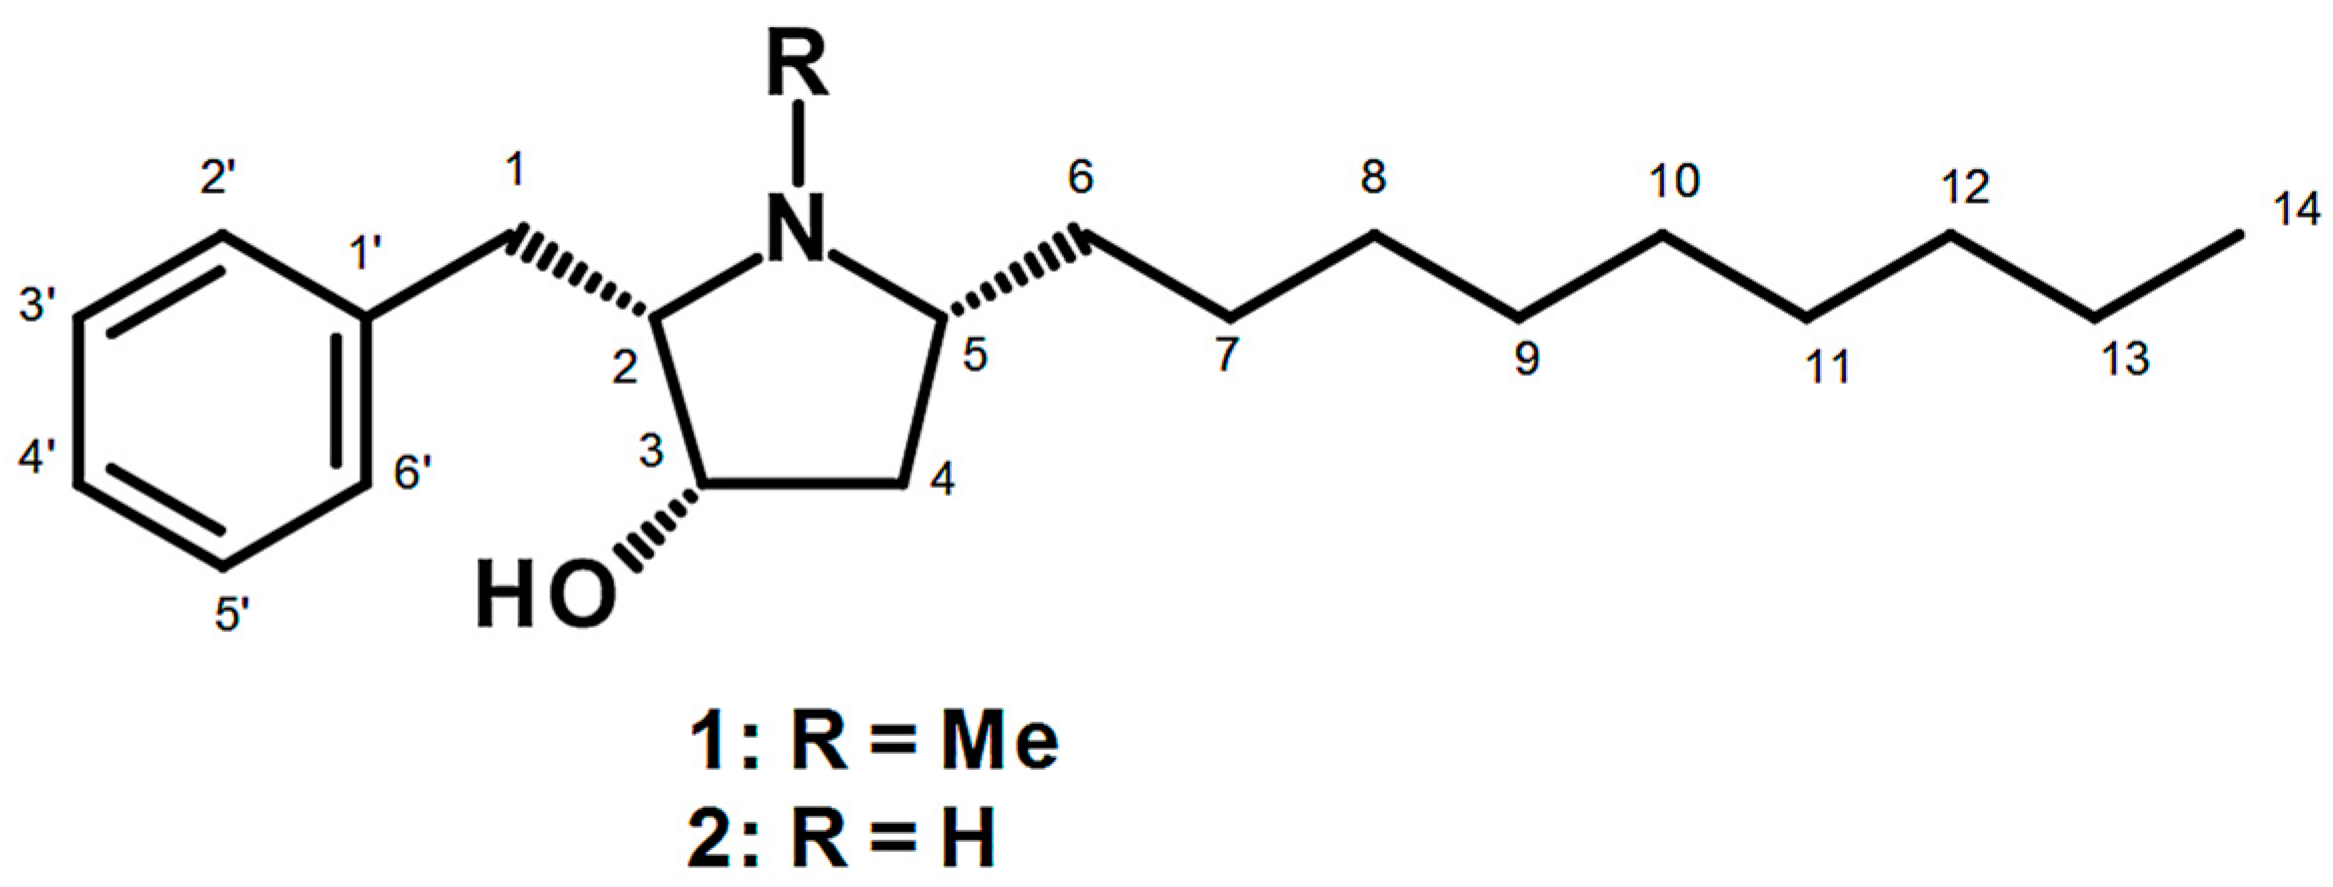
4.3. Preussin (1)
4.4. Cell Exposures
4.4.1. Exposure in 2D Culture
4.4.2. Exposure in 3D Culture
4.5. Analysis of Cell Viability
4.5.1. 2D Culture
MTT Assay
4.5.2. 3D Culture
MTT Assay
Resazurin Reduction Assay
Lactate Dehydrogenase (LDH) Assay
4.6. Analysis of Cell Proliferation
4.6.1. 2D Culture
BrdU Assay
4.6.2. 3D Culture
4.7. Analysis of Cell Morphology in 3D Culture
4.7.1. MCA Measurements
4.7.2. Histological Analysis
4.7.3. Electron Microscopy
4.8. Immunocytochemistry in 3D Culture
4.9. Statistical Analysis
5. Conclusions
Supplementary Materials
Author Contributions
Funding
Acknowledgments
Conflicts of Interest
References
- Bray, F.; Ferlay, J.; Soerjomataram, I.; Siegel, R.L.; Torre, L.A.; Jemal, A. Global cancer statistics 2018: GLOBOCAN estimates of incidence and mortality worldwide for 36 cancers in 185 countries. CA Cancer J. Clin. 2018, 68, 394–424. [Google Scholar] [CrossRef] [PubMed] [Green Version]
- Ferlay, J.; Colombet, M.; Soerjomataram, I.; Dyba, T.; Randi, G.; Bettio, M.; Gavin, A.; Visser, O.; Bray, F. Cancer incidence and mortality patterns in Europe: Estimates for 40 countries and 25 major cancers in 2018. Eur. J. Cancer 2018, 103, 356–387. [Google Scholar] [CrossRef] [PubMed]
- Magalhaes, L.G.; Ferreira, L.L.G.; Andricopulo, A.D. Recent advances and perspectives in cancer drug design. An. Acad. Bras. Cienc. 2018, 90 (Suppl. 2), 1233–1250. [Google Scholar] [CrossRef] [PubMed]
- Zhang, Z.; Guan, N.; Li, T.; Mais, D.E.; Wang, M. Quality control of cell-based high-throughput drug screening. Acta Pharm. Sin. 2012, 2, 429–438. [Google Scholar] [CrossRef] [Green Version]
- Sawadogo, W.R.; Schumacher, M.; Teiten, M.H.; Cerella, C.; Dicato, M.; Diederich, M. A survey of marine natural compounds and their derivatives with anti-cancer activity reported in 2011. Molecules 2013, 18, 3641–3673. [Google Scholar] [CrossRef] [PubMed]
- Katz, L.; Baltz, R.H. Natural product discovery: Past, present, and future. J. Ind. Microbiol. Biotechnol. 2016, 43, 155–176. [Google Scholar] [CrossRef]
- Newman, D.J.; Cragg, G.M. Marine-Sourced anti-cancer and cancer pain control agents in clinical and late preclinical development (†). Mar. Drugs 2014, 12, 255–278. [Google Scholar] [CrossRef]
- Newman, D.J.; Cragg, G.M. Natural products as sources of new drugs from 1981 to 2014. J. Nat. Prod. 2016, 79, 629–661. [Google Scholar] [CrossRef]
- Talero, E.; García-Mauriño, S.; Ávila-Román, J.; Rodríguez-Luna, A.; Alcaide, A.; Motilva, V. Bioactive compounds isolated from microalgae in chronic inflammation and cancer. Mar. Drugs 2015, 13, 6152–6209. [Google Scholar] [CrossRef]
- Sithranga Boopathy, N.; Kathiresan, K. Anticancer drugs from marine flora: An overview. J. Oncol. 2010, 2010, 214186. [Google Scholar] [CrossRef]
- Namvar, F.; Tahir, P.M.; Mohamad, R.; Mahdavi, M.; Abedi, P.; Najafi, T.F.; Rahmanand, H.S.; Jawaid, M. Biomedical properties of edible seaweed in cancer therapy and chemoprevention trials: A review. Nat. Prod. Commun. 2013, 8, 1811–1820. [Google Scholar] [CrossRef] [PubMed]
- Deshmukh, S.K.; Prakash, V.; Ranjan, N. Marine Fungi: A Source of Potential Anticancer Compounds. Front. Microbiol. 2017, 8, 2536. [Google Scholar] [CrossRef] [PubMed]
- Uzma, F.; Mohan, C.D.; Hashem, A.; Konappa, N.M.; Rangappa, S.; Kamath, P.V.; Singh, B.P.; Mudili, V.; Gupta, V.K.; Siddaiah, C.N.; et al. Endophytic Fungi-Alternative Sources of Cytotoxic Compounds: A Review. Front. Pharmacol. 2018, 9, 309. [Google Scholar] [CrossRef] [PubMed]
- Jimenez, P.C.; Wilke, D.V.; Costa-Lotufo, L.V. Marine drugs for cancer: Surfacing biotechnological innovations from the oceans. Clinics (Sao Paulo) 2018, 73 (Suppl. 1), e482s. [Google Scholar] [CrossRef] [PubMed]
- Bugni, T.S.; Ireland, C.M. Marine-derived fungi: A chemically and biologically diverse group of microorganisms. Nat. Prod. Rep. 2004, 21, 143–163. [Google Scholar] [CrossRef]
- Rateb, M.E.; Ebel, R. Secondary metabolites of fungi from marine habitats. Nat. Prod. Rep. 2011, 28, 290–344. [Google Scholar] [CrossRef] [PubMed]
- Gomes, N.G.; Lefranc, F.; Kijjoa, A.; Kiss, R. Can some marine-derived fungal metabolites become actual anticancer agents? Mar. Drugs 2015, 13, 3950–3991. [Google Scholar] [CrossRef]
- Yarden, O. Fungal association with sessile marine invertebrates. Front. Microbiol. 2014, 5, 228. [Google Scholar] [CrossRef]
- Debbab, A.; Aly, A.H.; Proksch, P. Endophytes and associated marine derived fungi—Ecological and chemical perspectives. Fungal Divers. 2012, 57, 45–83. [Google Scholar] [CrossRef]
- Simmons, T.L.; Andrianasolo, E.; McPhail, K.; Flatt, P.; Gerwick, W.H. Marine natural products as anticancer drugs. Mol. Cancer Ther. 2005, 4, 333. [Google Scholar]
- Buttachon, S.; Ramos, A.A.; Inacio, A.; Dethoup, T.; Gales, L.; Lee, M.; Costa, P.M.; Silva, A.M.S.; Sekeroglu, N.; Rocha, E.; et al. Bis-Indolyl Benzenoids, Hydroxypyrrolidine Derivatives and Other Constituents from Cultures of the Marine Sponge-Associated Fungus Aspergillus candidus KUFA0062. Mar. Drugs 2018, 16, 119. [Google Scholar] [CrossRef] [PubMed]
- Gu, Y.H.; Leonard, J. In vitro effects on proliferation, apoptosis and colony inhibition in ER-dependent and ER-independent human breast cancer cells by selected mushroom species. Oncol. Rep. 2006, 15, 417–423. [Google Scholar] [CrossRef] [PubMed]
- Dai, X.; Li, T.; Bai, Z.; Yang, Y.; Liu, X.; Zhan, J.; Sho, B. Breast cancer intrinsic subtype classification, clinical use and future trends. Am. J. Cancer Res. 2015, 10, 2029–2943. [Google Scholar]
- Torre, L.A.; Bray, F.; Siegel, R.L.; Ferlay, J.; Lortet-Tieulent, J.; Jemal, A. Global cancer statistics, 2012. CA Cancer J. Clin. 2015, 65, 87–108. [Google Scholar] [CrossRef] [PubMed] [Green Version]
- Gonzalez-Angulo, A.M.; Morales-Vasquez, F.; Hortobagyi, G.N. Overview of resistance to systemic therapy in patients with breast cancer. Adv. Exp. Med. Biol. 2007, 608, 1–22. [Google Scholar] [CrossRef] [PubMed]
- Housman, G.; Byler, S.; Heerboth, S.; Lapinska, K.; Longacre, M.; Snyder, N.; Sarkar, S. Drug resistance in cancer: An overview. Cancers 2014, 6, 1769–1792. [Google Scholar] [CrossRef] [PubMed]
- Elshimali, Y.I.; Wu, Y.; Khaddour, H.; Wu, Y.; Gradinaru, D.; Sukhija, H.; Chung, S.S.; Vadgama, J.V. Optimization OF Cancer Treatment Through Overcoming Drug Resistance. J. Cancer. Res. Oncobiol. 2018, 1, 107. [Google Scholar] [CrossRef] [PubMed]
- Nikolaou, M.; Pavlopoulou, A.; Georgakilas, A.G.; Kyrodimos, E. The challenge of drug resistance in cancer treatment: A current overview. Clin. Exp. Metastasis 2018, 35, 309–318. [Google Scholar] [CrossRef]
- Darzynkiewicz, Z. Novel strategies of protecting non-cancer cells during chemotherapy: Are they ready for clinical testing? Oncotarget 2011, 2, 107–108. [Google Scholar] [CrossRef]
- Holliday, D.L.; Speirs, V. Choosing the right cell line for breast cancer research. Breast Cancer Res. BCR 2011, 13, 215. [Google Scholar] [CrossRef]
- Neve, R.M.; Chin, K.; Fridlyand, J.; Yeh, J.; Baehner, F.L.; Fevr, T.; Clark, L.; Bayani, N.; Coppe, J.P.; Tong, F.; et al. A collection of breast cancer cell lines for the study of functionally distinct cancer subtypes. Cancer cell 2006, 10, 515–527. [Google Scholar] [CrossRef] [PubMed] [Green Version]
- Polyak, K. Heterogeneity in breast cancer. J. Clin. Investig. 2011, 121, 3786–3788. [Google Scholar] [CrossRef] [PubMed] [Green Version]
- Subik, K.; Lee, J.-F.; Baxter, L.; Strzepek, T.; Costello, D.; Crowley, P.; Xing, L.; Hung, M.-C.; Bonfiglio, T.; Hicks, D.G.; et al. The Expression Patterns of ER, PR, HER2, CK5/6, EGFR, Ki-67 and AR by immunohistochemical analysis in breast cancer cell lines. Breast Cancer (Auckl) 2010, 4, 35–41. [Google Scholar] [CrossRef] [PubMed]
- Dai, J.; Jian, J.; Bosland, M.; Frenkel, K.; Bernhardt, G.; Huang, X. Roles of hormone replacement therapy and iron in proliferation of breast epithelial cells with different estrogen and progesterone receptor status. Breast (Edinburgh, Scotland) 2008, 17, 172–179. [Google Scholar] [CrossRef] [PubMed] [Green Version]
- Breslin, S.; O’Driscoll, L. Three-dimensional cell culture: The missing link in drug discovery. Drug Discov. Today 2013, 18, 240–249. [Google Scholar] [CrossRef] [PubMed]
- Verjans, E.T.; Doijen, J.; Luyten, W.; Landuyt, B.; Schoofs, L. Three-dimensional cell culture models for anticancer drug screening: Worth the effort? J. Cell Physiol. 2018, 233, 2993–3003. [Google Scholar] [CrossRef] [PubMed]
- Antoni, D.; Burckel, H.; Josset, E.; Noel, G. Three-dimensional cell culture: A breakthrough in vivo. Int. J. Mol. Sci. 2015, 16, 5517–5527. [Google Scholar] [CrossRef]
- Carvalho, M.R.; Lima, D.; Reis, R.L.; Oliveira, J.M.; Correlo, V.M. Anti-cancer drug validation: The contribution of tissue engineered models. Stem Cell Rev. 2017, 13, 347–363. [Google Scholar] [CrossRef] [PubMed]
- Edmondson, R.; Broglie, J.J.; Adcock, A.F.; Yang, L. Three-dimensional cell culture systems and their applications in drug discovery and cell-based biosensors. Assay Drug Dev. Technol. 2014, 12, 207–218. [Google Scholar] [CrossRef] [PubMed]
- Vidi, P.A.; Bissell, M.J.; Lelievre, S.A. Three-dimensional culture of human breast epithelial cells: The how and the why. Methods Mol. Biol. 2013, 945, 193–219. [Google Scholar] [CrossRef]
- Ding, Y.; Wang, B.; Chen, X.; Zhou, Y.; Ge, J. Staurosporine suppresses survival of HepG2 cancer cells through Omi/HtrA2-mediated inhibition of PI3K/Akt signaling pathway. Tumour Biol. 2017, 39. [Google Scholar] [CrossRef] [PubMed] [Green Version]
- Xue, L.-y.; Chiu, S.-m.; Oleinick, N.L. Staurosporine-induced death of MCF-7 human breast cancer cells: A distinction between caspase-3-dependent steps of apoptosis and the critical lethal lesions. Exp. Cell Res. 2003, 283, 135–145. [Google Scholar] [CrossRef]
- Piccinini, F. AnaSP: A software suite for automatic image analysis of multicellular spheroids. Comput. Methods Programs Biomed. 2015, 119, 43–52. [Google Scholar] [CrossRef] [PubMed]
- Ziegler, U.; Groscurth, P. Morphological Features of Cell Death. Physiology 2004, 19, 124–128. [Google Scholar] [CrossRef]
- Saraste, A.; Pulkki, K. Morphologic and biochemical hallmarks of apoptosis. Cardiovasc. Res. 2000, 45, 528–537. [Google Scholar] [CrossRef]
- Watson, C.J. Key stages in mammary gland development - Involution: Apoptosis and tissue remodelling that convert the mammary gland from milk factory to a quiescent organ. Breast Cancer Res. 2006, 8, 203. [Google Scholar] [CrossRef] [PubMed]
- Bressenot, A.; Marchal, S.; Bezdetnaya, L.; Garrier, J.; Guillemin, F.; Plénat, F. Assessment of apoptosis by immunohistochemistry to active caspase-3, active caspase-7, or cleaved PARP in monolayer cells and spheroid and subcutaneous xenografts of human carcinoma. J. Histochem. Cytochem. 2009, 57, 289–300. [Google Scholar] [CrossRef] [PubMed]
- Riss, T.L.; Moravec, R.A. Use of multiple assay endpoints to investigate the effects of incubation time, dose of toxin, and plating density in cell-based cytotoxicity assays. Assay Drug Dev. Technol. 2004, 2, 51–62. [Google Scholar] [CrossRef]
- Sales Gil, R.; Vagnarelli, P. Ki-67: More Hidden behind a ‘Classic Proliferation Marker’. Trends Biochem. Sci. 2018, 43, 747–748. [Google Scholar] [CrossRef]
- Urruticoechea, A.; Smith, I.E.; Dowsett, M. Proliferation marker Ki-67 in early breast cancer. J Clin. Oncol. 2005, 23, 7212–7220. [Google Scholar] [CrossRef]
- Mazzoleni, G.; Di Lorenzo, D.; Steimberg, N. Modelling tissues in 3D: The next future of pharmaco-toxicology and food research? Genes Nutr. 2009, 4, 13–22. [Google Scholar] [CrossRef] [PubMed]
- Lovitt, C.J.; Shelper, T.B.; Avery, V.M. Advanced cell culture techniques for cancer drug discovery. Biology 2014, 3, 345–367. [Google Scholar] [CrossRef] [PubMed]
- Herrmann, R.; Fayad, W.; Schwarz, S.; Berndtsson, M.; Linder, S. Screening for compounds that induce apoptosis of cancer cells grown as multicellular spheroids. J. Biomol. Screen. 2008, 13, 1–8. [Google Scholar] [CrossRef] [PubMed]
- Nath, S.; Devi, G.R. Three-dimensional culture systems in cancer research: Focus on tumor spheroid model. Pharmacol. Ther. 2016, 163, 94–108. [Google Scholar] [CrossRef] [PubMed] [Green Version]
- Zanoni, M.; Pignatta, S.; Arienti, C.; Bonafè, M.; Tesei, A. Anticancer drug discovery using multicellular tumor spheroid models. Expert Opin. Drug Discov. 2019, 14, 289–301. [Google Scholar] [CrossRef] [PubMed]
- Sant, S.; Johnston, P.A. The production of 3D tumor spheroids for cancer drug discovery. Drug Discov. Today Technol. 2017, 23, 27–36. [Google Scholar] [CrossRef] [PubMed] [Green Version]
- Ho, W.Y.; Yeap, S.K.; Ho, C.L.; Rahim, R.A.; Alitheen, N.B. Development of multicellular tumor spheroid (MCTS) culture from breast cancer cell and a high throughput screening method using the MTT assay. PLoS ONE 2012, 7, e44640. [Google Scholar] [CrossRef]
- Froehlich, K.; Haeger, J.D.; Heger, J.; Pastuschek, J.; Photini, S.M.; Yan, Y.; Lupp, A.; Pfarrer, C.; Mrowka, R.; Schleussner, E.; et al. Generation of multicellular breast cancer tumor spheroids: Comparison of different protocols. J. Mammary Gland. Biol. Neoplasia 2016, 21, 89–98. [Google Scholar] [CrossRef]
- Do Amaral, J.B.; Urabayashi, M.S.; Machado-Santelli, G.M. Cell death and lumen formation in spheroids of MCF-7 cells. Cell Biol. Int. 2010, 34, 267–274. [Google Scholar] [CrossRef]
- Ivascu, A.; Kubbies, M. Rapid generation of single-tumor spheroids for high-throughput cell function and toxicity analysis. J. Biomol. Screen. 2006, 11, 922–932. [Google Scholar] [CrossRef]
- Reynolds, D.S.; Tevis, K.M.; Blessing, W.A.; Colson, Y.L.; Zaman, M.H.; Grinstaff, M.W. Breast cancer spheroids reveal a differential cancer stem cell response to chemotherapeutic treatment. Sci. Rep. 2017, 7, 10382. [Google Scholar] [CrossRef] [PubMed]
- Ramanujan, V.K. Quantitative imaging of morphometric and metabolic signatures reveals heterogeneity in drug response of three-dimensional mammary tumor spheroids. Mol. Imaging Biol. 2019, 21, 436–446. [Google Scholar] [CrossRef] [PubMed]
- Lombardo, Y.; de Giorgio, A.; Coombes, C.R.; Stebbing, J.; Castellano, L. Mammosphere formation assay from human breast cancer tissues and cell lines. J. Vis. Exp. 2015. [Google Scholar] [CrossRef] [PubMed]
- Guttilla, I.K.; Phoenix, K.N.; Hong, X.; Tirnauer, J.S.; Claffey, K.P.; White, B.A. Prolonged mammosphere culture of MCF-7 cells induces an EMT and repression of the estrogen receptor by microRNAs. Breast Cancer Res. Treat. 2012, 132, 75–85. [Google Scholar] [CrossRef] [PubMed]
- Vantangoli, M.M.; Madnick, S.J.; Huse, S.M.; Weston, P.; Boekelheide, K. MCF-7 human breast cancer cells form differentiated microtissues in scaffold-free hydrogels. PloS one 2015, 10, e0135426. [Google Scholar] [CrossRef] [PubMed]
- Hirschhaeuser, F.; Menne, H.; Dittfeld, C.; West, J.; Mueller-Klieser, W.; Kunz-Schughart, L.A. Multicellular tumor spheroids: An underestimated tool is catching up again. J. Biotechnol. 2010, 148, 3–15. [Google Scholar] [CrossRef] [PubMed]
- Gencoglu, M.F.; Barney, L.E.; Hall, C.L.; Brooks, E.A.; Schwartz, A.D.; Corbett, D.C.; Stevens, K.R.; Peyton, S.R. Comparative study of multicellular tumor spheroid formation methods and implications for drug screening. ACS Biomater. Sci. Eng. 2018, 4, 410–420. [Google Scholar] [CrossRef] [PubMed]
- Krause, S.; Maffini, M.V.; Soto, A.M.; Sonnenschein, C. The microenvironment determines the breast cancer cells’ phenotype: Organization of MCF7 cells in 3D cultures. BMC Cancer 2010, 10, 263. [Google Scholar] [CrossRef]
- Mittler, F.; Obeïd, P.; Rulina, A.V.; Haguet, V.; Gidrol, X.; Balakirev, M.Y. High-content monitoring of drug effects in a 3D spheroid Model. Front. Oncol. 2017, 7, 293. [Google Scholar] [CrossRef]
- Ivanov, D.P.; Parker, T.L.; Walker, D.A.; Alexander, C.; Ashford, M.B.; Gellert, P.R.; Garnett, M.C. Multiplexing spheroid volume, resazurin and acid phosphatase viability assays for high-throughput screening of tumour spheroids and stem cell neurospheres. PLoS ONE 2014, 9, e103817. [Google Scholar] [CrossRef]
- Wenzel, C.; Riefke, B.; Gründemann, S.; Krebs, A.; Christian, S.; Prinz, F.; Osterland, M.; Golfier, S.; Räse, S.; Ansari, N.; et al. 3D high-content screening for the identification of compounds that target cells in dormant tumor spheroid regions. Exp. Cell Res. 2014, 323, 131–143. [Google Scholar] [CrossRef] [PubMed] [Green Version]
- Liu, B.; Ezeogu, L.; Zellmer, L.; Yu, B.; Xu, N.; Joshua Liao, D. Protecting the normal in order to better kill the cancer. Cancer Med. 2015, 4, 1394–1403. [Google Scholar] [CrossRef] [PubMed]
- Chung, I.; Reichelt, M.; Shao, L.; Akita, R.W.; Koeppen, H.; Rangell, L.; Schaefer, G.; Mellman, I.; Sliwkowski, M.X. High cell-surface density of HER2 deforms cell membranes. Nat. Commun. 2016, 7, 12742. [Google Scholar] [CrossRef] [PubMed] [Green Version]
- Razak, N.A.; Abu, N.; Ho, W.Y.; Zamberi, N.R.; Tan, S.W.; Alitheen, N.B.; Long, K.; Yeap, S.K. Cytotoxicity of eupatorin in MCF-7 and MDA-MB-231 human breast cancer cells via cell cycle arrest, anti-angiogenesis and induction of apoptosis. Sci. Rep. 2019, 9. [Google Scholar] [CrossRef] [PubMed]
- Elmore, S.A.; Dixon, D.; Hailey, J.R.; Harada, T.; Herbert, R.A.; Maronpot, R.R.; Nolte, T.; Rehg, J.E.; Rittinghausen, S.; Rosol, T.J.; et al. Recommendations from the INHAND Apoptosis/Necrosis Working Group. Toxicol. Pathol. 2016, 44, 173–188. [Google Scholar] [CrossRef] [PubMed] [Green Version]
- Chen, D.L.; Engle, J.T.; Griffin, E.A.; Miller, J.P.; Chu, W.; Zhou, D.; Mach, R.H. Imaging caspase-3 activation as a marker of apoptosis-targeted treatment response in cancer. Mol. Imaging Biol. 2015, 17, 384–393. [Google Scholar] [CrossRef]
- Inwald, E.C.; Klinkhammer-Schalke, M.; Hofstädter, F.; Zeman, F.; Koller, M.; Gerstenhauer, M.; Ortmann, O. Ki-67 is a prognostic parameter in breast cancer patients: Results of a large population-based cohort of a cancer registry. Breast Cancer Res. Treat. 2013, 139, 539–552. [Google Scholar] [CrossRef] [PubMed]
- Costa, E.C.; Moreira, A.F.; de Melo-Diogo, D.; Gaspar, V.M.; Carvalho, M.P.; Correia, I.J. 3D tumor spheroids: An overview on the tools and techniques used for their analysis. Biotechnol. Adv. 2016, 34, 1427–1441. [Google Scholar] [CrossRef]
- Do Amaral, J.B.; Rezende-Teixeira, P.; Freitas, V.M.; Machado-Santelli, G.M. MCF-7 cells as a three-dimensional model for the study of human breast cancer. Tissue Eng. Part C Methods 2011, 17, 1097–1107. [Google Scholar] [CrossRef]
- Mailleux, A.A.; Overholtzer, M.; Brugge, J.S. Lumen formation during mammary epithelial morphogenesis: Insights from in vitro and in vivo models. Cell Cycle 2008, 7, 57–62. [Google Scholar] [CrossRef]
- Menyhárt, O.; Harami-Papp, H.; Sukumar, S.; Schäfer, R.; Magnani, L.; de Barrios, O.; Győrffy, B. Guidelines for the selection of functional assays to evaluate the hallmarks of cancer. Biochim. Biophys. Acta Rev. Cancer 2016, 1866, 300–319. [Google Scholar] [CrossRef] [PubMed] [Green Version]
- Prata-Sena, M.; Ramos, A.A.; Buttachon, S.; Castro-Carvalho, B.; Marques, P.; Dethoup, T.; Kijjoa, A.; Rocha, E. Cytotoxic activity of secondary metabolites from marine-derived fungus Neosartorya siamensis in Human Cancer Cells. Phytother. Res. 2016, 30, 1862–1871. [Google Scholar] [CrossRef]
- Mosmann, T. Rapid colorimetric assay for cellular growth and survival: Application to proliferation and cytotoxicity assays. J. Immunol. Methods 1983, 65, 55–63. [Google Scholar] [CrossRef]
- O’Brien, J.; Wilson, I.; Orton, T.; Pognan, F. Investigation of the Alamar Blue (resazurin) fluorescent dye for the assessment of mammalian cell cytotoxicity. Eur. J. Biochem. 2000, 267, 5421–5426. [Google Scholar] [CrossRef] [PubMed]
- Ramos, A.A.; Almeida, T.; Lima, B.; Rocha, E. Cytotoxic activity of the seaweed compound fucosterol, alone and in combination with 5-fluorouracil, in colon cells using 2D and 3D culturing. J. Toxicol. Environ. Health A 2019, 1–13. [Google Scholar] [CrossRef] [PubMed]
- Cecchini, M.J.; Amiri, M.; Dick, F.A. Analysis of cell cycle position in mammalian cells. J. Vis. Exp. 2012. [Google Scholar] [CrossRef] [PubMed]
- Padet, L.; St-Amour, I.; Aubin, E.; Proulx, D.P.; Bazin, R.; Lemieux, R. Dose-Dependent Inhibition of BrdU Detection in the Cell proliferation ELISA by culture medium proteins. J. Immunoass. Immunochem. 2009, 30, 348–357. [Google Scholar] [CrossRef] [PubMed]
- Reynolds, E.S. The use of lead citrate at high pH as an electron-opaque stain in electron microscopy. J. Cell. Biol. 1963, 17, 208–212. [Google Scholar] [CrossRef] [PubMed]


© 2019 by the authors. Licensee MDPI, Basel, Switzerland. This article is an open access article distributed under the terms and conditions of the Creative Commons Attribution (CC BY) license (http://creativecommons.org/licenses/by/4.0/).
Share and Cite
Malhão, F.; Ramos, A.A.; Buttachon, S.; Dethoup, T.; Kijjoa, A.; Rocha, E. Cytotoxic and Antiproliferative Effects of Preussin, a Hydroxypyrrolidine Derivative from the Marine Sponge-Associated Fungus Aspergillus candidus KUFA 0062, in a Panel of Breast Cancer Cell Lines and Using 2D and 3D Cultures. Mar. Drugs 2019, 17, 448. https://doi.org/10.3390/md17080448
Malhão F, Ramos AA, Buttachon S, Dethoup T, Kijjoa A, Rocha E. Cytotoxic and Antiproliferative Effects of Preussin, a Hydroxypyrrolidine Derivative from the Marine Sponge-Associated Fungus Aspergillus candidus KUFA 0062, in a Panel of Breast Cancer Cell Lines and Using 2D and 3D Cultures. Marine Drugs. 2019; 17(8):448. https://doi.org/10.3390/md17080448
Chicago/Turabian StyleMalhão, Fernanda, Alice A. Ramos, Suradet Buttachon, Tida Dethoup, Anake Kijjoa, and Eduardo Rocha. 2019. "Cytotoxic and Antiproliferative Effects of Preussin, a Hydroxypyrrolidine Derivative from the Marine Sponge-Associated Fungus Aspergillus candidus KUFA 0062, in a Panel of Breast Cancer Cell Lines and Using 2D and 3D Cultures" Marine Drugs 17, no. 8: 448. https://doi.org/10.3390/md17080448