Isolation, Characterization and Biotechnological Potentials of Thraustochytrids from Icelandic Waters

 , , and
Abstract
:1. Introduction
2. Results
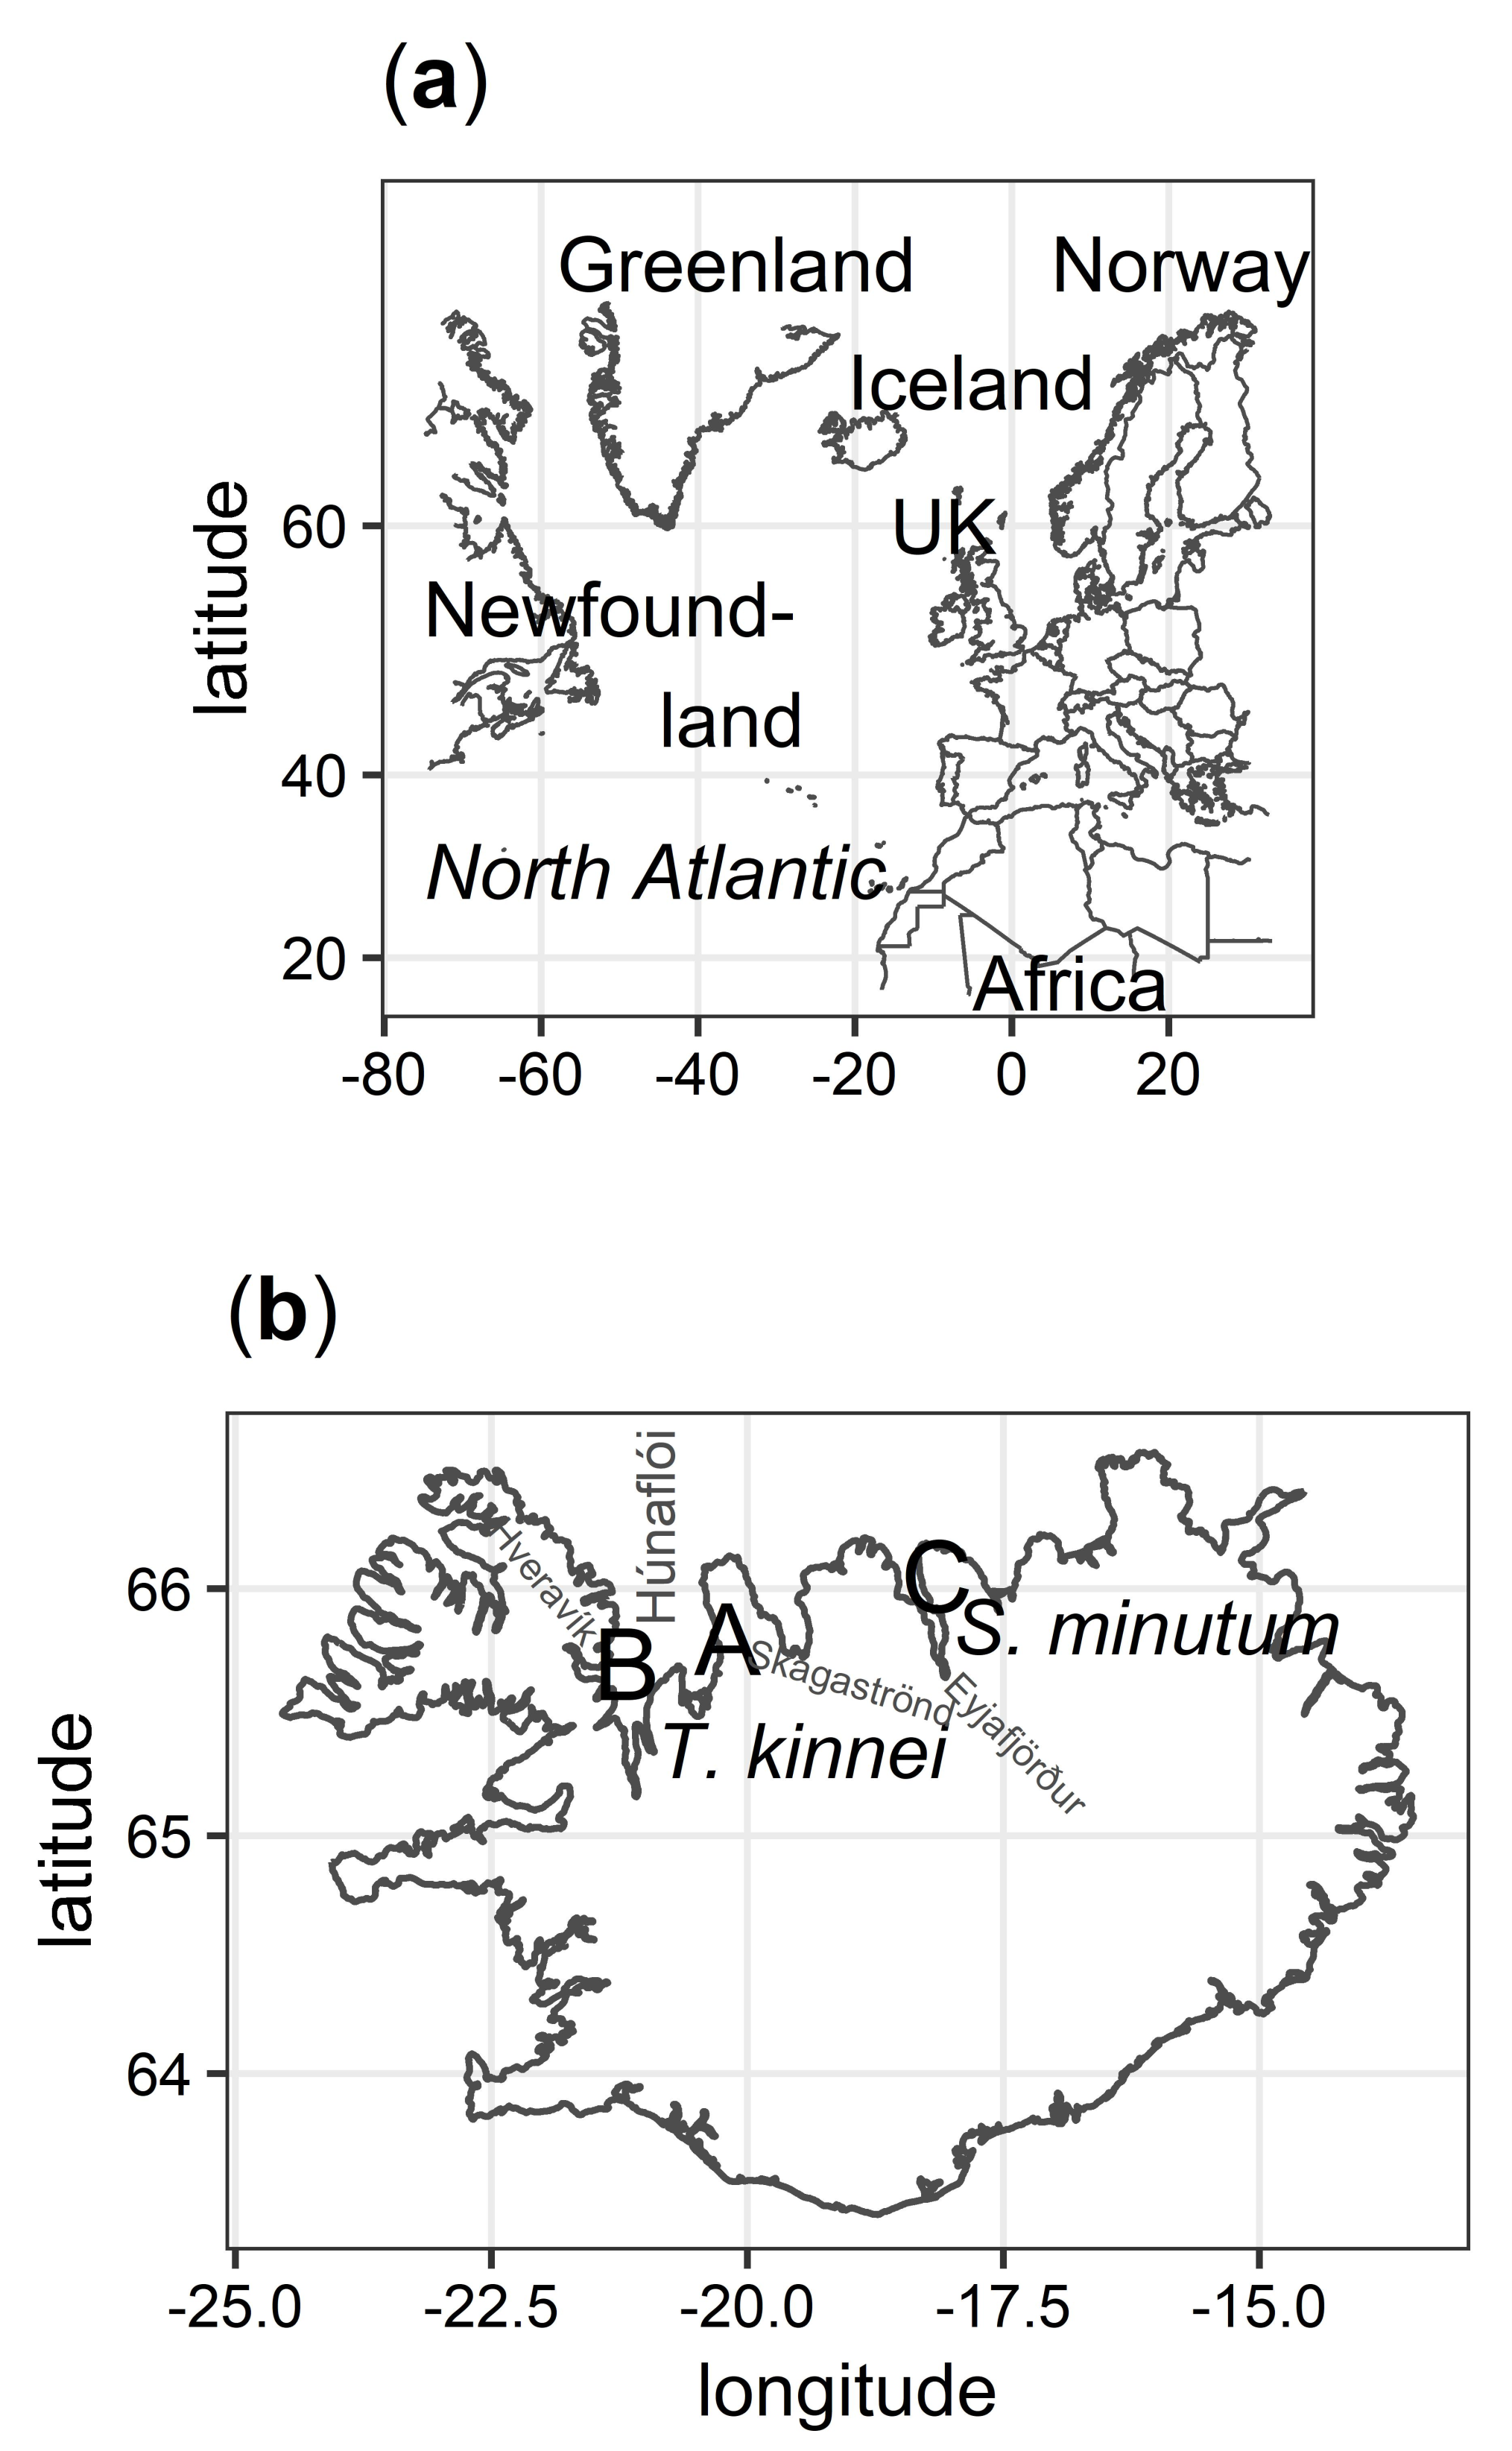
2.1. Isolation
2.2. Phylogeny
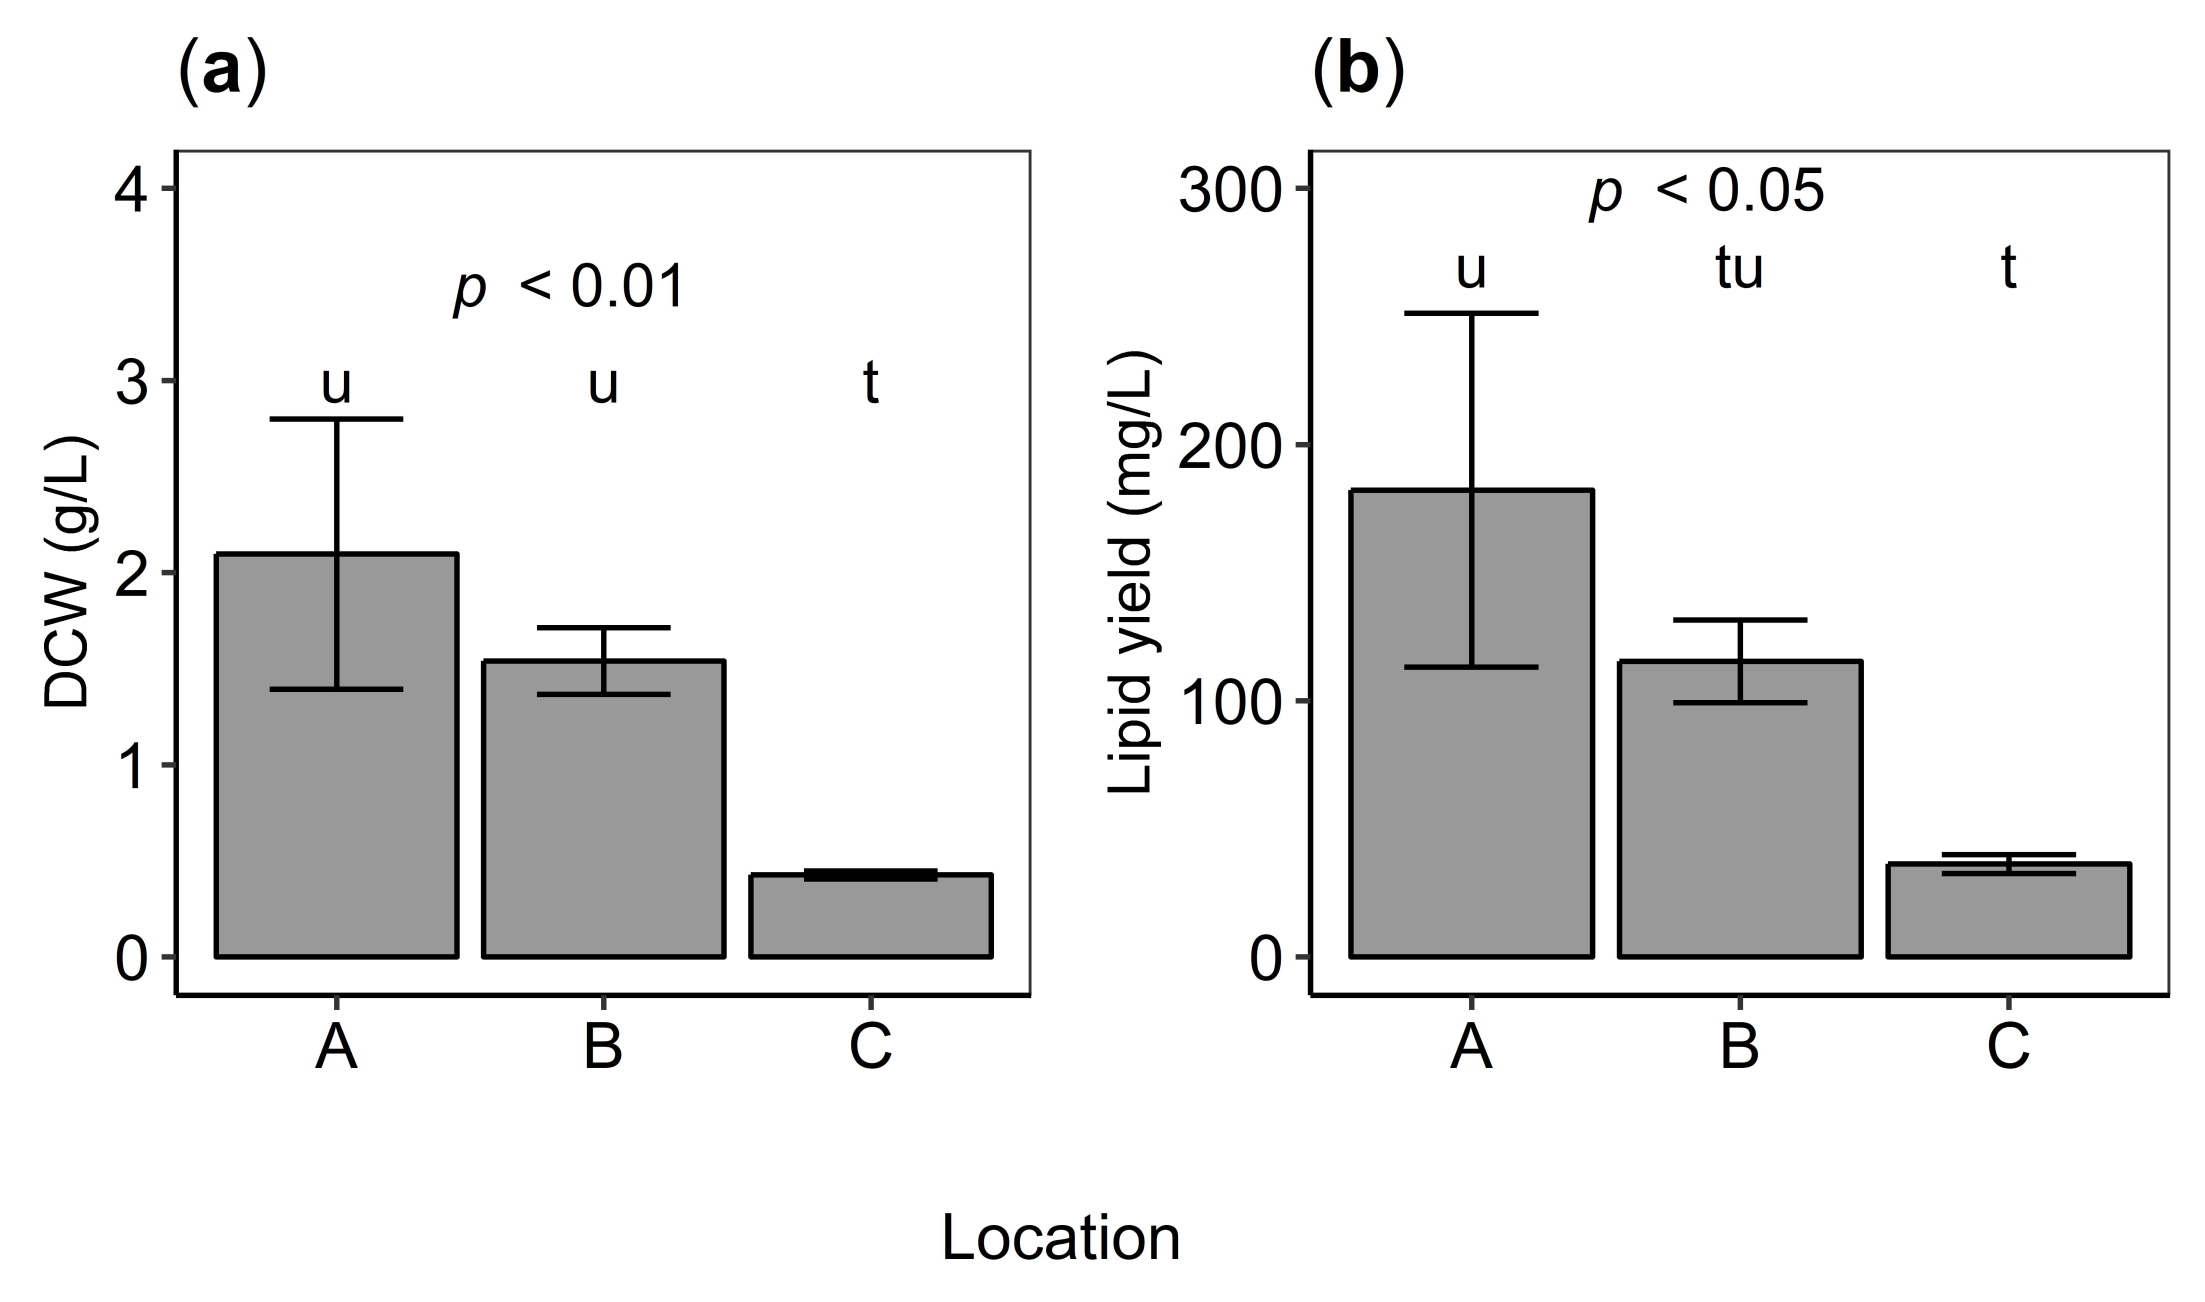
2.3. Biomass and Lipid Production
2.3.1. Fractional Factorial Analysis
2.3.2. Nitrogen Source
2.3.3. Carbon Source
2.4. Fatty Acid Profile
2.5. Carotenoids
3. Discussion
3.1. Phylogeny
3.2. Growth Properties
3.3. Fatty Acid Profiles
4. Materials and Methods
4.1. Sampling, Isolation, and Culture Maintenance
4.2. Growth Studies
4.3. Fatty Acid Analysis
4.4. Carotenoids
4.5. DNA Sequencing
4.6. Phylogeny
4.7. Nucleotide Data Accession Numbers
5. Conclusions
Supplementary Materials
Author Contributions
Funding
Acknowledgments
Conflicts of Interest
References
- Gleason, F.H.; Lilje, O.; Lange, L. What has happened to the “aquatic phycomycetes” (sensu Sparrow)? Part II: Shared properties of zoosporic true fungi and fungus-like microorganisms. Fungal Biol. Rev. 2018, 32, 52–61. [Google Scholar] [CrossRef]
- Pokorny, K.S. Labyrinthula. J. Protozool. 1967, 14, 697–708. [Google Scholar] [CrossRef]
- Sparrow, F.K. Biological observations on the marine fungi of Woods Hole waters. Biol. Bul. Mar. Biol. Lab. Woods Hole 1936, 70, 236–263. [Google Scholar] [CrossRef]
- Porter, D. Phylum Labyrinthulomycota. In Handbook of Protoctista; Margulis, L., Corliss, J.O., Melkonian, M., Chapman, D.J., Eds.; Jones and Bartlett Publishers: Boston, MA, USA, 1990; pp. 388–398. [Google Scholar]
- Cavalier-Smith, T.; Allsopp, M.T.E.P.; Chao, E.E. Thraustochytrids are chromists, not fungi: 18s rRNA signatures of Heterokonta. Philos. Trans. R. Soc. B 1994, 346, 387–397. [Google Scholar] [CrossRef]
- Honda, D.; Yokochi, T.; Nakahara, T.; Raghukumar, S.; Nakagiri, A.; Schaumann, K.; Higashihara, T. Molecular phylogeny of labyrinthulids and thraustochytrids based on the sequencing of 18S ribosomal RNA gene. J. Eukaryot. Microbiol. 1999, 46, 637–647. [Google Scholar] [CrossRef] [PubMed]
- Leyland, B.; Leu, S.; Boussiba, S.; Voglmayr, H. Are Thraustochytrids algae? Fungal Biol. 2017, 121, 835–840. [Google Scholar] [CrossRef] [PubMed]
- Watson, R.; Pauly, D. Systematic distortions in world fisheries catch trends. Nature 2001, 414, 534–536. [Google Scholar] [CrossRef]
- Martins, D.A.; Custódio, L.; Barreira, L.; Pereira, H.; Ben-Hamadou, R.; Varela, J.; Abu-Salah, K.M. Alternative sources of n-3 long-chain polyunsaturated fatty acids in marine microalgae. Mar. Drugs 2013, 11, 2259–2281. [Google Scholar] [CrossRef]
- Salem, N.; Eggersdorfer, M. Is the world supply of omega-3 fatty acids adequate for optimal human nutrition? Curr. Opin. Clin. Nutr. Metab. Care 2015, 18, 147–154. [Google Scholar] [CrossRef]
- Kris-Etherton, P.M.; Harris, W.S.; Appel, L.J. Fish consumption, fish oil, omega-3 fatty acids, and cardiovascular disease. Circulation 2002, 106, 2747–2757. [Google Scholar] [CrossRef]
- Calder, P.C. n–3 Polyunsaturated fatty acids, inflammation, and inflammatory diseases. Am. J. Clin. Nutr. 2006, 83, 1505S–1519S. [Google Scholar] [CrossRef] [PubMed]
- Naylor, R.L.; Hardy, R.W.; Bureau, D.P.; Chiu, A.; Elliott, M.; Farrell, A.P.; Forster, I.; Gatlin, D.M.; Goldburg, R.J.; Hua, K.; et al. Feeding aquaculture in an era of finite resources. Proc. Natl. Acad. Sci. USA 2009, 106, 15103–15110. [Google Scholar] [CrossRef] [PubMed] [Green Version]
- Lewis, T.E.; Nichols, P.D.; McMeekin, T.A. The biotechnological potential of Thraustochytrids. Mar. Biotechnol. 1999, 1, 580–587. [Google Scholar] [CrossRef] [PubMed]
- Barclay, W.; Weaver, C.; Metz, J. Development of a docosahexaenoic acid production technology using Schizochytrium: A historical perspective. In Single Cell Oils; Cohen, Z., Ratledge, C., Eds.; AOCS Press: Champaign, IL, USA, 2005; pp. 36–52. [Google Scholar]
- Ward, O.P.; Singh, A. Omega-3/6 fatty acids: Alternative sources of production. Process. Biochem. 2005, 40, 3627–3652. [Google Scholar] [CrossRef]
- Burja, A.M.; Radianingtyas, H.; Windust, A.; Barrow, C.J. Isolation and characterization of polyunsaturated fatty acid producing Thraustochytrium Species: Screen. Strains Optim. Omega-3 Prod. Appl. Microbiol. Biotechnol. 2006, 72, 1161–1169. [Google Scholar] [CrossRef] [PubMed]
- Perveen, Z.; Ando, H.; Ueno, A.; Ito, Y.; Yamamoto, Y.; Yamada, Y.; Takagi, T.; Kaneko, T.; Kogame, K.; Okuyama, H. Isolation and characterization of a novel thraustochytrid-like microorganism that efficiently produces docosahexaenoic acid. Biotechnol. Lett. 2006, 28, 197–202. [Google Scholar] [CrossRef] [PubMed]
- Yang, H.L.; Lu, C.K.; Chen, S.F.; Chen, Y.M.; Chen, Y.M. Isolation and characterization of Taiwanese heterotrophic microalgae: Screening of strains for docosahexaenoic acid (DHA) production. Mar. Biotechnol. 2010, 12, 173–185. [Google Scholar] [CrossRef] [PubMed]
- Gao, M.; Song, X.; Feng, Y.; Li, W.; Cui, Q. Isolation and characterization of Aurantiochytrium Species: High Docosahexaenoic Acid (DHA) Prod. New. Isol. Microalga, Aurantiochytrium Sp. SD116. J. Oleo Sci. 2013, 62, 143–151. [Google Scholar] [CrossRef]
- Walther, G.R.; Post, E.; Convey, P.; Menzel, A.; Parmesan, C.; Beebee, T.J.C.; Fromentin, J.M.; Hoegh-Guldberg, O.; Bairlein, F. Ecological responses to recent climate change. Nature 2002, 416, 389–395. [Google Scholar] [CrossRef] [PubMed]
- Parmesan, C. Ecological and evolutionary responses to recent climate change. Annu. Rev. Ecol. Evol. Syst. 2006, 37, 637–669. [Google Scholar] [CrossRef]
- Thomas, C.D.; Cameron, A.; Green, R.E.; Bakkenes, M.; Beaumont, L.J.; Collingham, Y.C.; Erasmus, B.F.N.; De Siqueira, M.F.; Grainger, A.; Hannah, L.; et al. Extinction risk from climate change. Nature 2004, 427, 145–148. [Google Scholar] [CrossRef] [PubMed]
- Ma, F.; Hanna, M.A. Biodiesel production: A review. Bioresour. Technol. 1999, 70, 1–15. [Google Scholar] [CrossRef]
- Chisti, Y. Biodiesel from microalgae. Biotechnol. Adv. 2007, 25, 294–306. [Google Scholar] [CrossRef] [PubMed]
- Wijffels, R.H.; Barbosa, M.J. An outlook on microalgal biofuels. Science 2010, 329, 796–799. [Google Scholar] [CrossRef] [PubMed]
- Johnson, M.B.; Wen, Z. Production of biodiesel fuel from the microalga Schizochytrium Limacinum Direct Transesterification Algal Biomass. Energy Fuels 2009, 23, 5179–5183. [Google Scholar] [CrossRef]
- Chen, W.; Ma, L.; Zhou, P.P.; Zhu, Y.M.; Wang, X.P.; Luo, X.A.; Bao, Z.D.; Yu, L.J. A novel feedstock for biodiesel production: The application of palmitic acid from Schizochytrium. Energy 2015, 86, 128–138. [Google Scholar] [CrossRef]
- Lee Chang, K.J.; Rye, L.; Dunstan, G.A.; Grant, T.; Koutoulis, A.; Nichols, P.D.; Blackburn, S.I. Life cycle assessment: Heterotrophic cultivation of thraustochytrids for biodiesel production. J. Appl. Phycol. 2015, 27, 639–647. [Google Scholar] [CrossRef]
- Ferraro, V.; Cruz, I.B.; Jorge, R.F.; Malcata, F.X.; Pintado, M.E.; Castro, P.M.L. Valorisation of natural extracts from marine source focused on marine by-products: A review. Food Res. Int. 2010, 43, 2221–2233. [Google Scholar] [CrossRef]
- Raghukumar, S. Ecology of the marine protists, the Labyrinthulomycetes (Thraustochytrids and Labyrinthulids). Protistologica 2002, 38, 127–145. [Google Scholar] [CrossRef]
- Thyagarajan, T.; Puri, M.; Vongsvivut, J.; Barrow, C.J. Evaluation of bread crumbs as a potential carbon source for the growth of thraustochytrid species for oil and omega-3 production. Nutrients 2014, 6, 2104–2114. [Google Scholar] [CrossRef]
- Fan, K.W.; Chen, F.; Jones, E.B.G.; Vrijmoed, L.L.P. Eicosapentaenoic and docosahexaenoic acids production by and okara-utilizing potential of thraustochytrids. J. Ind. Microbiol. Biotechnol. 2001, 27, 199–202. [Google Scholar] [CrossRef] [PubMed]
- Liang, Y.; Sarkany, N.; Cui, Y.; Yesuf, J.; Trushenski, J.; Blackburn, J.W. Use of sweet sorghum juice for lipid production by Schizochytrium Limacinum SR21. Bioresour. Technol. 2010, 101, 3623–3627. [Google Scholar] [CrossRef] [PubMed]
- Pyle, D.J.; Garcia, R.A.; Wen, Z. Producing docosahexaenoic acid (DHA)-rich algae from biodiesel-derived crude glycerol: Effects of impurities on DHA production and algal biomass composition. J. Agric. Food Chem. 2008, 56, 3933–3939. [Google Scholar] [CrossRef] [PubMed]
- Ethier, S.; Woisard, K.; Vaughan, D.; Wen, Z. Continuous culture of the microalgae Schizochytrium Limacinum Biodiesel-Deriv. Crude Glycerol Prod. Docosahexaenoic Acid. Bioresour. Technol. 2011, 102, 88–93. [Google Scholar] [CrossRef] [PubMed]
- Yamasaki, T.; Aki, T.; Shinozaki, M.; Taguchi, M.; Kawamoto, S.; Ono, K. Utilization of Shochu Distill. Wastewater Prod. Polyunsaturated Fat. Acids Xanthophylls Using Thraustochytrid. J. Biosci. Bioeng. 2006, 102, 323–327. [Google Scholar] [CrossRef] [PubMed]
- Ryu, B.G.; Kim, K.; Kim, J.; Han, J.I.; Yang, J.W. Use of organic waste from the brewery industry for high-density cultivation of the docosahexaenoic acid-rich microalga, Aurantiochytrium Sp. KRS101. Bioresour. Technol. 2013, 129, 351–359. [Google Scholar] [CrossRef] [PubMed]
- Anon. Icelandic Met Office. Available online: https://www.vedur.is/ (accessed on 20 July 2019).
- Baldursson, S.; University of Akureyri, Akureyri, Iceland; BioPol ltd., Skagaströnd, Iceland. Personal communication, 2010.
- Anon. Vistey. Available online: https://www.vistey.is/ (accessed on 20 July 2019).
- Quilodrán, B.; Hinzpeter, I.; Quiroz, A.; Shene, C. Evaluation of liquid residues from beer and potato processing for the production of docosahexaenoic acid (C22:6n-3, DHA) by native thraustochytrid strains. World J. Microbiol. Biotechnol. 2009, 25, 2121–2128. [Google Scholar] [CrossRef]
- Silva, D.; Villarroel, M.P.; Roa, A.L.; Quilodrán, B.H. Use of waste from agroindustrial sources as substrate for polyunsaturated fatty acids production by Thraustochytrium Kinney VAL-B1. Int. J. Eng. Res. Afr. 2017, 33, 50–55. [Google Scholar] [CrossRef]
- Yokoyama, R.; Salleh, B.; Honda, D. Taxonomic rearrangement of the genus Ulkenia Sensu Lato Based Morphol. Chemotaxon. Charact. 18S RRNA Gene Phylogeny (Thraustochytriaceae, Labyrinthulomycetes): Emendation Ulkenia Erection Botryochytrium, Parietichytrium, Sicyoidochytrium Gen. Nov. Mycoscience 2007, 48, 329–341. [Google Scholar] [CrossRef]
- Zar, J.H. Biostatistical Analysis, 4th ed.; Prentice Hall: Upper Saddle River, NJ, USA, 1999; p. 663. [Google Scholar]
- Chambers, J.M. Linear Models. In Statistical Models in S; Chamber, J.M., Hastie, T.J., Eds.; Wadsworth & Brooks/Cole: Pacific Grove, CA, USA, 1992. [Google Scholar]
- Johnson, T.W. Aquatic fungi of Iceland: Biflagellate species. Acta. Nat. Isl. 1974, 23, 1–40. [Google Scholar]
- Yokoyama, R.; Honda, D. Taxonomic rearrangement of the genus Schizochytrium Sensu Lato Based Morphol. Chemotaxon. Charact. 18S RRNA Gene Phylogeny (Thraustochytriaceae, Labyrinthulomycetes): Emendation Schizochytrium Erection Aurantiochytrium Oblongichytrium Gen. Nov. Mycoscience 2007, 48, 199–211. [Google Scholar] [CrossRef]
- Tsui, C.K.M.; Marshall, W.; Yokoyama, R.; Honda, D.; Lippmeier, J.C.; Craven, K.D.; Peterson, P.D.; Berbee, M.L. Labyrinthulomycetes phylogeny and its implications for the evolutionary loss of chloroplasts and gain of ectoplasmic gliding. Mol. Phylogenet. Evol. 2009, 50, 129–140. [Google Scholar] [CrossRef] [PubMed]
- Harel, M.; Ben-Dov, E.; Rasoulouniriana, D.; Siboni, N.; Kramarsky-Winter, E.; Loya, Y.; Barak, Z.; Wiesman, Z.; Kushmaro, A. A new Thraustochytrid, strain Fng1, Isol. Surf. Mucus Hermatypic Coral Fungia Granulosa. FEMS Microbiol. Ecol. 2008, 64, 378–387. [Google Scholar] [CrossRef] [PubMed]
- Ueda, M.; Nomura, Y.; Doi, K.; Nakajima, M.; Honda, D. Seasonal dynamics of culturable thraustochytrids (Labyrinthulomycetes, Stramenopiles) in estuarine and coastal waters. Aquat. Microb. Ecol. 2015, 74, 187–204. [Google Scholar] [CrossRef]
- Chi, Z.; Hu, B.; Yan, L.; Frear, C.; Wen, Z.; Chen, S. Production of ω-3 polyunsaturated fatty acids arom cull potato using an algae. Appl. Biochem. Biotechnol. 2007, 136–140, 805–815. [Google Scholar] [CrossRef]
- Unagul, P.; Assantachai, C.; Phadungruengluij, S.; Suphantharika, M.; Tanticharoen, M.; Verduyn, C. Coconut water as a medium additive for the production of docosahexaenoic acid (C22:6 n3) by Schizochytrium Mangrovei Sk-02. Bioresour. Technol. 2007, 98, 281–287. [Google Scholar] [CrossRef] [PubMed]
- Zhu, L.; Zhang, X.; Ren, X.; Zhu, Q. Effects of culture conditions on growth and docosahexaenoic acid production from Schizochytrium Limacinum. J. Ocean Univ. China 2008, 7, 83–88. [Google Scholar] [CrossRef]
- Pleissner, D.; Lam, W.C.; Sun, Z.; Lin, C.S.K. Food waste as nutrient source in heterotrophic microalgae cultivation. Bioresour. Technol. 2013, 137, 139–146. [Google Scholar] [CrossRef]
- Gao, S.; Tong, Y.; Zhu, L.; Ge, M.; Jiang, Y.; Chen, D.; Yang, S. Production of β-carotene by expressing a heterologous multifunctional carotene synthase in Yarrowia Lipolytica. Biotechnol. Lett. 2017, 39, 921–927. [Google Scholar] [CrossRef]
- Aki, T.; Hachida, K.; Yoshinaga, M.; Katai, Y.; Yamasaki, T.; Kawamoto, S.; Kakizono, T.; Maoka, T.; Shigeta, S.; Suzuki, O.; et al. Thraustochytrid as a potential source of carotenoids. J. Am. Oil Chem. Soc. 2003, 80, 789–794. [Google Scholar] [CrossRef]
- Navab, M.; Ananthramaiah, G.M.; Reddy, S.T.; Van Lenten, B.J.; Ansell, B.J.; Fonarow, G.C.; Vahabzadeh, K.; Hama, S.; Hough, G.; Kamranpour, N.; et al. The oxidation hypothesis of atherogenesis: The role of oxidized phospholipids and HDL. J. Lipid Res. 2004, 45, 993–1007. [Google Scholar] [CrossRef] [PubMed]
- Mozaffarian, D.; Appel, L.J.; Van Horn, L. Components of a cardioprotective diet: New insights. Circulation 2011, 123, 2870–2891. [Google Scholar] [CrossRef] [PubMed]
- Horrocks, L.A.; Yeo, Y.K. Health benefits of docosahexaenoic acid (DHA). Pharmacol. Res. 1999, 40, 211–225. [Google Scholar] [CrossRef] [PubMed]
- Larsson, S.C.; Kumlin, M.; Ingelman-Sundberg, M.; Wolk, A. Dietary long-chain n–3 fatty acids for the prevention of cancer: A review of potential mechanisms. Am. J. Clin. Nutr. 2004, 79, 935–945. [Google Scholar] [CrossRef] [PubMed]
- Sargent, J.; Bell, G.; Mcevoy, L.; Tocher, D.; Estevez, A. Recent developments in the essential fatty acid nutrition of fish. Aquaculture 1999, 177, 191–199. [Google Scholar] [CrossRef]
- Carter, C.G.; Bransden, M.P.; Lewis, T.E.; Nichols, P.D. Potential of thraustochytrids to partially replace fish oil in Atlantic salmon feeds. Mar. Biotechnol. 2003, 5, 480–492. [Google Scholar] [CrossRef] [PubMed]
- Ganuza, E.; Benítez-Santana, T.; Atalah, E.; Vega-Orellana, O.; Ganga, R.; Izquierdo, M.S. Crypthecodinium Cohnii Schizochytrium Sp. Potential Substitutes Fish.-Deriv. Oils Seabream (Sparus Aurata) Microdiets. Aquac. 2008, 277, 109–116. [Google Scholar] [CrossRef]
- Faukner, J.; Rawles, S.D.; Proctor, A.; Sink, T.D.; Chen, R.; Philips, H.; Lochmann, R.T. The effects of diets containing standard soybean oil, soybean oil enhanced with conjugated linoleic acids, menhaden fish oil, or an algal docosahexaenoic acid supplement on channel catfish performance, body composition, sensory evaluation, and storage characteristics. N. Am. J. Aquac. 2013, 75, 252–265. [Google Scholar] [CrossRef]
- García-Ortega, A.; Kissinger, K.R.; Trushenski, J.T. Evaluation of fish meal and fish oil replacement by soybean protein and algal meal from Schizochytrium Limacinum Diets Giant Grouper Epinephelus Lanceolatus. Aquaculture 2016, 452, 1–8. [Google Scholar] [CrossRef]
- Kissinger, K.R.; García-Ortega, A.; Trushenski, J.T. Partial fish meal replacement by soy protein concentrate, squid and algal meals in low fish-oil diets containing Schizochytrium Limacinum Longfin Yellowtail Seriola Rivoliana. Aquaculture 2016, 452, 37–44. [Google Scholar] [CrossRef]
- Arney, B.; Liu, W.; Forster, I.P.; McKinley, R.S.; Pearce, C.M. Feasibility of dietary substitution of live microalgae with spray-dried Schizochytrium Sp. Spirulina Hatch. Cult. Juv. Pac. Geoduck Clam (Panopea Generosa). Aquaculture 2015, 444, 117–133. [Google Scholar] [CrossRef]
- De la Peña, M.R.; Teruel, M.B.; Oclarit, J.M.; Amar, M.J.A.; Ledesma, E.G.T. Use of thraustochytrid Schizochytrium Sp. Source Lipid Fat. Acid A Formul. Diet Abalone Haliotis Asinina (Linnaeus) Juv. Aquacult. Int. 2016, 24, 1103–1118. [Google Scholar] [CrossRef]
- Barclay, W.; Zeller, S. Nutritional enhancement of n-3 and n-6 fatty acids in rotifers and Artemia Naupl. Feed. Spray-Dried Schizochytrium Sp. J. World Aquacult. Soc. 1996, 27, 314–322. [Google Scholar] [CrossRef]
- Harel, M.; Koven, W.; Lein, I.; Bar, Y.; Behrens, P.; Stubblefield, J.; Zohar, Y.; Place, A.R. Advanced DHA, EPA and ArA enrichment materials for marine aquaculture using single cell heterotrophs. Aquaculture 2002, 213, 347–362. [Google Scholar] [CrossRef]
- Estudillo-del Castillo, C.; Gapasin, R.S.; Leaño, E.M. Enrichment potential of HUFA-rich thraustochytrid Schizochytrium Mangrovei Rotifer Brachionus Plicatilis. Aquaculture 2009, 293, 57–61. [Google Scholar] [CrossRef]
- Pacheco-Vega, J.M.; Cadena-Roa, M.A.; Ascencio, F.; Rangel-Dávalos, C.; Rojas-Contreras, M. Assessment of endemic microalgae as potential food for Artemia Fr. Cult. Lat. Am. J. Aquat. Res. 2015, 43, 23–32. [Google Scholar] [CrossRef]
- Conceição, L.E.C.; Yúfera, M.; Makridis, P.; Morais, S.; Dinis, M.T. Live feeds for early stages of fish rearing. Aquacult. Res. 2010, 41, 613–640. [Google Scholar] [CrossRef]
- Monyem, A.; Canakci, M.; Van Gerpen, J.H. Investigation of biodiesel thermal stability under simulated in-use conditions. Appl. Eng. Agric. 2000, 16, 373–378. [Google Scholar] [CrossRef]
- Knothe, G. Some aspects of biodiesel oxidative stability. Fuel Process. Technol. 2007, 88, 669–677. [Google Scholar] [CrossRef]
- Plackett, R.; Burman, J.P. The design of optimum multifactorial experiments. Biometrika 1946, 33, 305–325. [Google Scholar] [CrossRef]
- Hastie, T.J.; Pregibon, D. Generalized linear models. In Statistical Models in S; Chamber, J.M., Hastie, T.J., Eds.; Wadsworth & Brooks/Cole: Pacific Grove, CA, USA, 1992. [Google Scholar]
- R Core Team. R: A Language and Environment for Statistical Computing; R Foundation for Statistical Computing: Vienna, Austria, 2018. [Google Scholar]
- Bligh, E.G.; Dyer, W.J. A rapid method of total lipid extraction and purification. Can. J. Biochem. Physiol. 1959, 37, 911–917. [Google Scholar] [CrossRef] [PubMed]
- Sambrook, J.; Russell, D.W. Molecular Cloning: A Laboratory Manual; Cold Spring Harbor Laboratory Press: Cold Spring Harbor, NY, USA, 2001. [Google Scholar]
- Gunderson, J.H.; Elwood, H.; Ingold, A.; Kindle, K.; Sogin, M.L. Phylogenetic relationships between chlorophytes, chrysophytes, and oomycetes. Proc. Natl. Acad. Sci. USA 1987, 84, 5823–5827. [Google Scholar] [CrossRef] [PubMed]
- Benson, D.A.; Clark, K.; Karsch-Mizrachi, I.; Lipman, D.J.; Ostell, J.; Sayers, E.W. GenBank. Nucleic Acids Res. 2014, 43, D30–D35. [Google Scholar] [CrossRef] [PubMed] [Green Version]
- Altschul, S.F.; Gish, W.; Miller, W.; Myers, E.W.; Lipman, D.J. Basic local alignment search tool. J. Mol. Biol. 1990, 215, 403–410. [Google Scholar] [CrossRef]
- Katoh, K.; Kuma, K.I.; Toh, H.; Miyata, T. MAFFT version 5: Improvement in accuracy of multiple sequence alignment. Nucleic Acids Res. 2005, 33, 511–518. [Google Scholar] [CrossRef] [PubMed]
- Schwarz, G. Estimating the dimension of a model. Ann. Stat. 1978, 6, 461–464. [Google Scholar] [CrossRef]
- Tamura, K.; Peterson, D.; Peterson, N.; Stecher, G.; Nei, M.; Kumar, S. MEGA5: Molecular evolutionary genetics analysis using maximum likelihood, evolutionary distance, and maximum parsimony methods. Mol. Biol. Evol. 2011, 28, 2731–2739. [Google Scholar] [CrossRef] [PubMed]
- Felsenstein, J. Evolutionary trees from DNA sequences: A maximum likelihood approach. J. Mol. Evol. 1981, 17, 368–376. [Google Scholar] [CrossRef] [PubMed]
- Tamura, K.; Nei, M. Estimation of the number of nucleotide substitutions in the control region of mitochondrial DNA in humans and chimpanzees. Mol. Biol. Evol. 1993, 10, 512–526. [Google Scholar] [CrossRef]
- Kumar, S.; Stecher, G.; Li, M.; Knyaz, C.; Tamura, K. MEGA X: Molecular evolutionary genetics analysis across computing platforms. Mol. Biol. Evol. 2018, 35, 1547–1549. [Google Scholar] [CrossRef]


| Factor | Acronym | Unit | Df | Sum Sq | Mean Sq | F value | value | |
|---|---|---|---|---|---|---|---|---|
| Natural seawater | SW | % vs. dHO | 1 | 0.1659 | 0.1659 | 1.227 | 0.3184 | |
| Glucose | Glu | g/L | 1 | 0.7737 | 0.7737 | 5.723 | 0.0622 | |
| Yeast extract | Y | g/L | 1 | 1.6435 | 1.6435 | 12.157 | 0.0175 | |
| Peptone | PT | g/L | 1 | 0.3863 | 0.3863 | 2.857 | 0.1518 | |
| KHPO | KP | g/L | 1 | 0.1321 | 0.1321 | 0.977 | 0.3683 | |
| Starting pH- value | pH | pH | 1 | 0.6613 | 0.6613 | 4.891 | 0.0779 | |
| Residuals | 5 | 0.676 | 0.1352 |
| Nitrogen | Df | Sum Sq | Mean Sq | F value | value |
|---|---|---|---|---|---|
| Nitrogen source | 1 | 8.281 | 8.281 | 20.610 | 0.0019 |
| Nitrogen formula | 6 | 2.415 | 0.403 | 1.002 | 0.4843 |
| Residuals | 8 | 3.214 | 0.402 | ||
| Carbon | |||||
| Carbon source | 1 | 1.764 | 1.7642 | 7.291 | 0.0223 |
| Concentration | 8 | 3.486 | 0.4358 | 1.801 | 0.1891 |
| Residuals | 10 | 2.42 | 0.242 |
| Factor | Low | High |
|---|---|---|
| Natural seawater | 10 | 40 |
| Glucose | 10 | 50 |
| Yeast extract | 3 | 8 |
| Peptone | 3 | 8 |
| KHPO | 0 | 0.1 |
| Tween 80 | 0 | 0.1 |
| Starting pH-value | 6 | 8 |
| Run | SW | Glu | Y | PT | KP | NH |
|---|---|---|---|---|---|---|
| 1 | 1 | −1 | 1 | −1 | −1 | 1 |
| 2 | 1 | 1 | −1 | 1 | −1 | −1 |
| 3 | −1 | 1 | 1 | −1 | 1 | −1 |
| 4 | 1 | −1 | 1 | 1 | −1 | −1 |
| 5 | 1 | 1 | −1 | 1 | 1 | 1 |
| 6 | 1 | 1 | 1 | −1 | 1 | −1 |
| 7 | −1 | 1 | 1 | 1 | −1 | 1 |
| 8 | −1 | −1 | 1 | 1 | 1 | 1 |
| 9 | −1 | −1 | −1 | 1 | 1 | −1 |
| 10 | 1 | −1 | −1 | −1 | 1 | 1 |
| 11 | −1 | 1 | −1 | −1 | −1 | 1 |
| 12 | −1 | −1 | −1 | −1 | −1 | −1 |
© 2019 by the authors. Licensee MDPI, Basel, Switzerland. This article is an open access article distributed under the terms and conditions of the Creative Commons Attribution (CC BY) license (http://creativecommons.org/licenses/by/4.0/).
Share and Cite
Stefánsson, M.Ö.; Baldursson, S.; Magnússon, K.P.; Eyþórsdóttir, A.; Einarsson, H. Isolation, Characterization and Biotechnological Potentials of Thraustochytrids from Icelandic Waters. Mar. Drugs 2019, 17, 449. https://doi.org/10.3390/md17080449
Stefánsson MÖ, Baldursson S, Magnússon KP, Eyþórsdóttir A, Einarsson H. Isolation, Characterization and Biotechnological Potentials of Thraustochytrids from Icelandic Waters. Marine Drugs. 2019; 17(8):449. https://doi.org/10.3390/md17080449
Chicago/Turabian StyleStefánsson, Magnús Örn, Sigurður Baldursson, Kristinn P. Magnússon, Arnheiður Eyþórsdóttir, and Hjörleifur Einarsson. 2019. "Isolation, Characterization and Biotechnological Potentials of Thraustochytrids from Icelandic Waters" Marine Drugs 17, no. 8: 449. https://doi.org/10.3390/md17080449