1. Introduction
At present, the shells of crabs and shrimps in marine arthropods are often ignored and underutilized, which are important sources of chitin. After a series of compound chemical treatments, chitosan and chitosan oligosaccharides are obtained, which have important application value in medical care and food [
1]. Chitosan oligosaccharide itself has a variety of physiological activities, such as antibacterial properties [
2,
3], anti-tumor properties [
4,
5], antioxidant [
3,
6] and anti-inflammatory effects [
7], etc. There are also studies using chitosan oligosaccharides as a drug carrier [
8,
9] or as a prebiotic to explore their influence on intestinal flora in different diseases [
10,
11]. It has also been revealed to have anti-diabetes [
12], anti-obesity [
13], anti-HIV-1 [
14], and anti-Alzheimer’s disease [
15] effects and promote calcium absorption [
16].
The excellent antioxidant properties of chitosan oligosaccharides have been the focus of related research, and it has been proven that it can reduce oxidative stress injury by scavenging free radicals and reactive oxygen species and maintaining the activity of antioxidant enzymes [
17,
18]. Therefore, the antioxidant properties of chitosan oligosaccharides can be identified from two aspects: the ability to scavenge free radicals and the ability to improve the level of antioxidant substances in vivo. However, the exact mechanism has not been explained. According to existing studies and the chemical structure of chitosan oligosaccharides, it is speculated that its amino group can combine with unstable free radicals to form a stable structure, which shows antioxidant properties.
Recent studies have indicated that the biological activity of chitosan oligosaccharides is primarily influenced by DP (degree of polymerization) and Mw (molecular weight). Therefore, it is difficult to determine which parts of chitosan oligosaccharides play a major role in biological activity [
19]. Although there is no exact evidence to directly show the relationship between chitosan oligosaccharides’ antioxidant properties and molecular weight, it is speculated from the existing relevant studies that a low molecular weight and a high degree of deacetylation can equip chitosan oligosaccharides with a better antioxidant effect [
20], and the relationship between the two needs to be further explored.
Currently, chitosan oligosaccharides available in the market are typically synthesized from monosaccharides or extracted from hydrolyzed products. Researchers selectively synthesize the necessary oligosaccharides through specific chemical or enzymatic reactions. However, the synthesis process involves numerous steps and is costly. Therefore, it is more convenient to extract chitosan oligosaccharides [
21,
22,
23]. Combined with the relationship between the properties of chitosan oligosaccharides and molecular weight, it is of great significance to narrow the molecular weight range through specific technical means, and even obtain chitosan oligosaccharides with a specific degree of polymerization. It is important not only to clarify the pharmacodynamic mechanism of chitosan oligosaccharides with different polymerization degrees but also to develop and utilize chitosan oligosaccharides more effectively. Due to the small difference in charge density and molecular weight between chitosan oligosaccharide monomers, the separation and purification of chitosan oligosaccharides are very challenging, especially when the degree of polymerization is greater than 4. This makes it a hotspot in the field of sugar science.
In the existing research, many methods for recovering and purifying chitosan oligosaccharides, such as gel filtration or size exclusion chromatography, have been found to purify and obtain specific chitosan oligosaccharides, and the molecular weight difference between different polymerization degrees of chitosan oligosaccharides is the basis for separation. It has been reported that chitosan oligosaccharides with a polymerization degree of 2–6 were separated from the hydrolysate of chitosan by gel filtration chromatography and ion exchange chromatography [
24]. In an experiment of enzymatic hydrolysis of chitosan, the separation ability of size-exclusion chromatography (SEC) was used to help researchers fully understand the composition of the enzymatic hydrolysate [
25]. Ultrafiltration [
26] and nanofiltration [
27] are also applied to the purification of chitosan oligosaccharides. Ion exchange chromatography [
28] and metal affinity chromatography [
29] are also widely used to detect and separate chitosan oligosaccharides.
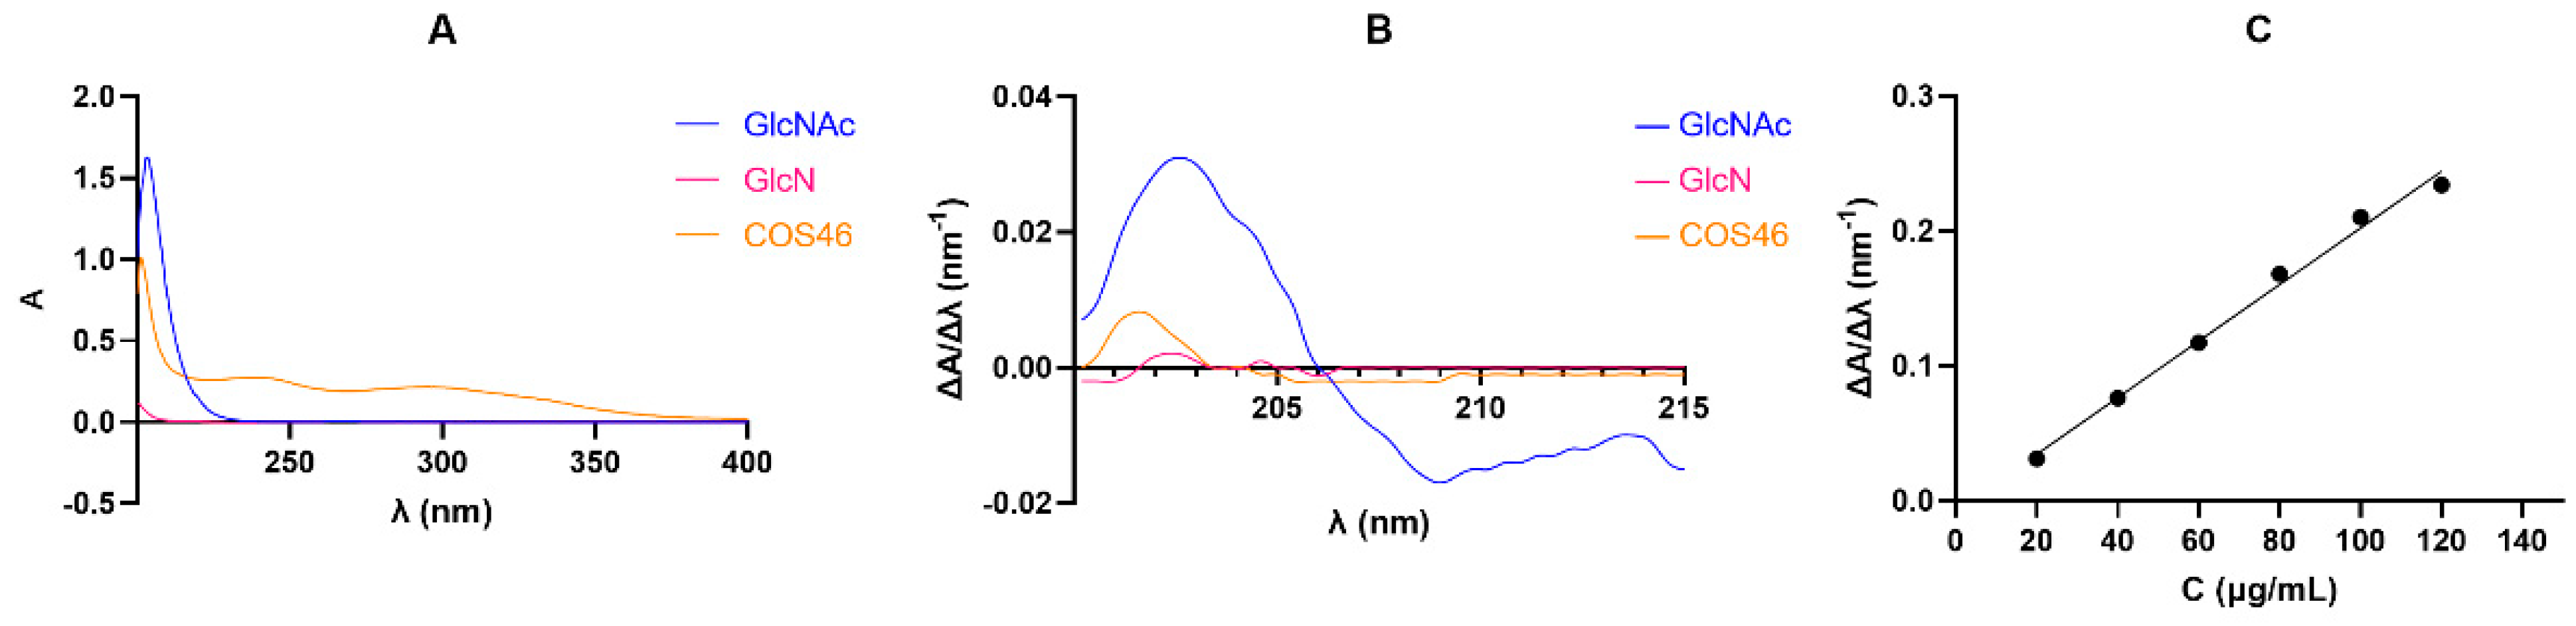
High-performance liquid chromatography (HPLC) is often used for chitosan oligosaccharide analysis and purification [
30]. HPLC is often combined with an ultraviolet detector, and the acetyl amino group of chitosan oligosaccharides can form a conjugated structure with the sugar ring, and the absorbance of chitosan oligosaccharides can be detected at a wavelength of approximately 210 nm. A differential refraction detector is preferred for the HPLC analysis of N-acetylated and N-deacetylated chitosan oligosaccharides, but its sensitivity is low and it is not suitable for gradient washing [
31]. It is difficult to separate chitosan oligosaccharides by conventional HPLC, mainly because of its strong hydrophilicity and poor retention on HPLC columns [
32]. Hydrophilic-interaction chromatography (HILIC) is a technique that can effectively separate polar and hydrophilic compounds. Some studies have successfully separated and purified chitosan oligosaccharides with a polymerization degree of 2–6 from a chitosan oligosaccharides mixture by using HILIC technology and used it to judge the influence of each component on RSC96 cells [
32].
N- acetyl chitotriose and N, N’- diacetyl chitotriose can be separated from acetylated chitotriose by a cation exchange gel column [
21]. For partially acetylated chitosan oligosaccharides, HPLC-ESI-MS can be used for separation and detection [
33].
Capillary Electrophoresis (CE) has the advantage of high separation ability. Compared with HPLC, it has the characteristics of less sample loading, but it is precisely because of the small sample loading that a large number of chitosan oligosaccharides cannot be obtained by CE technology. When used to separate and detect chitosan oligosaccharides, electrophoretic mobility depends on the number of unit structures in an acidic aqueous solution, which is similar to other oligomeric electrolytes [
28,
34]. In many studies, chitosan oligosaccharides have been successfully separated using this technique [
34,
35].
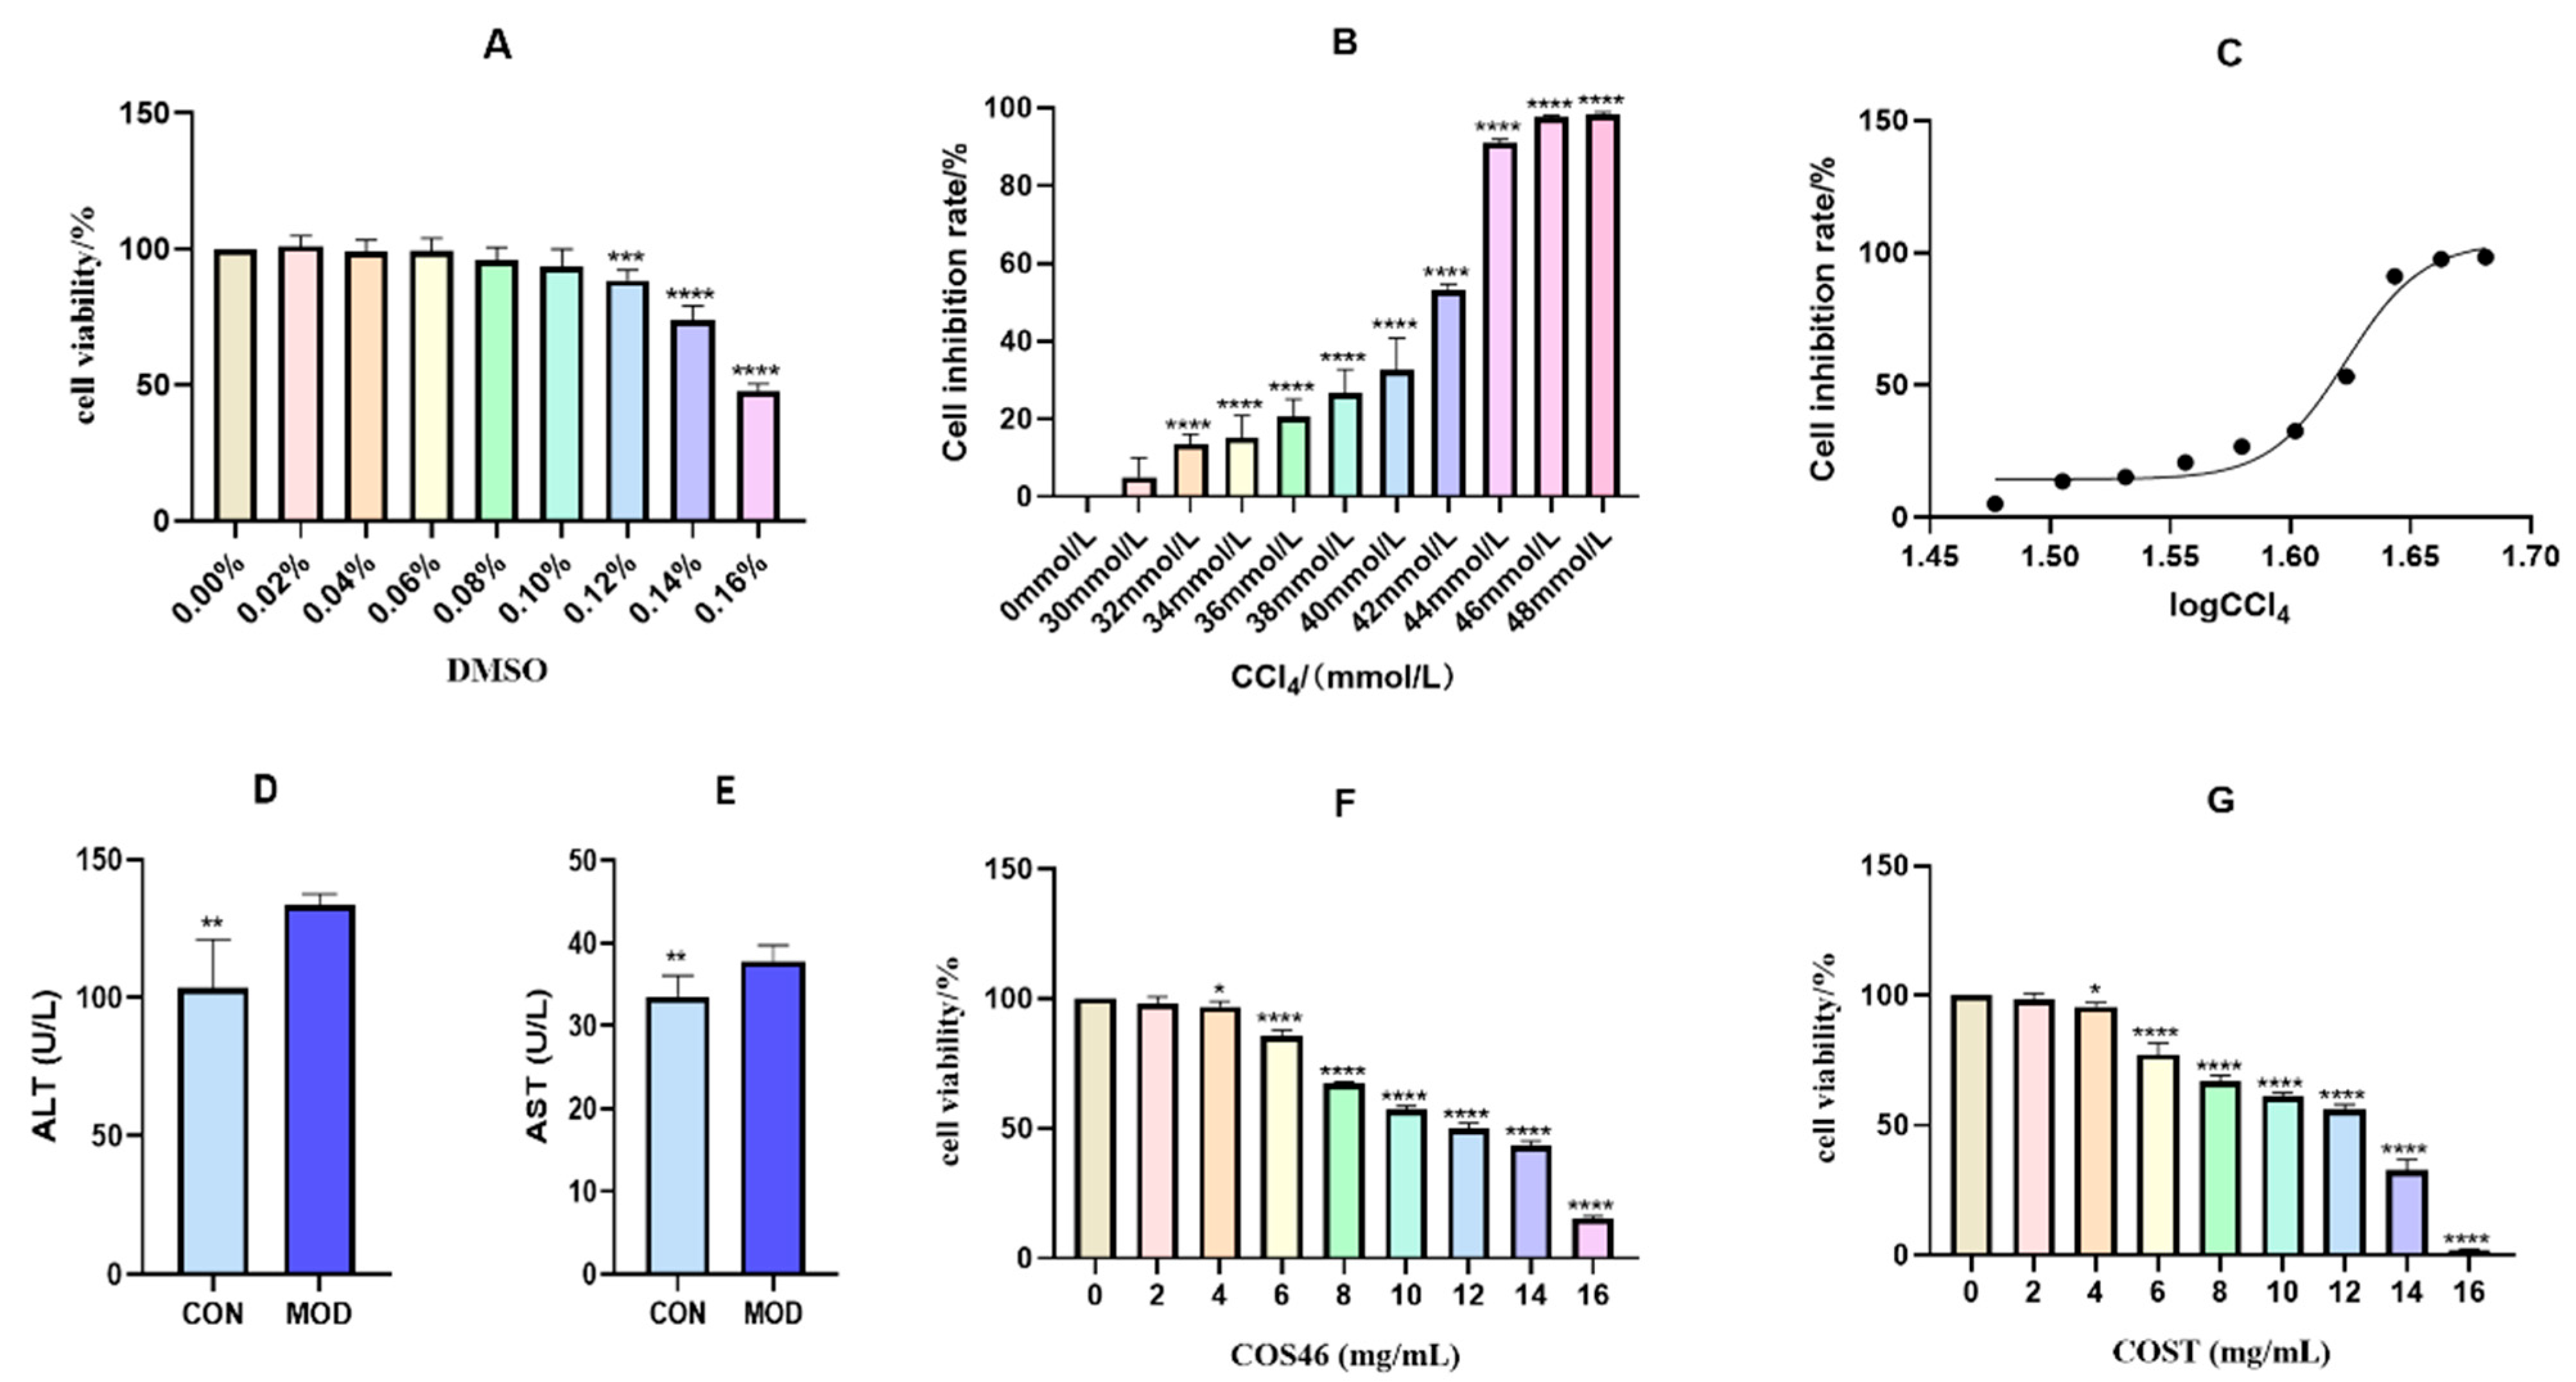
CCl
4 is a typical substance with hepatotoxicity, which will remove halogen atoms in liver microsomes through a redox reaction to generate the trichloromethyl radical and its derivative trichloromethyl peroxyradical active intermediate. These free radicals bind to phospholipid molecules on the endoplasmic reticulum (ER) through covalent bonds. This can inhibit protein synthesis, destroy the function and morphology of the cell membrane, and cause hepatotoxicity, fibrosis, lipid peroxidation, and ERS (Endoplasmic reticulum stress) reaction [
36,
37].
Acute liver injury induced by CCl
4 in animals is very similar to acute chemical liver injury in humans, so it is widely used in the study of potential hepatoprotective drug activity [
38]. CCl
4 not only exerts strong toxicity on the liver but also causes damage to other parts of the body [
39], including the kidneys [
40], nervous system [
41], and testes [
42].
Currently, there is no research on the role of DP4-6 chitosan oligosaccharides in liver metabolic diseases. This paper proposes a hypothesis that the antioxidant properties of chitosan oligosaccharides are related to their molecular weight. It is speculated that low-molecular-weight chitosan oligosaccharides have a better protective effect on the liver. The paper also describes the process of obtaining DP4-6 chito-oligosaccharides by separating and purifying COST and named the product COS46. The hypothesis was confirmed through cell and animal experiments. The study investigated the difference in antioxidant properties and efficacy of COST in protecting against liver injury before and after separation. These findings are expected to aid in the further development and utilization of chitosan oligosaccharides.
4. Discussions and Conclusions
Traditionally, chitosan oligosaccharides are a mixture prepared from chitin or chitosan. When using such chitosan oligosaccharides to explore their biological activity, the repeatability of the experiment is poor, and the results may be divided, so the study of separating chitosan oligosaccharides will definitely become a trend in the future. In addition, because chitosan oligosaccharides with different polymerization degrees have different biological activities [
44], a detailed study on chitosan oligosaccharides with different polymerization degrees is conducive to the safer and more reasonable use of chitosan oligosaccharides and will further expand the application scope of chitosan oligosaccharides.
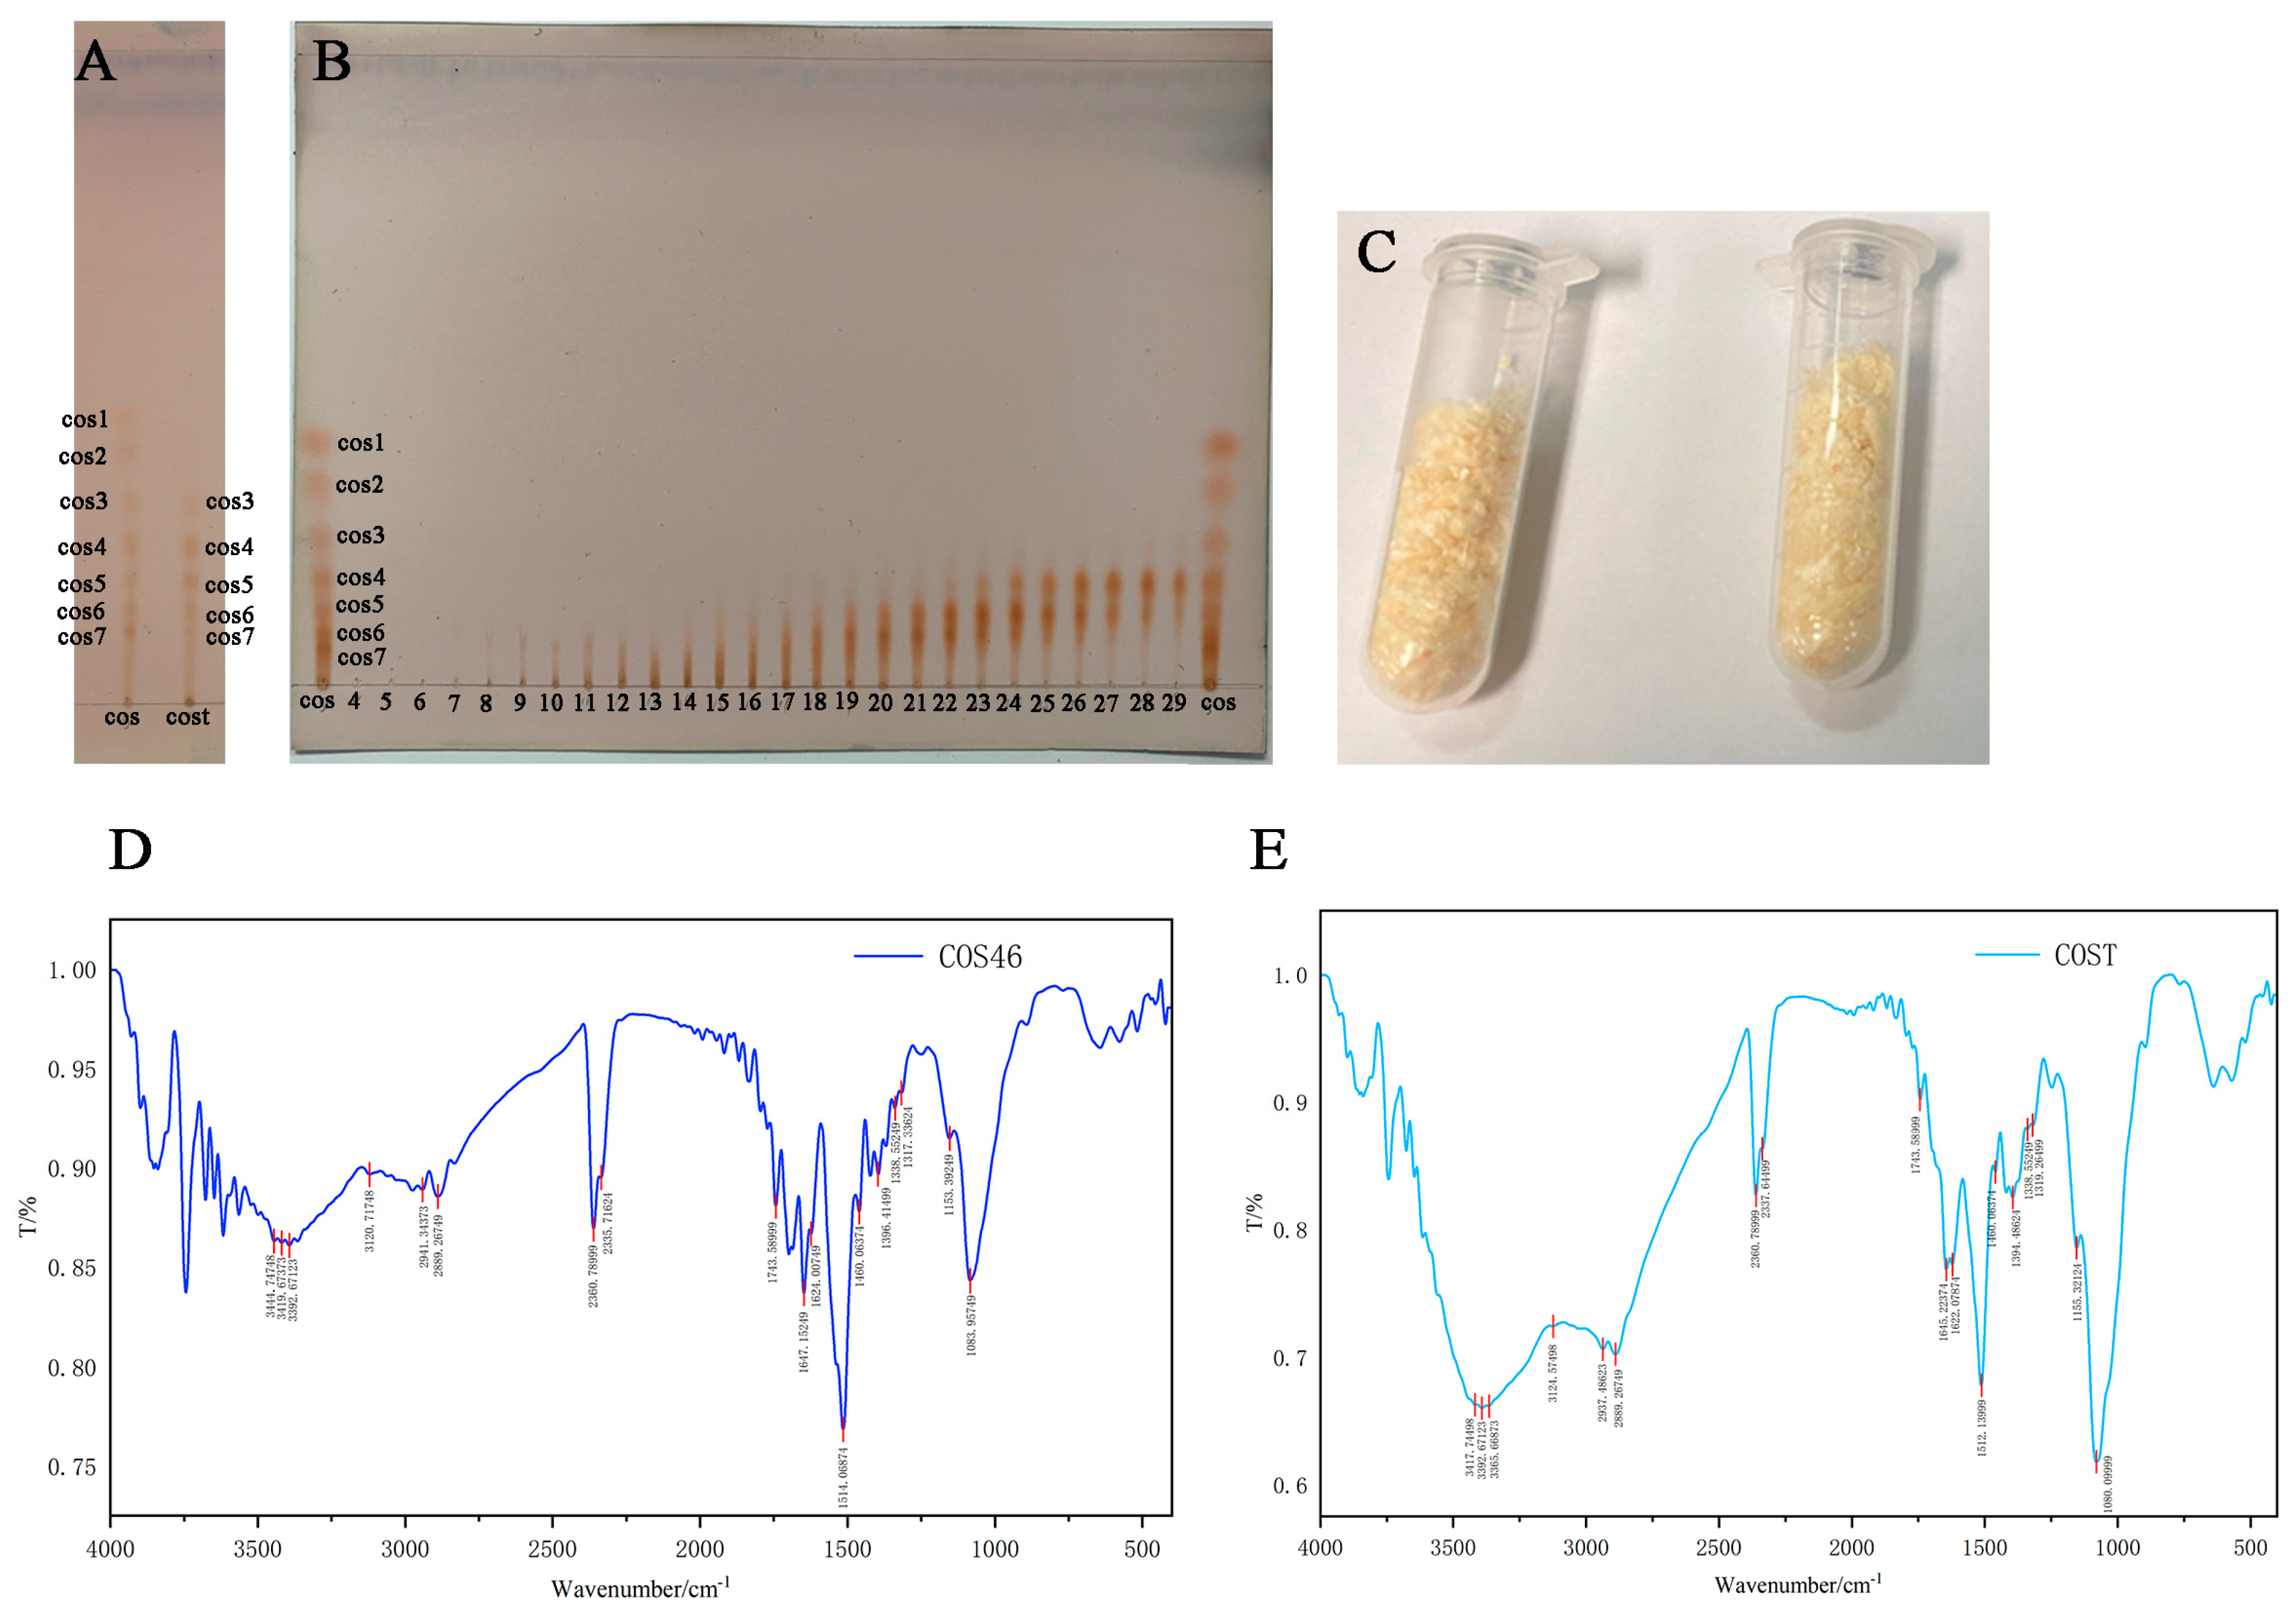
In this study, COS46 contains a tetramer, a pentamer, and a hexamer, and it is regarded as a whole as the research object, and the effect of each component is not analyzed in detail. However, according to the results provided by TLC, G-15 was selected as chromatographic column packing, according to its retention effect on chitosan oligosaccharides with different molecular weights. Reevaluating the height, diameter, and flow rate of the packing, it is possible to further separate the three components (COS4, COS5, and COS6) of COS46.
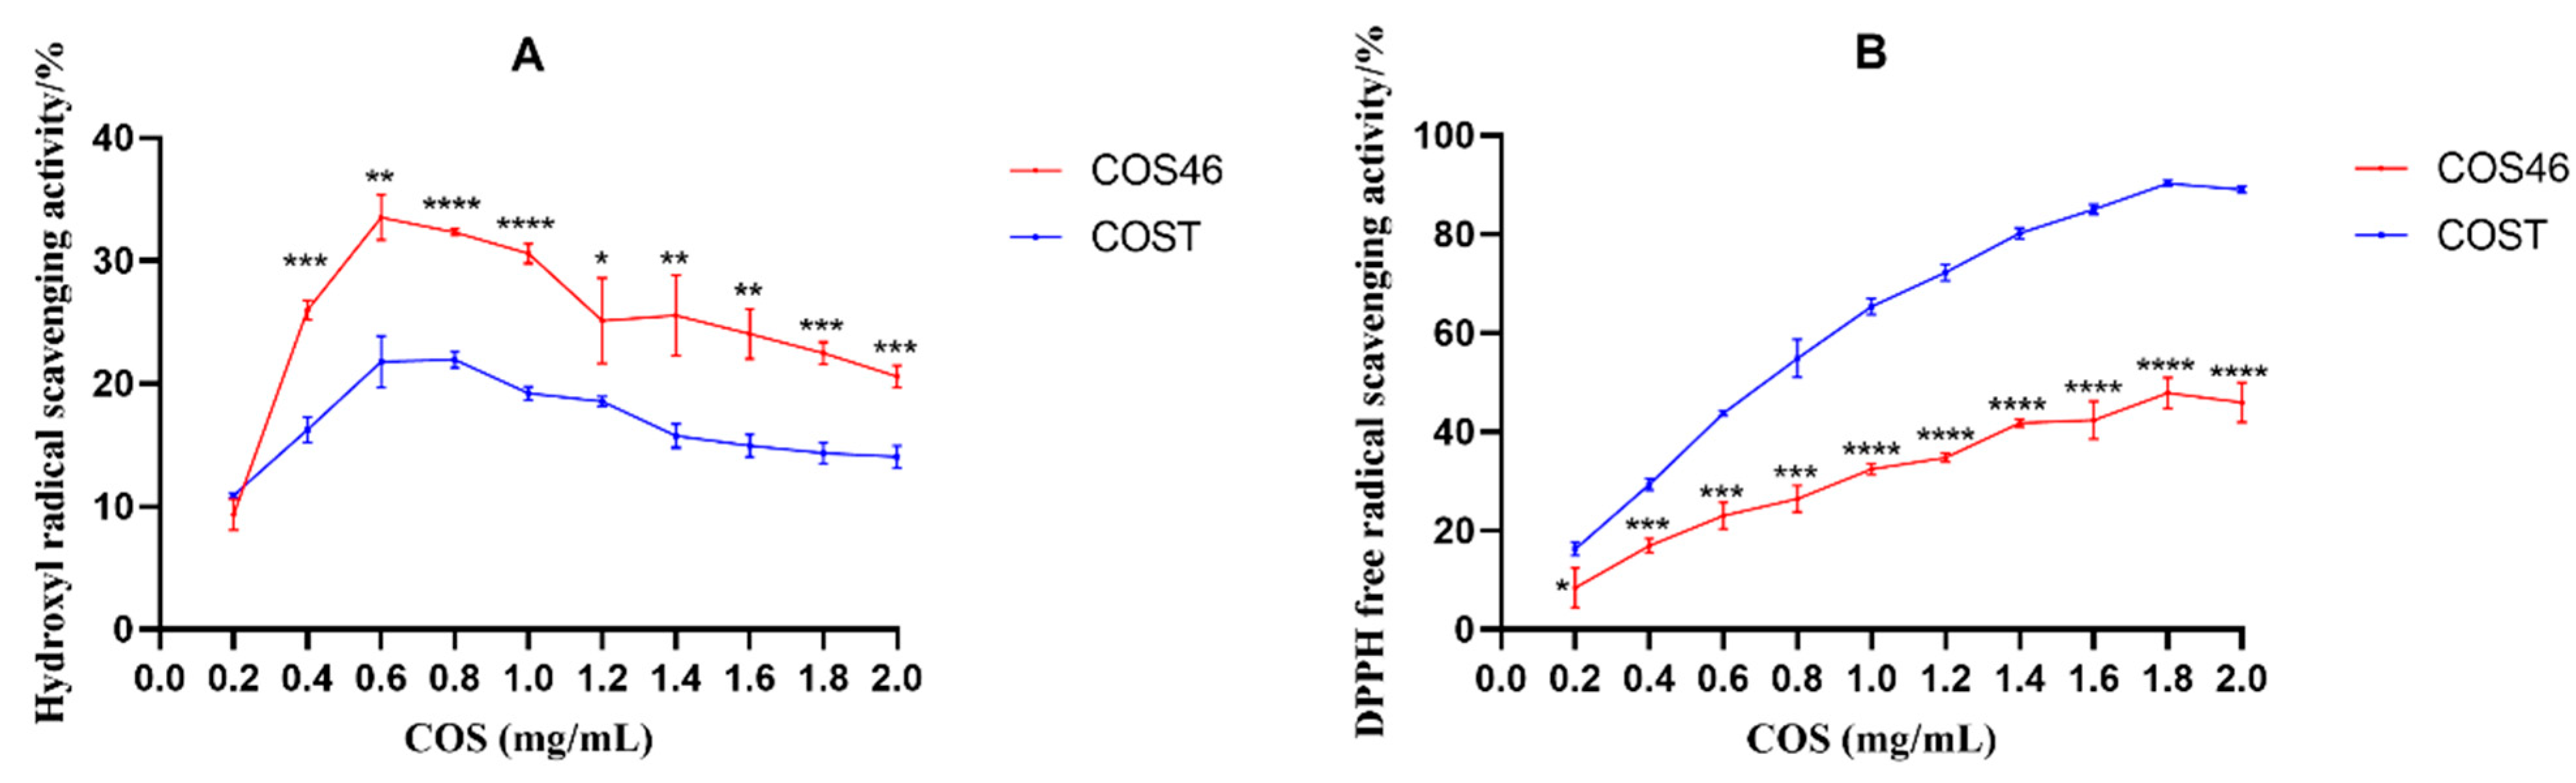
During the antioxidant activity test, it was observed that chito-oligosaccharides, both before and after separation, demonstrated a superior scavenging ability of free radicals. Hydroxyl free radicals, which are considered harmful to the human body, can form within the body. COS46 was found to be more effective in scavenging hydroxyl free radicals. When foreign substances stimulate the human body, hydrogen peroxide is produced. This then reacts with Fe
2+ to generate reactive oxygen through the Fenton reaction. It is speculated that COS46 can chelate with Fe2+ more effectively to prevent their reaction [
45,
46]. Therefore, COS46 may have more potential as an antioxidant.
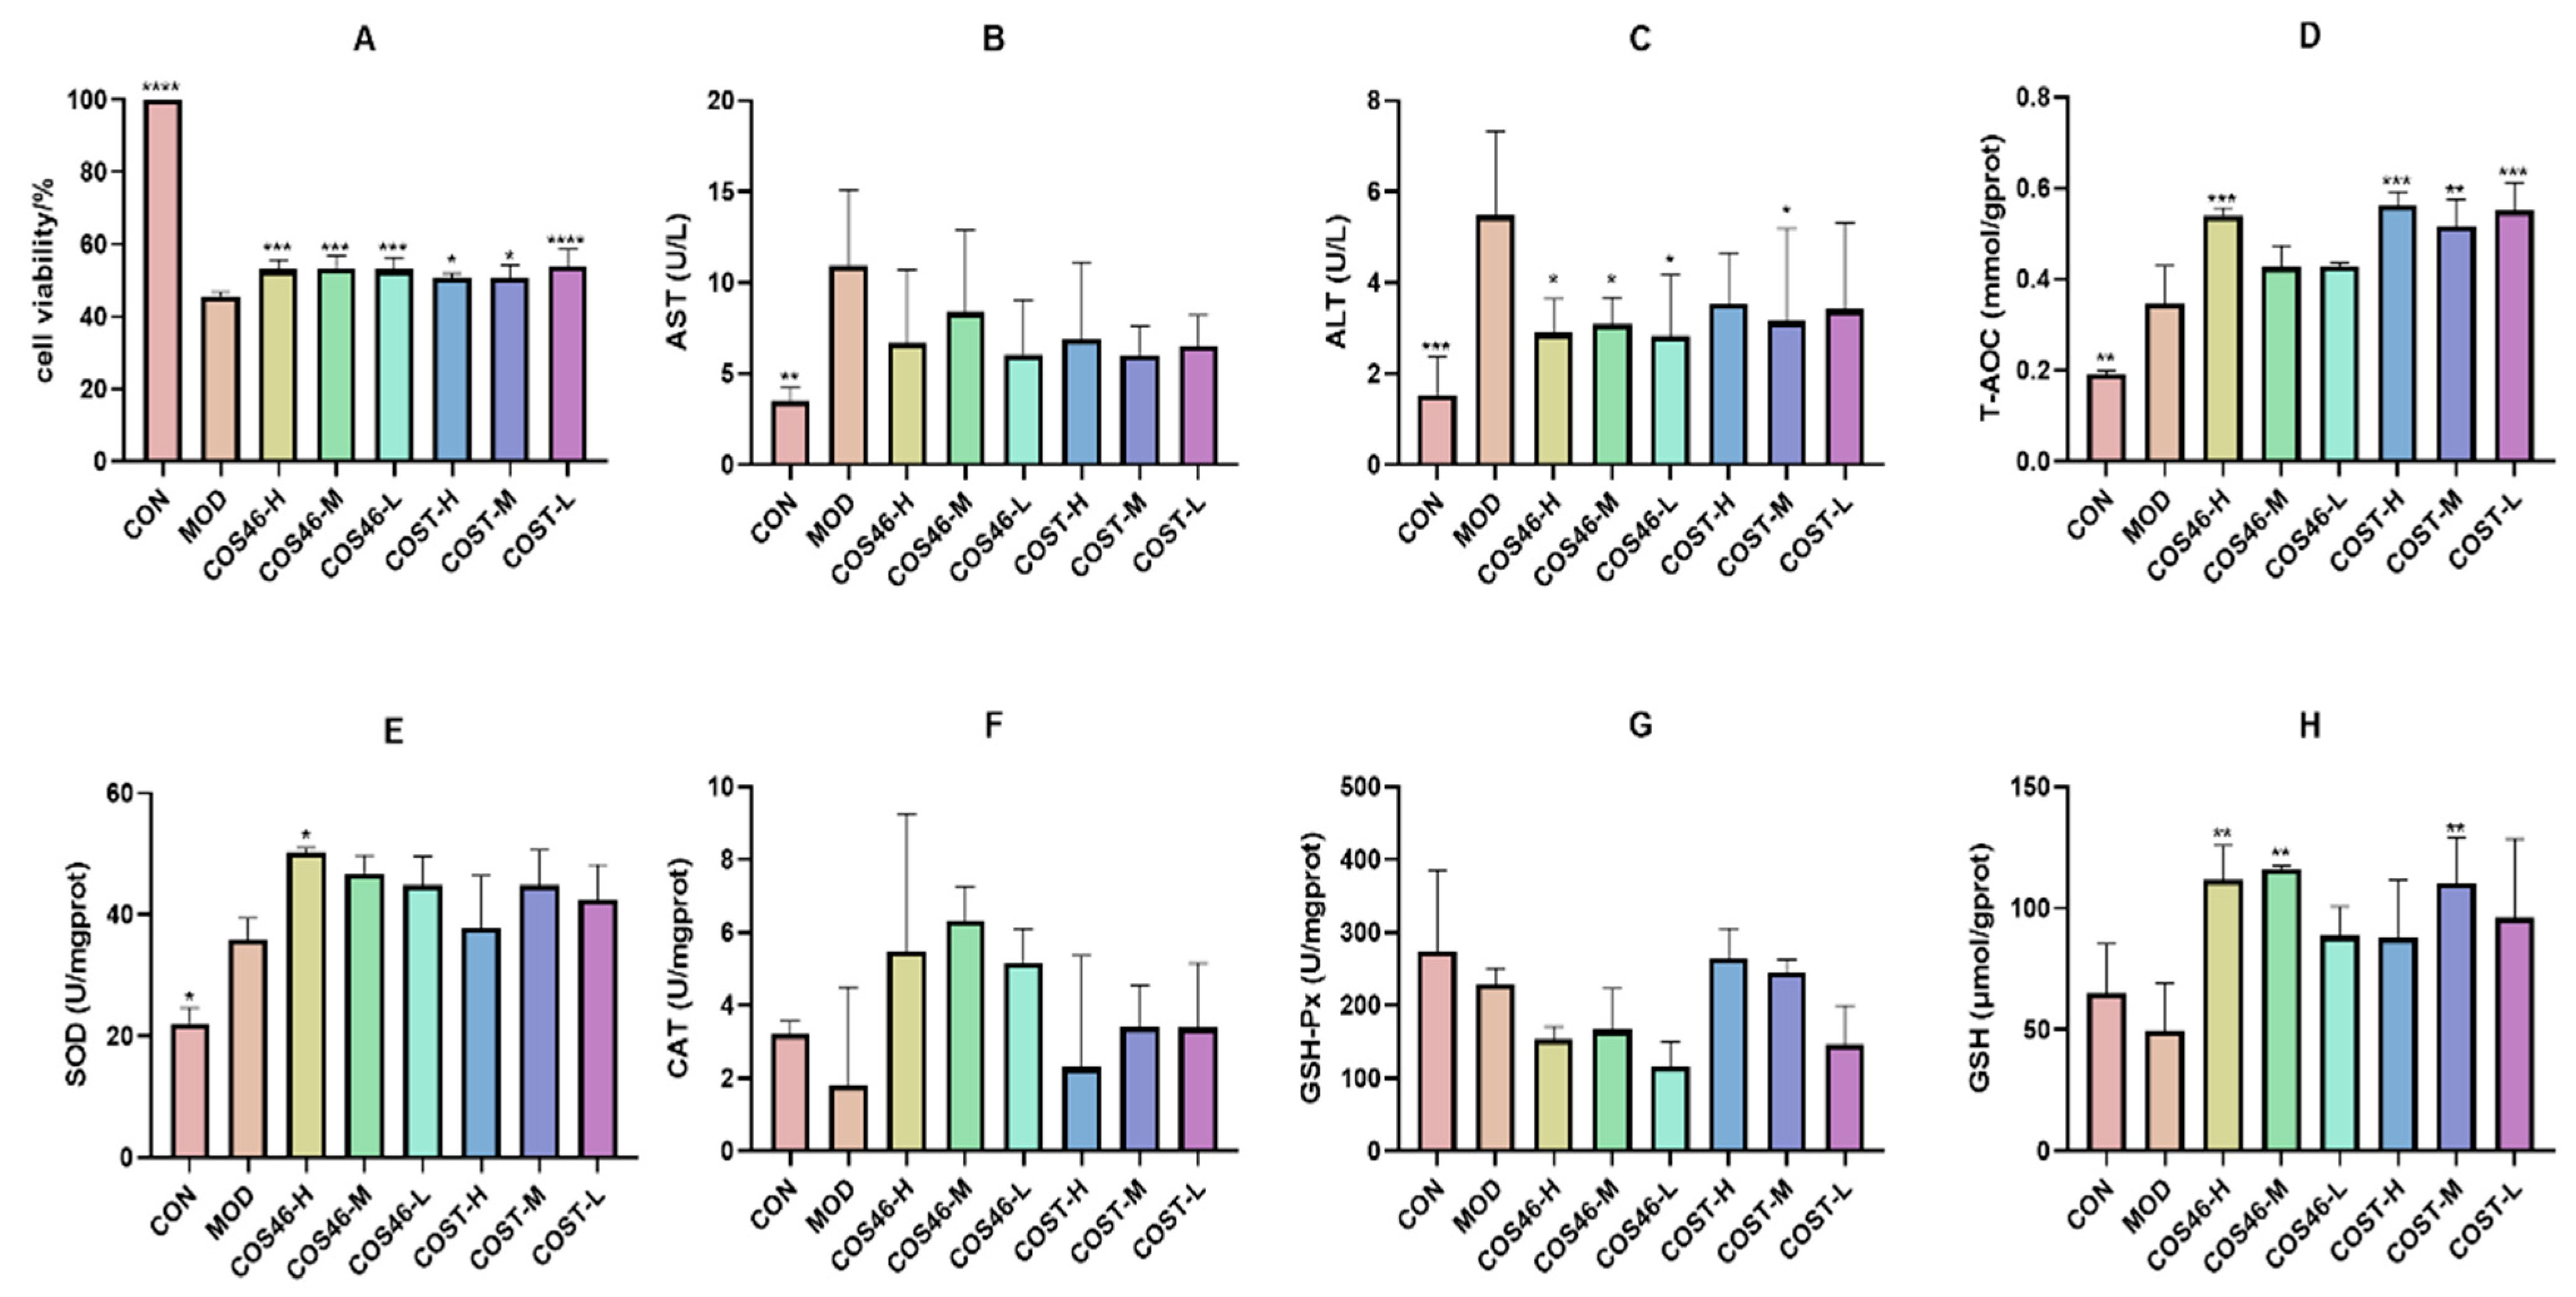
After using CCl4 to establish liver injury modeling, this experiment only explored the effects of COST and COS46 on L02 hepatocyte injury, antioxidant and oxidative effects, and effects on the Keap-1/Nrf2/HO-1 pathway in L02 hepatocytes. The change in related indexes after drug administration was not discussed further. Based on the experiment, it was found that SOD and CAT enzyme activities were higher in the cell administration groups compared to the CON group. This, combined with the existing research, suggests that COS46 and COST treatment may activate the signaling pathway, increase the expression of related antioxidant proteins, and improve the activity of SOD, CAT, and other antioxidant enzymes to some extent. When cells are exposed to toxic substances, they can quickly develop protective mechanisms to reduce damage and prevent cell death. The MOD group showed higher T-AOC and SOD indexes compared to the CON group. This may be due to the insufficient concentration of CCl4 used in the liver toxicity model to cause cell death in all cells, and the surviving cells were able to respond positively and significantly improve their enzyme activity, allowing them to survive in the presence of CCl4.
Many studies have verified the protective effect of chitosan oligosaccharides on the liver [
47,
48,
49]. However, their administration time is usually more than 4 weeks, and studies on the short-term effect of chitosan oligosaccharides are very rare. Therefore, in animal experiments, we chose to verify the protective effect of administration for one week on acute liver injury.
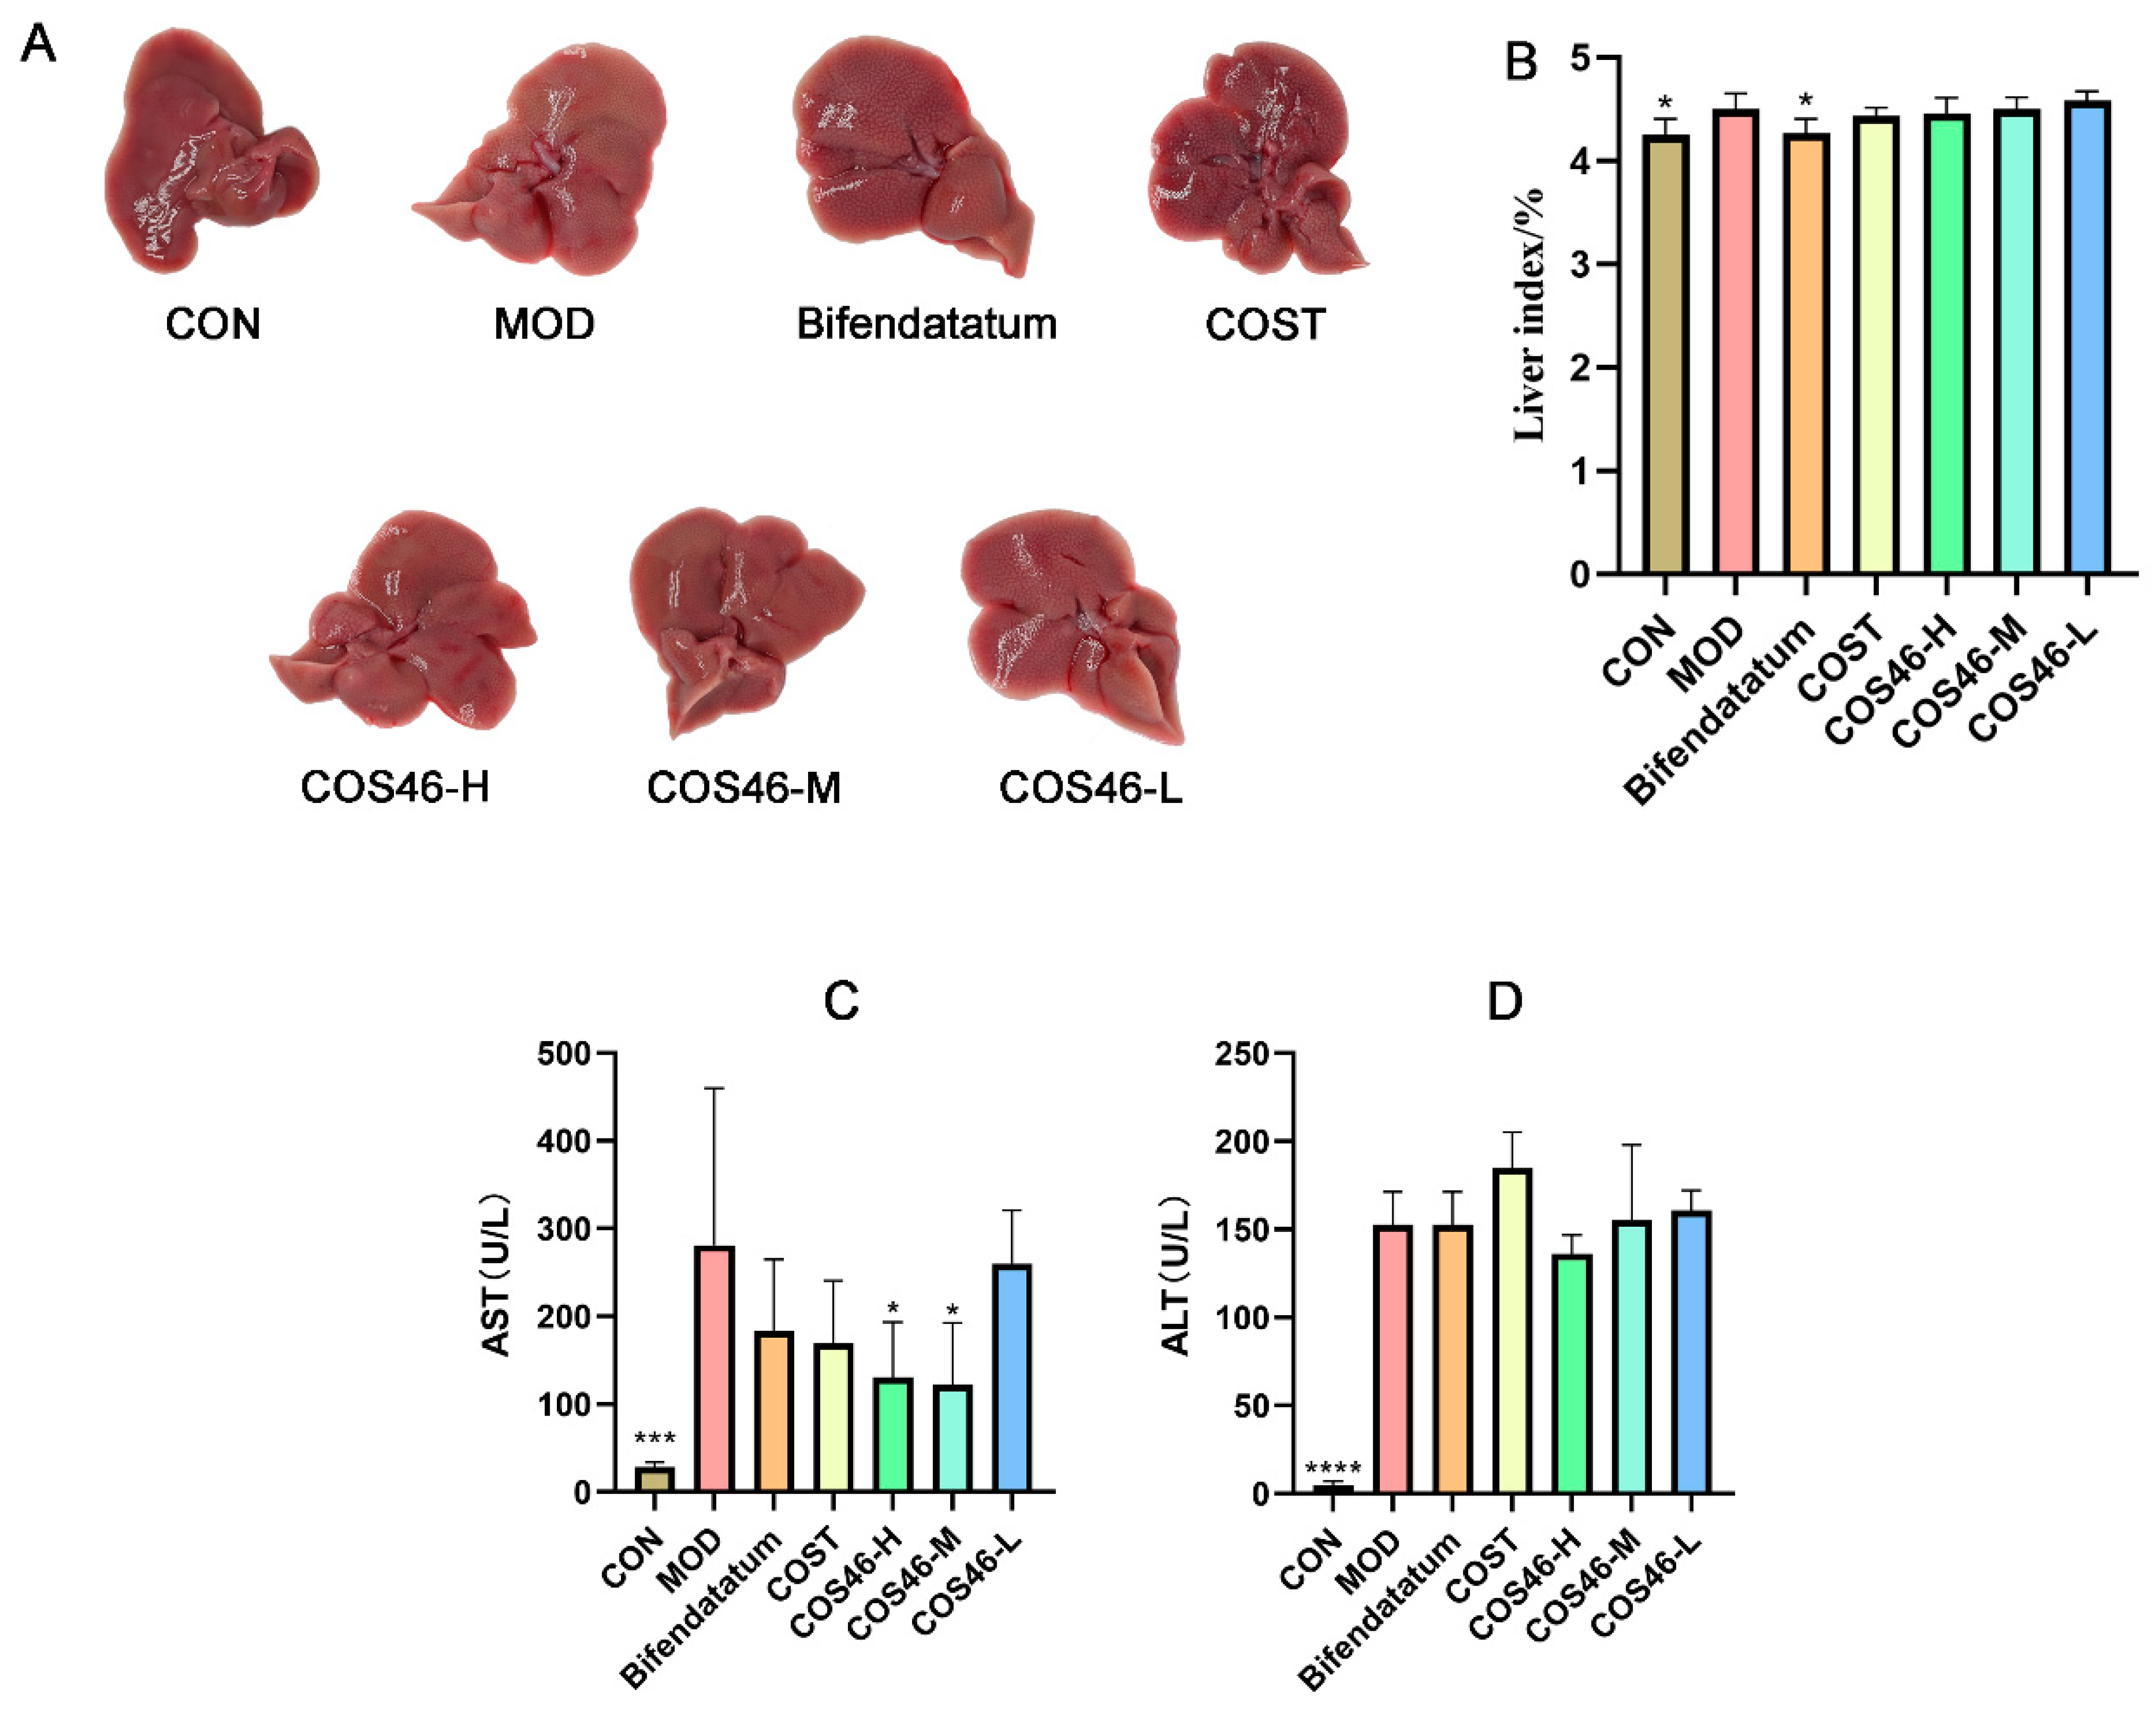
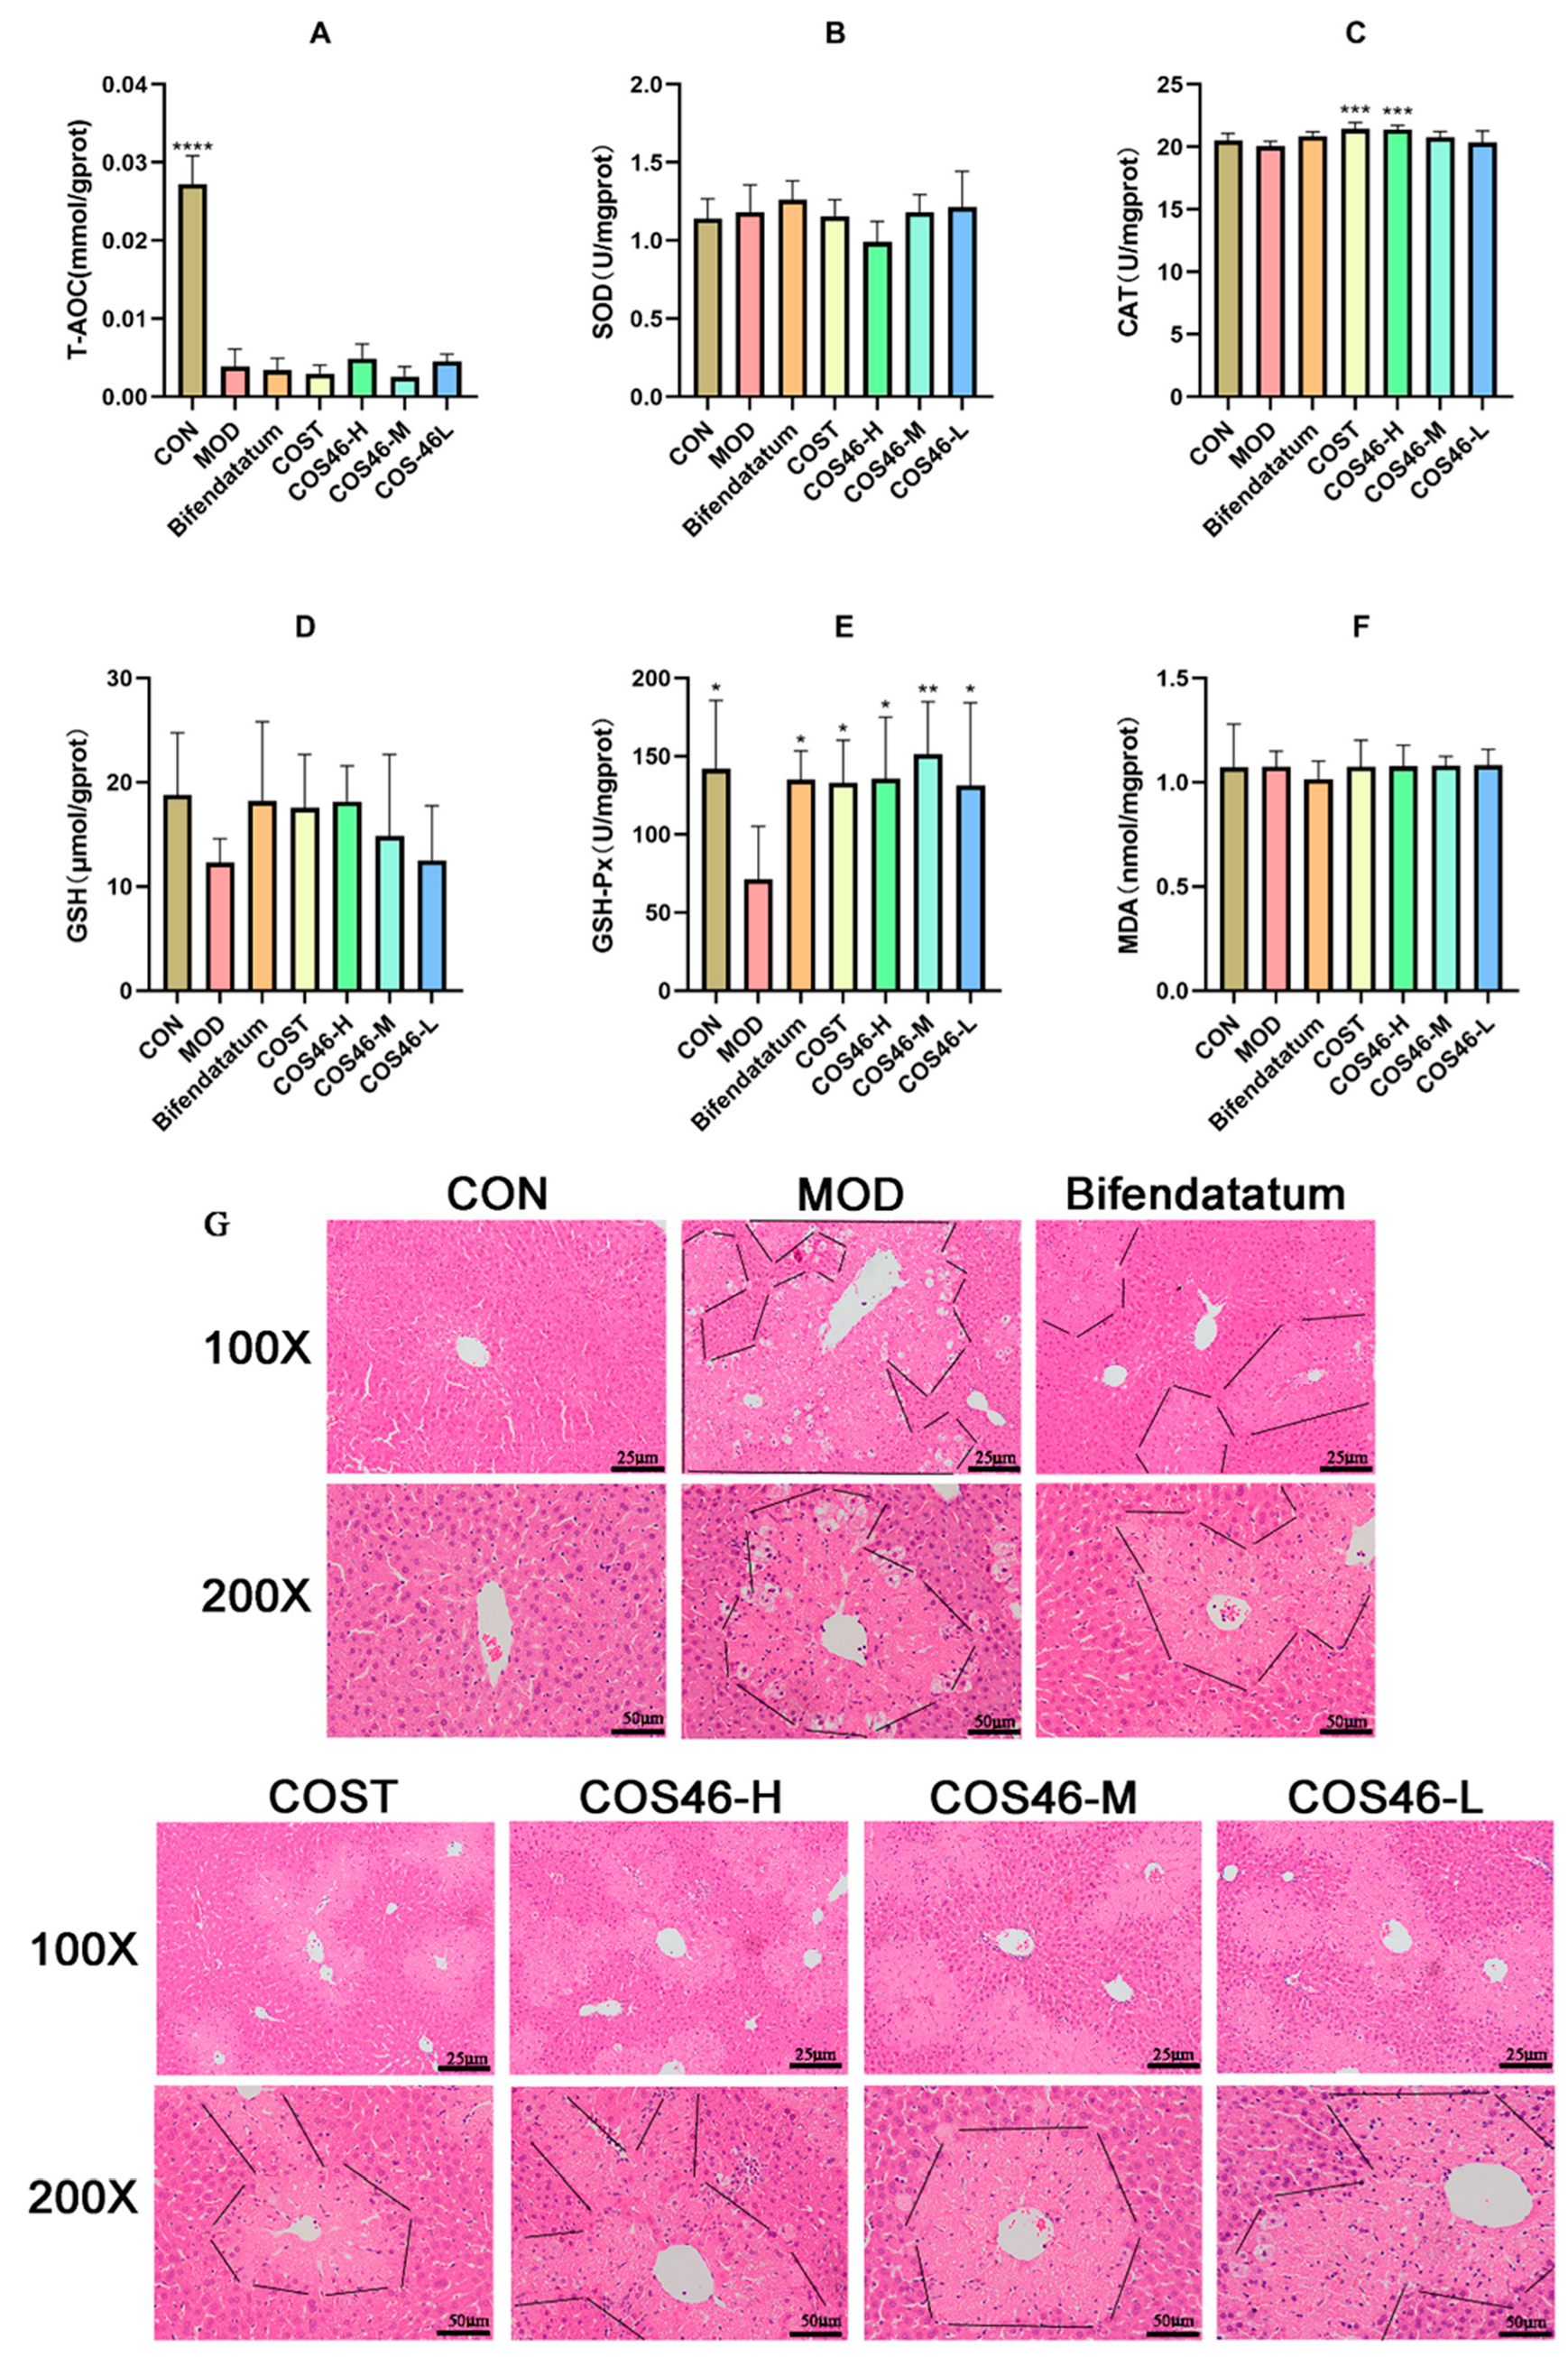
After seven days of pretreatment and gavage with CCl4, the MOD group of mice exhibited liver damage, including an increased liver index, apparent granulation, and elevated serum AST and ALT levels. Each administration group was able to alleviate the injury’s deterioration. Additionally, it was observed that administration could reverse the effects of CCl4, leading to a reduction in liver GSH and Gsh-Px content and resistance to oxidative damage. However, the detection of related oxidation indexes yielded slightly different trends between the results of the cell experiment and the animal experiment. It is speculated that there may be differences between human hepatocytes and mouse cells in vitro, resulting in varying sensitivities to drugs and a slight deviation in the experimental results of the two cell types. It is also possible that the administration time in animal experiments is insufficient, which shows that chitosan oligosaccharides can only be used as a dietary supplement for a long time, and its short-term liver protection effect is not significant enough.
In summary, this paper demonstrates that the process of obtaining COS46 through GPC separation and purification has good process stability and high product purity. This method overcomes the current difficulties in preparing low-molecular-weight chitosan oligosaccharides to some extent. Simultaneously, COS46 and COST can act as exogenous antioxidants and improve the body’s antioxidant levels. This can effectively prevent damage to human hepatocytes and mouse livers caused by CCl4 to a certain extent. Low-molecular-weight COS46 is superior to COST in some aspects of antioxidation.


