1. Introduction
Preserving the soundscape and geographic extension of quiet areas is a great challenge against the wide spread of environmental noise. The Environmental Noise Directive [
1] points out the need to preserve natural quietness, as a resourceful land protection strategy and as a new aim for the management of noise in European countries. The Directive defines two types of quiet areas: “Quiet area in an agglomeration” (areas exposed to a value of L
den or other appropriate noise indicators less than a certain value set by the Member State) and “Quiet area in open country” (areas undisturbed by noise from traffic, industry or recreational activities). Nevertheless threshold values for L
den, as well as the significance of undisturbed area are still unclear.
Regarding the threshold values for L
den, it is important to point out that low sound levels do not necessarily correspond to undisturbed areas and that there is enough evidence to discount the “energetic criterion” as the criterion for defining such acoustic areas. Instead, the criterion should be based on which sounds are preferred or wanted in a particular context. According to Brown [
2], “quietness” is not always the acoustic characteristic that people desire in such areas, so he suggests changing the terminology to “areas of high acoustic quality”. At the same time, Job [
3] showed that it is difficult to find a clear threshold noise level for the assessment of community reaction to noise, because annoyance depends on many features of the noise itself, situational factors and individual variation in sensitivity to noise [
3,
4,
5].
The term “quietness” relates to peace and calmness and is often associated with natural environments: this is what people would call a “tranquil” environment [
6]. Usually rural areas are considered to be “tranquil” and restorative places [
7]. Brown [
2] defines the non-urban or rural domain as the context including landscapes outside of urban areas in which people might rest: coastlines, forests, mountains, countryside and so on. Additionally, he includes the much more extensive rural areas in which the main aim is not recreation, but agriculture or similar: all these areas can express different soundscapes that people enjoy. In general, it is evident that people find scenarios involving naturalistic or rural as more relaxing to listen to and less visually disturbing [
8,
9,
10,
11,
12,
13].
However, due to their low population density, rural areas with suitable wind are considered appropriate locations for installing wind farms (WFs) [
14]. Despite the fact that WFs are represented as environmentally friendly projects, wind turbines (WTs) are often viewed as visual and audible intruders that spoil the landscape and generate noise [
9]. Furthermore, rural places are often landscapes with high values for recreation and tourism that could decrease with the construction of a wind farm.
WTs produce special audible and inaudible sound contribution [
15] in three regions of the spectrum, generating: infrasound, low frequency and high frequency noise, according to several mechanisms [
16,
17]. For this reason, WTs are barely comparable with other noise sources. It has been shown that, compared with other environmental noise sources (road, rail and aircraft noise), noise annoyance due to WTs appears at lower exposure levels [
18,
19,
20] and, like the other noise sources, it could have adverse effects on health-related quality of life [
21,
22]. Even though most studies about the effects of WTs on noise annoyance refer to people living in residential areas [
19,
20,
23,
24], some evidence indicates that living in a rural landscape rather than in an urbanized area enhances the risk of perceiving WTs’ noise and, furthermore, the risk of annoyance [
9]. For example, Fidell and colleagues [
25] estimated that the noise level tolerated in non-urban areas compared to residential areas was 7 dB(A) lower. Furthermore, Bakker and colleagues [
26] found out that the link between the WF sound levels and annoyance is stronger in quiet areas. For this reason, they suggested that the risk of being disturbed by the WFs’ noise during sleep and/or of being distressed is more pronounced in these areas compared to noisy areas.
According to Pedersen and Halmstad [
27], one of the main sources of annoyance in rural areas is represented by the visual aspect of the WTs, especially if there is a large wide-open space. The visual impact of WTs has also been shown to be more pronounced in rural areas when compared to more densely populated areas [
28]. In a review about the health effect of WTs, Knopper and Ollson [
29] pointed out that annoyance provoked by WTs’ is slightly associated with WTs noise, but strongly related to their visual characteristics, individual attitude to WTs and individual noise sensitivity. The impact of WTs on individuals has recently been studied by Ruotolo and colleagues [
30] by directly manipulating the presence of visual and auditory characteristics of a wind farm. They found out that the presence of a visual scenario, as compared to the only availability of auditory stimuli, exerts a negative effect on resource-demanding cognitive tasks, but a positive effect on perceived noise annoyance. This indicates that WFs’ visual features modulate the effects of noise and that WFs’ auditory and visual features are processed by people in close interaction. Therefore, the impact of WTs’ visual aspects on people’s noise annoyance could be enhanced in landscapes where the noise sources are easily visible [
24].
If we accept that the visual aspect of the WFs plays a relevant role in the perceptual process, colours could represent one of the main factors of influence on the subjective perception of the WFs’ noise. In their study, Menzel and Fastl [
31] showed that the levels of perceived loudness of a sport car’s noise varied according to the colour of the car. In the same way, Song
et al. [
32] showed that the degree of road traffic’s noise annoyance was modulated by the simultaneous presentation of different colours on a computer screen. The results showed an interaction between colour perception and noise level between 45 dB and 65 dB. In particular, compared with other colours, red colour increased subjective noise annoyance. Similar results were found by Kim
et al. [
33]. In their experiment, 12 colours were presented on a full screen while a wide range of pink noise was served as the audio components of the stimuli. The sound pressure level of the presented noise was set from 40 to 90 dB(A) by 12.5 dB steps. Results showed that when the colour was close to red or white, the noise was perceived as significantly louder and noisier; when the colour was close to green or blue, the noise was perceived significantly softer and quieter. These studies suggest that the visual characteristics of the environments, such as the colours, modulate the perception of the noise.
The source-subject distance and the contrast between the WTs and their background of sky were found to be good predictors of the perceived impact of WTs. In their experiments, Bishop and Miller [
34], used JPG images as the basis for calculating a
visibility index based on the size and contrast of the towers. The visibility index considered the absolute colour difference (Δ
E*abs) in the CIELAB colour model. Likewise, Del Carmen Torres Sibille
et al. [
35] developed an indicator to assess the magnitude of the objective aesthetic impact on the landscape caused by the installation of five WFs. The indicator was supposed to combine measures of visibility, colour, fractality and continuity which could be taken from photographs.
In sum, most of the previously mentioned studies highlight the importance of considering both visual and auditory aspects of WTs when its impact on people experiencing quiet areas has to be assessed. However, to our knowledge, most of the studies that evaluated the effects of WTs on individuals have been conducted in a unimodal condition in which only the acoustic or the visual stimuli were presented to a group of people. Furthermore, only in few cases the visual impact of an existing or future infrastructure has been assessed by means of real scale 3D graphic reconstructions experienced in virtual reality immersive [
30] or non-immersive environments.
In this research, we assess how people perceive auditory and visual characteristics of scenarios reproducing a wind farm with different features. In order to reproduce the conditions in which the wind farm can be experienced in natural contexts as closely as possible, the Immersive Virtual Reality (IVR) technology was used. Although the graphics depicting virtual environments are still far from being fully natural, IVR has several advantages: (1) it allows reproduction in a controlled way the most relevant environmental characteristics; (2) users are surrounded by the virtual environment, which gives the impression of being inside the virtual world; (3) users can interact in real time with the environment. These characteristics give to the people the sensation that the simulated world is perceptually convincing and that it can reproduce what happens in the real life [
36]. Recently, several theoretical and applied studies have been carried out to increase the reliability of IVR’s techniques [
37,
38]. Furthermore, the visual representation has been integrated with auralization systems that are meant to create audible sound files from numerical data, which can be simulated, measured or synthesised, obtaining convincing audio presentations. Maffei
et al. used the IVR system in different studies [
39,
40,
41]. In a case-study of a new highway [
41], it was found that conventional methods to assess noise impact based on noise maps and noise limits did not match even the real response of the population. These results suggested that the application of a methodology which contemplates the audio and visual annoyance reaction of a sample of the population can lead to more information on the noise impact assessment of a new project.
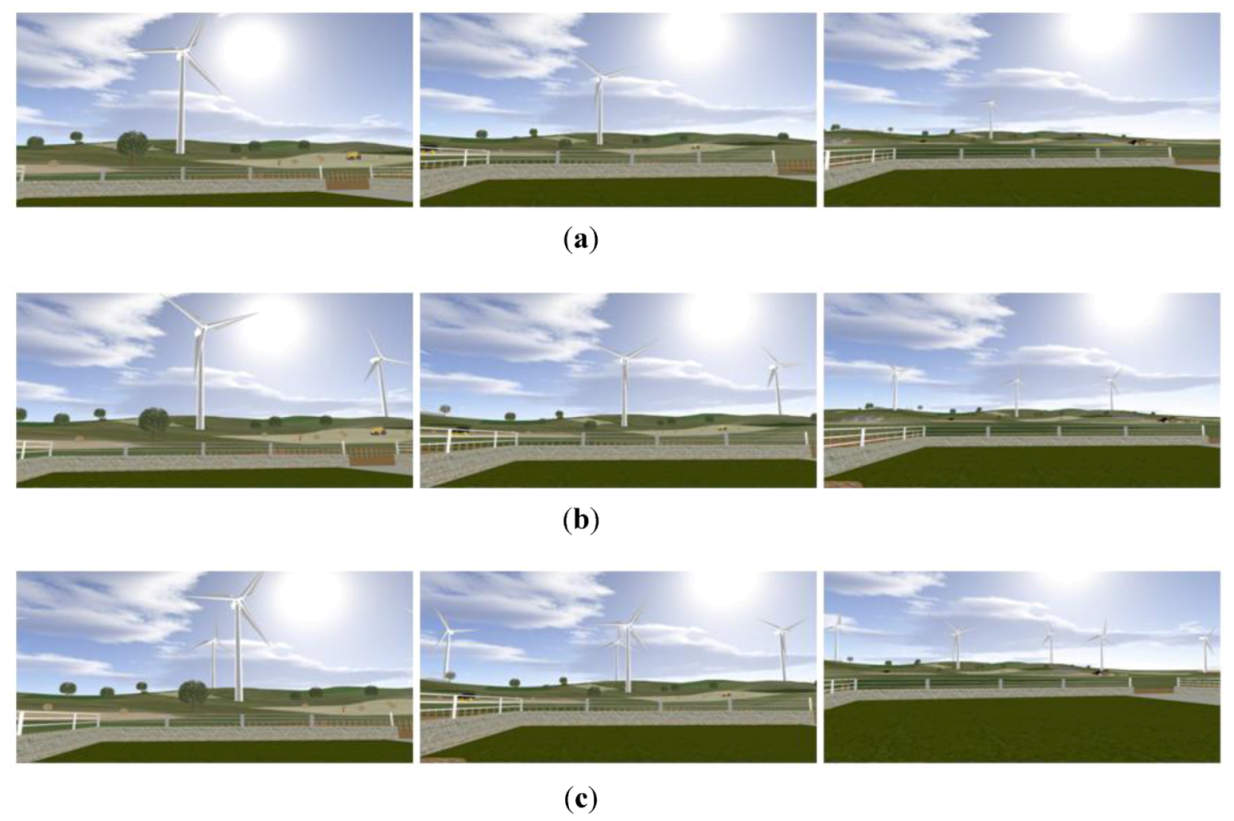
This paper presents a study where, by means of IVR techniques, some visual and acoustical aspects of the impact of a wind farm on a sample of subjects were assessed and analyzed at three different distances from the wind farm (150, 250 and 500 m). The influence of the number of turbines and the colour of turbines on the global, visual and the acoustic judgment was investigated.
3. Results
To investigate the effects of the distance from the noise source and the quantity of turbines on the subjective perception of the simulated scenarios, nine 3 × 3 within-subject ANOVAs, that treated the Distance (150, 250 and 500 m) and the Number of WTs (one, three and six) as 3-level within-subject factors, were performed. As dependent variables we used the nine subjective evaluations considered: General Evaluation, Integration, Sound Pleasantness, Perceived Loudness, Noise Annoyance, Sound stress, Sound Tranquillity, General Visual Pleasantness, and WTs Visual Pleasantness.
To investigate the effects of WTs’ colour on the subjective perception of the simulated scenarios, nine one-way within subject ANOVAs, that treated the
Colour (green, white, brown and red) as a 4-level within-subject factor, were performed. As dependent variables we used the same nine subjective evaluations previously considered. In all ANOVA analyses, the Bonferroni correction was used to analyze
post hoc effects and the magnitude of the significant effects was indicated by partial eta squared (
η2p). In all analyses an
alpha value of 0.05 was used as the criterion to determine significant differences. The mean values are analysed as a function of the
Distance (see
Table 4), the
Number (see
Table 5) and the
Colour (see
Table 6) effect.
Table 4.
Mean values (standard error) and effect size as a function of the Distance.
Table 4.
Mean values (standard error) and effect size as a function of the Distance.
| Variable | Distance | η2p |
|---|
| 150 m | 250 m | 500 m |
|---|
| General Evaluation | 41.3a (3.2) | 54.8b (3.2) | 63.6c (2.8) | 0.43 *** |
| Integration | 36.2a (2.9) | 48.7b (3.0) | 56.9c (3.3) | 0.48 *** |
| Sound Pleasantness | 40.0a (2.9) | 57.2b (3.1) | 62.6c (2.5) | 0.47 *** |
| Perceived Loudness | 60.4a (3.2) | 42.3b (3.0) | 38.3b (2.5) | 0.52 *** |
| Noise Annoyance | 55.8a (3.1) | 35.7b (3.1) | 32.3b (2.7) | 0.50 *** |
| Sound Stress | 64.1a (2.6) | 46.6b (2.5) | 43.4b (2.6) | 0.50 *** |
| Sound Tranquillity | 34.1a (2.6) | 54.3b (3.2) | 60.0c (2.8) | 0.52 *** |
| General Visual Pleasantness | 41.9a (2.7) | 54.6b (2.8) | 58.5b (2.5) | 0.36 *** |
| WTs Visual pleasantness | 29.1a (3.2) | 45.9b (3.7) | 49.7b (3.4) | 0.54 *** |
Table 5.
Mean values (standard error) and effect size as a function of the Number of turbines.
Table 5.
Mean values (standard error) and effect size as a function of the Number of turbines.
| Variable | Number of turbines | η2p |
|---|
| 1 | 3 | 6 |
|---|
| General Evaluation | 57.3a (3.2) | 51.6a,b (2.7) | 50.8b (3.1) | 0.09 * |
| Integration | 50.1a (3.1) | 46.3a (2.8) | 45.4a (3.1) | 0.06 |
| Sound Pleasantness | 55.8a (2.4) | 52.9a,b (2.9) | 51.1b (2.4) | 0.08 * |
| Perceived Loudness | 45.7a (2.6) | 47.0a (3.0) | 48.3a (2.8) | 0.02 |
| Noise Annoyance | 38.9a (2.5) | 41.1a,b (3.0) | 43.8b (2.6) | 0.08 * |
| Sound Stress | 51.4a (2.2) | 50.8a (2.8) | 51.9a(2.2) | 0.0 |
| Sound Tranquillity | 50.7a (2.1) | 49.6a (3.0) | 48.0a (2.8) | 0.02 |
| General Visual Pleasantness | 51.3a (2.7) | 54.2a (2.5) | 49.5a (2.6) | 0.05 |
| WTs Visual pleasantness | 42.0a (3.4) | 43.6a (3.2) | 39.1a (3.5) | 0.07 |
Table 6.
Mean values (standard error) and effect size as a function of the Colour of turbines.
Table 6.
Mean values (standard error) and effect size as a function of the Colour of turbines.
| Variable | Colour of turbines | η2p |
|---|
| Green | White | Brown | Red |
|---|
| General Evaluation | 59.4a (4.1) | 52.2a,b (3.9) | 45.0b,c (4.2) | 40.9c (4.3) | 0.14 *** |
| Integration | 55.4a (4.2) | 45.8b (3.6) | 39.6b,c (4.0) | 34.0c (4.0) | 0.18 *** |
| Sound Pleasantness | 56.5a (3.4) | 56.6a (3.6) | 52.2a,b (3.7) | 47.6b (3.4) | 0.07 * |
| Perceived Loudness | 44.8a,b (3.6) | 42.5a (3.8) | 48.6a,b (3.7) | 51.8b (3.7) | 0.07 * |
| Noise Annoyance | 38.7a (3.5) | 39.0a (3.7) | 45.3a (3.5) | 45.2a (3.8) | 0.05 |
| Sound Stress | 46.0a (3.5) | 47.2a (3.2) | 51.7a,b (3.3) | 54.0b (3.3) | 0.06 * |
| Sound Tranquillity | 54.2a,b (3.8) | 55.1a (4.1) | 50.1a,b (3.9) | 45.2b (3.4) | 0.06 * |
| General Visual Pleasantness | 58.9a (3.8) | 52.0a,b (3.2) | 47.0b,c (4.0) | 41.4c (3.8) | 0.14 *** |
| WTs Visual pleasantness | 48.6a (4.5) | 45.0a (3.9) | 39.4a,b (4.9) | 31.9b (4.4) | 0.12 *** |
3.1. Analyses on the General Evaluation
The ANOVA on the General Evaluation showed that subjective ratings were influenced by the
Distance from the noise source,
F(2, 90) = 33.987,
p < 0.001,
η2p = 0.430, and by the
Number of WTs,
F(2, 90) = 4.605,
p = 0.012,
η2p = 0.093. The
Distance ×
Number interaction was not significant,
F(4, 180) = 1.558, p = 0.187,
η2p = 0.033. Regarding the
Distance main effect, the mean comparison showed that when participants were placed 500 m from the noise source, the scenario was rated as more pleasant compared to both the 250 m and the 150 m scenarios. Moreover, a significant difference was observed between the latter two scenarios (see
Table 4).
As regards the
Number main effect, the mean comparison showed that participants rated the scenario with one turbine as more pleasant than the six turbines scenario. The differences between the three turbines scenario and the others were not significant (see
Table 5).
The ANOVA that evaluated the
Colour effect showed that the General Evaluation was influenced by this factor,
F(3, 135) = 7.326,
p < 0.001,
η2p = 0.140. Participants rated the scenarios with green and white turbines as more pleasant than the brown and red turbines scenarios (see
Table 6).
3.2. Analyses on Integration
The ANOVA on the evaluation of the general Integration between the WTs and the environment showed that subjective ratings were influenced by the
Distance,
F(2, 88) = 39.99,
p < 0.001,
η2p = 0.476. Neither the
Number main effect,
F(2, 88) = 2.91,
p = 0.060,
η2p = 0.062, nor the
Distance ×
Number interaction were significant,
F(4, 176) = 2.11,
p = 0.081,
η2p = 0.046. Regarding the
Distance main effect, the mean comparison showed that participants rated the 500 m scenario as the more integrated scenario in respect to both the 250 m and the 150 m scenarios. Moreover, a significant difference was observed between the latter two scenarios (see
Table 4).
The ANOVA that evaluated the
Colour effect showed that the general Integration evaluation was influenced by this factor,
F(3, 135) = 9.685,
p < 0.001,
η2p = 0.177. Participants rated the scenario with green turbines as the most integrated with respect to white, brown and red turbines scenarios. Moreover, the scenario with red turbines was considered the less integrated (see
Table 6).
3.3. Analyses on Sound Pleasantness
The ANOVA on the Sound Pleasantness evaluations showed that subjective ratings were influenced by the
Distance,
F(2, 90) = 39.270,
p < 0.001,
η2p = 0.466, and by the
Number of WFs,
F(2, 90) = 4.046,
p = 0.021,
η2p = 0.082. The
Distance Number interaction was not significant,
F(4, 180) = 2.011,
p = 0.095,
η2p = 0.043. As regards the
Distance main effect, the mean comparison showed that participants rated the 500 m scenario as the more pleasant with respect to both the 250 m and the 150 m ones. Moreover, a significant difference was observed between the latter two scenarios (see
Table 4). With regards to the
Number main effect, the mean comparison showed that participants rated the scenario with one turbine as more pleasant than the six turbines scenario. The differences between the three turbines scenario and the others were not significant (see
Table 5).
The ANOVA that evaluated the
Colour effect showed that the Sound Pleasantness evaluation was influenced by this factor,
F(3, 135) = 3.377,
p = 0.020,
η2p = 0.070. Participants rated the scenario with green and white turbines as more pleasant than the red turbine scenario. No differences were observed between the brown turbine scenario and the others (see
Table 6).
3.4. Analyses on Perceived Loudness
The ANOVA on the Perceived Loudness showed that subjective ratings were influenced exclusively by the
Distance,
F(2, 90) = 47.871,
p < 0.001,
η2p = 0.515. Neither the
Number main effect,
F(2, 90) = 0.866,
p = 0.424,
η2p = 0.019, nor the
Distance ×
Number interaction were significant,
F(4, 180) = 0.452,
p = 0.771,
η2p = 0.010. Regarding the
Distance main effect, the mean comparison showed that participants rated the 150 m scenario as the scenario associated with the loudest sound (
M = 60.4,
ps < 0.05) in respect to both the 250 m and the 500 m scenarios. The difference between the latter two scenarios was not significant (see
Table 4).
The ANOVA that evaluated the
Colour effect showed that the Perceived Loudness evaluation was influenced by this factor,
F(3, 135) = 3.186,
p = 0.026,
η2p = 0.066. Participants rated sounds of the red turbines scenario as louder than sounds of the white turbines scenario. No differences were observed in the comparison between white or red turbines scenarios and the others (see
Table 6).
3.5. Analyses on Noise Annoyance
The ANOVA on the Noise Annoyance evaluations showed that subjective ratings were influenced by the
Distance from the noise source,
F(2, 90) = 45.596,
p < 0.001,
η2p = 0.503, and by the
Number of WFs,
F(2, 90) = 3.852,
p = 0.025,
η2p = 0.079. The
Distance ×
Number interaction was not significant,
F(4, 180) = 1.336,
p = 0.258,
η2p = 0.029. With regards to the
Distance main effect, the mean comparison showed that participants rated the 150 m scenario as the more annoying with respect to both the 250 m and the 500 m scenarios. The difference between the latter two scenarios was not significant (see
Table 4). Regarding the
Number main effect, the mean comparison showed that participants rated the scenario with six turbines as more annoying than the one turbine scenario. The differences between the three turbines scenario and the others were not significant (see
Table 5).
The ANOVA that evaluated the Colour effect showed that the Noise Annoyance evaluation was not influenced by this factor, F(3, 135) = 2.268, p = 0.084, η2p = 0.048.
3.6. Analyses on Sound Stress
Regarding the evaluation of the perceived stress associated with the sounds, the ANOVA showed that subjective ratings were influenced only by the
Distance,
F(2, 90) = 44.306,
p < 0.001,
η2p = 0.496
. Neither the
Number main effect,
F(2, 90) = 0.176,
p = 0.839,
η2p = 0.004
, nor the
Distance ×
Number interaction were significant,
F(4, 180) = 1.630,
p = 0.168,
η2p = 0.035. With regards to the
Distance main effect, the mean comparison showed that participants rated the 150 m scenario as the most stressing scenario in respect to both the 250 m and the 500 m scenarios. Not significant was the difference between the latter two scenarios (see
Table 4).
The ANOVA that evaluated the
Colour effect showed that the Sound Stress evaluation was influenced by this factor,
F(3, 135) = 2.905,
p = 0.037,
η2p = 0.061. Participants rated the red turbines scenario as more stressing than the green and the white turbines scenarios. No differences were observed between the brown turbines scenario and the others (see
Table 6).
3.7. Analyses on Sound Tranquillity
The ANOVA on the Sound Tranquillity evaluations showed that subjective ratings were influenced only by the
Distance,
F(2, 30) = 48.823,
p < 0.001,
η2p = 0.520. Neither the
Number main effect,
F(2, 30) = 0.852,
p = 0.430,
η2p = 0.019
, nor the
Distance ×
Number interaction were significant,
F(4, 60) = 2.363,
p = 0.055,
η2p = 0.050. With regards to the
Distance main effect, the mean comparison showed that participants rated the 500 m scenario as the more tranquil scenario in respect to both the 250 m and the 150 m scenarios. Moreover, a significant difference was observed between the latter two scenarios (see
Table 4).
The ANOVA that evaluated the
Colour effect showed that the Sound Tranquillity evaluation was influenced by this factor,
F(3, 135) = 2.823,
p = 0.041,
η2p = 0.059. Participants rated sounds of the red turbines scenario as less tranquil than sounds of the white turbines scenario. No differences were observed in the comparison between the white or the red turbines scenarios and the others (see
Table 6).
3.8. Analyses on General Visual Pleasantness
The ANOVA on the General Visual Pleasantness showed that subjective ratings were influenced only by the
Distance,
F(2, 90) = 25.274,
p < 0.001,
η2p = 0.360. Neither the
Number main effect,
F(2, 90) = 2.413,
p = 0.095,
η2p= 0.051, nor the
Distance ×
Number interaction were significant,
F(4, 180) = 0.336,
p = 0.854,
η2p= 0.007. Regarding the
Distance main effect, the mean comparison showed that participants rated the 150 m scenario as the less visually pleasant scenario in respect to both the 250 m and the 500 m scenarios. The difference between the latter two scenarios was not significant (see
Table 4).
The ANOVA that evaluated the
Colour effect showed that the General Visual Pleasantness evaluation was influenced by this factor,
F(3, 135) = 7.477,
p < 0.001,
η2p= 0.142. Participants rated the red turbines scenario as less pleasant than the green and the white turbines scenarios. The brown turbines scenario was rated as less pleasant than the green one, while no significant differences were observed between the brown turbines scenario and both the white and the red turbines scenarios (see
Table 6).
3.9. Analyses on WTs Visual Pleasantness
The ANOVA on the WTs Visual pleasantness showed that subjective ratings were influenced only by the
Distance,
F(2, 70) = 41.302,
p < 0.001,
η2p = 0.541. Neither the
Number main effect,
F(2, 70) = 2.622,
p = 0.080;
η2p= 0.070, nor the
Distance ×
Number interaction were significant,
F(4, 140) = 0.284;
p = 0.888;
η2p= 0.008. Regarding the
Distance main effect, the mean comparison showed that participants rated the 150 m scenario as the less visually pleasant scenario in respect to both the 250 m and the 500 m scenarios. The difference between the latter two scenarios was not significant (see
Table 4).
The ANOVA that evaluated the
Colour effect showed that the WTs Visual pleasantness evaluation was influenced by this factor,
F(3, 123) = 5.486;
p < 0.001;
η2p= 0.118. Participants rated the red turbines scenario as less pleasant than the green and the white turbines scenarios. No differences were observed between the brown turbines scenario and the others (see
Table 6).
4. Conclusions
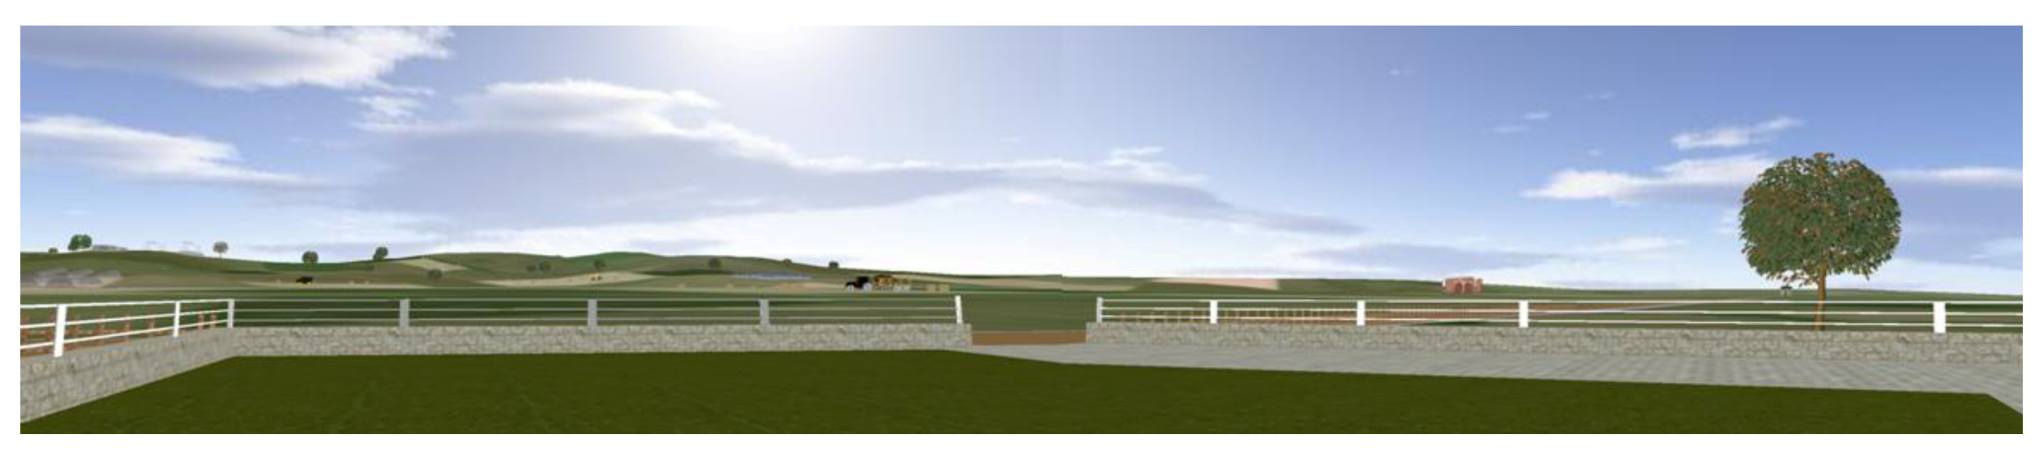
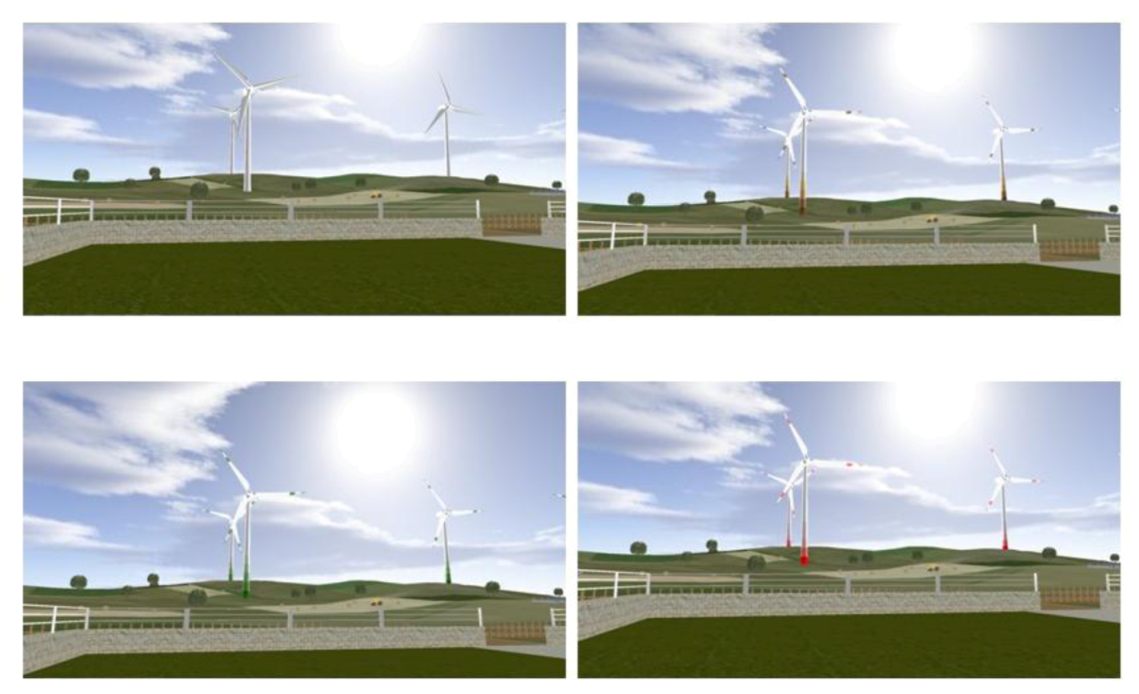
The main goal of this study was to evaluate the effects of some visual and acoustical aspects of the impact of a wind farm in a quiet area. In order to achieve this goal, an innovative multisensory methodology that integrates auditory and visual components was used. By means of Immersive Virtual Reality equipment different wind farm configurations were created in a 1:1 scale scenario and presented to individuals. The virtual models were created to evaluate the effects of three different components that according to the literature are known to affect individual reactions: (a) the Distance from WTs and noise; (b) the Number of WTs and noise sources; and (c) the Colour of WTs. In the virtual presentation, participants perceived both the visual and the auditory stimuli from the wind farm. They were surrounded by a typical rural outdoor environment and could interact actively with it in a real time. In this way the sense of “being there” was stimulated. After the presentation of each scenario, participants were asked to answer to a series of questions designed to evaluate the effect of the wind farm on the perception of the environment, the integration of the new infrastructure into the existing environment, and both auditory and visual subjective effects. The IVR approach was preferred because it allowed manipulating the considered factors in a controlled way, in order to dissociate the auditory and visual features of each investigated scenario. In our study a set of auditory stimuli, representative of the auditory scenarios at three distances, were associated with different visual stimuli to evaluate the contribution of the Number and Colour factors on the subjective perception.
As expected, the results showed that the factor Distance from the WF is the stronger factor that affects individual reactions to the WFs. Indeed, for all the considered variables, the effect was significant and large. In particular the data showed that the more distance from the WF, the more positive is the general evaluation of the scenario or the integration of the WF into the existing environment. Moreover, the more distance from the WF, the less is the Perceived Loudness, the Noise Annoyance and the stress caused by wind turbines’ sound, and the more positive is the perceived visual pleasantness. These results are in line with the extensive literature showing that the source-subject distance is an important factor that determines the magnitude of the WFs’ impact on the individual [
34].
Regarding the manipulation of the Number factor, the results showed that this visual component has a weak effect on individual reactions. Data showed that this factor affects the General Evaluation of the scenario and the perceived Sound Pleasantness and Noise Annoyance. The effects were significant but small. In particular, data showed that: the higher the number of wind turbines is, the less the evaluation of audio-visual pleasantness of the environment is and the more the Noise Annoyance is. No significant differences were observed as regards Perceived Loudness, Sound Stress, Sound Tranquillity and the visual pleasantness. It is important to highlight that the auditory stimuli considered for this comparison belonged to the same groups, with similar spectral levels and semantic contents. For this reason, from one side we can say that the absence of any difference associated with the sound dimensions was expected, but on the other side we can confirm that the observed differences are ascribable mostly to the visual component with respect to the auditory ones.
Finally, regarding the manipulation of WTs’ colour, the results showed that colour influences both visual and auditory individual reactions, although in a different way. It has a large effect on the visual evaluations and a medium effect on the auditory evaluations. This latter effect is not trivial and confirmed the relevance of the visual components on the auditory evaluations and their integration. More in detail, data showed that over and above the auditory parameters, green and white turbines are preferred to brown and red ones in terms of general evaluation, integration, Sound Pleasantness, loudness, annoyance and visual pleasantness. Moreover, a slight preference was observed for green turbines that are evaluated as the most integrated. These results further confirm the interconnectedness between the auditory and visual components and that the presence of specific contextual visual information associated with sound source influences individual perceptions in a broad way [
28,
31,
32,
33,
34,
35].
Overall, it is important to point out that the results of this study are in line with the existing field studies and confirm that the innovative multisensory Immersive Virtual Reality methodology adopted here represents a suitable tool for the Environment Impact Assessment [
30,
37,
38,
39,
40,
41]. The proposed methodology seems to allow the investigation of the potential effects of the introduction of new infrastructure in an existing environment and to define in advance the better project choices that facilitate the preservation of both acoustic and visual quality of the environment [
8,
9,
10,
11,
12,
13]. However, extended experimental sessions are needed to make more robust its ecological validity, particularly by comparing the results of
in situ evaluations.

 ,
, 
