Range-Finding Risk Assessment of Inhalation Exposure to Nanodiamonds in a Laboratory Environment

 ,
,
Abstract
:
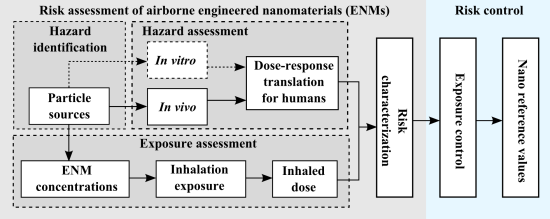
1. Introduction

2. Experimental Section
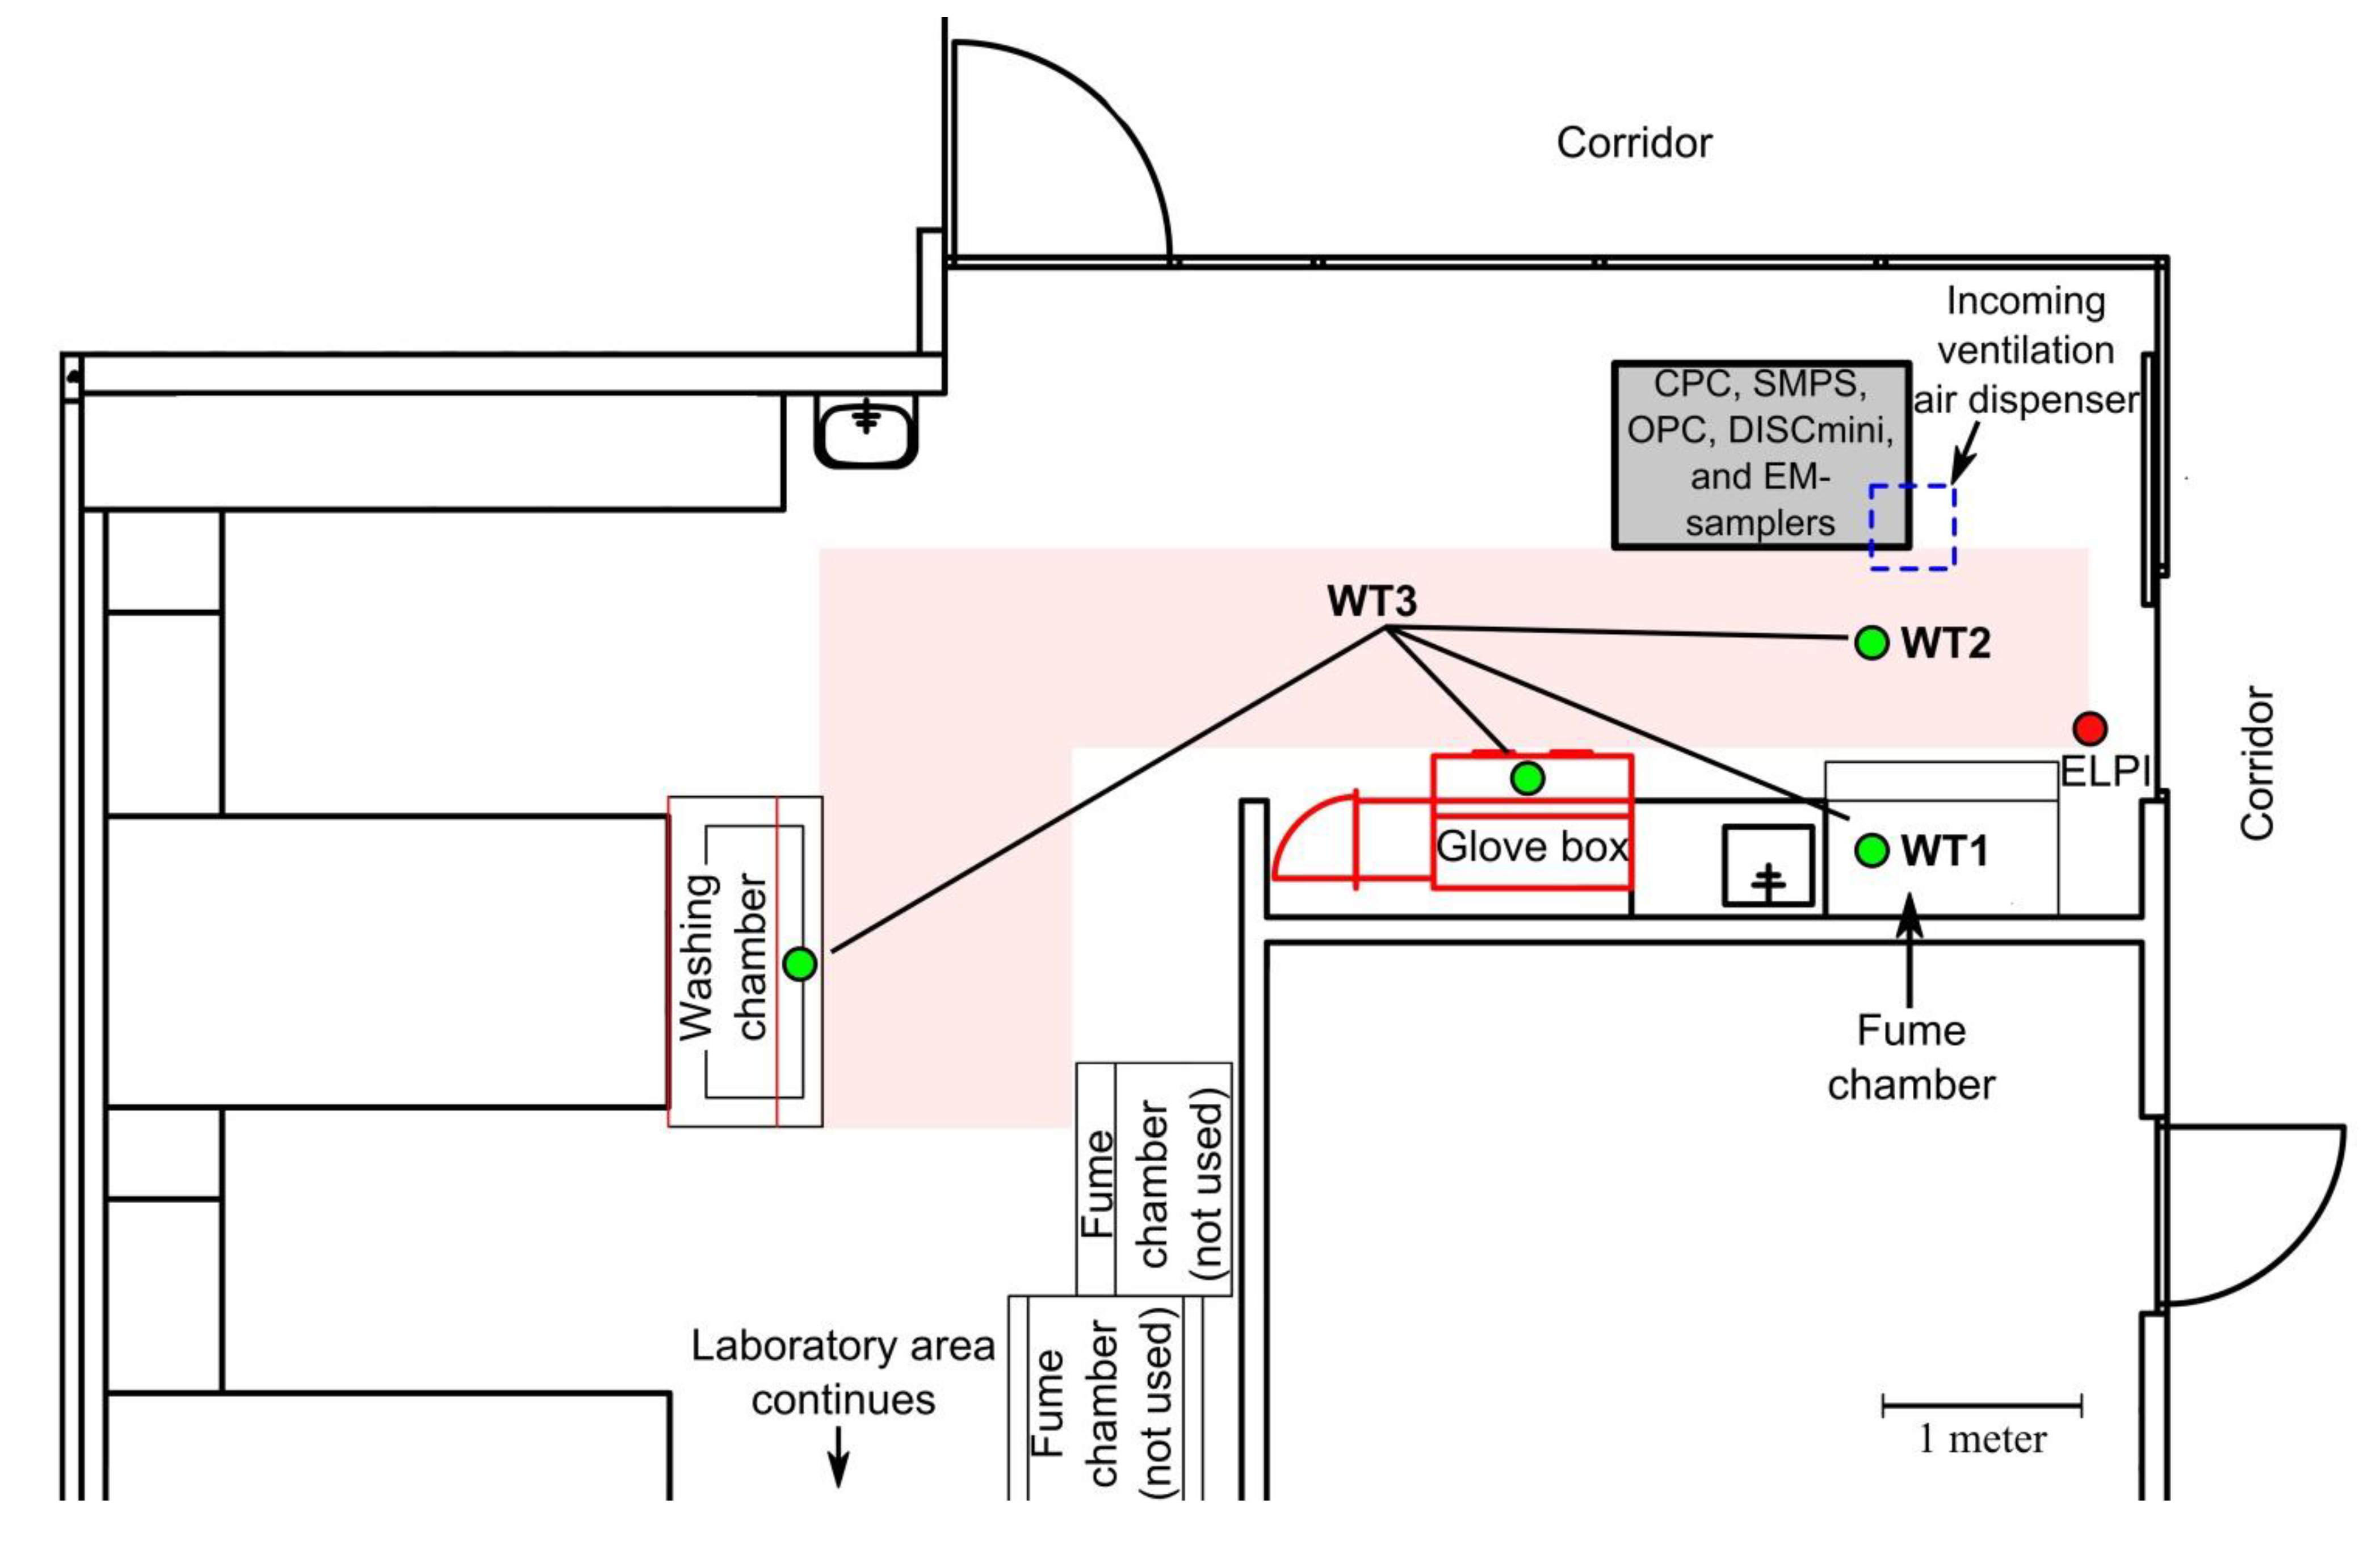
2.1. Work Environment
2.2. Aerosol Measurements
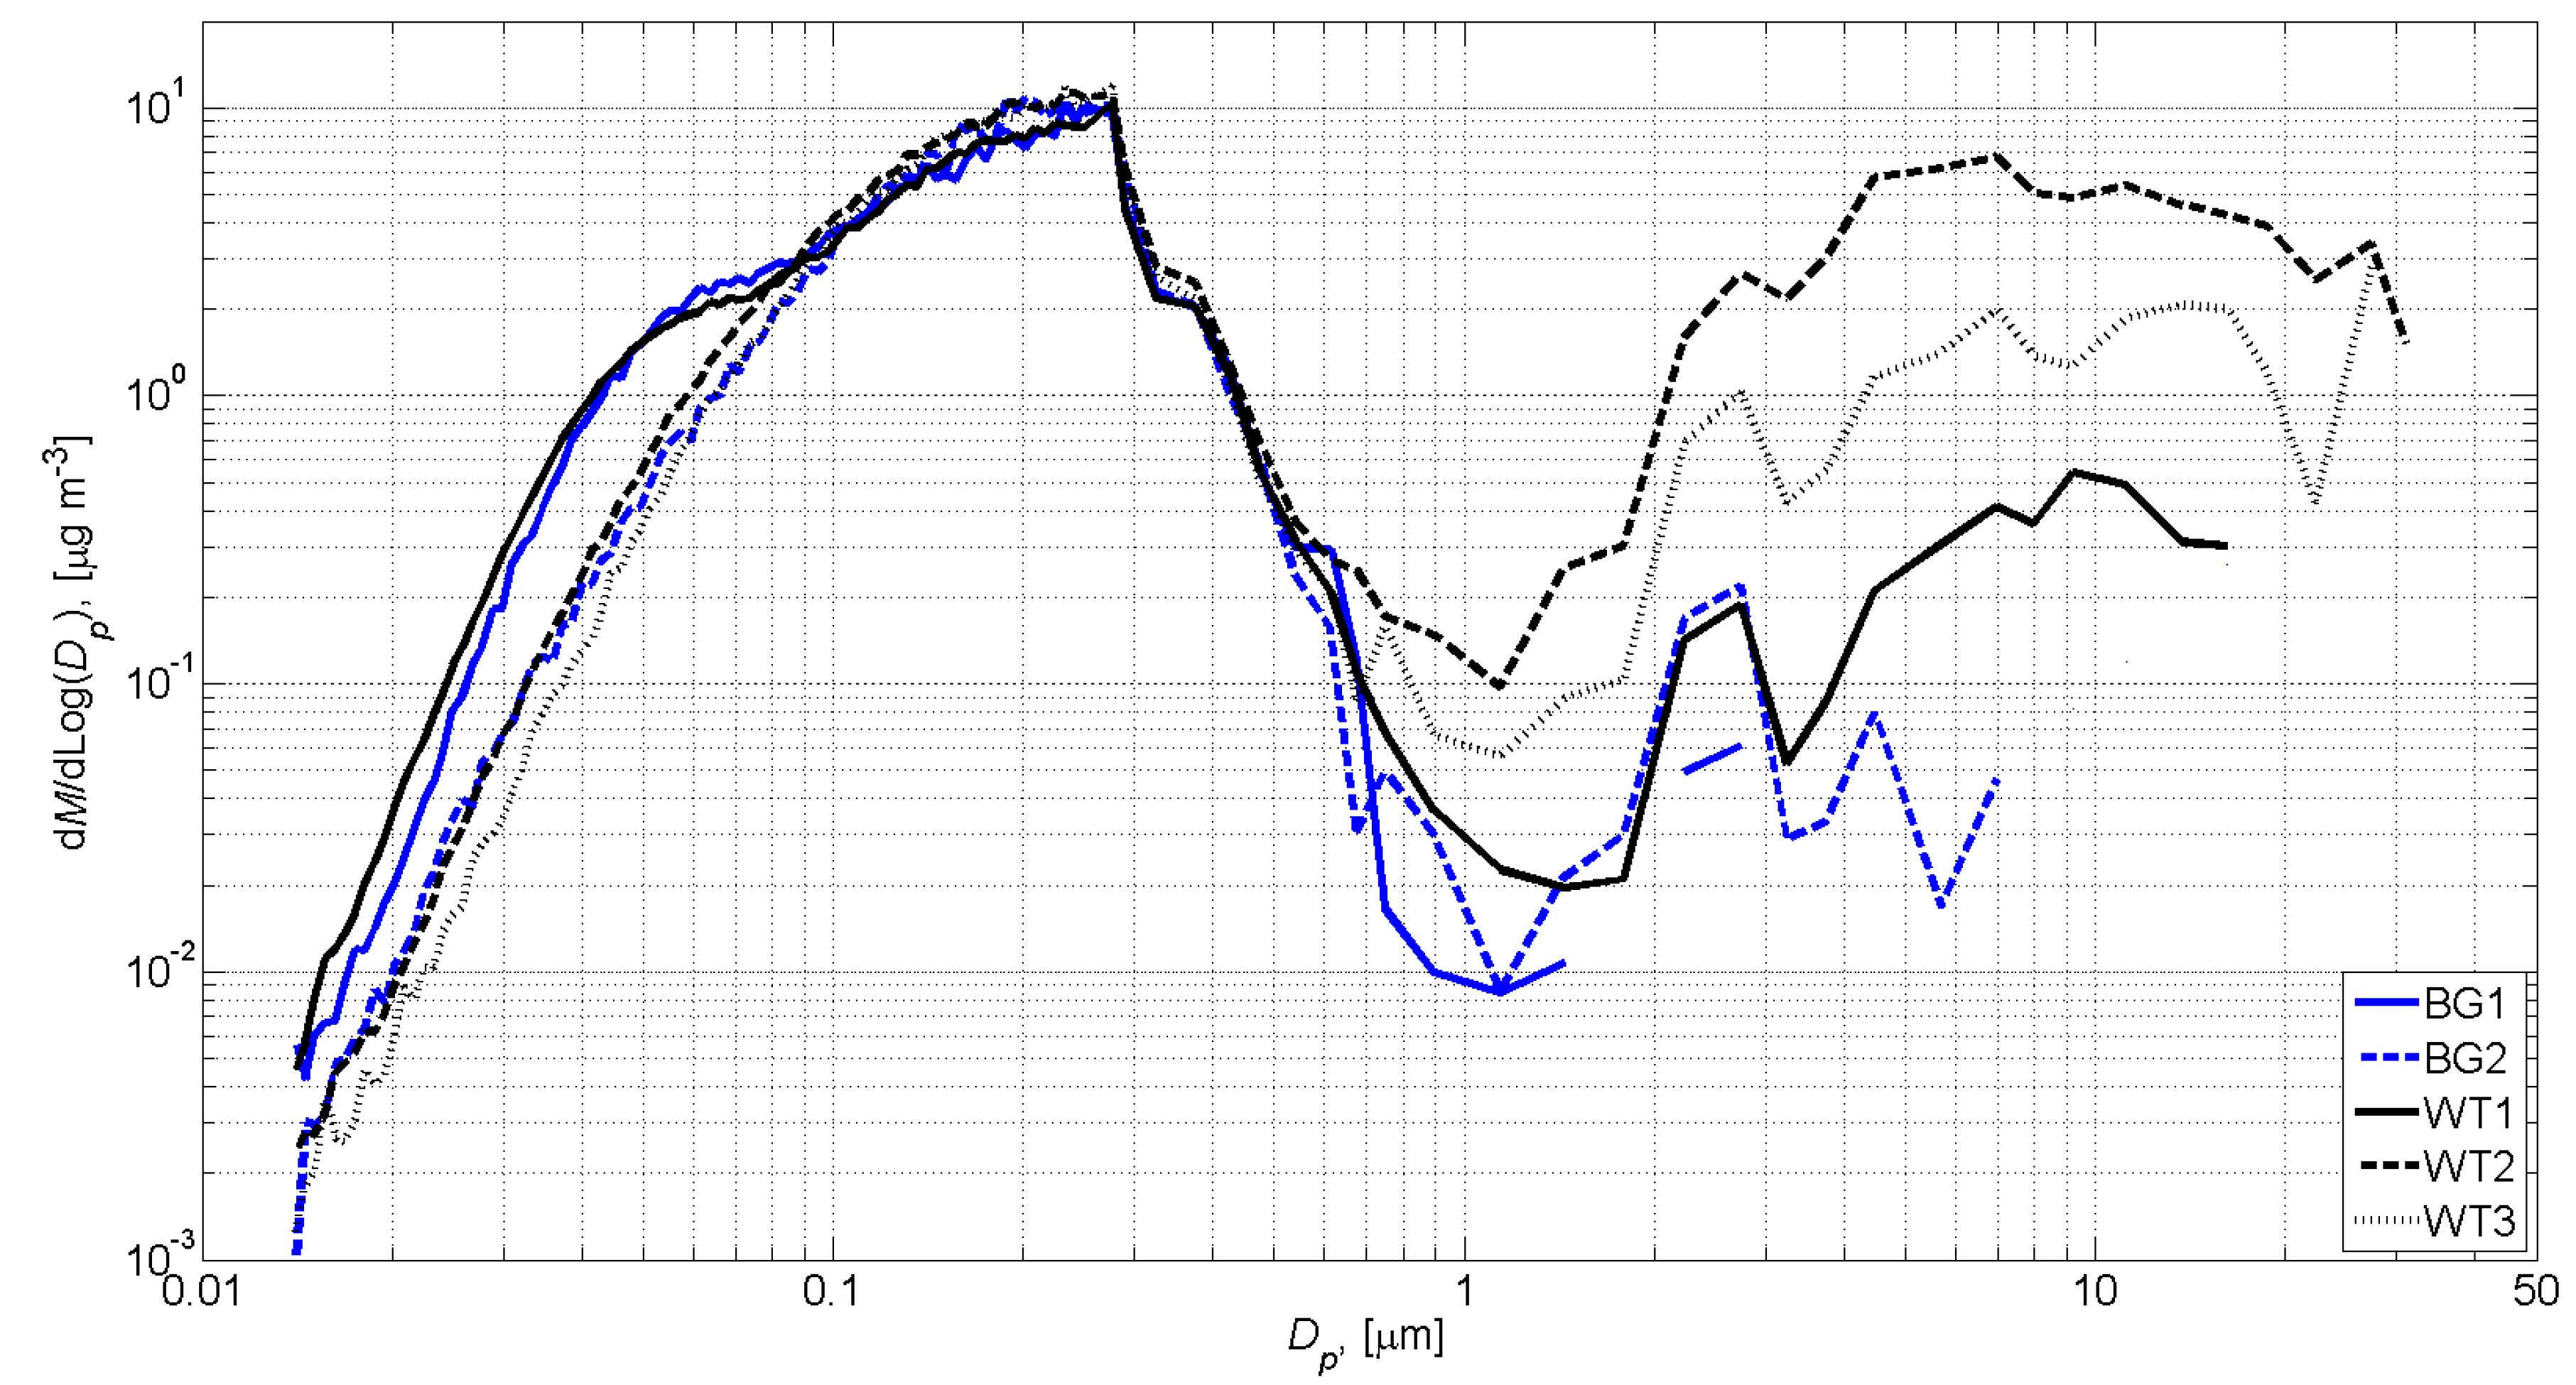
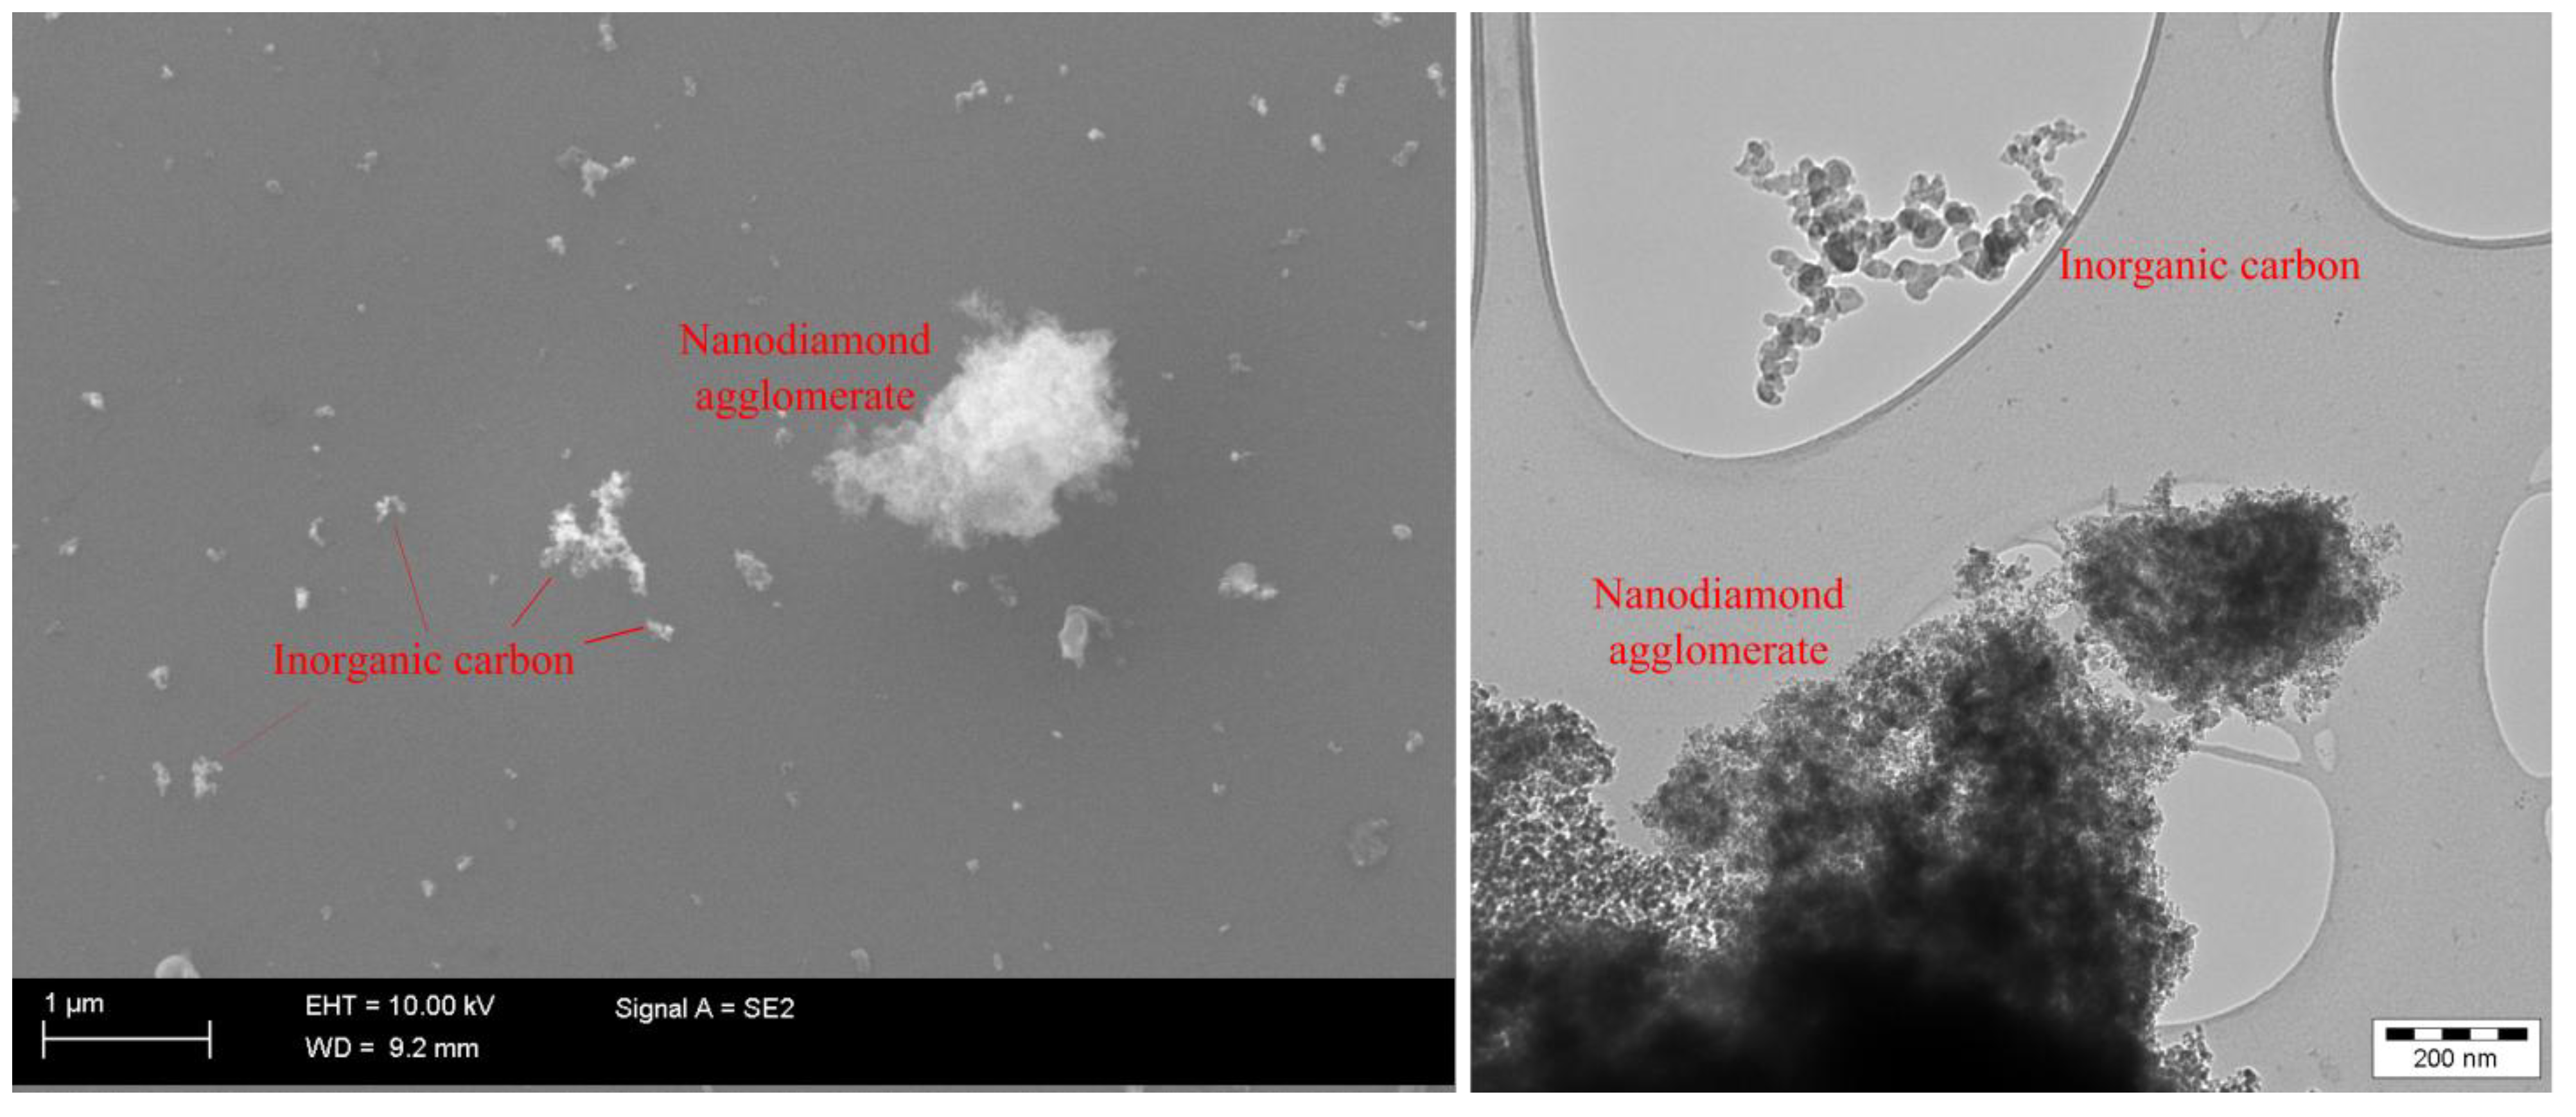
2.3. Electron Microscopy
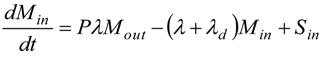
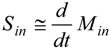
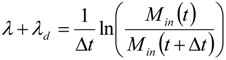
2.4. Dynamics of Nano-diamonds: Emissions and Settling
2.5. Calculation of Regional Inhalation Dose
2.6. In vitro-experiments
2.6.1. Cell Culture
2.6.2. Dispersion Preparation
2.6.3. Analysis of Cell Death and Cytokine Secretion
2.6.4. Determination of ROS Generating Ability
3. Results


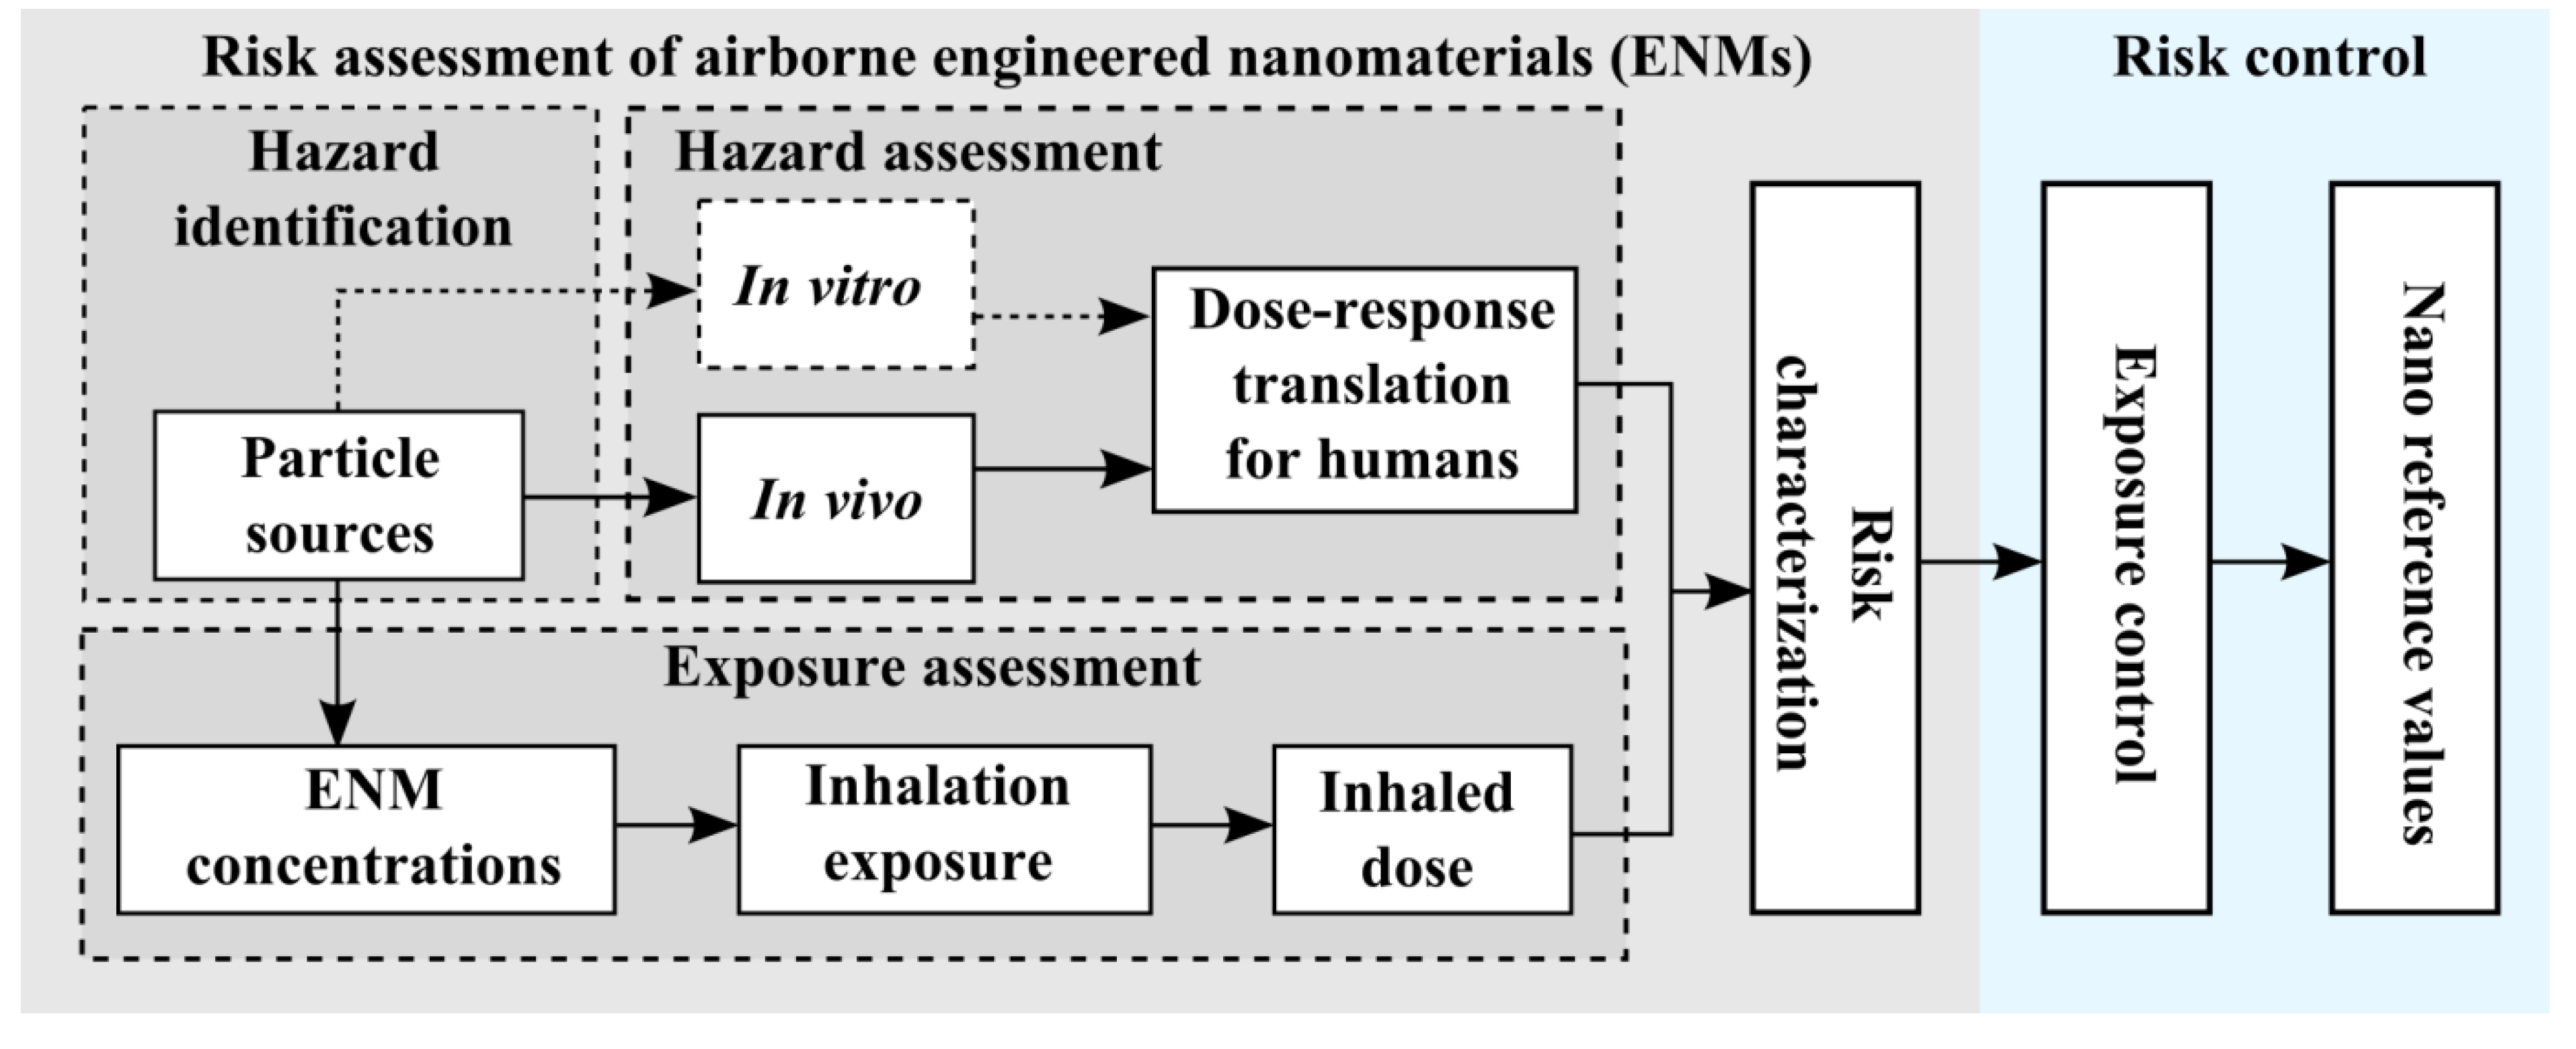
3.1. Exposure Assessment

| Unit | WT1 | WT2 | WT3 | |||
|---|---|---|---|---|---|---|
| ND exposure a | 0.08 cm−3 | 0.24 μg m−3 | 0.74 cm−3 | 4.96 μg·m−3 | 0.30 cm−3 | 1.54 μg·m−3 |
| ND emission rate | 6.1 μg·min−1·m−3 | 1.7 to 12.4 μg·min−1·m−3 | 2.2 μg·min−1·m−3 | |||
| Dose rate b | 2.2 min−1 | 0.03 ng·min−1 | 26.0 min−1 | 0.53 ng·min−1 | 8.8 min−1 | 0.16 ng·min−1 |
| Dose c | 310 | 4 ng | 3,100 | 62 ng | 410 | 8 ng |
| H-A, (%) | 59 | 87 | 66 | 88 | 62 | 90 |
| TB, (%) | 5 | 5 | 6 | 5 | 5 | 4 |
| Alveolar, (%) | 36 | 8 | 28 | 7 | 33 | 6 |
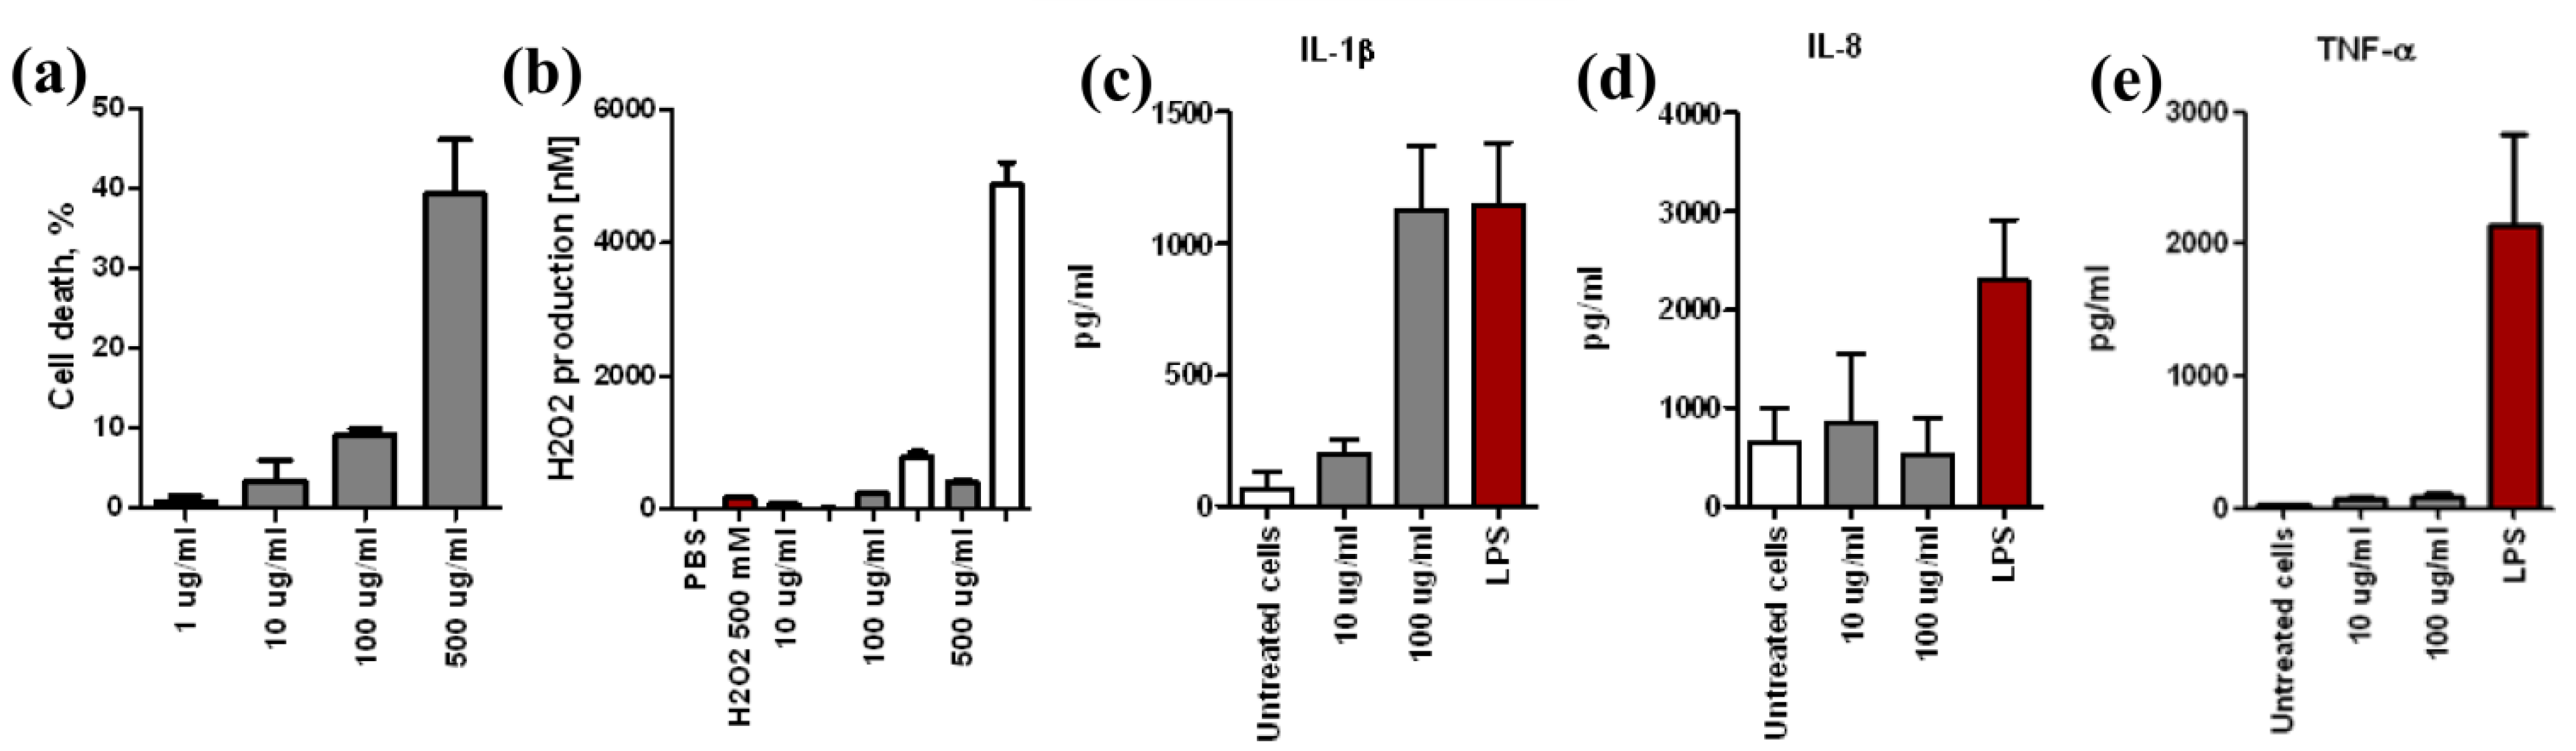
3.2. Assessment of NDs Toxicity in vitro

4. Discussion
4.1. Comparison of ND Exposure with Provisional Exposure Limit Values for Nanoparticles and Diesel Particulate Matter
4.2. Comparison of a Work Day ND Dose with a Daily Dose of Submicrometer Urban Background Particles
5. Conclusions
Acknowledgments
Author Contributions
Conflics of Interest
References
- Roco, M.C. The long view of nanotechnology development: The National Nanotechnology Initiative at 10 years. J. Nanopart. Res. 2011, 13, 427–445. [Google Scholar] [CrossRef]
- Organisation for Economic Co-operation and Development (OECD). Nanotechnology: An Overview based on Indicators and Statistics. Available online: http://www.oecd.org/sti/ (accessed on 13 May 2014).
- EC (European Commission). Directive 2008/50/EC of the European Parliament and of the Council of 21 May 2008 on Ambient Air Quality and Cleaner Air for Europe OJ L 152. Available online: http://eur-lex.europa.eu/en/index.htm (accessed on 13 May 2014).
- International Organization for Standardization. Nanotechnologies—Terminology and Definitions for Nanoobjects—Nanoparticle, Nanofibre and Nanoplate; ISO: Geneva, Switzerland, 2008. [Google Scholar]
- Borm, P.J.; Robbins, D.; Haubold, S.; Kuhlbusch, T.; Fissan, H.; Donaldson, K.; Schins, R.; Stone, V.; Kreyling, W.; Lademann, J.; et al. The potential risks of nanomaterials: A review carried out for ECETOC. Part. Fibre Toxicol. 2006, 3. [Google Scholar] [CrossRef]
- Savolainen, K.; Pylkkänen, L.; Norppa, H.; Falck, G.; Lindberg, H.; Tuomi, T.; Vippola, M.; Alenius, H.; Hämeri, K.; Koivisto, J.; et al. Nanotechnologies, engineered nanomaterials and occupational health and safety—A review. Saf. Sci. 2010, 48, 957–963. [Google Scholar]
- Yokel, R.A.; MacPhail, R.C. Engineered nanomaterials: Exposures, hazards, and risk prevention. J. Occup. Med. Toxicol. 2011, 6. [Google Scholar] [CrossRef]
- Hämeri, K.; Lähde, T.; Hussein, T.; Koivisto, J.; Savolainen, K. Facing the key workplace challenge: Assessing and preventing exposure to nanoparticles at source. Inhal. Toxicol. 2009, 21, 17–24. [Google Scholar]
- Geiser, M.; Kreyling, W.G. Deposition and biokinetics of inhaled nanoparticles. Part. Fibre Toxicol. 2010, 7. [Google Scholar] [CrossRef]
- European Centre for Ecotoxicology and Toxicology of Chemicals (ECETOC). Guidance on Assessment Factors to Derive a DNEL. Technical Report No. 110. 2010. Available online: http://members.ecetoc.org/Documents/Document/20110131112906-ECETOC_Technical_Report_110.pdf (accessed on 13 May 2014).
- Schulte, P.A.; Murashov, V.; Zumwalde, R.; Kuempel, E.D.; Geraci, C.L. Occupational exposure limits for nanomaterials: State of the art. J. Nanopart. Res. 2010, 12, 1971–1987. [Google Scholar] [CrossRef]
- Hussein, T.; Kulmala, M. Indoor aerosol modeling: Basic principles and practical applications. Water Air Soil Pollut. 2008, 8, 23–34. [Google Scholar] [CrossRef]
- Shneider, T.; Brouwer, D.H.; Koponen, I.K.; Jensen, K.A.; Fransman, W.; van Duuren-Stuurman, B.; van Tongeren, M.; Tielemans, E. Conceptual model for assessment of inhalation exposure to manufactured nanoparticles. J. Expo. Sci. Environ. Epidemiol. 2011, 21, 1–14. [Google Scholar] [CrossRef]
- Kuhlbusch, T.A.J.; Asbach, C.; Göhler, D.; Stintz, M. Nanoparticle exposure at nanotechnology workplaces: A review. Part. Fibre Toxicol. 2011, 8. [Google Scholar] [CrossRef]
- Koivisto, A.J.; Aromaa, M.; Mäkelä, J.M.; Pasanen, P.; Hussein, T.; Hämeri, K. Concept to estimate regional inhalation dose of industrially synthesized nanoparticles. ACS Nano 2012, 6, 1195–1203. [Google Scholar] [CrossRef]
- Koivisto, A.J.; Lyyränen, J.; Auvinen, A.; Vanhala, E.; Hämeri, K.; Tuomi, T.; Jokiniemi, J. Industrial worker exposure to airborne particles during the packing of pigment and nanoscale titanium dioxide. Inhal. Toxicol. 2012, 24, 839–849. [Google Scholar] [CrossRef]
- Asgharian, B.; Anjilvel, S. A multiple-path model of fiber deposition in the rat lung. Toxicol. Sci. 1988, 44, 80–86. [Google Scholar] [CrossRef]
- Stober, W.; Morrow, P.E.; Hoover, M.D. Compartmental modeling of the long term retention of insoluble particles deposited in the alveolar region of the lung. Fundam. Appl. Toxicol. 1989, 13, 823–842. [Google Scholar] [CrossRef]
- European Chemical Agency (ECHA). Guidance on Information Requirements and Chemical Safety Assessment. 2012. Ch. R.8.. Available online: http://echa.europa.eu/documents/10162/13632/information_requirements_r8_en.pdf (accessed on 13 May 2014).
- Liao, C.M.; Chiang, Y.H.; Chio, C.P. Model-based assessment for human inhalation exposure risk to airborne nano/fine titanium dioxide particles. Sci. Total Environ. 2008, 15, 165–177. [Google Scholar] [CrossRef]
- Liao, C.M.; Chiang, Y.-H.; Chio, C.P. Assessing the airborne titanium dioxide nanoparticle-related exposure hazard at workplace. J. Hazard. Mater. 2009, 162, 57–65. [Google Scholar] [CrossRef]
- Ling, M.-P.; Chio, C.-P.; Chou, W.-C.; Chen, W.-Y.; Hsieh, N.-H.; Lin, Y.-J.; Liao, C.-M. Assessing the potential exposure risk and control for airborne titanium dioxide and carbon black nanoparticles in the workplace. Environ. Sci. Pollut. Res. 2011, 18, 877–889. [Google Scholar] [CrossRef]
- Koivisto, A.J. Source Specific Risk Assessment of Indoor Aerosol Particles. In Report Series in Aerosol Science; University of Helsinki: Helsinki, Finland, 2013. [Google Scholar]
- Tomenson, J.A.; Morfeld, P. Errors and misunderstandings invalidate estimates of titanium dioxide inhalation risk. Sci. Total Environ. 2010, 408, 2173–2174; author reply 2175–2178. [Google Scholar] [CrossRef]
- Tomenson, J.A.; Morfeld, P. Multiple errors made by authors result in a huge overestimation of potential exposure to particles in the size range 10–30 nm in TiO2 nanoparticle production facilities. J. Hazard. Mater. 2010, 15, 954–955; author reply 941–942. [Google Scholar] [CrossRef]
- Morfeld, P.; McCunney, R.J.; Levy, L.; Chaudhuri, I.S. Inappropriate exposure data and misleading calculations invalidate the estimates of health risk for airborne titanium dioxide and carbon black nanoparticle exposures in the workplace. Environ. Sci. Pollut. Res. 2012, 19, 1326–1327; author reply 1328–1329. [Google Scholar] [CrossRef]
- Hansen, S.F. The European Union’s chemical legislation needs revision. Nat. Nanotechnol. 2013, 8, 305–306. [Google Scholar] [CrossRef]
- Qui, J. Nano-safety studies urged in China. Nature 2012, 489, 350–350. [Google Scholar] [CrossRef]
- Van Broekhuizen, P.; Dorbeck-Jung, B. Exposure limit values for nanomaterials—Capability and willingness of users to apply a precautionary approach. J. Occup. Environ. Hyg. 2012, 10, 46–53. [Google Scholar] [CrossRef]
- Nel, A.; Xia, T.; Meng, H.; Wang, X.; Lin, S.; Ji, Z.; Zhang, H. Nanomaterial toxicity testing in the 21st century—Use of a predictive toxicological approach and high-throughput screening. Acc. Chem. Res. 2013, 46, 607–621. [Google Scholar] [CrossRef]
- Snyder-Talkington, B.N.; Qian, Y.; Castranova, V.; Guo, N.L. New perspectives for in vitro—Risk assessment of multi-walled carbon nanotubes: Application of coculture and bioinformatics. J. Toxicol. Environ. Health Part B 2012, 15, 468–492. [Google Scholar] [CrossRef]
- Hinderliter, P.M.; Minard, K.R.; Orr, G.; Chrisler, W.B.; Thrall, B.D.; Pounds, J.G.; Teeguarden, J.G. ISDD: A computational model of particle sedimentation, diffusion and target cell dosimetry for in vitro toxicity studies. Part. Fibre Toxicol. 2010, 7. [Google Scholar] [CrossRef]
- Cohen, J.; DeLoid, G.; Pyrgiotakis, G.; Demokritou, P. Interactions of engineered nanomaterials in physiological media and implications for in vitro dosimetry. Nanotoxicology 2013, 7, 417–431. [Google Scholar] [CrossRef]
- Mochalin, V.N.; Shenderova, O.; Ho, D.; Gogotsi, Y. The properties and applications of nanodiamonds. Nat. Nannotechnol. 2011, 7, 11–23. [Google Scholar] [CrossRef]
- American Industrial Hygiene Association (AIHA). Respiratory Protection Committee: Respirator performance terminology (letter to the editor). Amer. Ind. Hyg. Assoc. J. 2002, 63, 130. [Google Scholar]
- Fierz, M.; Houle, C.; Steigmeier, P.; Burtscher, H. Design, calibration, and field performance of a miniature diffusion size classifier. Aerosol Sci. Technol. 2011, 45, 1–10. [Google Scholar] [CrossRef]
- Asbach, C.; Kaminski, H.; von Barany, D.; Kuhlbusch, T.A.; Monz, C.; Dziurowitz, N.; Pelzer, J.; Vossen, K.; Berlin, K.; Dietrich, S.; et al. Comparability of portable nanoparticle exposure monitors. Ann. Occup. Hyg. 2012, 56, 606–621. [Google Scholar]
- Baltensperger, U.; Weingartner, E.; Burtscher, H.; Keskinen, J. Dynamic Mass and Surface Area Measurements. In Aerosol Measurements: Principles, Techniques and Applications, 2nd ed.; Baron, P.A., Willeke, K., Eds.; Wiley-Interscience: New York, NY, USA, 2001; pp. 387–418. [Google Scholar]
- Ku, B.K.; Maynard, A.D. Comparing aerosol surface-area measurements of monodisperse ultrafine silver agglomerates by mobility analysis, transmission electron microscopy and diffusion charging. J. Aerosol Sci. 2005, 36, 1108–1124. [Google Scholar] [CrossRef]
- Heitbrink, W.A.; Evans, D.E.; Ku, B.K.; Maynard, A.D.; Slavin, T.J.; Peters, T.M. Relationships among particle number, surface area, and respirable mass concentrations in automotive engine manufacturing. J. Occup. Environ. Hyg. 2009, 6, 19–31. [Google Scholar]
- Cheng, Y.S. Condensation Detection and Diffusion Size Separation Techniques. In Aerosol Measurements: Principles, Techniques and Applications, 2nd ed.; Baron, P.A., Willeke, K., Eds.; Wiley-Interscience: NewYork, NY, USA, 2001; pp. 569–601. [Google Scholar]
- Geller, M.; Biswas, S.; Sioutas, C. Determination of particle effective density in urban environments with a differential mobility analyzer and APM analyzer. Aerosol Sci. Technol. 2006, 40, 709–723. [Google Scholar] [CrossRef]
- Sorensen, C.M. Light scattering by fractal aggregates: A review. Aerosol Sci. Technol. 2001, 35, 648–687. [Google Scholar] [CrossRef]
- Heintzenberg, J.; Okada, K.; Luo, B.P. Distribution of optical properties among atmospheric submicrometer particles of given electrical mobilities. J. Geouphys. Res. 2002, 107. [Google Scholar] [CrossRef]
- The International Commission on Radiological Protection (ICRP). Human respiratory tract model for radiological protection. Ann. ICRP 1994, 24, 1–482. [Google Scholar]
- Kelly, W.P.; McMurry, P.H. Measurement of particle density by inertial classification of differential mobility analyzer-generated monodisperse aerosol. Aerosol Sci. Technol. 1992, 17, 199–212. [Google Scholar] [CrossRef]
- Hinds, W.C. Uniform Particle Motion. In Aerosol Technology: Properties, Behavior, and Measurement of Airborne Particles, 2nd ed.; Hinds, W.C., Ed.; John Wiley & Sons Inc.: New York, NY, USA, 1999; pp. 43–74. [Google Scholar]
- Zelenyuk, A.; Cai, Y.; Imre, D. From Agglomerates of Spheres to Irregularly Shaped Particles: Determination of Dynamic Shape Factors from Measurements of Mobility and Vacuum Aerodynamic Diameters. Aerosol Sci. Technol. 2006, 40, 197–217. [Google Scholar] [CrossRef]
- Hinds, W.C. Respiratory Deposition. In Aerosol Technology: Properties, Behavior, and Measurement of Airborne Particles, 2nd ed.; Hinds, W.C., Ed.; John Wiley & Sons Inc.: New York, NY, USA, 1999; pp. 233–259. [Google Scholar]
- LeBel, C.P.; Ischiropoulos, H.; Bondy, S. Evaluation of the probe 2',7'-dichlorofluorescin as an indicator of reactive oxygen species formation and oxidative stress. Chem. Res. Toxicol. 1992, 5, 227–231. [Google Scholar] [CrossRef]
- Jacobsen, N.R.; Pojana, G.; White, P.; Møller, P.; Cohn, C.A.; Korsholm, K.S.; Vogel, U.; Marcomini, A.; Loft, S.; Wallin, H. Genotoxicity, cytotoxicity, and reactive oxygen species induced by single-walled carbon nanotubes and C60 fullerenes in the FE1-MutaTM mouse lung epithelial cells. Environ. Mol. Mutagen. 2008, 49, 476–487. [Google Scholar] [CrossRef]
- Choi, H.S.; Ashitate, Y.; Lee, J.H.; Kin, S.H.; Matsui, A.; Insin, N.; Bawendi, M.G.; Semmler-Behnke, M.; Frangioni, J.V.; Tsuda, A. Rapid translocation of nanoparticles from the lung airspaces to the body. Nat. Biotechnol. 2010, 28, 1300–1303. [Google Scholar] [CrossRef] [Green Version]
- Mills, N.L.; Donaldson, K.; Hadoke, P.W.; Boon, B.A.; MacNee, W.; Cassee, F.R.; Sandstöm, T.; Blomberg, A.; Newby, D.E. Adverse cardiovascular effects of air pollution. Nat. Clin. Pract. Cardiovasc. Med. 2009, 6, 36–44. [Google Scholar] [CrossRef]
- Block, M.L.; Calderón-Garcidueñas, L. Air pollution: Mechanisms of neuroinflammation and CNS disease. Trends Neurosci. 2009, 32, 506–516. [Google Scholar] [CrossRef]
- Joshi, G.N.; Knecht, D.A. Silica phagocytosis causes apoptosis and necrosis by different temporal and molecular pathways in alveolar macrophages. Apoptosis 2013, 18, 271–285. [Google Scholar] [CrossRef]
- Hornung, V.; Bauernfeind, F.; Halle, A.; Samstad, E.O.; Kono, H.; Rock, K.L.; Fitzgerald, K.A.; Latz, E. Silica crystals and aluminum salts activate the NALP3 inflammasome through phagosomal destabilization. Nat. Immunol. 2008, 9, 847–856. [Google Scholar] [CrossRef]
- Duewell, P. NLRP3 inflammasomes are required for atherogenesis and activated by cholesterol crystals. Nature 2010, 464, 1357–1361. [Google Scholar] [CrossRef]
- Palomäki, J.; Välimäki, E.; Sund, J.; Vippola, M.; Clausen, P.A.; Jensen, K.A.; Savolainen, K.; Matikainen, S.; Alenius, H. Long, needle-like carbon nanotubes and asbestos activate the NLRP3 inflammasome through a similar mechanism. ACS Nano 2011, 5, 6861–6870. [Google Scholar] [CrossRef]
- Haniu, H.; Saito, N.; Matsuda, Y.; Kim, Y.-A.; Park, K.C.; Tsukahara, T. Effect of dispersants of multi-walled carbon nanotubes on cellular uptake and biological responses. Int. J. Nanomed. 2011, 6, 3295–3307. [Google Scholar]
- Demokritou, P.; Gass, S.; Pyrgiotakis, G.; Cohen, J.M.; Goldsmith, W.; McKinney, W.; Frazer, D.; Ma, J.; Schwegler-Berry, D.; Brain, J.; et al. An in vivo and in vitro toxicological characterisation of realistic nanoscale CeO2 inhalation exposures. Nanotoxicology 2013, 7, 1338–1350. [Google Scholar] [CrossRef]
- Khatri, M.; Bello, D.; Pal, A.K.; Cohen, J.M.; Woskie, S.; Gassert, T.; Lan, J.; Gu, A.Z.; Demokritou, P.; Gaines, P. Evaluation of cytotoxic, genotoxic and inflammatory responses of nanoparticles from photocopiers in three human cell lines. Part. Fibre Toxicol. 2013, 10. [Google Scholar] [CrossRef]
- Khatri, M.; Bello, D.; Gaines, P.; Martin, J.; Pal, A.; Gore, R.; Woskie, S. Nanoparticles from photocopiers induce oxidative stress and upper respiratory tract inflammation in healthy volunteers. Nanotoxicology 2013, 7, 1014–1027. [Google Scholar] [CrossRef]
- Pirella, S.; Molina, R.; Watson, C.; Cohen, J.; Bello, D.; Demokritou, P.; Brain, J. Effects of copy center particles on the lungs: A toxicological characterization using a Balb/c mice model. Inhal. Toxicol. 2013, 25, 498–508. [Google Scholar] [CrossRef]
- Institut für Arbeitsschutz der Deutschen Gesetzlichen Unfallversicherung (IFA). Criteria for Assessment of the Effectiveness of Protective Measures, 2010. Available online: http://www.dguv.de/ifa/en/fac/nanopartikel/beurteilungsmassstaebe/index.jsp (accessed on 13 May 2013).
- Van Broekhuizen, P.; van Veelen, W.; Streekstra, W.H.; Schulte, P.; Reijnders, L. Exposure limits for nanoparticles: Report of an international workshop on nano reference values. Ann. Occup. Hyg. 2012, 56, 515–524. [Google Scholar]
- United States Environmental Protection Agency (USEPA). Health Assessment Document for Diesel Engine Exhaust, 2002. Available online: http://cfpub.epa.gov/ncea/cfm/recordisplay.cfm?deid=29060 (accessed on 13 May 2013).
- Koivisto, A.J.; Hussein, T.; Niemelä, R.; Tuomi, T.; Hämeri, K. Impact of particle emissions of new laser printers on modeled office room. Atmos. Environ. 2010, 44, 2140–2146. [Google Scholar]
- Van Duuren-Stuurman, B.; Vink, S.R.; Verbist, K.J.M.; Heussen, H.G.A.; Brouwer, D.H.; Kroese, D.E.D.; van Niftrik, M.F.J.; Tielemans, E.; Fransman, W. Stoffenmanager Nano Version 1.0: A Web-based tool for risk prioritization of airborne manufactured nano objects. Ann. Occup. Hyg. 2012, 56, 525–541. [Google Scholar]
- Hussein, T.; Löndahl, J.; Paasonen, P.; Koivisto, A.J.; Petäjä, T.; Hämeri, K.; Kulmala, K. Modeling regional inhaled dose of submicron aerosol particles. Sci. Total Environ. 2013, 458–460, 140–149. [Google Scholar] [CrossRef]
- International Agency for Research on Cancer (IARC). IARC: Diesel Engine Exhaust Carcinogenic; IARC: Lyon, France, 2012. [Google Scholar]
- International Agency for Research on Cancer (IARC). IARC: Outdoor Air Pollution a Leading Environmental Cause of Cancer Deaths; IARC: Lyon, France, 2013. [Google Scholar]
- Schrand, A.M.; Huang, H.; Carlson, C.; Schlager, J.J.; Ōsawa, E.; Hussain, S.M.; Dai, L. Are diamond nanoparticles cytotoxic? J. Phys. Chem. B 2007, 111, 2–7. [Google Scholar]
- Schrand, A.M.; Hens, S.A.C.; Shenderova, O.A. Nanodiamond particles: Properties and perspectives for bioapplications. Crit. Rev. Solid State Mater. Sci. 2009, 34, 18–74. [Google Scholar]
Appendix
Metrics to Characterize ND Concentrations
| Metric Ratio | Instrument | WT1/BG1 | WT2/BG2 | WT3/BG2 |
|---|---|---|---|---|
| Number ratio | SMPS a | 0.90 | 0.93 | 0.92 |
| SMPS + OPC | 1.11 | 1.16 | 0.87 | |
| ELPI | 1.11 | 1.14 | 0.83 | |
| CPC | 1.18 | 1.16 | 0.80 | |
| DISCmini | 0.85 | 1.22 | 0.93 | |
| Current ratio | DISCmini b | 0.914 | 1.10 | 0.92 |
| ELPI c | 1.02 | 1.17 | 0.96 | |
| Mass ratio | ELPI | 1.14 | 1.32 | 0.62 |
| SMPS + OPC | 1.04 | 2.29 | 1.41 |
Supplementary Files
© 2014 by the authors; licensee MDPI, Basel, Switzerland. This article is an open access article distributed under the terms and conditions of the Creative Commons Attribution license (http://creativecommons.org/licenses/by/3.0/).
Share and Cite
Koivisto, A.J.; Palomäki, J.E.; Viitanen, A.-K.; Siivola, K.M.; Koponen, I.K.; Yu, M.; Kanerva, T.S.; Norppa, H.; Alenius, H.T.; Hussein, T.; et al. Range-Finding Risk Assessment of Inhalation Exposure to Nanodiamonds in a Laboratory Environment. Int. J. Environ. Res. Public Health 2014, 11, 5382-5402. https://doi.org/10.3390/ijerph110505382
Koivisto AJ, Palomäki JE, Viitanen A-K, Siivola KM, Koponen IK, Yu M, Kanerva TS, Norppa H, Alenius HT, Hussein T, et al. Range-Finding Risk Assessment of Inhalation Exposure to Nanodiamonds in a Laboratory Environment. International Journal of Environmental Research and Public Health. 2014; 11(5):5382-5402. https://doi.org/10.3390/ijerph110505382
Chicago/Turabian StyleKoivisto, Antti J., Jaana E. Palomäki, Anna-Kaisa Viitanen, Kirsi M. Siivola, Ismo K. Koponen, Mingzhou Yu, Tomi S. Kanerva, Hannu Norppa, Harri T. Alenius, Tareq Hussein, and et al. 2014. "Range-Finding Risk Assessment of Inhalation Exposure to Nanodiamonds in a Laboratory Environment" International Journal of Environmental Research and Public Health 11, no. 5: 5382-5402. https://doi.org/10.3390/ijerph110505382