
Carbon Balance and Contribution of Harvested Wood Products in China Based on the Production Approach of the Intergovernmental Panel on Climate Change


Abstract
:1. Introduction
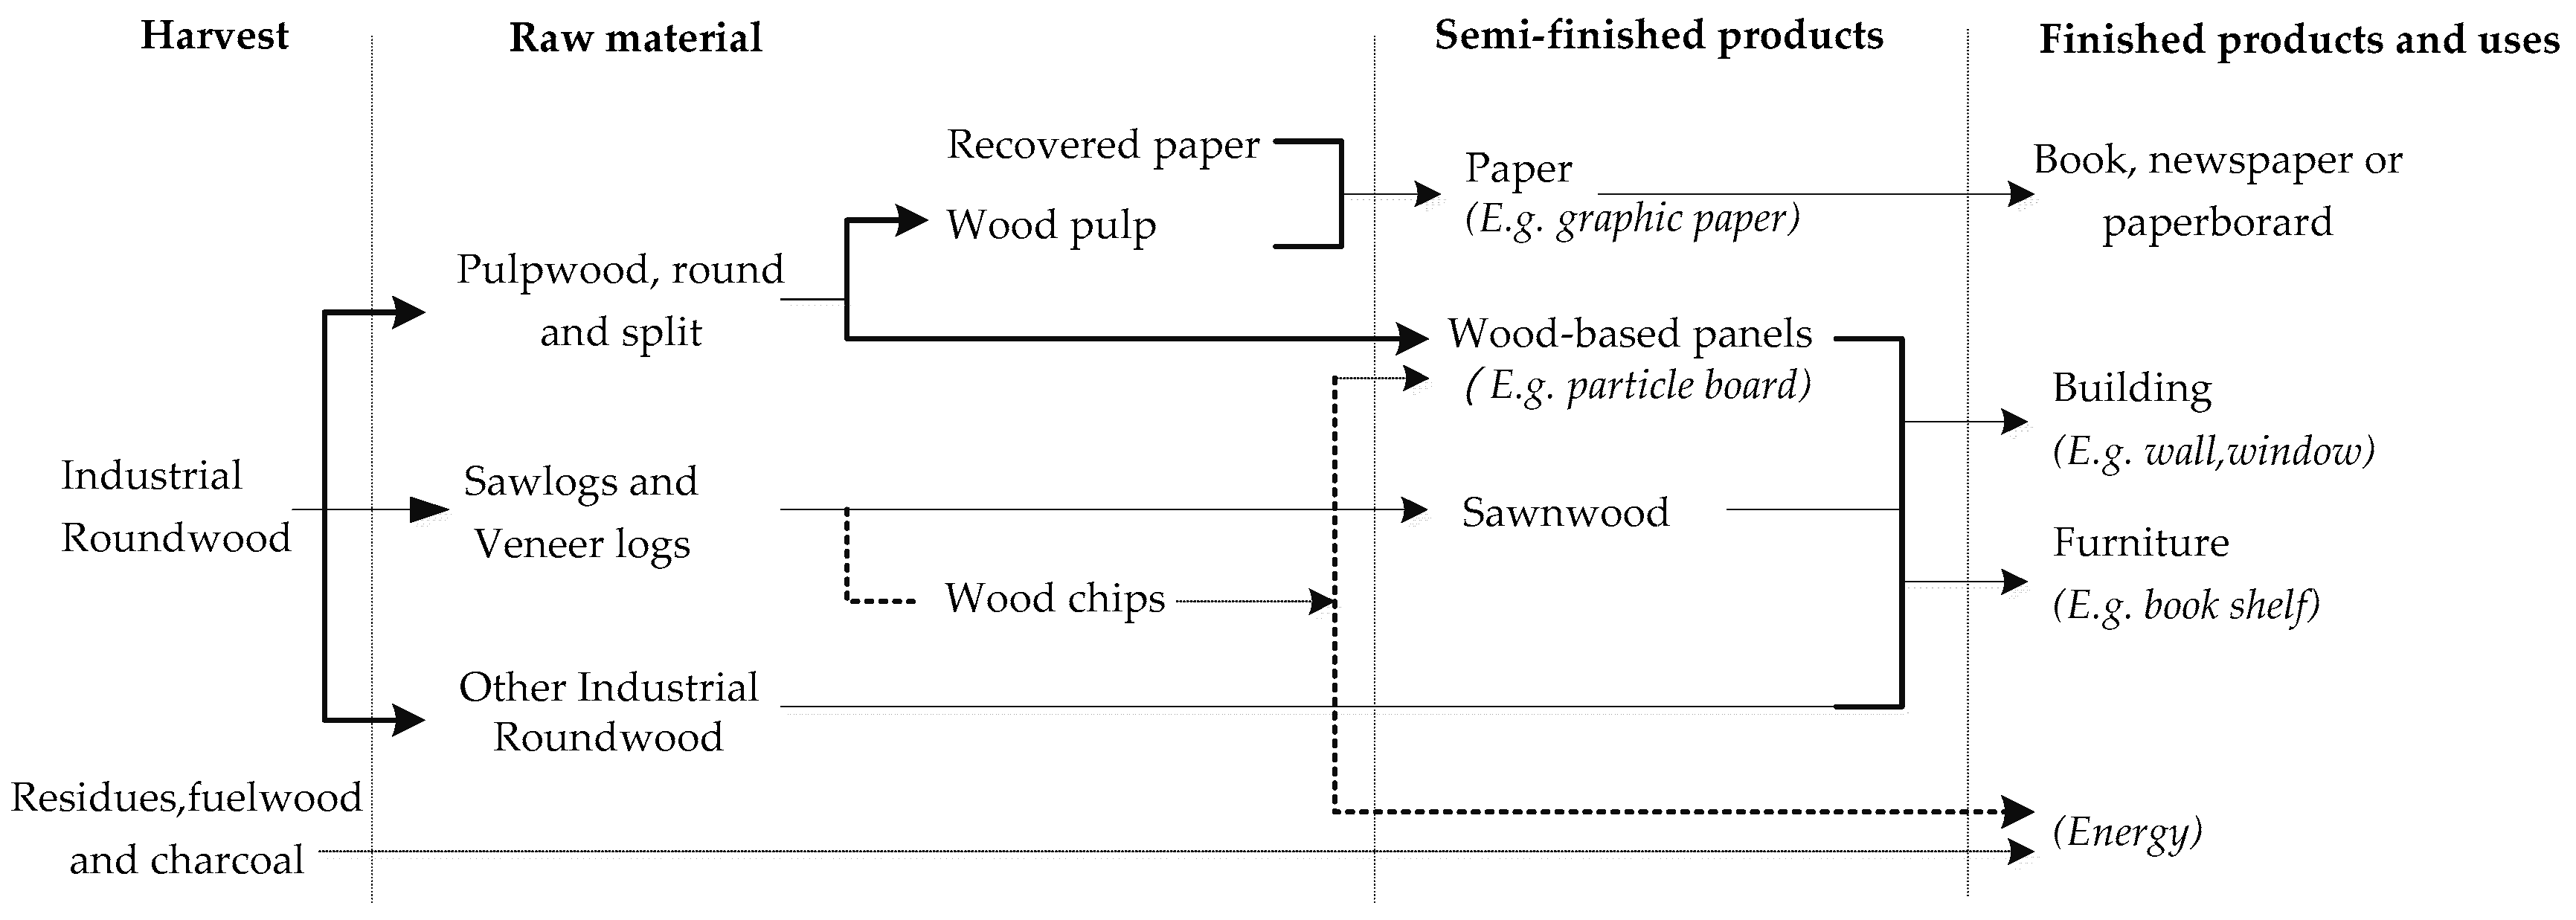
2. Basic Mechanism
2.1. HWP Carbon Stock
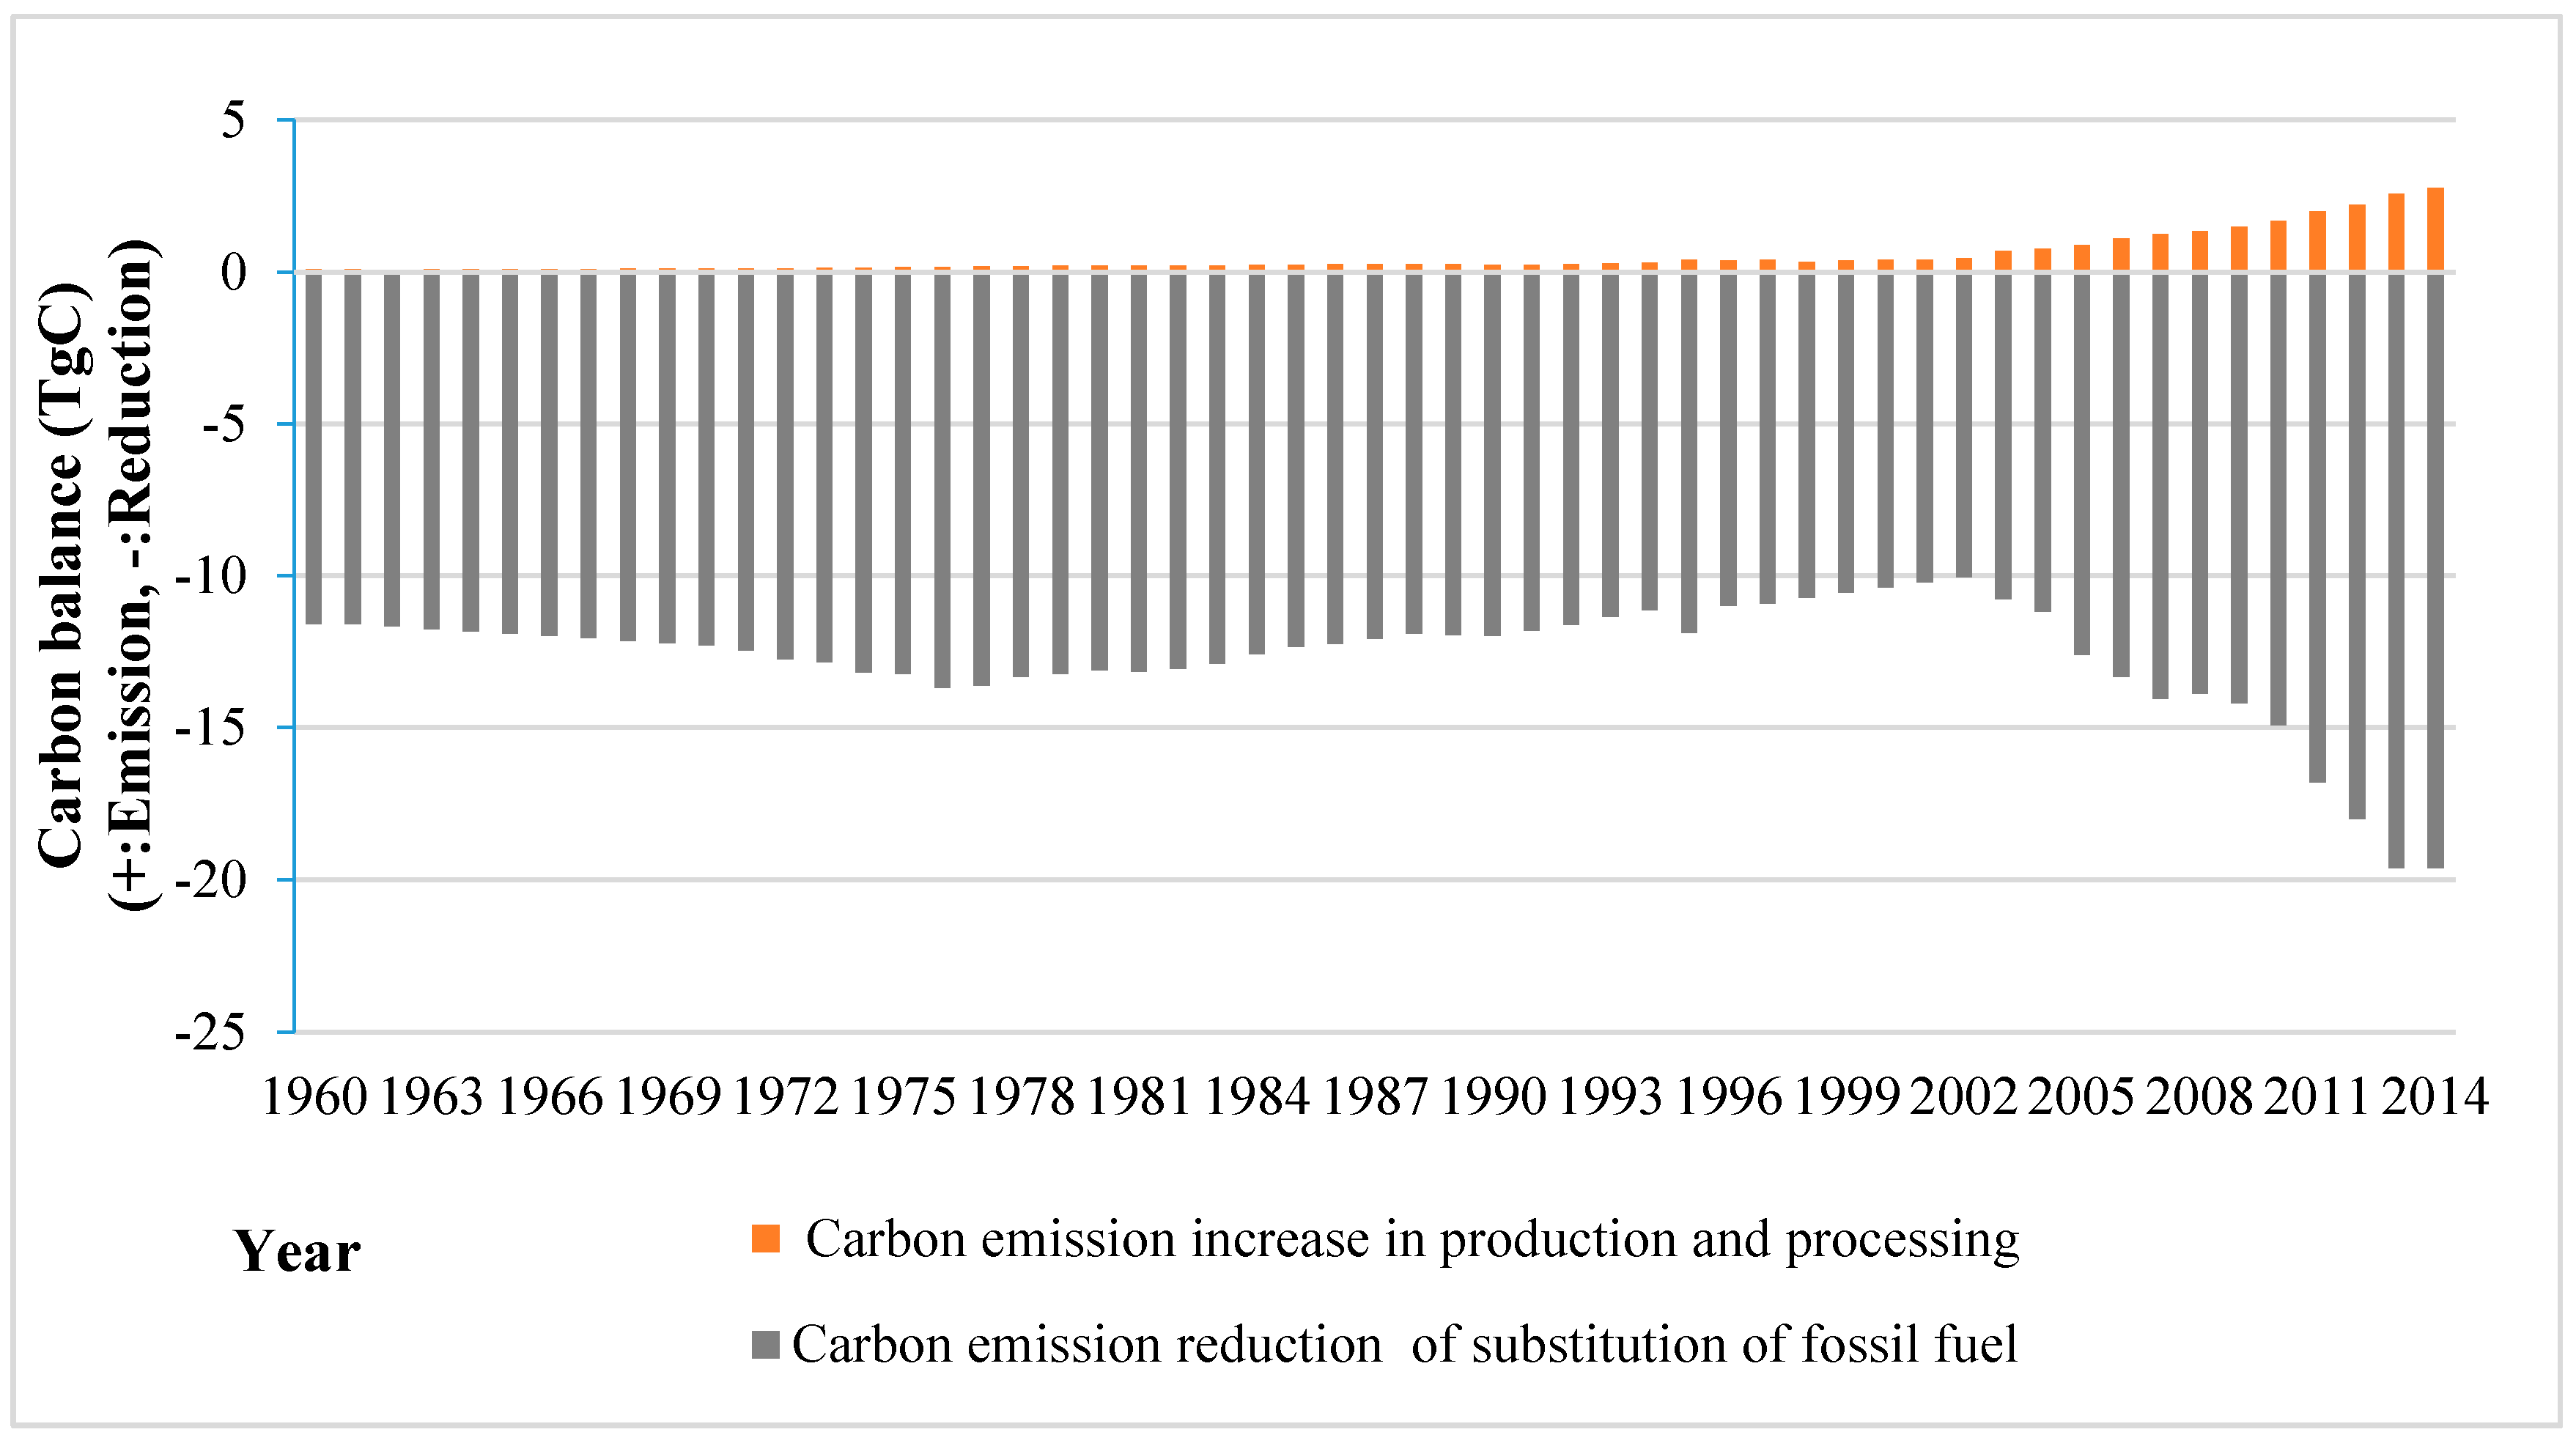
2.2. HWP Carbon Balance
2.2.1. Carbon Substitution
2.2.2. Carbon Emission
2.3. HWP Carbon Contribution
3. Methodology and Data
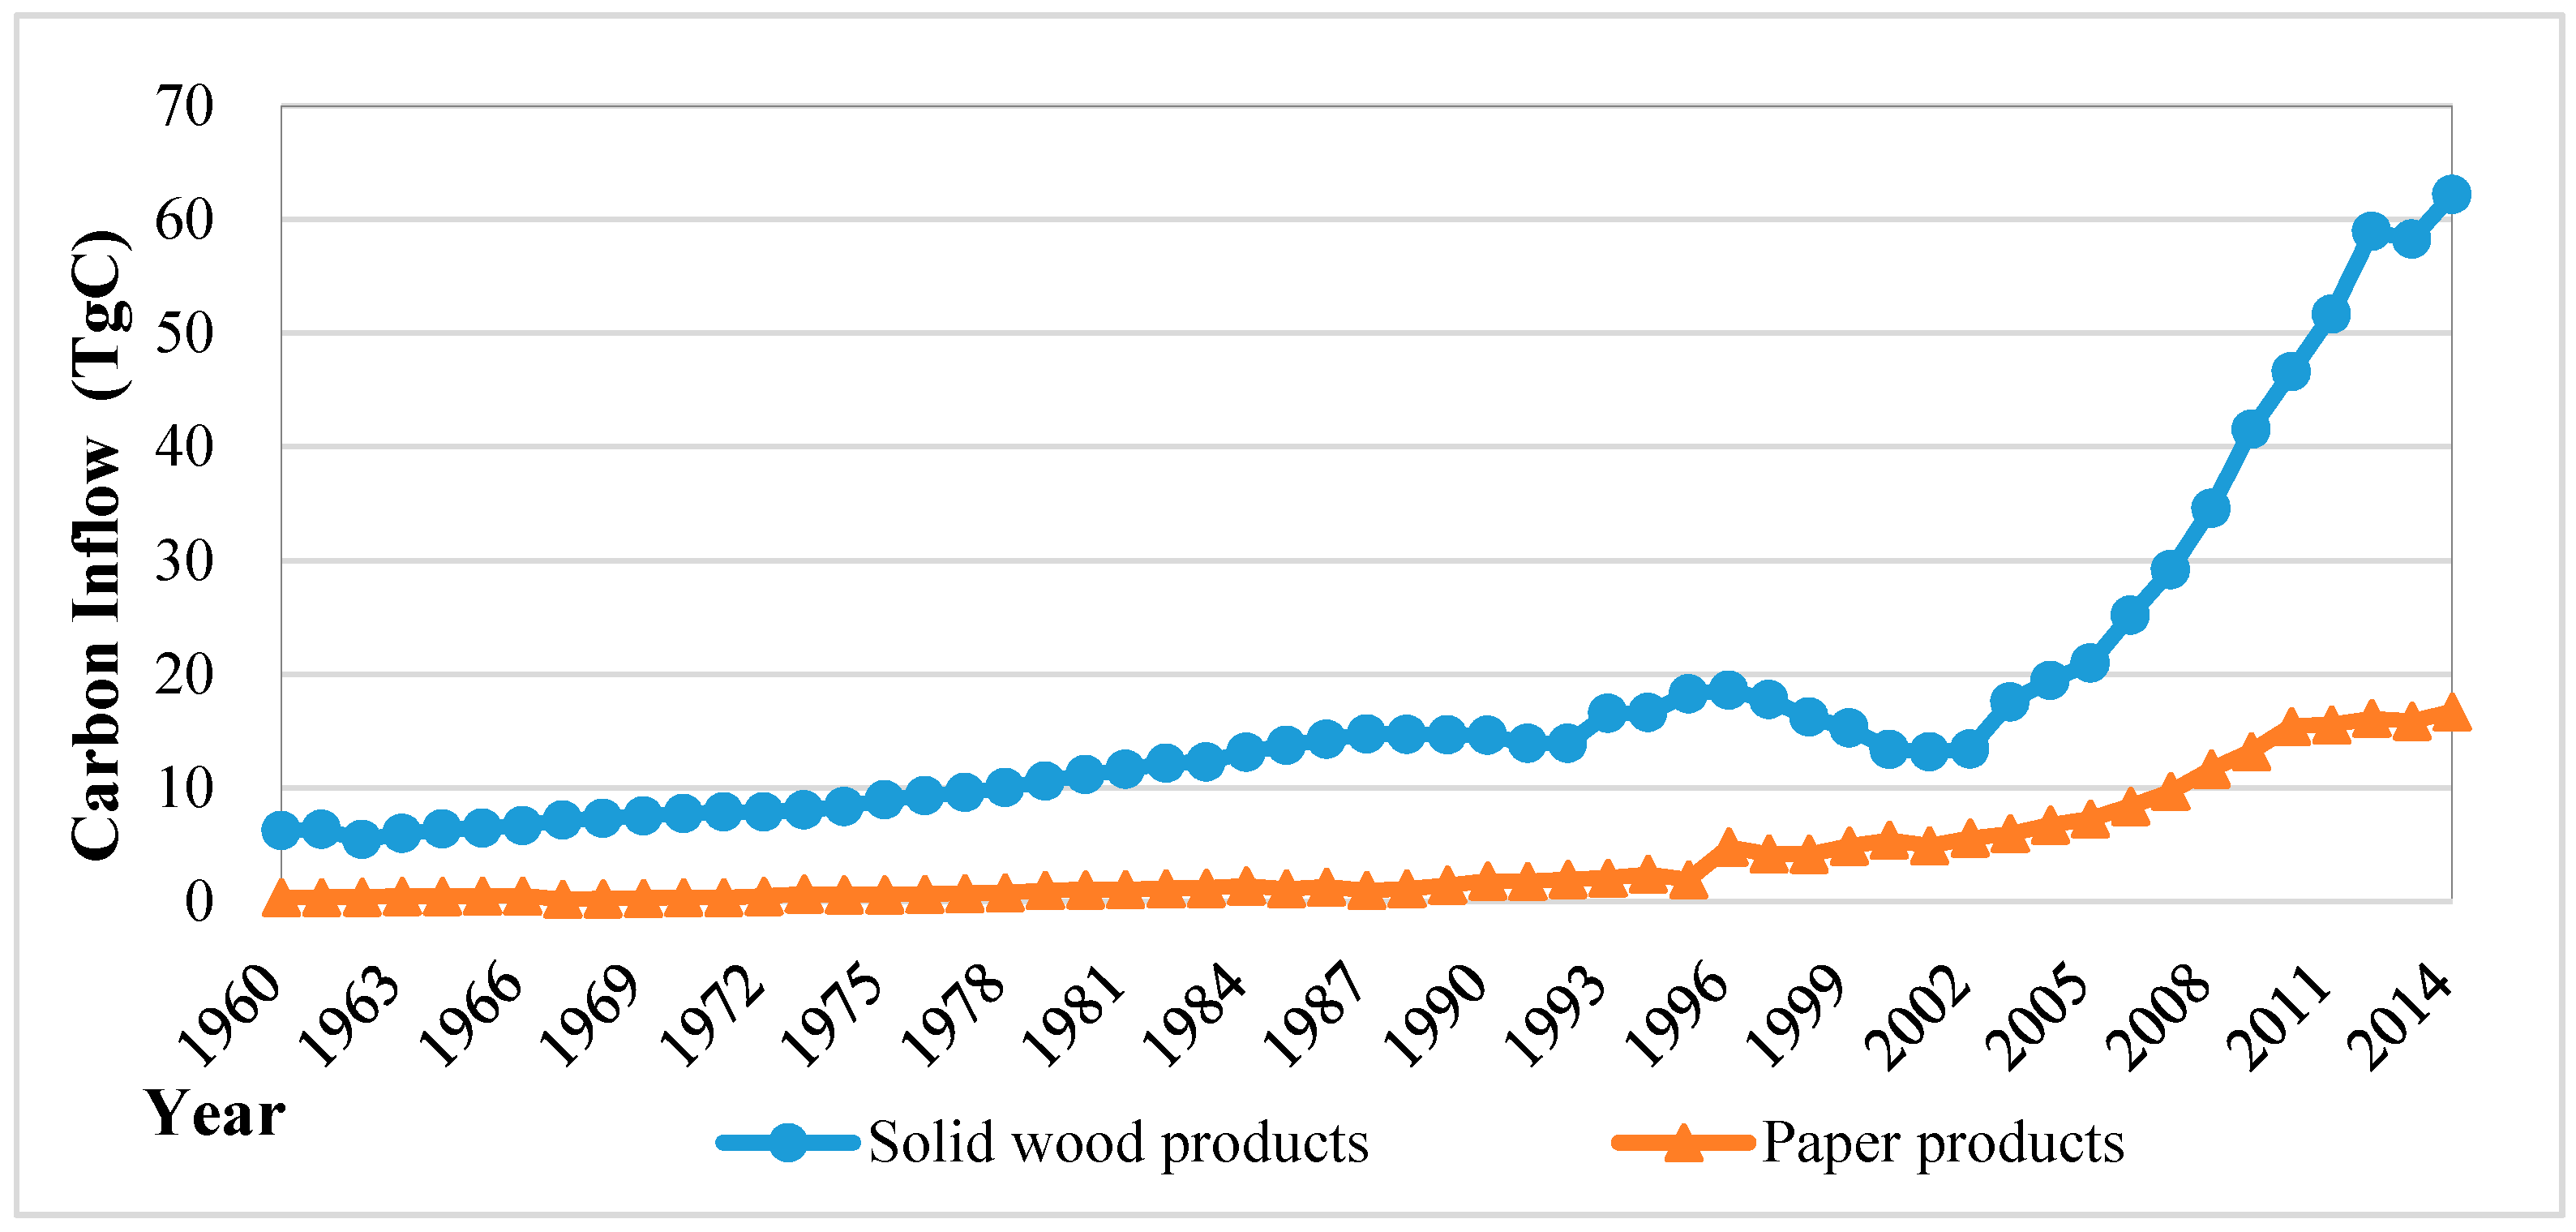
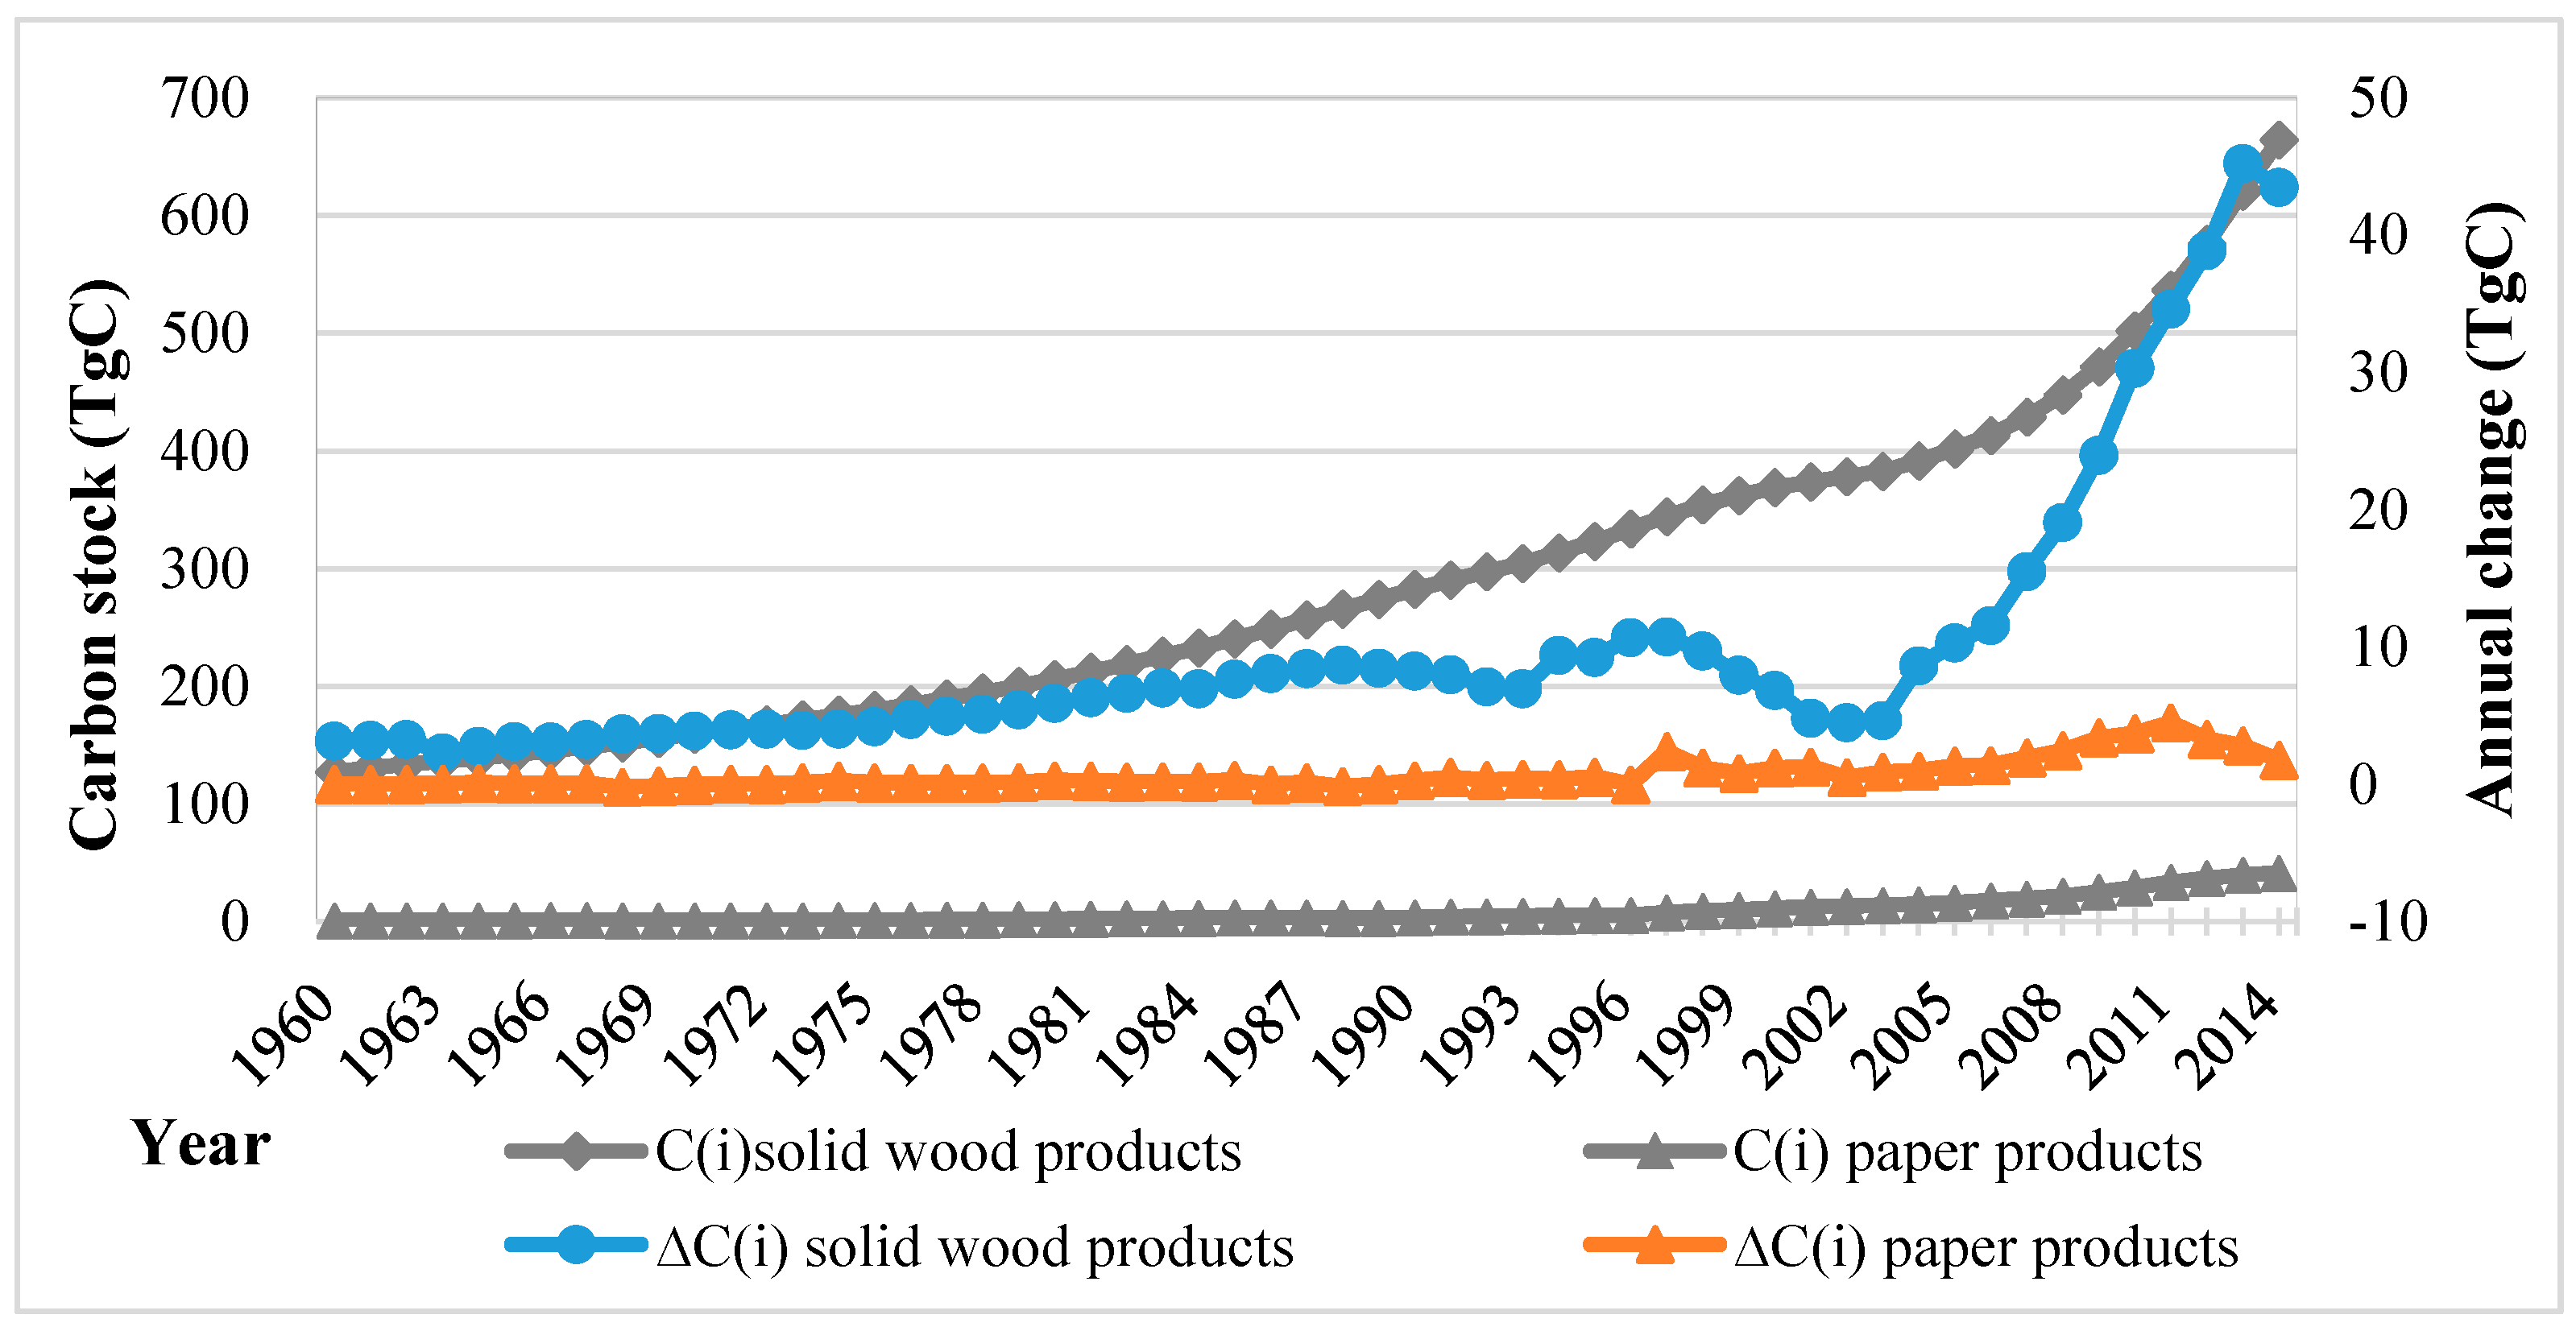
3.1. Carbon Stock and Its Annual Change
3.2. Carbon Substitution for Fossil Fuel
3.3. Data Acquisition
4. Results
4.1. Carbon Stock and Annual Change in the HWP Pool
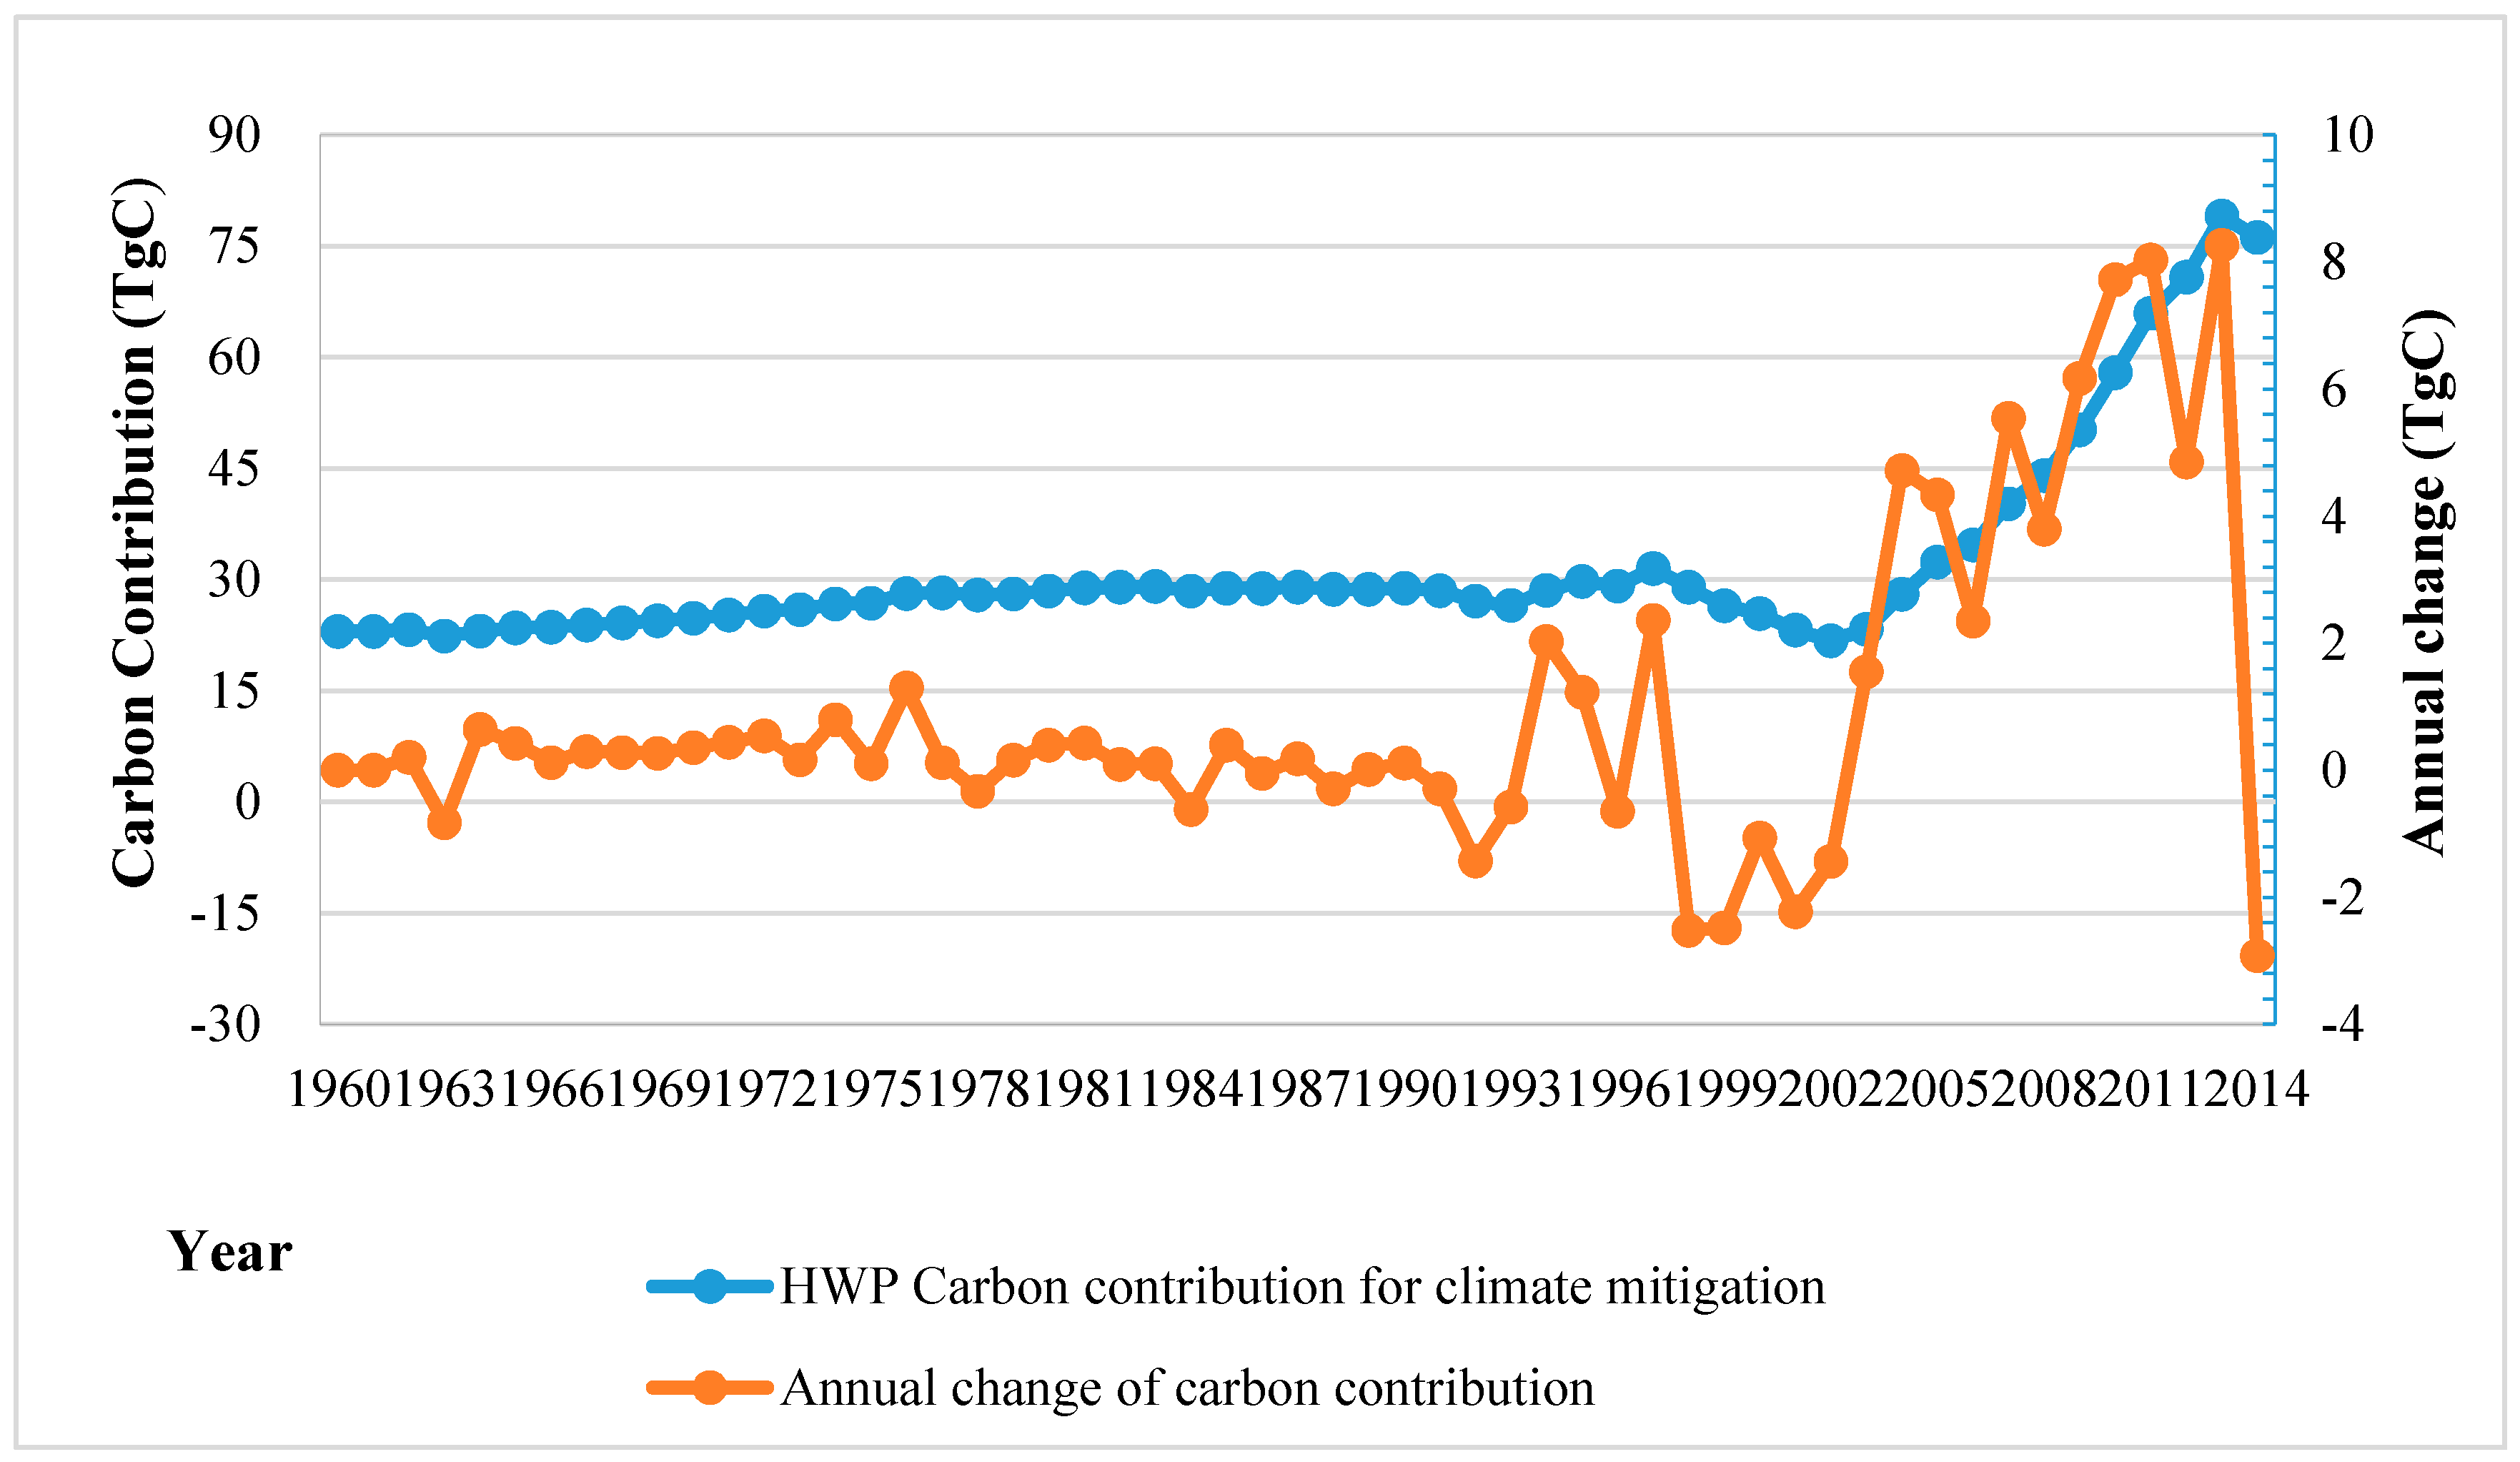
4.2. Carbon Balance and Contribution to Climate Mitigation
5. Discussion
5.1. Carbon Stock in Wood Products
5.2. Carbon Balance and Contribution
6. Conclusions
Acknowledgments
Author Contributions
Conflicts of Interest
Appendix A

| HWP Categories | Density | Carbon Fraction | Value |
|---|---|---|---|
| Carbon Conversion Factor | (oven-dry tonne·m−3) | - | (tonne C·m−3) |
| Industrial Roudwood (Aggregate) | 0.52 | 0.5 | 0.260 |
| Coniferous | 0.45 | 0.5 | 0.225 |
| Non-Coniferous | 0.59 | 0.5 | 0.295 |
| Sawnwood (Aggregate) | 0.458 | 0.5 | 0.229 |
| Coniferous | 0.45 | 0.5 | 0.225 |
| Non-Coniferous | 0.56 | 0.5 | 0.280 |
| Wood-Based Panels (Aggregate) | 0.595 | 0.454 | 0.270 |
| Hardboard | 0.788 | 0.425 | 0.335 |
| Insulating Board | 0.159 | 0.474 | 0.075 |
| Particle Board | 0.596 | 0.451 | 0.269 |
| Plywood | 0.542 | 0.493 | 0.267 |
| Veneer Sheets | 0.505 | 0.5 | 0.253 |
| Wood Fuel and Residue (Aggregate) | 0.52 | 0.5 | 0.260 |
| Coniferous | 0.45 | 0.5 | 0.225 |
| Non-Coniferous | 0.59 | 0.5 | 0.295 |
| Carbon Conversion Factor | (oven-dry tonne air dry·tonne−1) | - | (tonne C air dry·tonne−1) |
| Paper and Paperboard | 0.9 | 0.428 | 0.385 |
| Wood Charcoal | 0.9 | 0.85 | 0.765 |
| Item | Value |
|---|---|
| Carbon Emission Intensity | (KgC·m−3) |
| Industrial Roundwood Production | 1.58 |
| Sawnwood Processing | 2.16 |
| Plywood Processing | 12.42 |
| Woodchip Processing | 0.31 |
| Carbon Substitution Factor | - |
| Substitute for Coal | 0.96 |
| Substitute for Oil | 0.79 |
| Substitute for Natural Gas | 0.56 |
References
- Intergovernmental Panel on Climate Change (IPCC). Chapter 12: Harvest wood products. In 2006 IPCC Guidelines for National Greenhouse Gas Inventories; Cambridge University Press: Cambridge, UK, 2006; Volume 4. [Google Scholar]
- Richard, S.; Martin, J.; Paul, M.; Andre, F. The GHG contribution of the cascaded use of harvested wood products in comparison with the use of wood for energy—A case study on available forest resources in Canada. Environ. Sci. Policy 2013, 31, 96–108. [Google Scholar]
- Winjum, J.K.; Sandra, B.; Bernhard, S. Forest harvests and wood products: Sources and sinks of atmospheric carbon dioxide. Forest Sci. 1998, 44, 272–284. [Google Scholar]
- Goodale, C.L.; Michael, J.; Apps, R.A.; Birdsey, C.B.; Field, L.S.; Heath, R.A.; Houghton, J.C.; Jenkins, G.H.; Kohlmaier, W.K.; Liu, S.R.; et al. Forest carbon sinks in the Northern Hemisphere. Ecol. Appl. 2002, 12, 891–899. [Google Scholar] [CrossRef]
- Hashimoto, S.; Nose, M.; Obara, T.; Moriguchi, Y. Wood products: Potential carbon sequestration and impact on net carbon emissions of industrialized countries. Environ. Sci. Policy 2002, 5, 183–193. [Google Scholar] [CrossRef]
- Pingoud, K.; Perälä, A.L.; Pussinen, A. Carbon dynamics in wood products. Mitig. Adapt. Strateg. Glob. Chang. 2001, 6, 91–111. [Google Scholar] [CrossRef]
- Skog, K.E. Sequestration of Carbon in harvested wood products for the United States. Forest Prod. J. 2008, 58, 56–72. [Google Scholar]
- Woodbury, P.B.; James, E.S.; Linda, S.H. Carbon sequestration in the U.S. forest sector from 1990 to 2010. Forest Ecol. Manag. 2007, 241, 14–27. [Google Scholar] [CrossRef]
- Krankina, O.N.; Harmon, M.E.; Winjum, J.K. Carbon storage and sequestration in the Russian forest sector. Ambio (Stockholm) 1996, 25, 284–288. [Google Scholar]
- Ji, C.Y.; Yang, H.Q.; Nie, Y.; Hong, Y.X. Carbon sequestration and carbon flow in harvested wood products for China. Int. Forest Rev. 2013, 15, 160–168. [Google Scholar] [CrossRef]
- Green, C.; Avitabile, V.; Farrell, E.P.; Byrne, K.A. Reporting harvested wood products in national greenhouse gas inventories: Implications for Ireland. Biomass Bioenergy 2006, 30, 105–114. [Google Scholar] [CrossRef]
- Dias, A.C.; Louro, M.; Arroja, L.; Capela, I. Carbon estimation in harvested wood products using a country-specific method: Portugal as a case study. Environ. Sci. Policy 2007, 10, 250–259. [Google Scholar] [CrossRef]
- Choi, S.I.; Kang, H.M. The Change in Carbon stocks and emissions assessment of harvested wood products in Korea. J. Korean Forest 2007, 96, 644–651. [Google Scholar]
- Tonn, B.; Marland, G. Carbon sequestration in wood products: A method for attribution to multiple parties. Environ. Sci. Policy 2007, 10, 162–168. [Google Scholar] [CrossRef]
- Intergovernmental Panel on Climate Change. 2013 Revised Supplementary Methods and Good Practice Guidance Arising from the Kyoto Protocol; Intergovernmental Panel on Climate Change: Geneva, Switzerland, 2014. [Google Scholar]
- White, M.K.; Gower, S.T.; Ahl, D.E. Life cycle inventories of roundwood production in Northern Wisconsin: Inputs into an industrial forest carbon budget. Forest Ecol. Manag. 2005, 219, 13–28. [Google Scholar] [CrossRef]
- Chihiro, K.; Yuko, T.; Hideshi, N.; Mario, T. Carbon balance assessments of harvested wood products in Japan taking account of inter-regional flows. Environ. Sci. Policy 2014, 37, 215–226. [Google Scholar]
- Zhang, X.B.; Yang, H.Q. Dynamic projection of storage efficiency and carbon pool structure of China’s harvested wood products based on GFPM. Resour. Sci. 2015, 37, 1403–1413. [Google Scholar]
- Sathre, R.; Gustavsson, L. Energy and carbon balances of wood cascade chains. Resour. Conserv. Recy. 2006, 47, 332–355. [Google Scholar] [CrossRef]
- Schlamadinger, B.; Apps, M.; Bohlin, F.; Gustavsson, L.; Jungmeier, G.; Marland, G.; Pingoud, K.; Savolainen, I. Towards a standard methodology for greenhouse gas balances of bioenergy Systems in comparison with fossil energy systems. Biomass Bioenergy 1997, 13, 359–375. [Google Scholar] [CrossRef]
- Yang, H.; Zhang, X. A rethinking of the production approach in IPCC: Its objectiveness in China. Sustainability 2016, 8, 216. [Google Scholar] [CrossRef]

© 2016 by the authors; licensee MDPI, Basel, Switzerland. This article is an open access article distributed under the terms and conditions of the Creative Commons Attribution (CC-BY) license (http://creativecommons.org/licenses/by/4.0/).
Share and Cite
Ji, C.; Cao, W.; Chen, Y.; Yang, H. Carbon Balance and Contribution of Harvested Wood Products in China Based on the Production Approach of the Intergovernmental Panel on Climate Change. Int. J. Environ. Res. Public Health 2016, 13, 1132. https://doi.org/10.3390/ijerph13111132
Ji C, Cao W, Chen Y, Yang H. Carbon Balance and Contribution of Harvested Wood Products in China Based on the Production Approach of the Intergovernmental Panel on Climate Change. International Journal of Environmental Research and Public Health. 2016; 13(11):1132. https://doi.org/10.3390/ijerph13111132
Chicago/Turabian StyleJi, Chunyi, Wenbin Cao, Yong Chen, and Hongqiang Yang. 2016. "Carbon Balance and Contribution of Harvested Wood Products in China Based on the Production Approach of the Intergovernmental Panel on Climate Change" International Journal of Environmental Research and Public Health 13, no. 11: 1132. https://doi.org/10.3390/ijerph13111132