
Short-Term Associations between Air Pollution Concentrations and Respiratory Health—Comparing Primary Health Care Visits, Hospital Admissions, and Emergency Department Visits in a Multi-Municipality Study


Abstract
:1. Introduction
2. Methodology
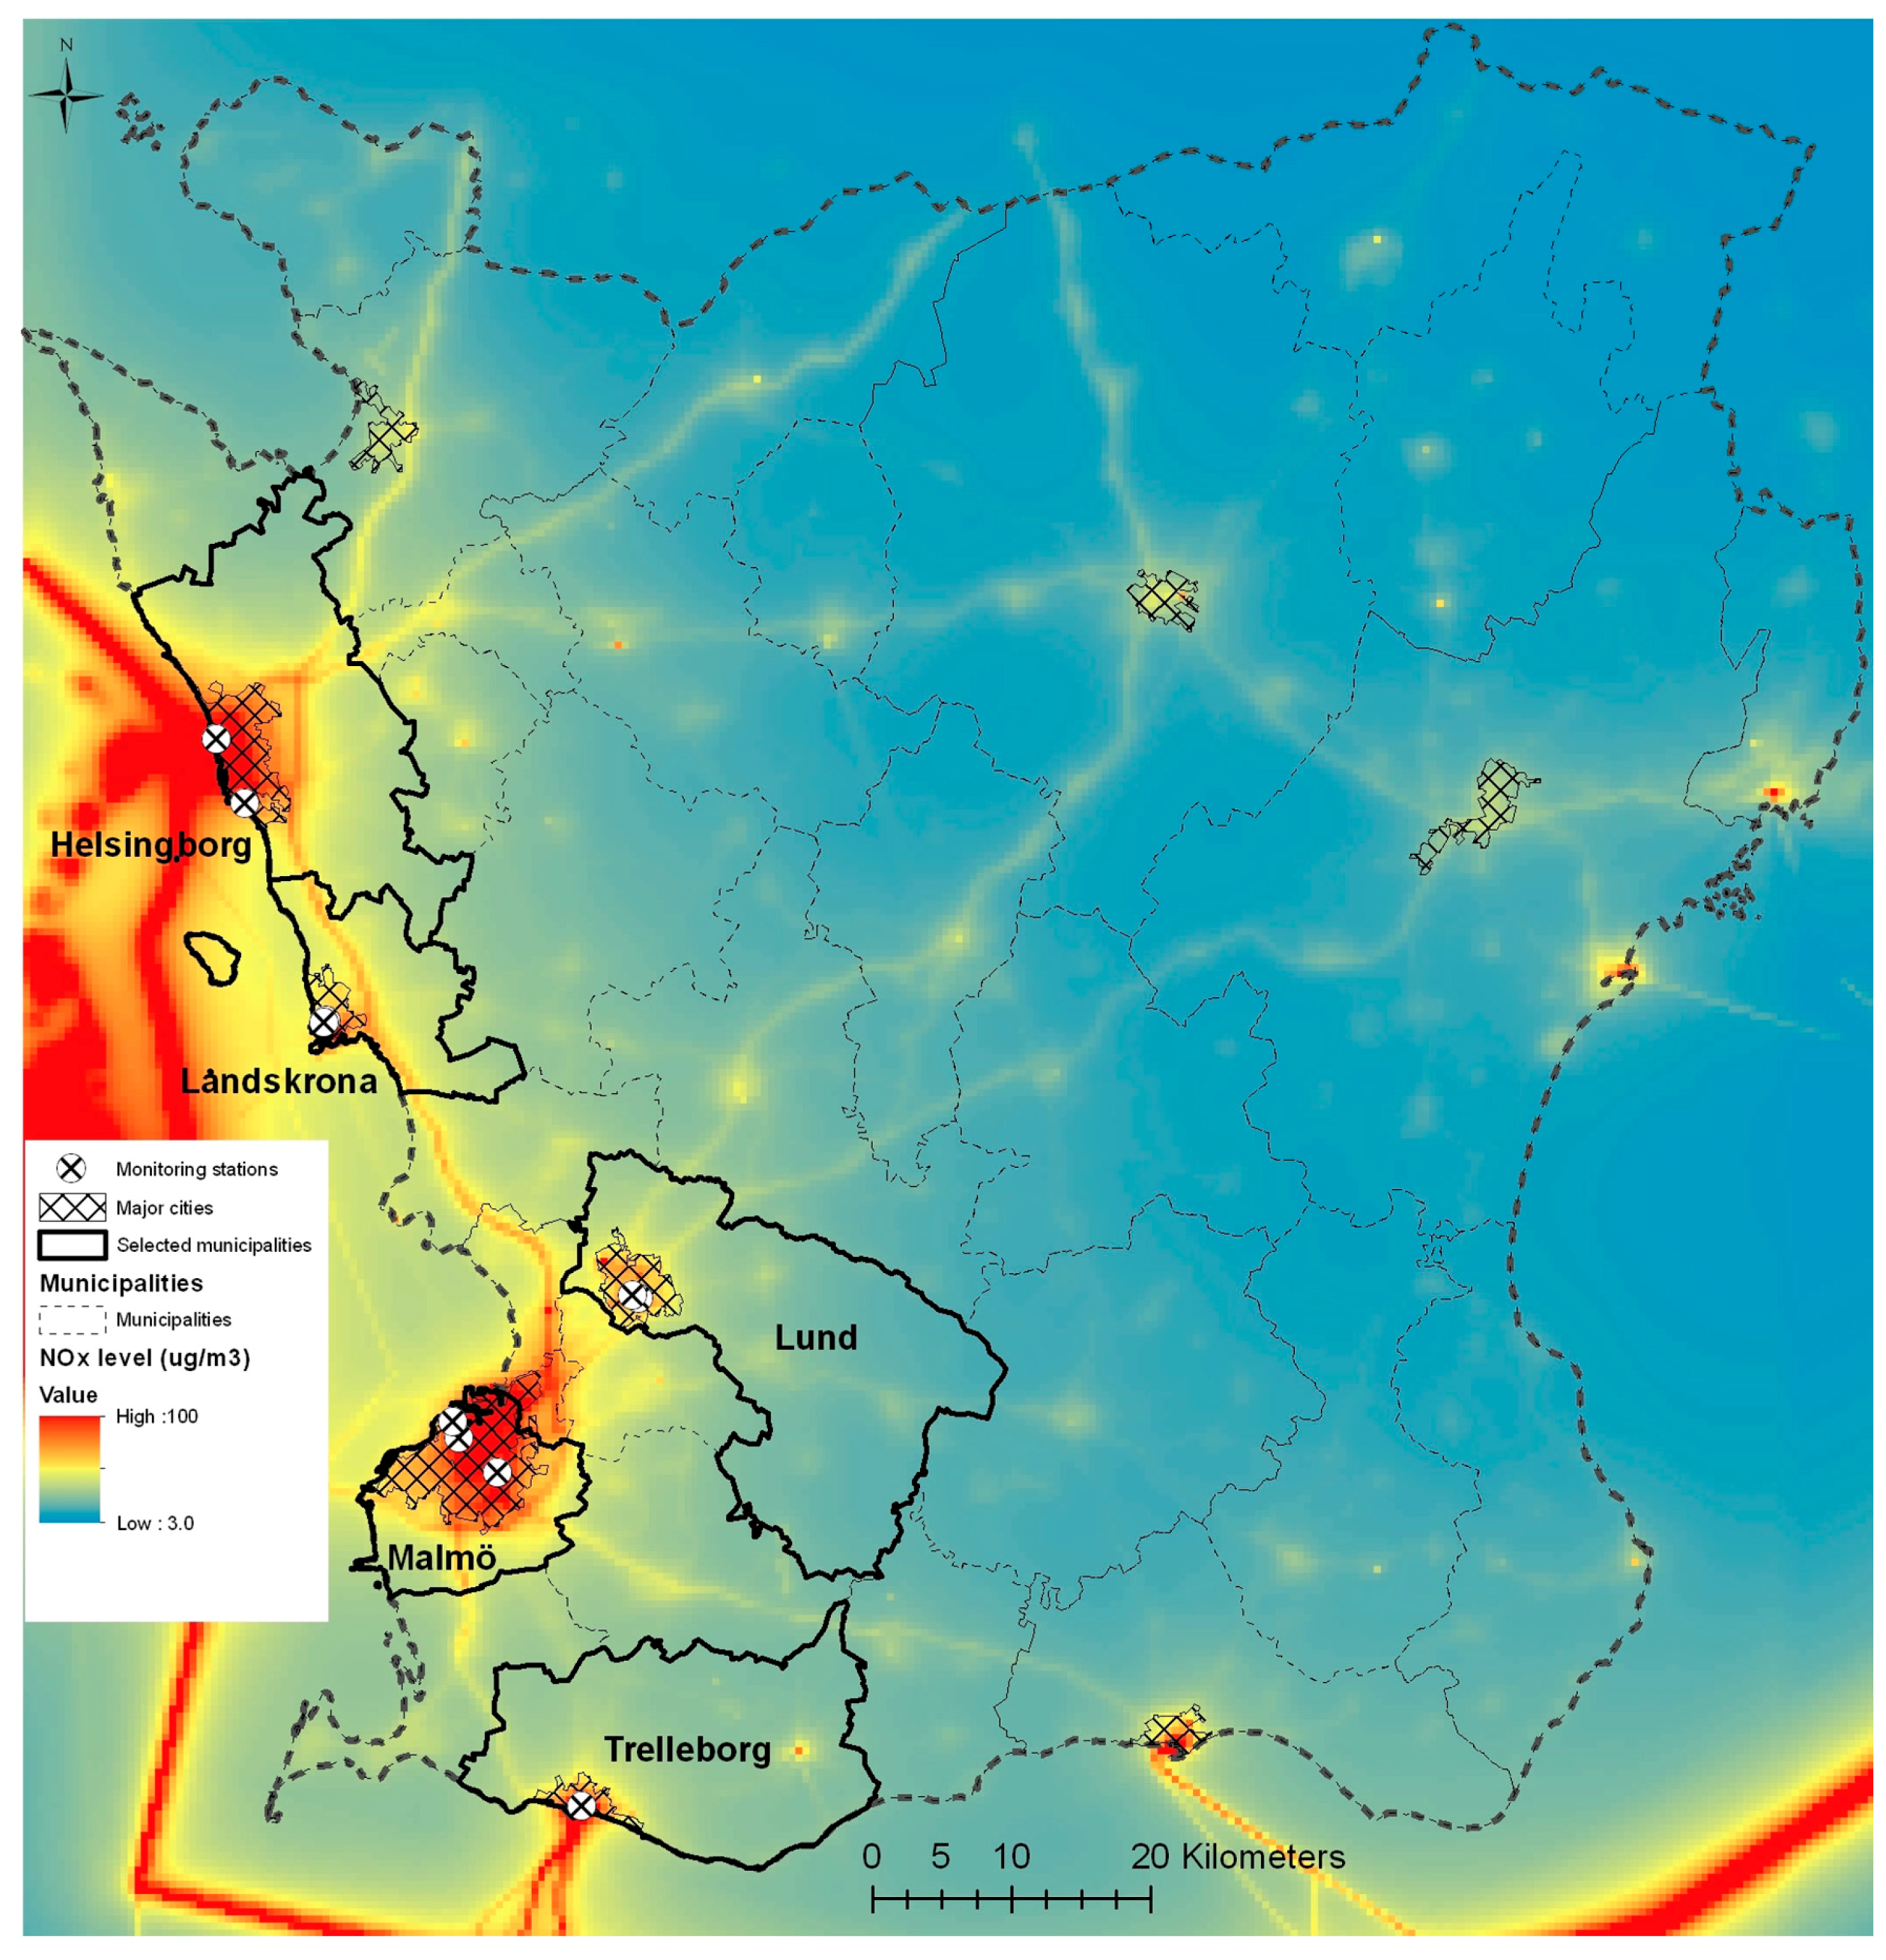
2.1. Study Area
2.2. Air Pollution and Meteorological Data
2.3. Respiratory Health Care Data
- Primary health care visits: All visits to primary health care clinics in the study area, where the physician’s diagnosis was respiratory illness (J-code) and which were categorised as emergency visits, i.e., not pre-booked visits. The number of PHC clinics was 17 in Malmö, six in Lund, eight in Helsingborg, three in Landskrona, and two in Trelleborg. PHC clinics provide health care to both adults and children for non-urgent or non-life-threatening medical problems. PHC clinics also provide preventive health care through vaccination programs and other preventive services. The physicians at PHC clinics typically decide if a patient should be referred to a specialist clinic or if the patient should be treated at the PHC clinic.
- Emergency department visits: Visits to the emergency department at a hospital, where the diagnosis was respiratory illness (J-code).
- Inpatient hospital admission: All hospital admissions, diagnosed as respiratory illness (J-code) by the physician and not pre-planned, were included in the study.
3. Statistical Analysis
3.1. Data Analysis
3.2. Ethics Statement
4. Results
4.1. Primary Health Care Visits
4.2. Inpatient Admissions
4.3. Emergency Department Visits
5. Discussion
6. Conclusions
Supplementary Materials
Acknowledgments
Author Contributions
Conflicts of Interest
References
- Guastadisegni, C.; Kelly, F.J.; Cassee, F.R.; Gerlofs-Nijland, M.E.; Janssen, N.A.; Pozzi, R.; Brunekreef, B.; Sandstrom, T.; Mudway, I. Determinants of the proinflammatory action of ambient particulate matter in immortalized murine macrophages. Environ. Health Perspect. 2010, 118, 1728–1734. [Google Scholar] [CrossRef] [PubMed]
- World Health Organization (WHO). Chapter 1: Burden: Mortality, morbidity and risk factors. In Global Status Report on Noncommunicable Diseases; World Health Organization (WHO): Geneva, Switzerland, 2008. [Google Scholar]
- Navarro-Torne, A.; Vidal, M.; Trzaska, D.K.; Passante, L.; Crisafulli, A.; Laang, H.; van de Loo, J.W.; Berkouk, K.; Draghia-Akli, R. Chronic respiratory diseases and lung cancer research: A perspective from the european union. Eur. Respir. J. 2015, 46, 1270–1280. [Google Scholar] [CrossRef] [PubMed]
- European Lung White Book. The Burden of Lung Disease. 2010. Available online: http://www.erswhitebook.org/chapters/the-burden-of-lung-disease/ (accessed on 22 March 2017).
- World Health Organization (WHO). Global Status Report on Noncommunicable Diseases; World Health Organization (WHO): Geneva, Switzerland, 2010. [Google Scholar]
- Atkinson, R.W.; Butland, B.K.; Dimitroulopoulou, C.; Heal, M.R.; Stedman, J.R.; Carslaw, N.; Jarvis, D.; Heaviside, C.; Vardoulakis, S.; Walton, H.; et al. Long-term exposure to ambient ozone and mortality: A quantitative systematic review and meta-analysis of evidence from cohort studies. BMJ Open 2016, 6, e009493. [Google Scholar] [CrossRef] [PubMed]
- Bloemsma, L.D.; Hoek, G.; Smit, L.A. Panel studies of air pollution in patients with copd: Systematic review and meta-analysis. Environ. Res. 2016, 151, 458–468. [Google Scholar] [CrossRef] [PubMed]
- DeVries, R.; Kriebel, D.; Sama, S. Low level air pollution and exacerbation of existing copd: A case crossover analysis. Environ. Health 2016, 15, 98. [Google Scholar] [CrossRef] [PubMed]
- Kurt, O.K.; Zhang, J.; Pinkerton, K.E. Pulmonary health effects of air pollution. Curr. Opin. Pulm. Med. 2016, 22, 138–143. [Google Scholar] [CrossRef] [PubMed]
- Miri, M.; Derakhshan, Z.; Allahabadi, A.; Ahmadi, E.; Oliveri Conti, G.; Ferrante, M.; Aval, H.E. Mortality and morbidity due to exposure to outdoor air pollution in mashhad metropolis, Iran. The AirQ model approach. Environ. Res. 2016, 151, 451–457. [Google Scholar] [CrossRef] [PubMed]
- Xing, Y.F.; Xu, Y.H.; Shi, M.H.; Lian, Y.X. The impact of PM2.5 on the human respiratory system. J. Thorac. Dis. 2016, 8, E69–E74. [Google Scholar] [PubMed]
- Brunekreef, B.; Beelen, R.; Hoek, G.; Schouten, L.; Bausch-Goldbohm, S.; Fischer, P.; Armstrong, B.; Hughes, E.; Jerrett, M.; van den Brandt, P. Effects of long-term exposure to traffic-related air pollution on respiratory and cardiovascular mortality in The Netherlands: The nlcs-air study. Res. Rep. Health Eff. Inst. 2009, 139, 5–71, discussion 73–89. [Google Scholar]
- Hoek, G.; Krishnan, R.M.; Beelen, R.; Peters, A.; Ostro, B.; Brunekreef, B.; Kaufman, J.D. Long-term air pollution exposure and cardio-respiratory mortality: A review. Environ. Health 2013, 12, 43. [Google Scholar] [CrossRef] [PubMed]
- Pinault, L.; Tjepkema, M.; Crouse, D.L.; Weichenthal, S.; van Donkelaar, A.; Martin, R.V.; Brauer, M.; Chen, H.; Burnett, R.T. Risk estimates of mortality attributed to low concentrations of ambient fine particulate matter in the canadian community health survey cohort. Environ. Health 2016, 15, 18. [Google Scholar] [CrossRef] [PubMed]
- Weichenthal, S.A.; Lavigne, E.; Evans, G.J.; Godri Pollitt, K.J.; Burnett, R.T. Fine particulate matter and emergency room visits for respiratory illness. Effect modification by oxidative potential. Am. J. Respir. Crit. Care Med. 2016, 194, 577–586. [Google Scholar] [CrossRef] [PubMed]
- Sinclair, A.H.; Edgerton, E.S.; Wyzga, R.; Tolsma, D. A two-time-period comparison of the effects of ambient air pollution on outpatient visits for acute respiratory illnesses. J. Air Waste Manag. Assoc. 2010, 60, 163–175. [Google Scholar] [CrossRef] [PubMed]
- Sinclair, A.H.; Tolsma, D. Associations and lags between air pollution and acute respiratory visits in an ambulatory care setting: 25-month results from the aerosol research and inhalation epidemiological study. J. Air Waste Manag. Assoc. 2004, 54, 1212–1218. [Google Scholar] [CrossRef] [PubMed]
- Taj, T.; Jakobsson, K.; Stroh, E.; Oudin, A. Air pollution is associated with primary health care visits for asthma in sweden: A case-crossover design with a distributed lag non-linear model. Spat. Spatio-Temporal Epidemiol. 2016, 17, 37–44. [Google Scholar] [CrossRef] [PubMed]
- Yamazaki, S.; Shima, M.; Yoda, Y.; Oka, K.; Kurosaka, F.; Shimizu, S.; Takahashi, H.; Nakatani, Y.; Nishikawa, J.; Fujiwara, K.; et al. Exposure to air pollution and meteorological factors associated with children’s primary care visits at night due to asthma attack: Case-crossover design for 3-year pooled patients. BMJ Open 2015, 5, e005736. [Google Scholar] [CrossRef] [PubMed]
- Yamazaki, S.; Shima, M.; Yoda, Y.; Oka, K.; Kurosaka, F.; Shimizu, S.; Takahashi, H.; Nakatani, Y.; Nishikawa, J.; Fujiwara, K.; et al. Association between PM2.5 and primary care visits due to asthma attack in Japan: Relation to beijing’s air pollution episode in January 2013. Environ. Health Prev. Med. 2014, 19, 172–176. [Google Scholar] [CrossRef] [PubMed]
- Yamazaki, S.; Shima, M.; Ando, M.; Nitta, H. Modifying effect of age on the association between ambient ozone and nighttime primary care visits due to asthma attack. J. Epidemiol. 2009, 19, 143–151. [Google Scholar] [CrossRef] [PubMed]
- Hajat, S.; Anderson, H.R.; Atkinson, R.W.; Haines, A. Effects of air pollution on general practitioner consultations for upper respiratory diseases in London. Occup. Environ. Med. 2002, 59, 294–299. [Google Scholar] [CrossRef] [PubMed]
- Ostro, B.D.; Eskeland, G.S.; Sanchez, J.M.; Feyzioglu, T. Air pollution and health effects: A study of medical visits among children in Santiago, Chile. Environ. Health Perspect. 1999, 107, 69–73. [Google Scholar] [CrossRef] [PubMed]
- Pettersson, F. Swedish Infrastructure Policy and Planning Conditions for Sustainability. In Faculty of Engineering Environmental and Energy Systems Studies; Department of Environmental and Energy Systems Studies, Lund University: Lund, Sweden, 2014. [Google Scholar]
- Stamming, M. Investments in Transport Infrastructure in Skåne 2014–2025; Region Skåne: Skåne, Sweden, 2014; p. 32. [Google Scholar]
- World Health Organization (WHO). Air Quality Guidelines for Particulate Matter, Ozone, Nitrogen Dioxide and Sulfur Dioxide; Summary of Risk Assessment; World Health Organization (WHO): Geneva, Switzerland, 2005. [Google Scholar]
- European Commission. European Air Quality Standards. Available online: http://ec.europa.eu/environment/air/quality/standards.htm (accessed on 22 March 2017).
- IVL Swedish Environmental Research Institute. National Surveillance. Available online: http://www.ivl.se/sidor/omraden/luft/luftovervakning/nationell-overvakning.html (accessed on 22 March 2017).
- Perrakis, K.; Gryparis, A.; Schwartz, J.; Le Tertre, A.; Katsouyanni, K.; Forastiere, F.; Stafoggia, M.; Samoli, E. Controlling for seasonal patterns and time varying confounders in time-series epidemiological models: A simulation study. Stat. Med. 2014, 33, 4904–4918. [Google Scholar] [CrossRef] [PubMed]
- Bateson, T.F.; Schwartz, J. Selection bias and confounding in case-crossover analyses of environmental time-series data. Epidemiology 2001, 12, 654–661. [Google Scholar] [CrossRef] [PubMed]
- Gasparrini, A.; Armstrong, B.; Kenward, M.G. Distributed lag non-linear models. Stat. Med. 2010, 29, 2224–2234. [Google Scholar] [CrossRef] [PubMed]
- Gasparrini, A.; Armstrong, B.; Kenward, M.G. Multivariate meta-analysis for non-linear and other multi-parameter associations. Stat. Med. 2012, 31, 3821–3839. [Google Scholar] [CrossRef] [PubMed]
- R. Core. Team. R: A Language and Environment for Statistical Computing; R. Core. Team: Vienna, Austria, 2016. [Google Scholar]
- Lavigne, E.; Villeneuve, P.J.; Cakmak, S. Air pollution and emergency department visits for asthma in Windsor, Canada. Can. J. Public Health 2012, 103, 4–8. [Google Scholar] [PubMed]
- Tramuto, F.; Cusimano, R.; Cerame, G.; Vultaggio, M.; Calamusa, G.; Maida, C.M.; Vitale, F. Urban air pollution and emergency room admissions for respiratory symptoms: A case-crossover study in Palermo, Italy. Environ. Health 2011, 10, 31. [Google Scholar] [CrossRef] [PubMed]
- Weichenthal, S.; Belisle, P.; Lavigne, E.; Villeneuve, P.J.; Wheeler, A.; Xu, X.; Joseph, L. Estimating risk of emergency room visits for asthma from personal versus fixed site measurements of NO2. Environ. Res. 2015, 137, 323–328. [Google Scholar] [CrossRef] [PubMed]
- Zheng, X.Y.; Ding, H.; Jiang, L.N.; Chen, S.W.; Zheng, J.P.; Qiu, M.; Zhou, Y.X.; Chen, Q.; Guan, W.J. Association between air pollutants and asthma emergency room visits and hospital admissions in time series studies: A systematic review and meta-analysis. PloS ONE 2015, 10, e0138146. [Google Scholar] [CrossRef] [PubMed]
- Colucci, M.E.; Veronesi, L.; Roveda, A.M.; Marangio, E.; Sansebastiano, G. Particulate matter (PM10) air pollution, daily mortality, and hospital admissions: Recent findings. Ig Sanita Pubblica 2006, 62, 289–304. [Google Scholar]
- Filleul, L.; Zeghnoun, A.; Declercq, C.; Le Goaster, C.; Le Tertre, A.; Eilstein, D.; Medina, S.; Saviuc, P.; Prouvost, H.; Cassadou, S.; et al. Short-term relationships between urban atmospheric pollution and respiratory mortality: Time series studies. Rev. Mal. Respir. 2001, 18, 387–395. [Google Scholar] [PubMed]
- Lippmann, M. Health effects of ozone. A critical review. JAPCA 1989, 39, 672–695. [Google Scholar] [CrossRef] [PubMed]
- Schwela, D. Air pollution and health in urban areas. Rev. Environ. Health 2000, 15, 13–42. [Google Scholar] [CrossRef] [PubMed]
- Brand, A.; McLean, K.E.; Henderson, S.B.; Fournier, M.; Liu, L.; Kosatsky, T.; Smargiassi, A. Respiratory hospital admissions in young children living near metal smelters, pulp mills and oil refineries in two Canadian provinces. Environ. Int. 2016, 94, 24–32. [Google Scholar] [CrossRef] [PubMed]
- Carugno, M.; Consonni, D.; Randi, G.; Catelan, D.; Grisotto, L.; Bertazzi, P.A.; Biggeri, A.; Baccini, M. Air pollution exposure, cause-specific deaths and hospitalizations in a highly polluted Italian region. Environ. Res. 2016, 147, 415–424. [Google Scholar] [CrossRef] [PubMed]
- Fung, K.Y.; Khan, S.; Krewski, D.; Chen, Y. Association between air pollution and multiple respiratory hospitalizations among the elderly in Vancouver, Canada. Inhal. Toxicol. 2006, 18, 1005–1011. [Google Scholar] [CrossRef] [PubMed]
- Mills, I.C.; Atkinson, R.W.; Anderson, H.R.; Maynard, R.L.; Strachan, D.P. Distinguishing the associations between daily mortality and hospital admissions and nitrogen dioxide from those of particulate matter: A systematic review and meta-analysis. BMJ Open 2016, 6, e010751. [Google Scholar] [CrossRef] [PubMed]
- Samek, L. Overall human mortality and morbidity due to exposure to air pollution. Int. J. Occup. Med. Environ. Health 2016, 29, 417–426. [Google Scholar] [CrossRef] [PubMed]
- Ciencewicki, J.M.; Verhein, K.C.; Gerrish, K.; McCaw, Z.R.; Li, J.; Bushel, P.R.; Kleeberger, S.R. Effects of mannose-binding lectin on pulmonary gene expression and innate immune inflammatory response to ozone. Am. J. Physiol. Lung Cell. Mol. Physiol. 2016, 311, 280–291. [Google Scholar] [CrossRef] [PubMed]
- Lay, J.C.; Alexis, N.E.; Kleeberger, S.R.; Roubey, R.A.; Harris, B.D.; Bromberg, P.A.; Hazucha, M.J.; Devlin, R.B.; Peden, D.B. Ozone enhances markers of innate immunity and antigen presentation on airway monocytes in healthy individuals. J. Allergy Clin. Immunol. 2007, 120, 719–722. [Google Scholar] [CrossRef] [PubMed]
- Lazaar, A.L.; Sweeney, L.E.; MacDonald, A.J.; Alexis, N.E.; Chen, C.; Tal-Singer, R. Sb-656933, a novel CXCR2 selective antagonist, inhibits ex vivo neutrophil activation and ozone-induced airway inflammation in humans. Br. J. Clin. Pharmacol. 2011, 72, 282–293. [Google Scholar] [CrossRef] [PubMed]
- Hernandez, M.; Brickey, W.J.; Alexis, N.E.; Fry, R.C.; Rager, J.E.; Zhou, B.; Ting, J.P.; Zhou, H.; Peden, D.B. Airway cells from atopic asthmatic patients exposed to ozone display an enhanced innate immune gene profile. J. Allergy Clin. Immunol. 2012, 129, e251–e252. [Google Scholar] [CrossRef] [PubMed]
- Koenig, J.Q. Air pollution and asthma. J. Allergy Clin. Immunol. 1999, 104, 717–722. [Google Scholar] [CrossRef]
- Chen, L.; Omaye, S.T. Air pollution and health effects in Northern Nevada. Rev. Environ. Health 2001, 16, 133–149. [Google Scholar] [CrossRef] [PubMed]
- Li, M.H.; Fan, L.C.; Mao, B.; Yang, J.W.; Choi, A.M.; Cao, W.J.; Xu, J.F. Short-term exposure to ambient fine particulate matter increases hospitalizations and mortality in COPD: A systematic review and meta-analysis. Chest 2016, 149, 447–458. [Google Scholar] [CrossRef] [PubMed]
- Marino, E.; Caruso, M.; Campagna, D.; Polosa, R. Impact of air quality on lung health: Myth or reality? Ther. Adv. Chronic Dis. 2015, 6, 286–298. [Google Scholar] [CrossRef] [PubMed]
- Medina-Ramon, M.; Zanobetti, A.; Schwartz, J. The effect of ozone and PM10 on hospital admissions for pneumonia and chronic obstructive pulmonary disease: A national multicity study. Am. J. Epidemiol. 2006, 163, 579–588. [Google Scholar] [CrossRef] [PubMed]
- Atkinson, R.W.; Anderson, H.R.; Sunyer, J.; Ayres, J.; Baccini, M.; Vonk, J.M.; Boumghar, A.; Forastiere, F.; Forsberg, B.; Touloumi, G.; et al. Acute effects of particulate air pollution on respiratory admissions: Results from aphea 2 project. Air pollution and health: A European approach. Am. J. Respir. Crit. Care Med. 2001, 164, 1860–1866. [Google Scholar] [CrossRef] [PubMed]
- Atkinson, R.W.; Mills, I.C.; Walton, H.A.; Anderson, H.R. Fine particle components and health—A systematic review and meta-analysis of epidemiological time series studies of daily mortality and hospital admissions. J. Expo. Sci. Environ. Epidemiol. 2015, 25, 208–214. [Google Scholar] [CrossRef] [PubMed]
- Fusco, D.; Forastiere, F.; Michelozzi, P.; Spadea, T.; Ostro, B.; Arca, M.; Perucci, C.A. Air pollution and hospital admissions for respiratory conditions in Rome, Italy. Eur. Respir. J. 2001, 17, 1143–1150. [Google Scholar] [CrossRef] [PubMed]
- Huang, Y.C. Outdoor air pollution: A global perspective. J. Occup. Environ. Med. 2014, 56, S3–S7. [Google Scholar] [CrossRef] [PubMed]


| PM10 µg/m3 | NO2 µg/m3 | O3 µg/m3 | ||||||||||
|---|---|---|---|---|---|---|---|---|---|---|---|---|
| Min | Median | Mean (SD) | Max | Min | Median | Mean (SD) | Max | Min | Median | Mean (SD) | Max | |
| Malmö | 2.7 | 14.7 | 16.4 (8.0) | 60.9 | 3.4 | 16.4 | 17.8 (7.8) | 53.3 | 4.3 | 54.7 | 53.3 (17.3) | 138 |
| Lund | 0.1 | 12.4 | 14.4 (9.7) | 157 | 0.4 | 11.5 | 13.2 (7.8) | 51.5 | 5.4 | 56.7 | 56.3 (7.7) | 123.7 |
| Helsingborg | 0.1 | 15.7 | 17.8 (11.1) | 114 | 2.0 | 17.4 | 19.2 (9.6) | 62.5 | 6.9 | 56.5 | 56.2 (15.8) | 138 |
| Landskrona | 2.0 | 17.3 | 19.5 (11.0) | 75.6 | 0.2 | 12.5 | 13.9 (7.1) | 54.5 | 5.1 | 58.2 | 57.4 (15.0) | 108.7 |
| Trelleborg | 0.8 | 16.7 | 18.4 (9.6) | 92.2 | 2.3 | 15.9 | 16.9 (8.2) | 64.7 | - | - | - | - |
| Municipality | Population Size | PHC Visits | Inpatient Admissions | ED Visits |
|---|---|---|---|---|
| N | Daily Mean (SD) | Daily Mean (SD) | Daily Mean (SD) | |
| Malmö | 298,963 | 16.0 (9.1) | 6.0 (3.0) | 7.2 (3.5) |
| Lund | 110,488 | 6.8 (4.3) | 1.2 (1.1) | 2.9 (1.9) |
| Helsingborg | 129,177 | 8.1 (5.0) | 2.8 (1.6) | 3.8 (2.2) |
| Landskrona | 41,724 | 4.0 (2.4) | 1.0 (1.0) | 2.1 (1.6) |
| Trelleborg | 42,219 | 4.2 (2.5) | 0.9 (1.0) | 3.0 (2.0) |
| Municipality | PHC % Change (95% CI) | Inpatient % Change (95% CI) | Emergency Department % Change (95% CI) |
|---|---|---|---|
| Malmö | 1.85 (0.52 to 3.20) | 0.72 (−1.10 to 2.58) | 0.88 (−0.77 to 2.57) |
| Lund | 1.86 (−0.30 to 4.06) | 0.64 (−4.25 to 5.82) | 1.19 (−2.84 to 5.42) |
| Helsingborg | 0.09 (−1.33 to 1.54) | 0.91 (−1.08 to 2.94) | −1.09 (−2.87 to 0.73) |
| Landskrona | −3.14 (−7.68 to 1.43) | −2.10 (−10.74 to 7.51) | −0.02 (−5.91 to 6.29) |
| Trelleborg | 0.83 (−1.77 to 3.51) | 0.53 (−2.21 to 3.35) | 2.86 (−7.79 to 14.93) |
| Municipality | PHC % Change (95% CI) | Inpatient % Change (95% CI) | Emergency Department % Change (95% CI) |
|---|---|---|---|
| Malmö | 0.21 (−0.53 to 0.95) | 0.91 (−0.11 to 1.94) | 0.75 (−0.19 to 1.71) |
| Lund | 0.73 (−0.42 to 1.89) | 1.57 (−1.14 to 4.37) | 2.07 (−0.16 to 4.36) |
| Helsingborg | 0.79 (−0.25 to 1.84) | −0.54 (−1.97 to 0.91) | 0.20 (−1.13 to 1.54) |
| Landskrona | 1.70 (−1.48 to 5.01) | 1.37 (−4.79 to 8.01) | −0.16 (−4.09 to 3.98) |
| Trelleborg * | - | - | - |
| Municipality | PHC % Change (95% CI) | Inpatient % Change (95% CI) | Emergency Department % Change (95% CI) |
|---|---|---|---|
| Malmö | 0.29 (−0.72 to 1.31) | 0.41 (−0.98 to 1.83) | 0.10 (−1.16 to 1.39) |
| Lund | −0.67 (−2.66 to 1.37) | −0.05 (−4.68 to 4.83) | 0.25 (−3.68 to 4.37) |
| Helsingborg | 0.38 (−1.20 to 1.99) | 0.59 (−1.61 to 2.84) | 2.52 (0.44 to 4.64) |
| Landskrona | 1.45 (−2.70 to 5.81) | 0.10 (−8.33 to 9.40) | −2.21 (−7.81 to 3.77) |
| Trelleborg | 1.07 (−1.13 to 3.32) | 0.46 (−1.94 to 2.93) | −0.19 (−2.18 to 1.85) |
© 2017 by the authors. Licensee MDPI, Basel, Switzerland. This article is an open access article distributed under the terms and conditions of the Creative Commons Attribution (CC BY) license (http://creativecommons.org/licenses/by/4.0/).
Share and Cite
Taj, T.; Malmqvist, E.; Stroh, E.; Oudin Åström, D.; Jakobsson, K.; Oudin, A. Short-Term Associations between Air Pollution Concentrations and Respiratory Health—Comparing Primary Health Care Visits, Hospital Admissions, and Emergency Department Visits in a Multi-Municipality Study. Int. J. Environ. Res. Public Health 2017, 14, 587. https://doi.org/10.3390/ijerph14060587
Taj T, Malmqvist E, Stroh E, Oudin Åström D, Jakobsson K, Oudin A. Short-Term Associations between Air Pollution Concentrations and Respiratory Health—Comparing Primary Health Care Visits, Hospital Admissions, and Emergency Department Visits in a Multi-Municipality Study. International Journal of Environmental Research and Public Health. 2017; 14(6):587. https://doi.org/10.3390/ijerph14060587
Chicago/Turabian StyleTaj, Tahir, Ebba Malmqvist, Emilie Stroh, Daniel Oudin Åström, Kristina Jakobsson, and Anna Oudin. 2017. "Short-Term Associations between Air Pollution Concentrations and Respiratory Health—Comparing Primary Health Care Visits, Hospital Admissions, and Emergency Department Visits in a Multi-Municipality Study" International Journal of Environmental Research and Public Health 14, no. 6: 587. https://doi.org/10.3390/ijerph14060587