Effects of Hyporheic Water Fluxes and Sediment Grain Size on the Concentration and Diffusive Flux of Heavy Metals in the Streambed

 , ,
, ,
Abstract
:1. Introduction
2. Materials and Methods
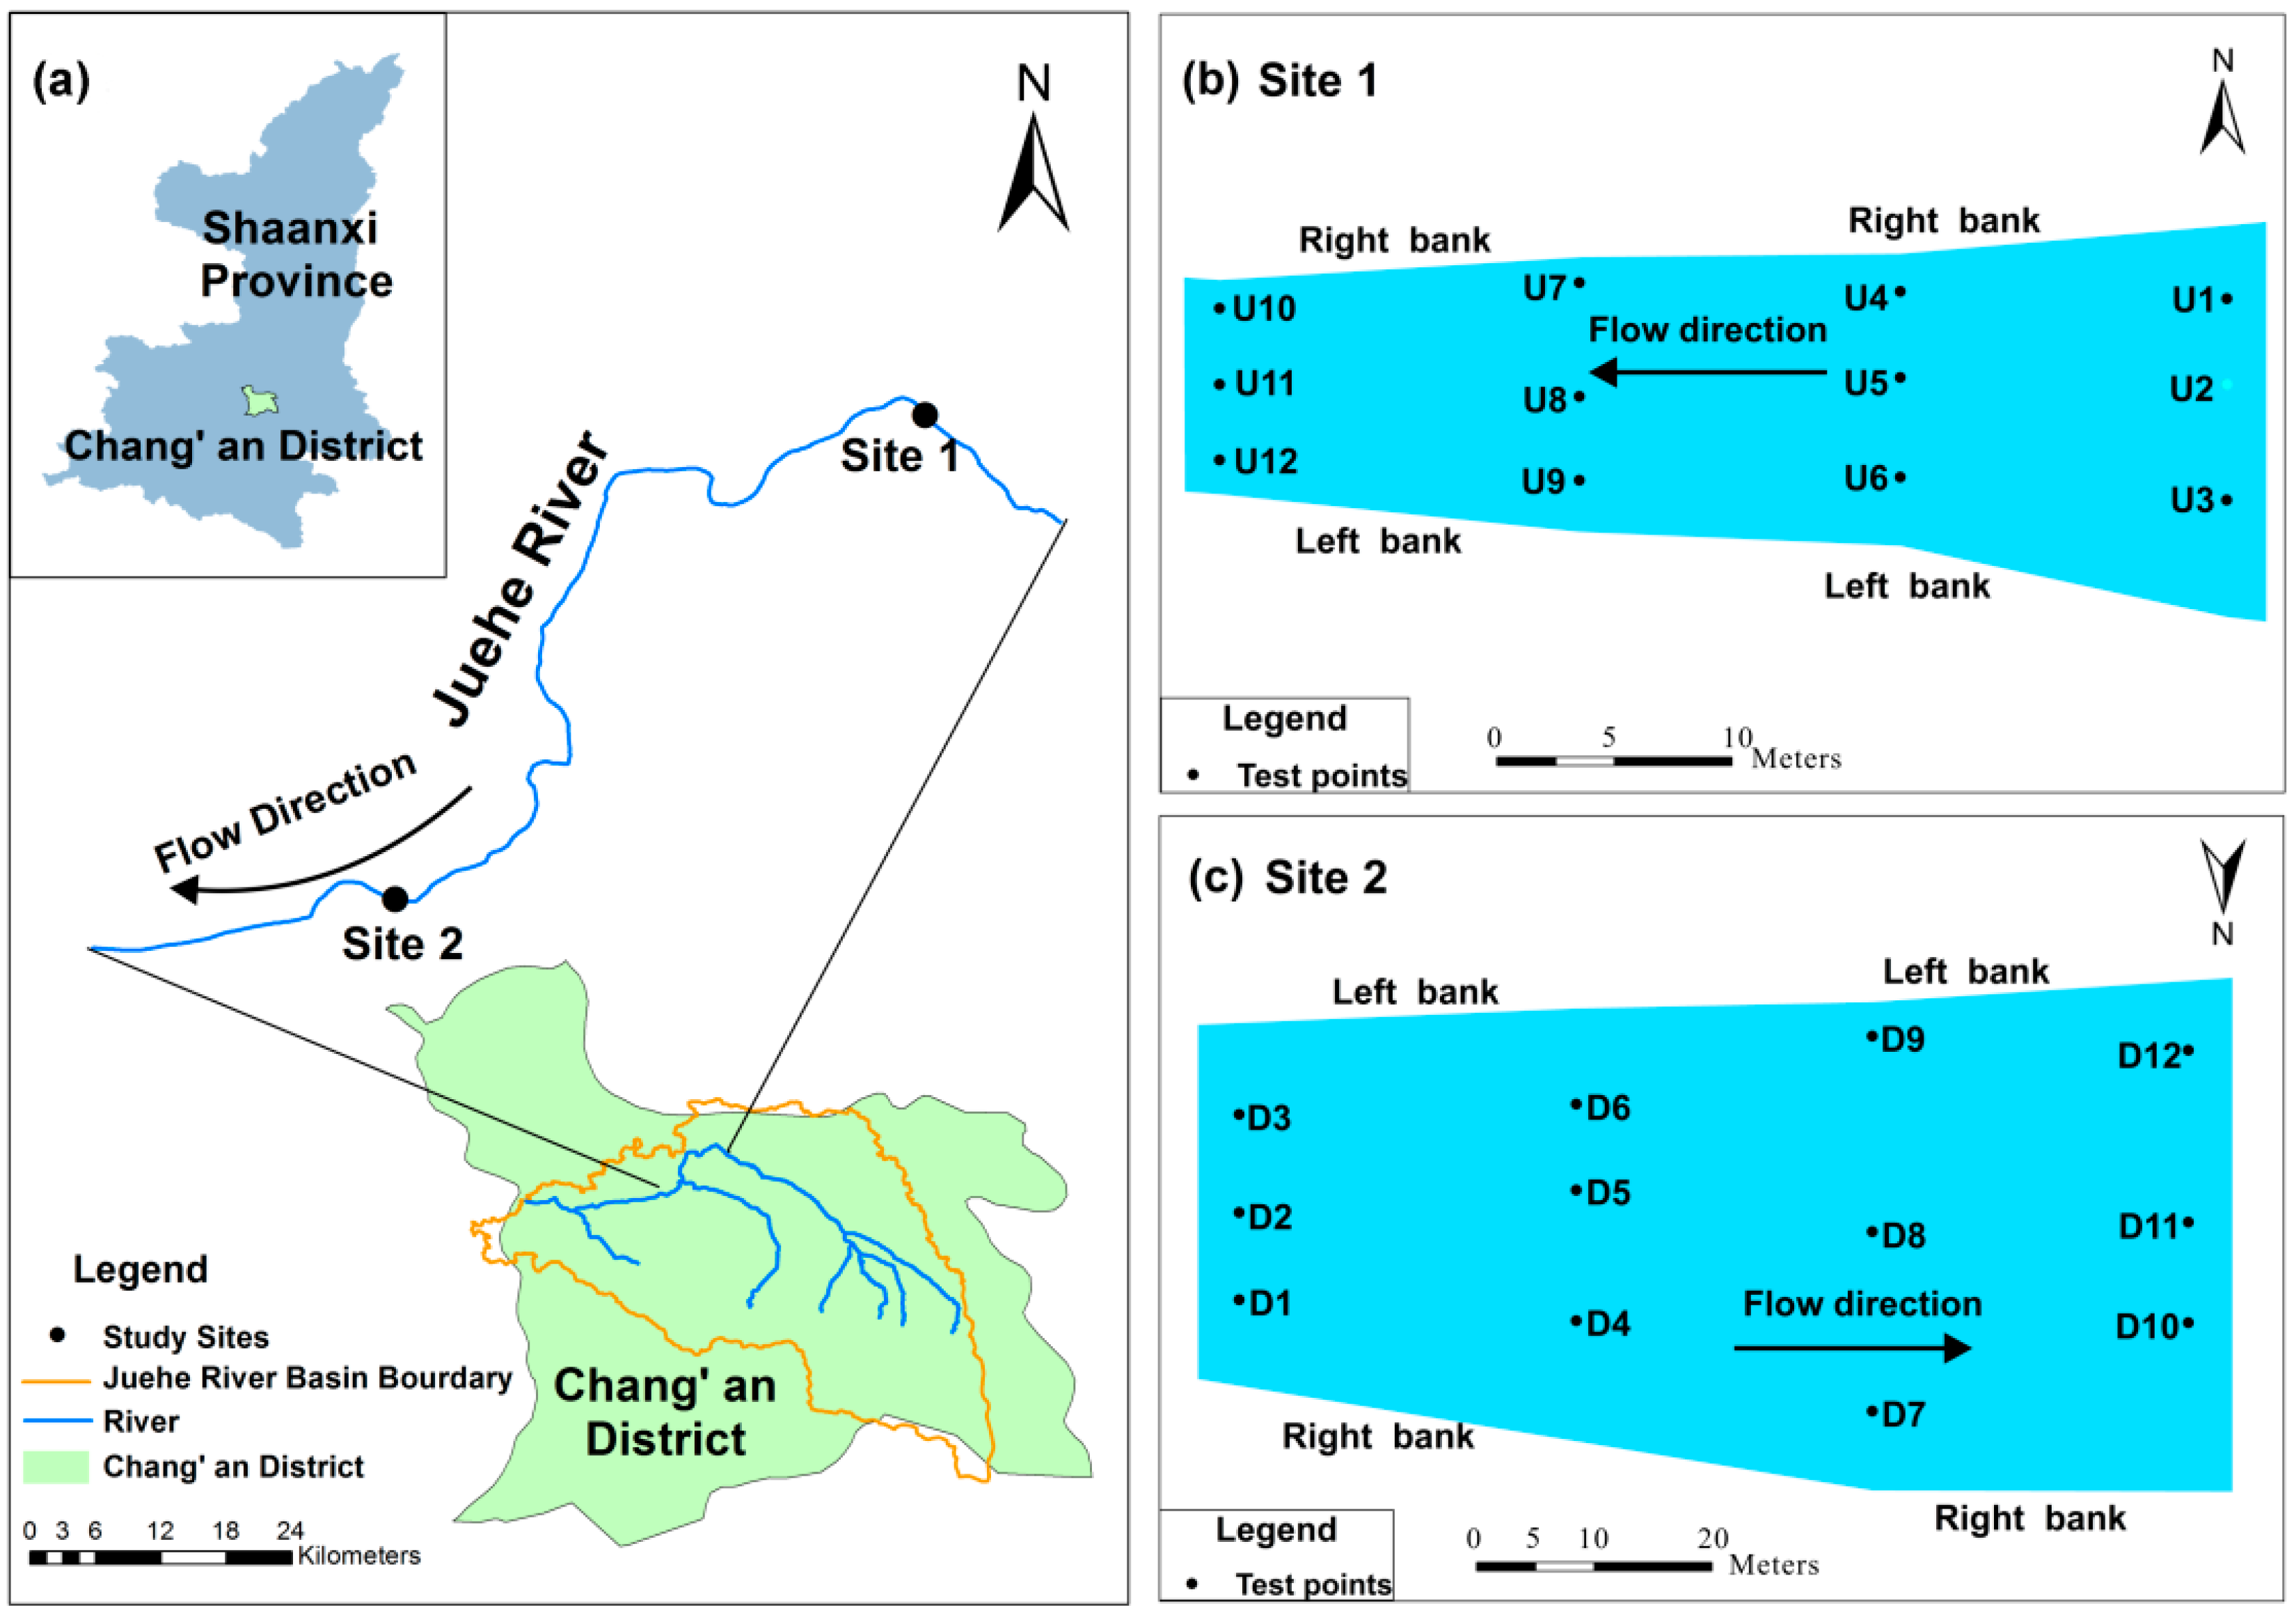
2.1. Study Site
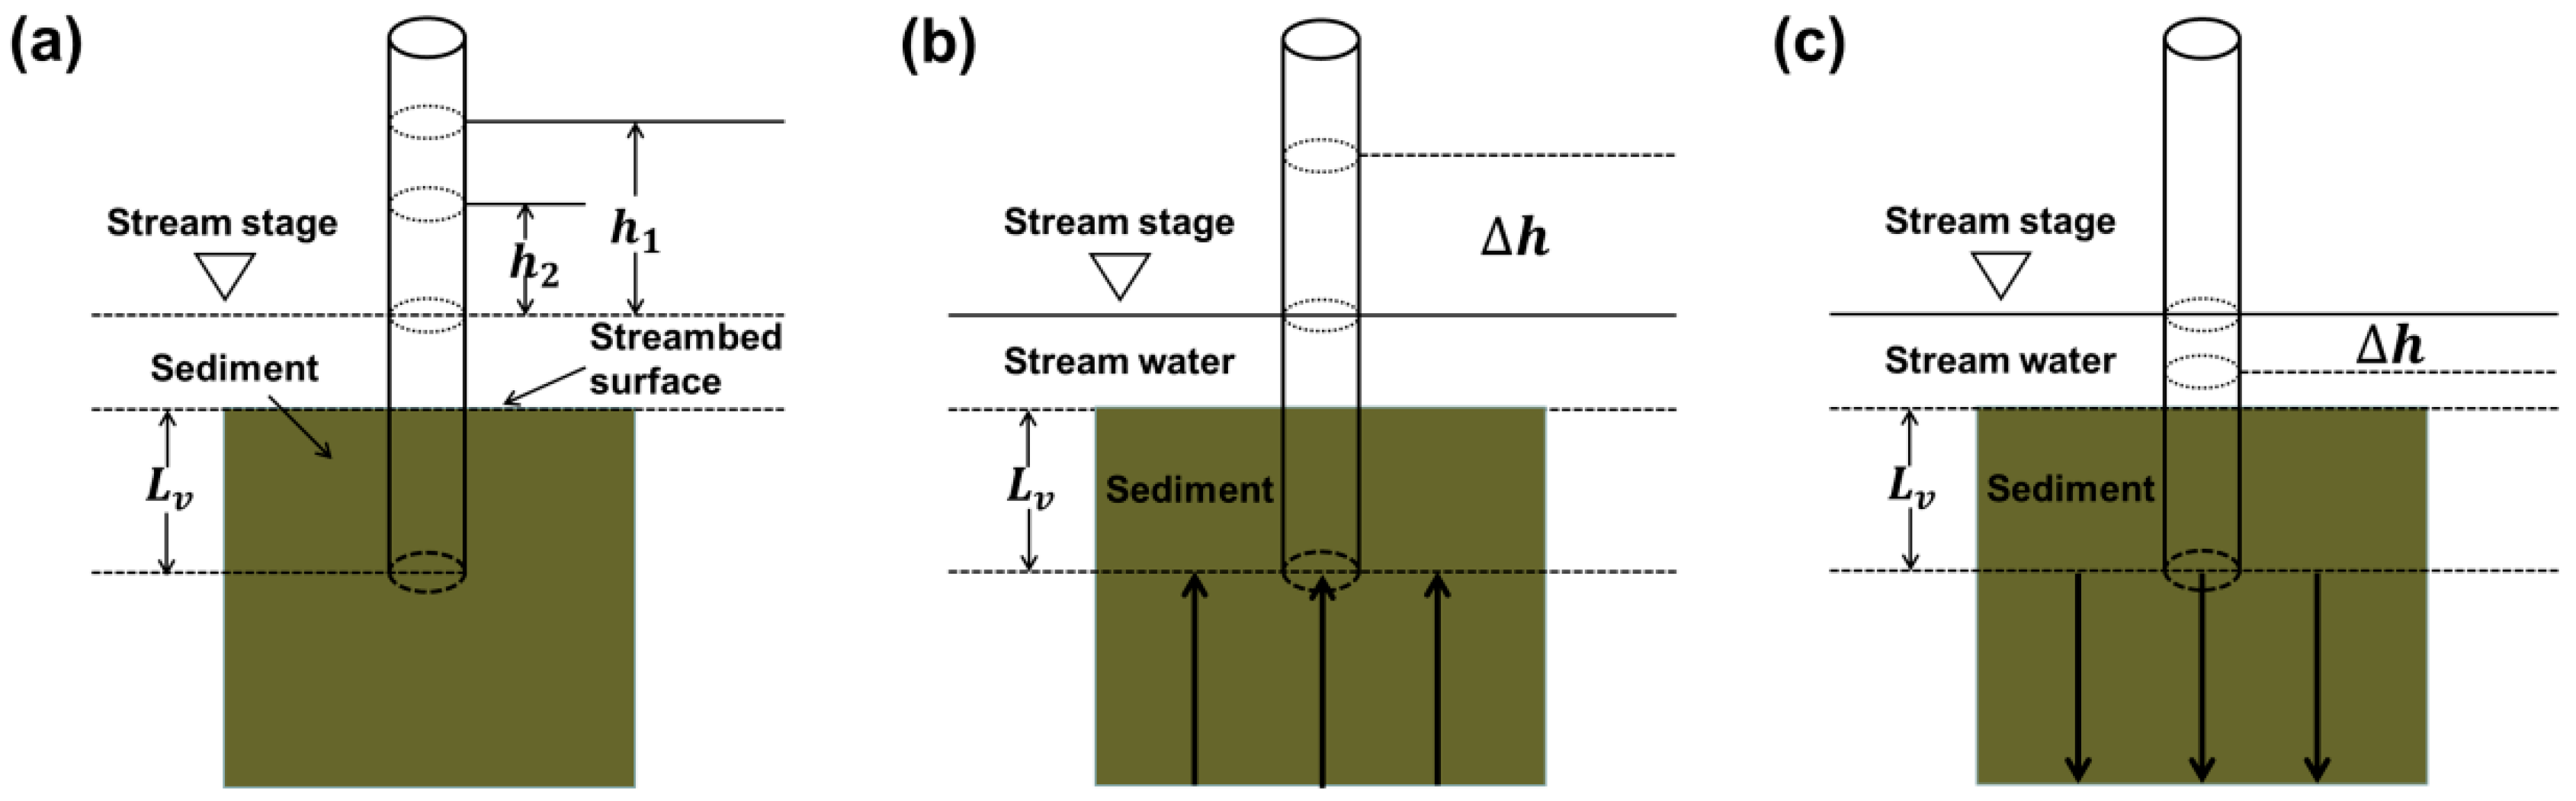
2.2. Estimation of Streambed Vertical Hydraulic Conductivity () and Vertical Water Exchange Flux (VWEF)
2.3. Determination of the Heavy Metal Concentrations in Pore Water
2.4. Calculation of the Heavy Metal Diffusive Flux
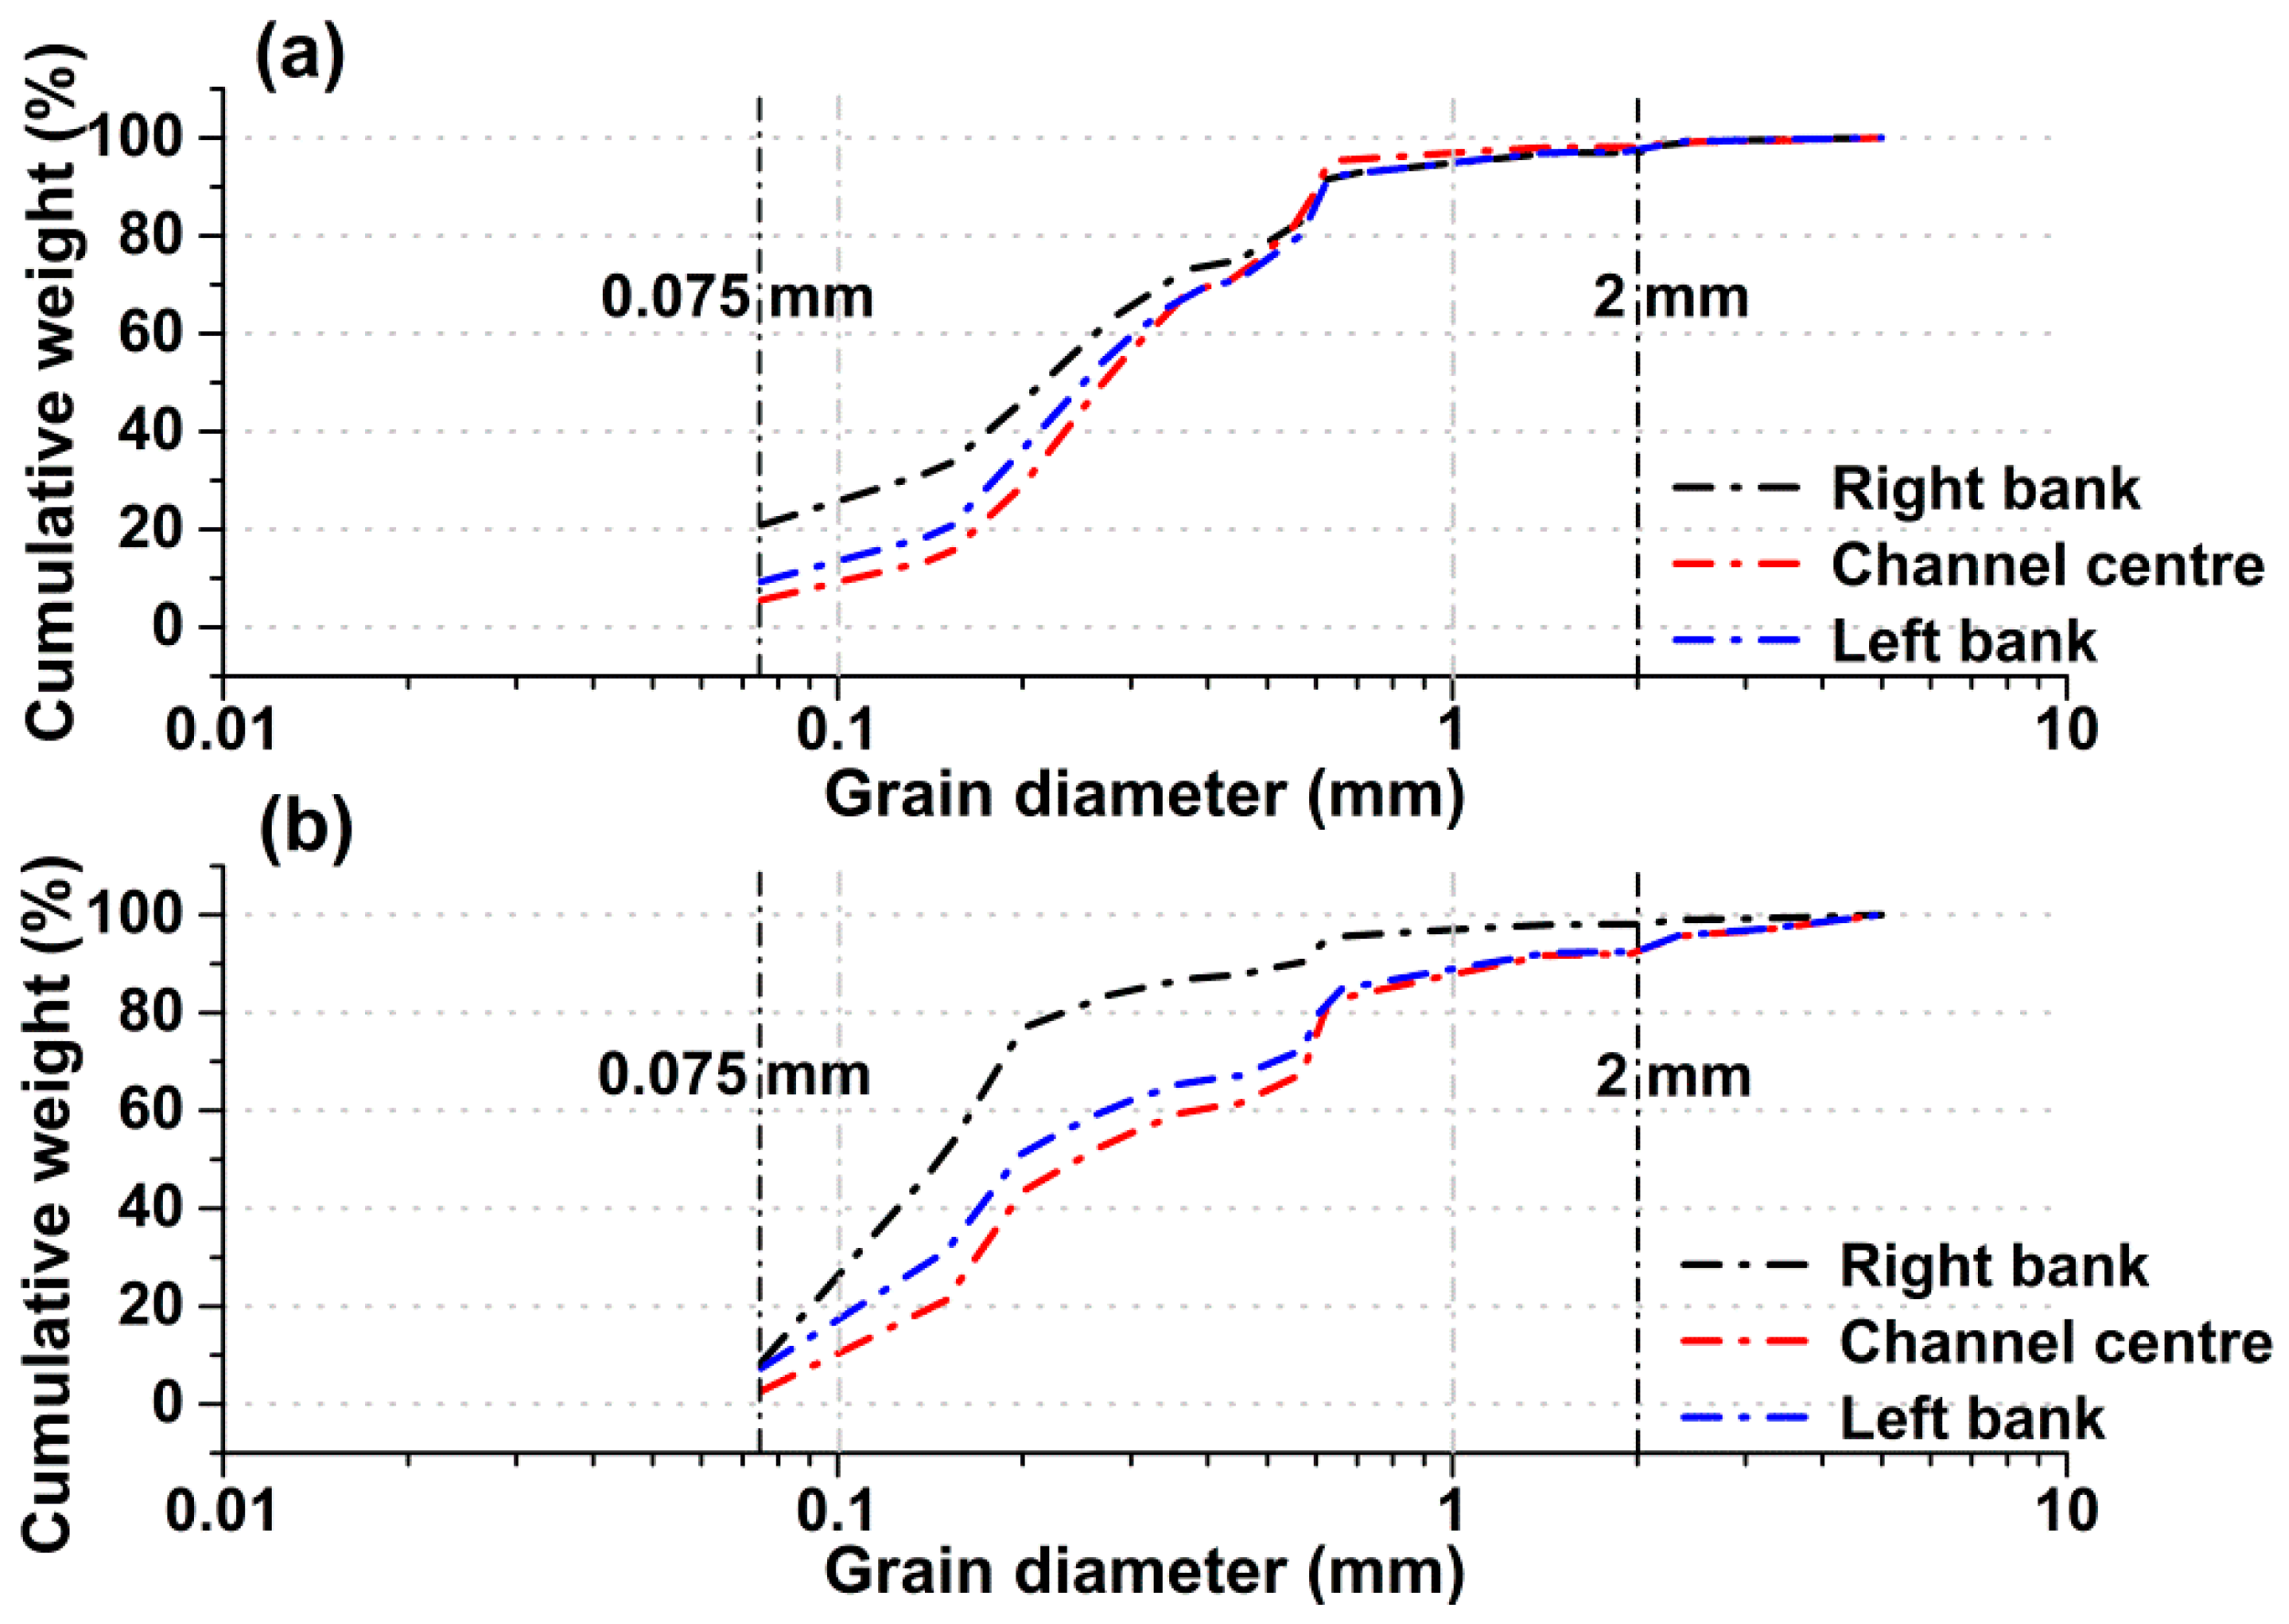
2.5. Sediment Grain Size Analysis
3. Results
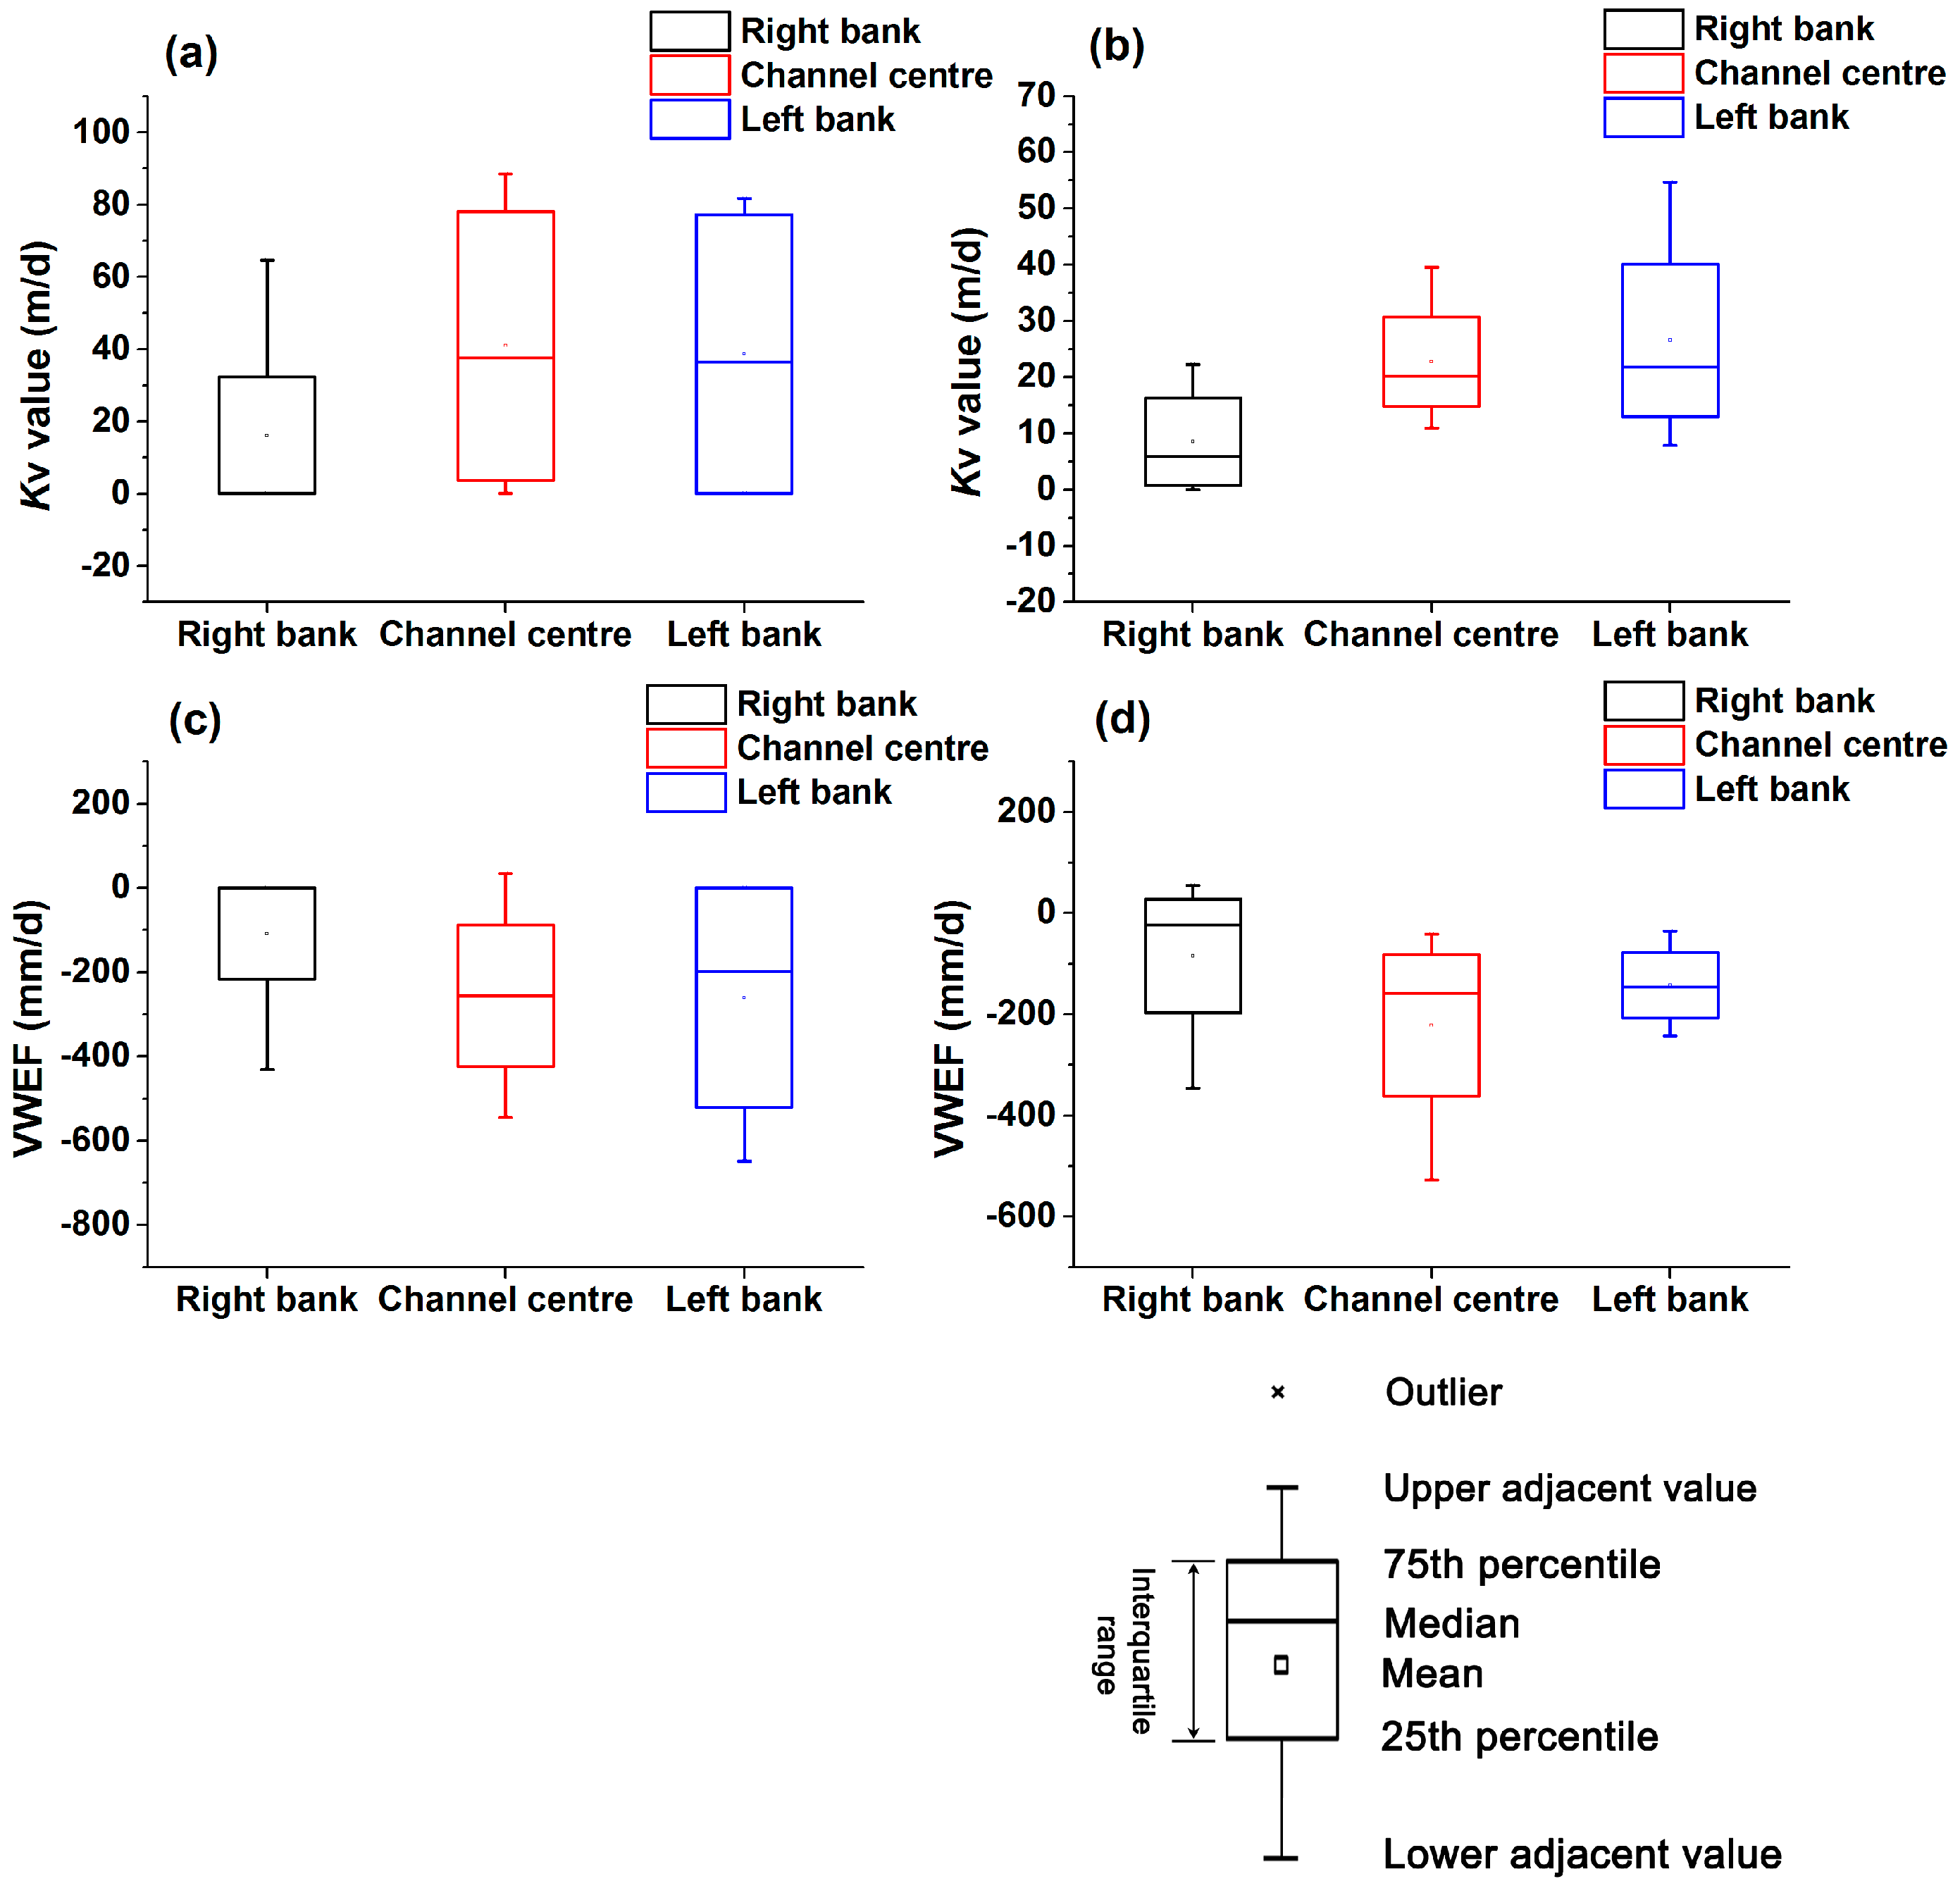
3.1. Spatial Variability in Streambed and VWEF
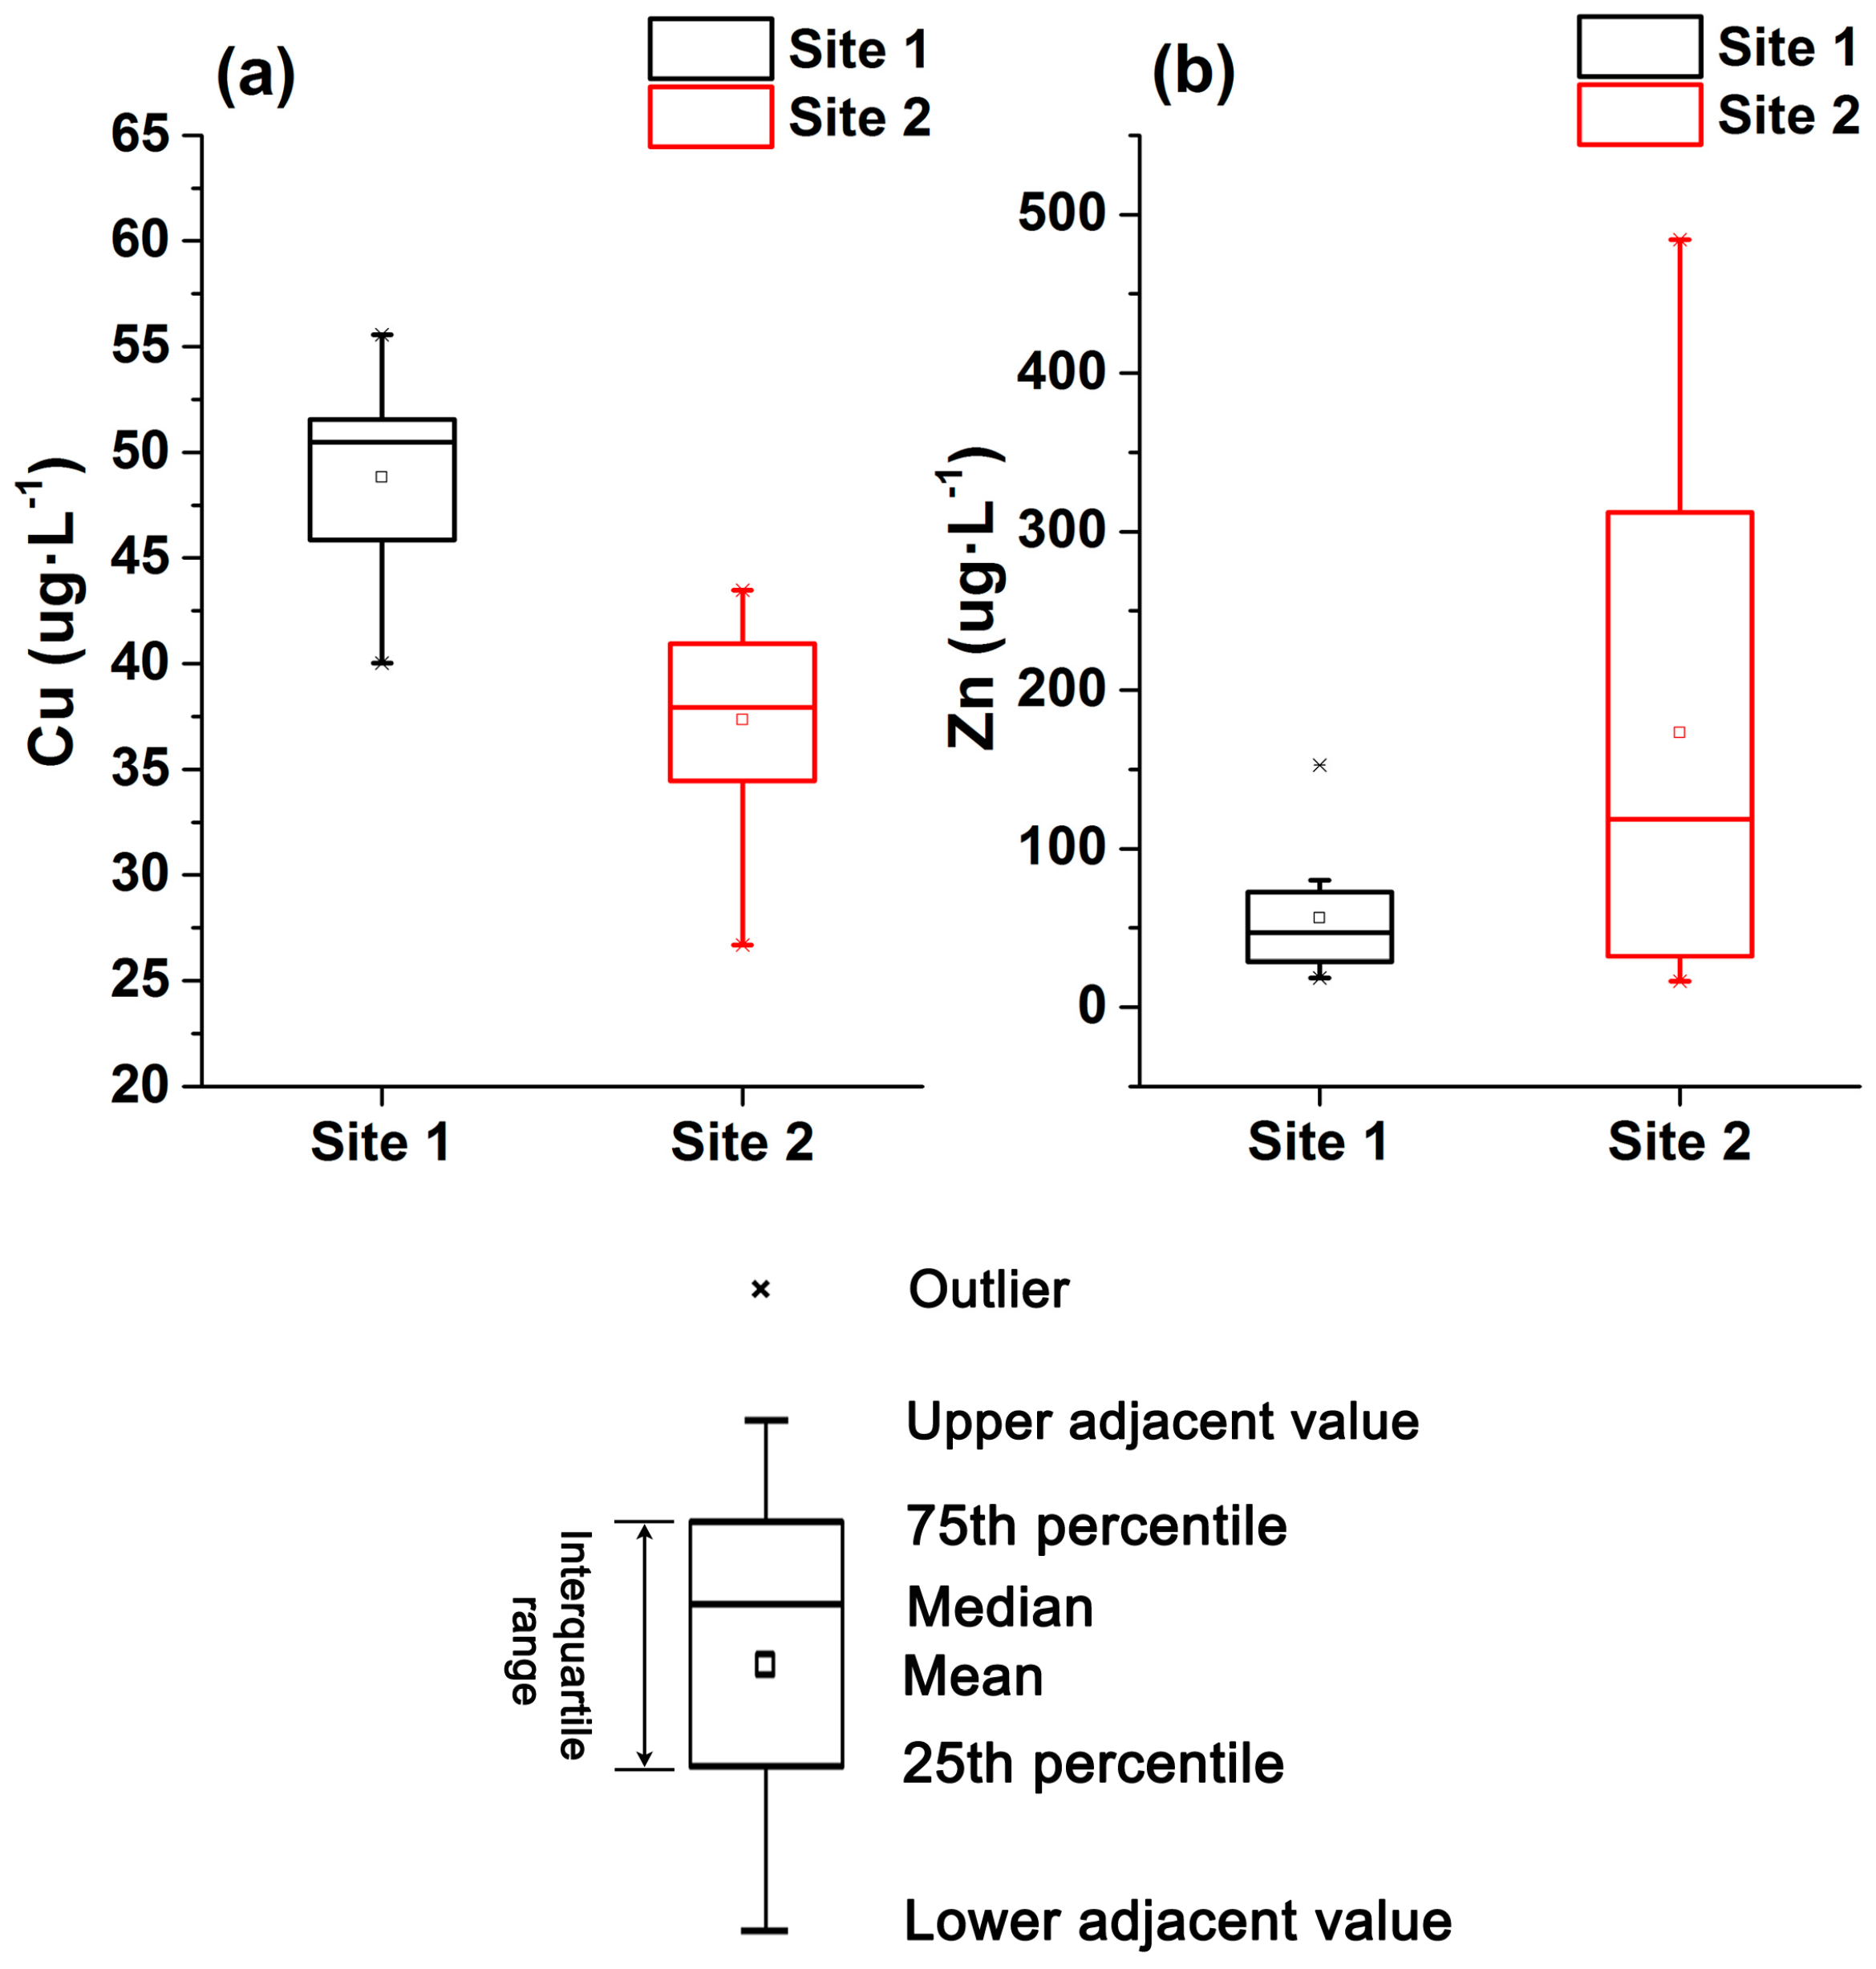
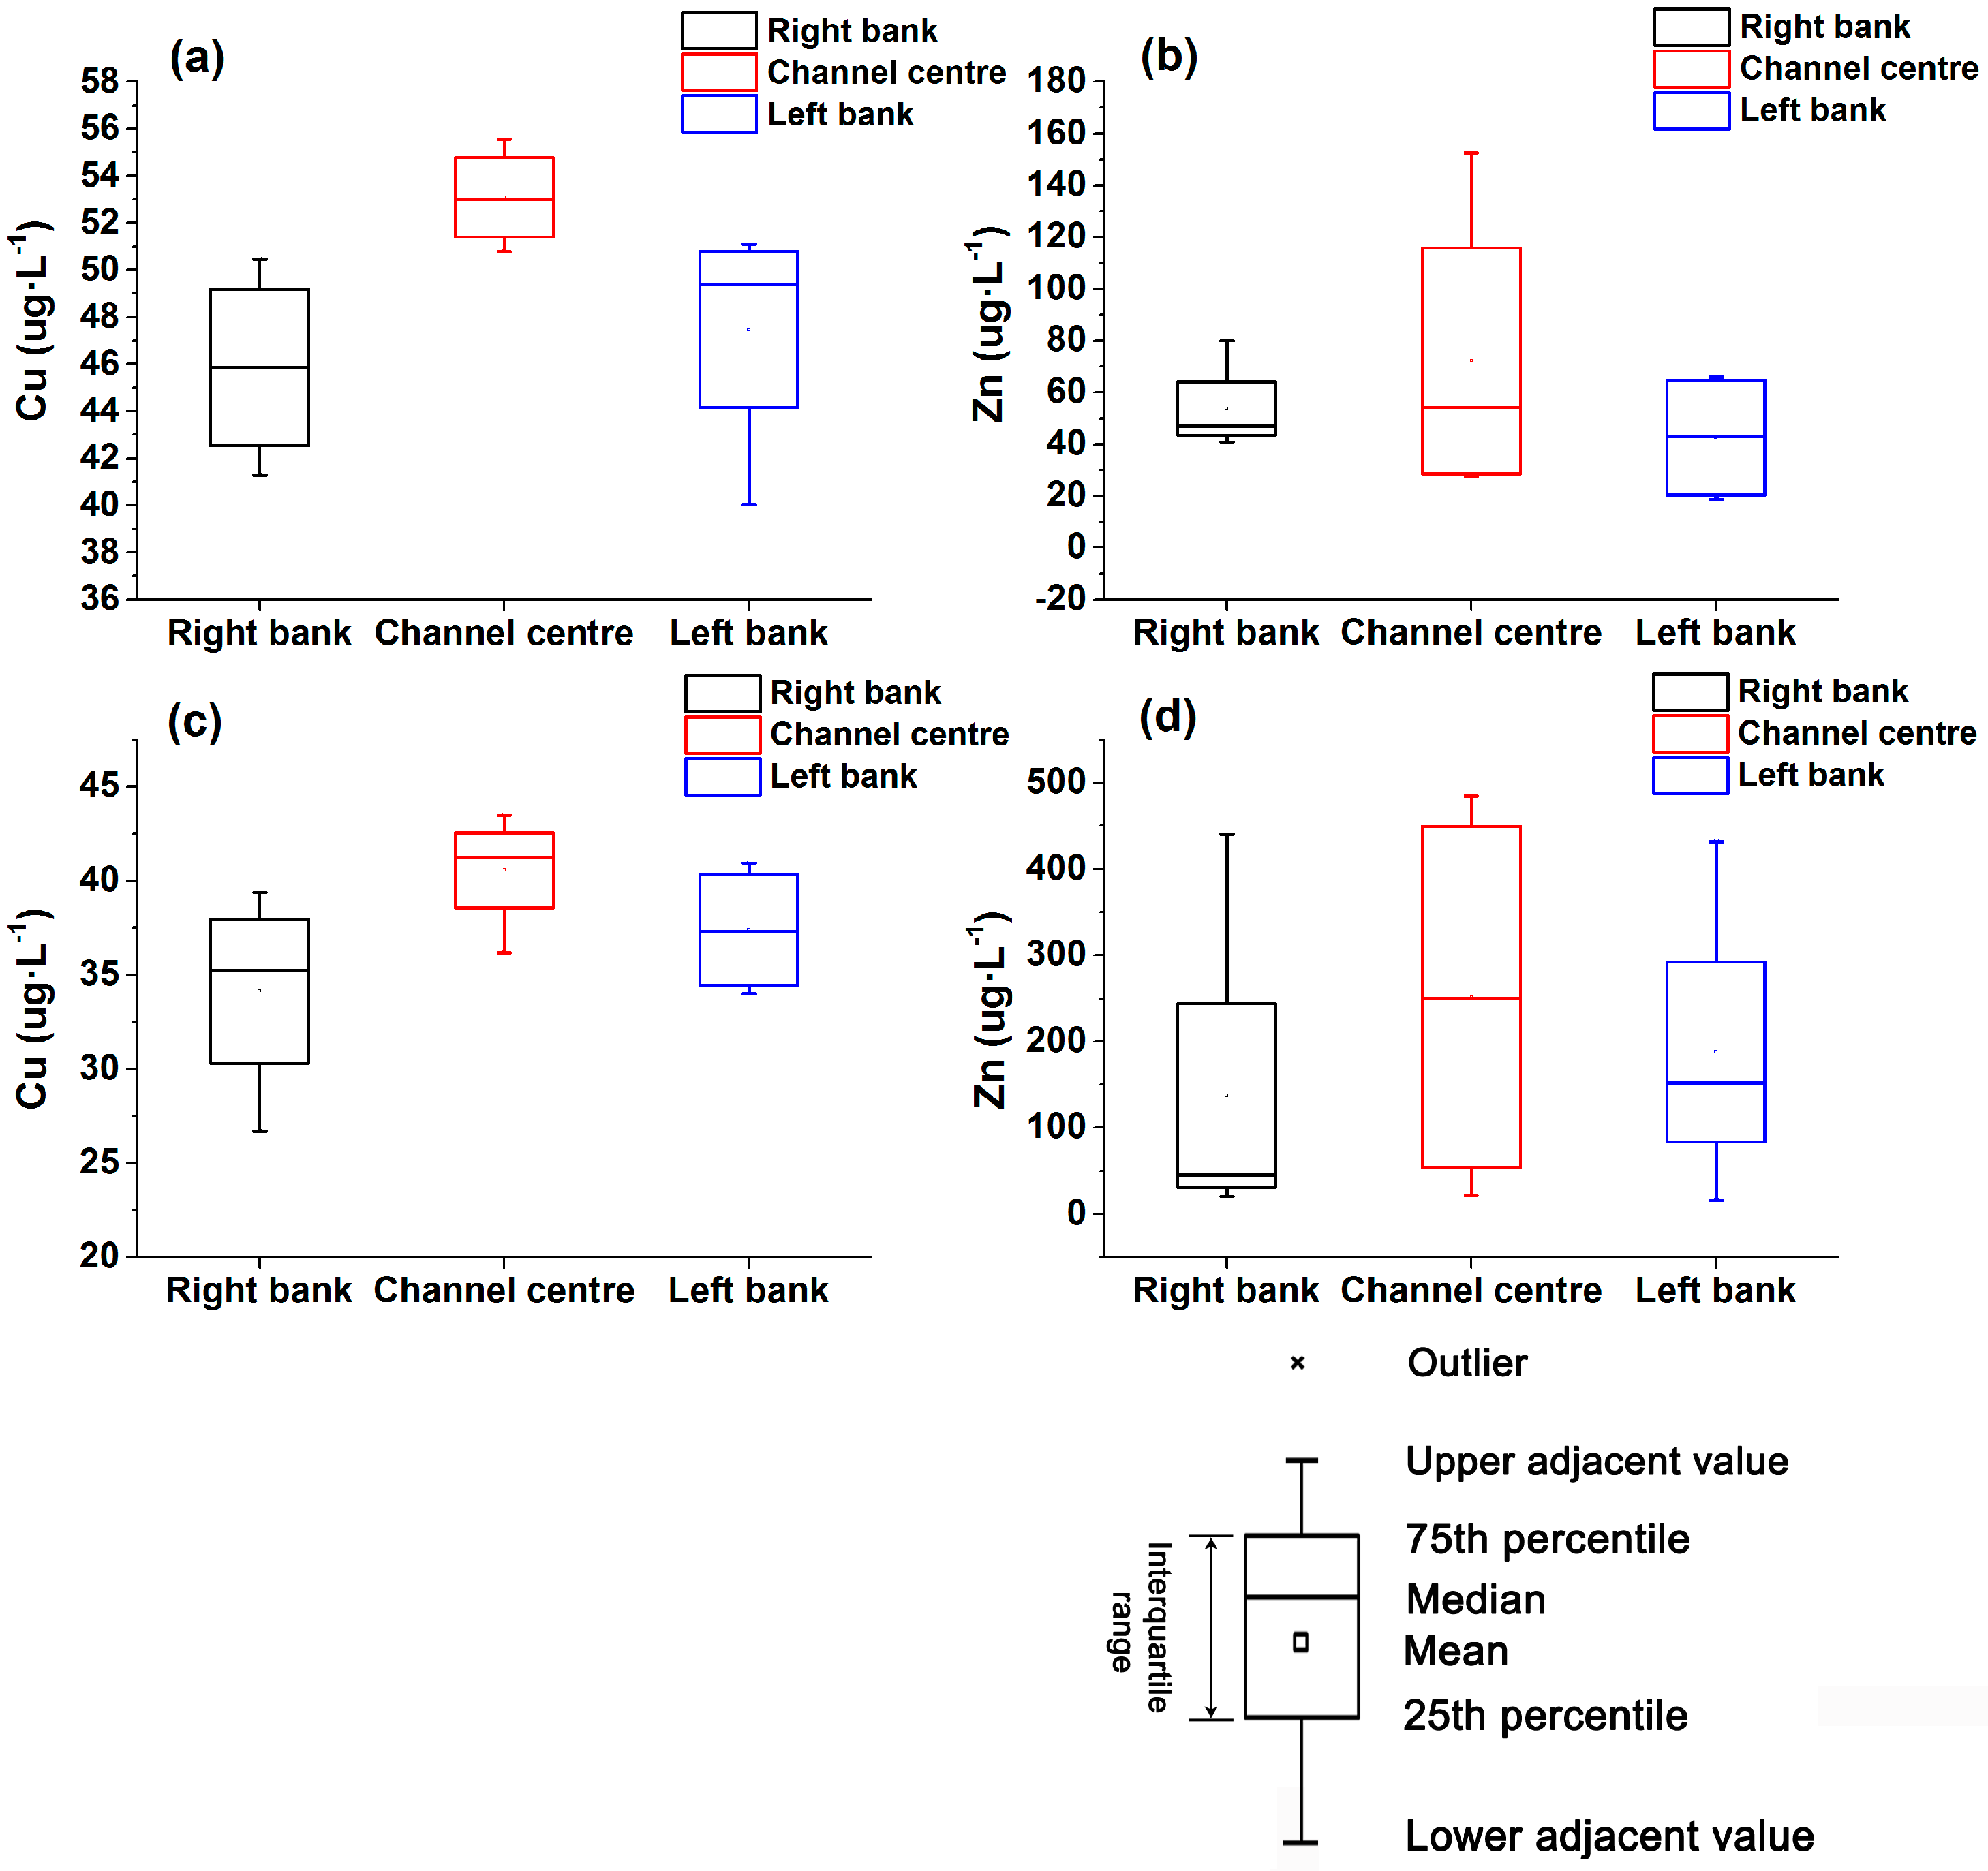
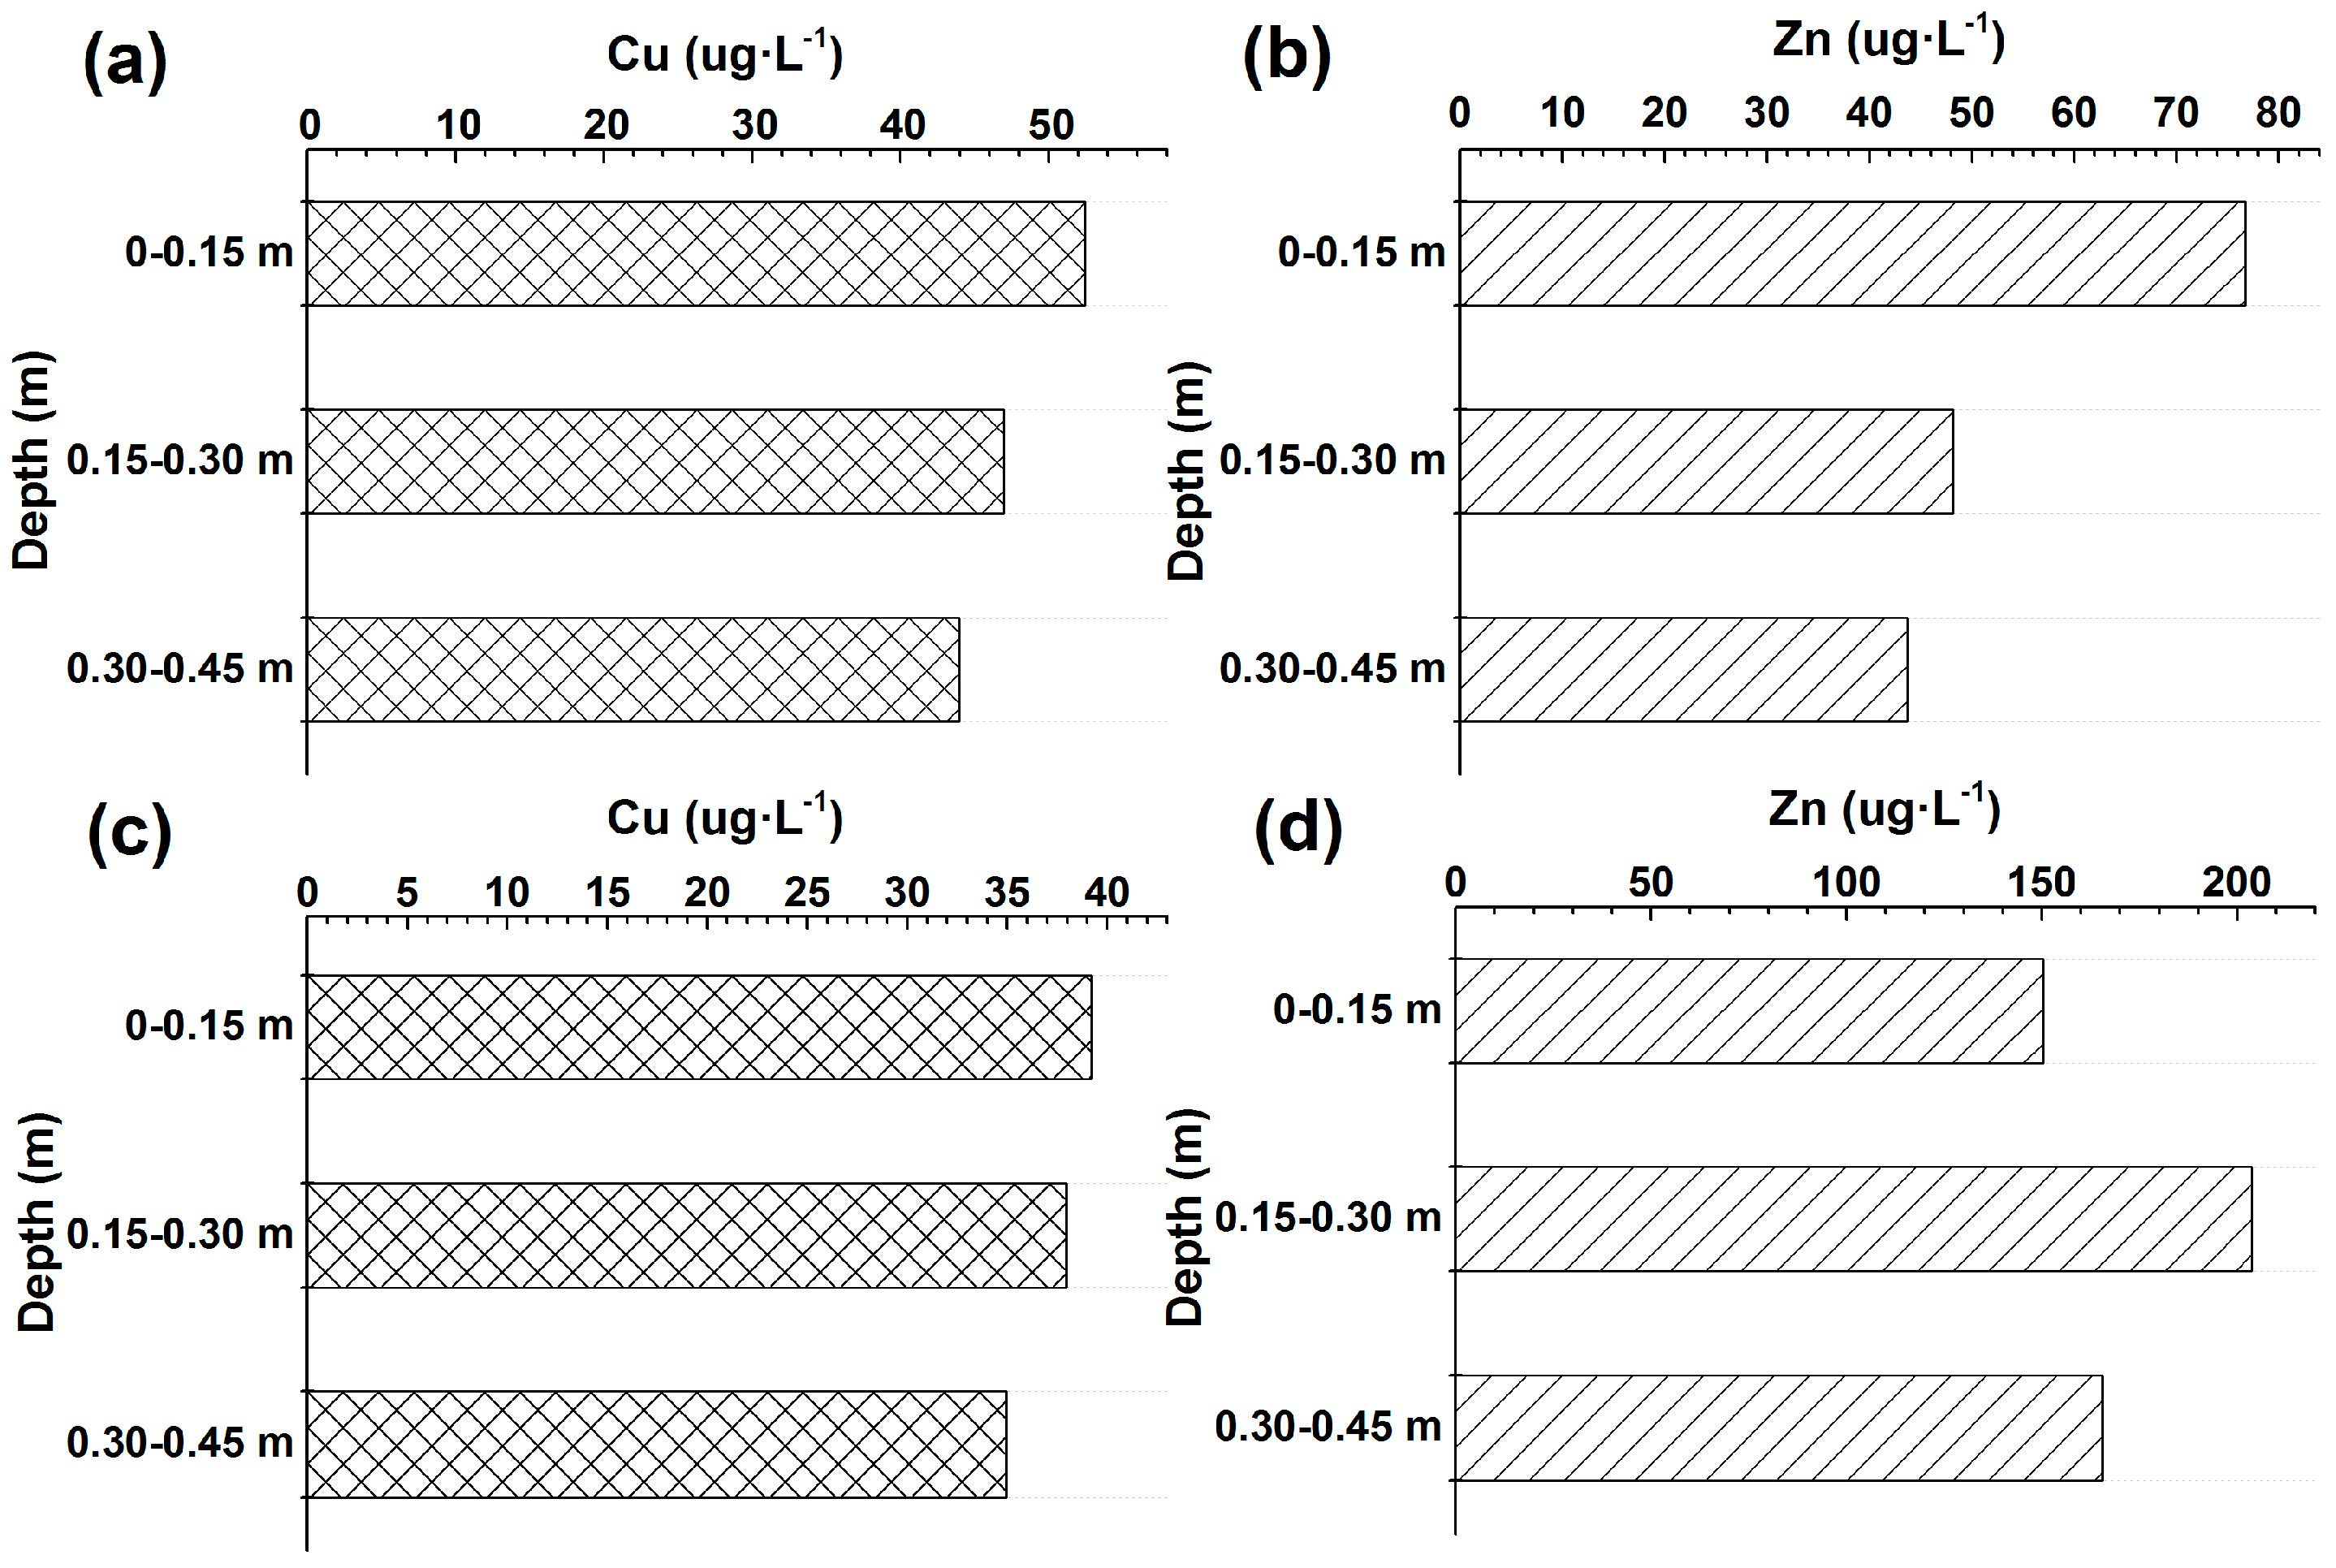
3.2. Spatial Variability in Cu and Zn Concentrations
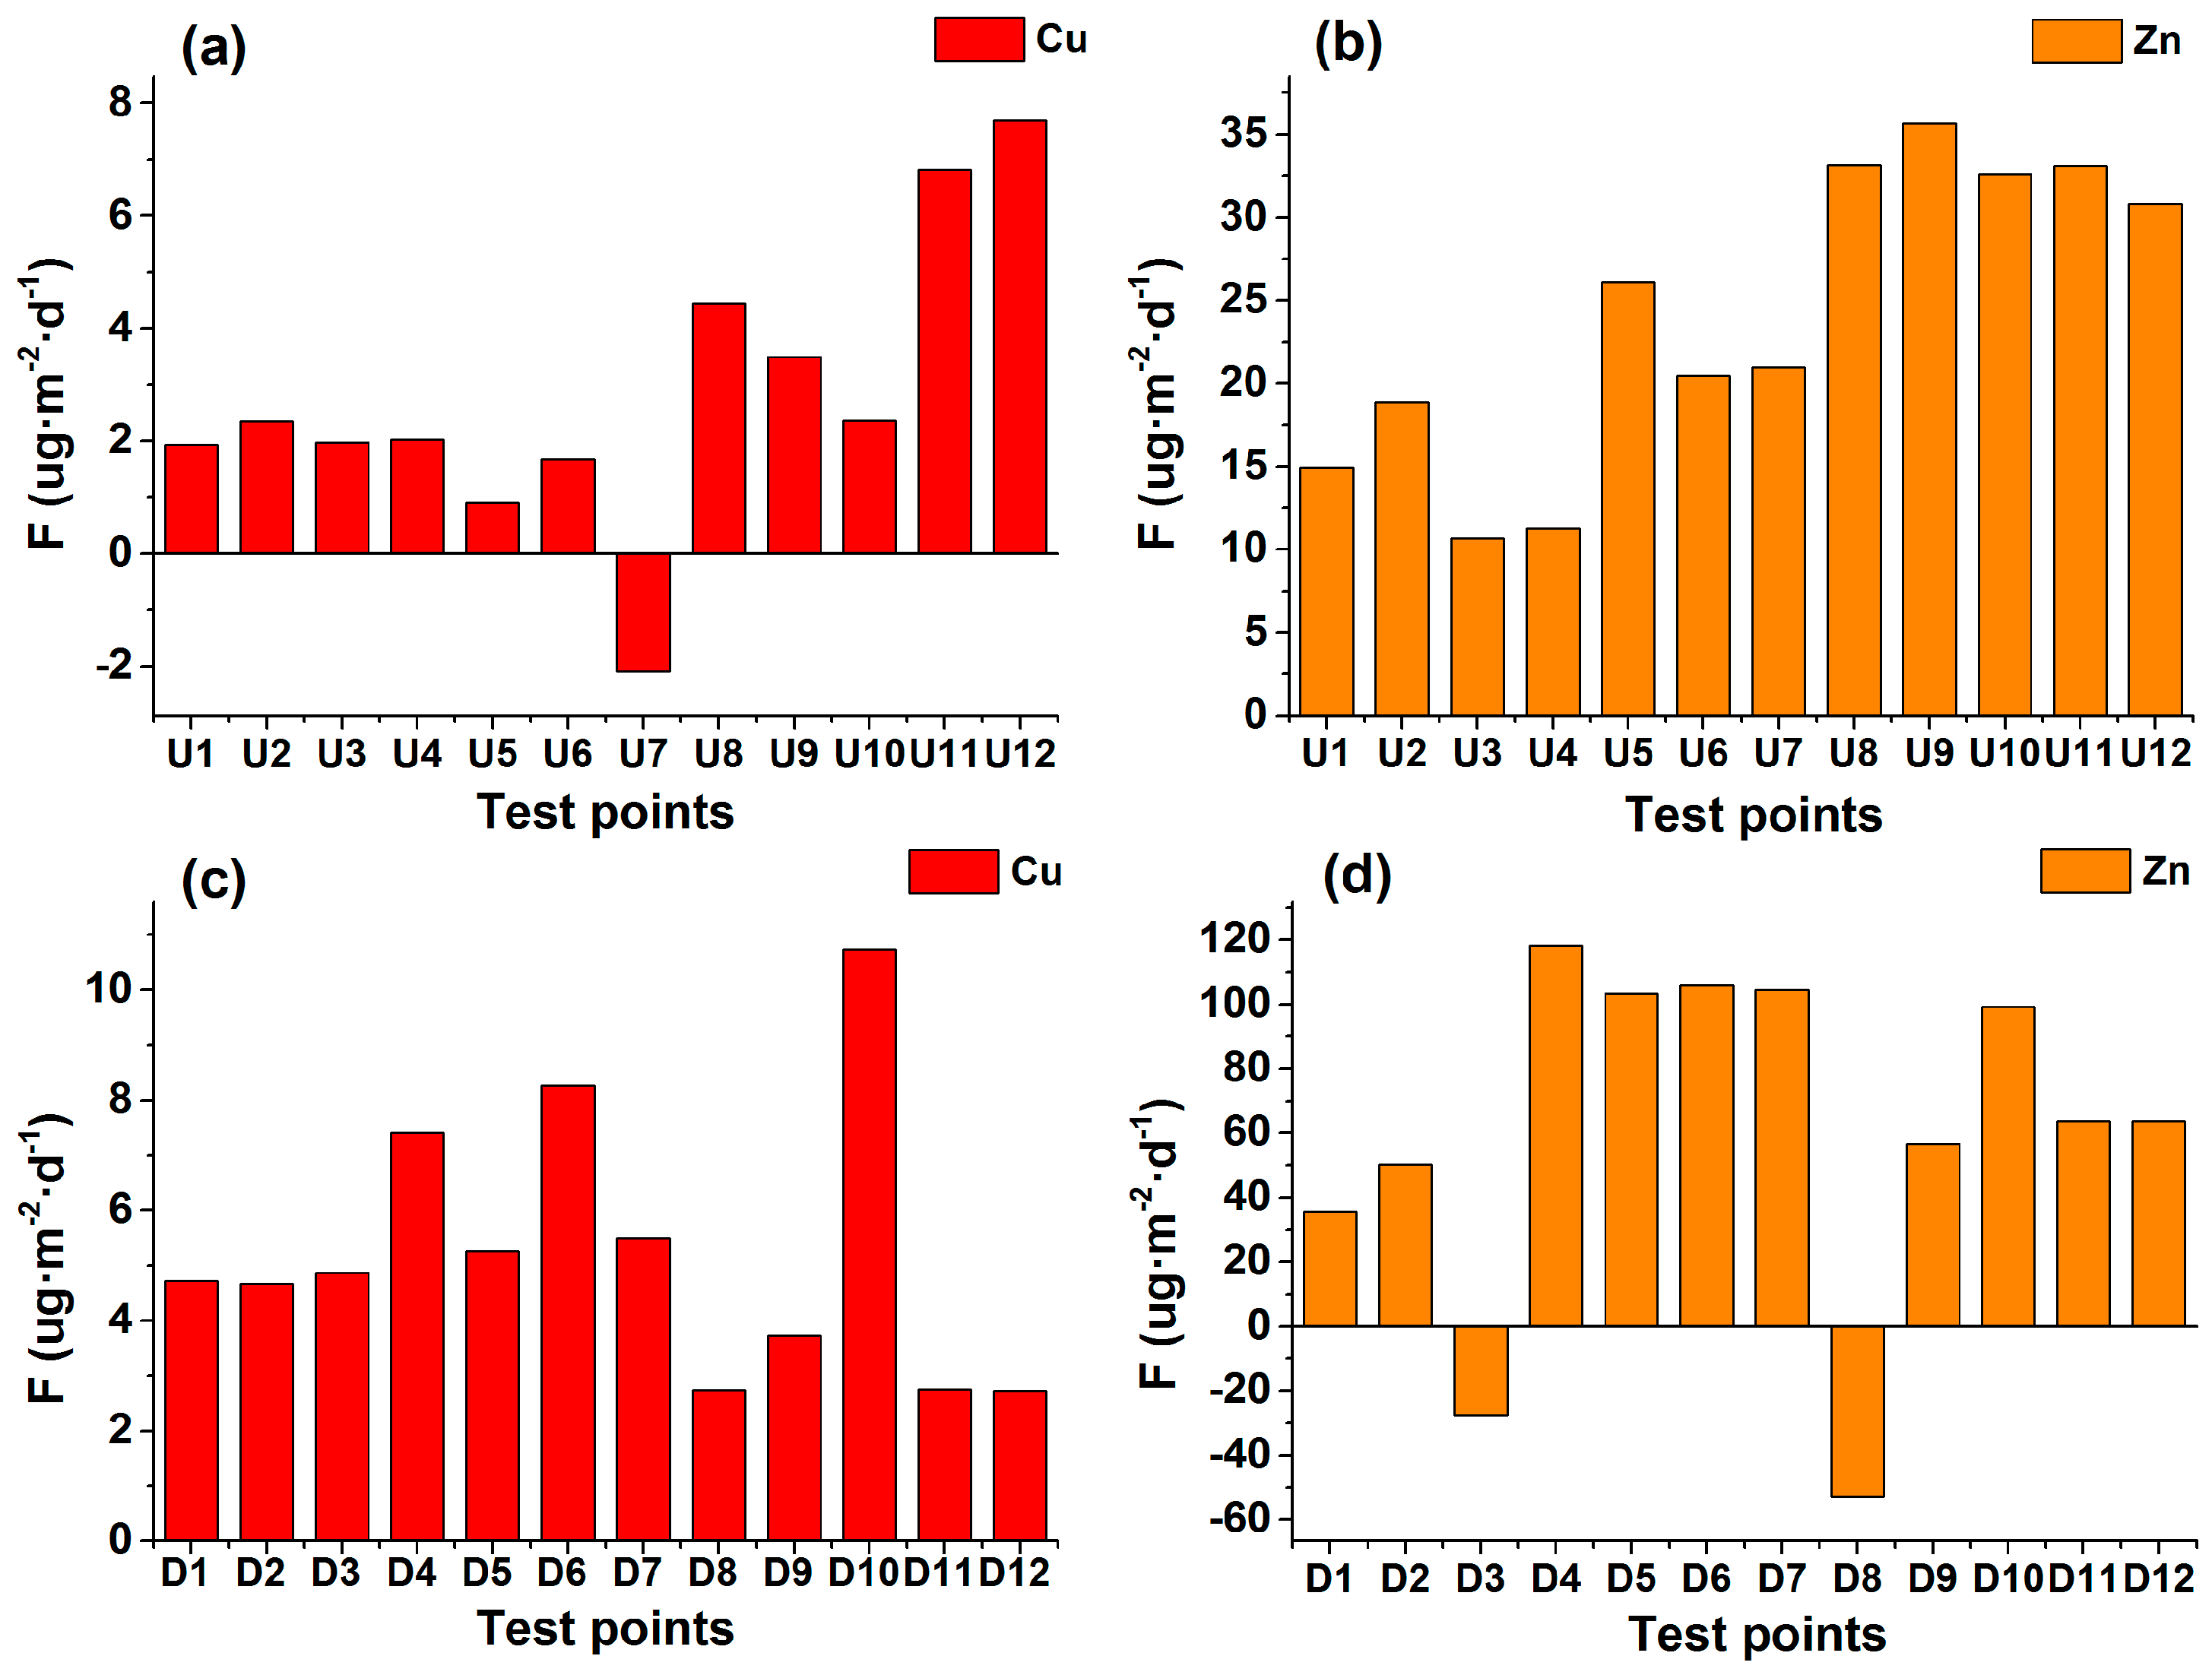
3.3. Diffusive Fluxes of Cu and Zn in Sediment Pore Water
4. Discussion
4.1. Spatial Variability in Streambed , VWEF and Grain Size
4.2. Spatial Variability in Cu and Zn Concentrations in Pore Water and Their Diffusive Fluxes
5. Summary
- (1)
- Vertical water exchange flux (VWEF) patterns in the two sites during the test period were dominantly upward flow and that higher value of and VWEF generally occurred at upstream Site 1, presenting a decreasing trend from the upstream to downstream.
- (2)
- Higher Cu and Zn concentrations in pore water occurred near the channel centre with coarse sand and gravel and greater upward VWEFs because coarser sediment and greater upward VWEFs result in stronger heavy metal desorption capacity.
- (3)
- Cu and Zn at the two sites generally diffused from sediment pore water to surface water, significant positive correlations between the upward VWEF and diffusive fluxes of Cu and Zn indicated that the diffusive fluxes were affected or controlled by the upward VWEF through the sediment.
6. Conclusions
Acknowledgments
Author Contributions
Conflicts of Interest
References
- Song, J.; Yang, X.; Zhang, J.; Long, Y.; Zhang, Y.; Zhang, T. Assessing the variability of heavy metal concentrations in liquid-solid two-phase and related environmental risks in the Weihe River of Shaanxi Province, China. Int. J. Environ. Res. Public Health 2015, 12, 8243–8262. [Google Scholar] [CrossRef] [PubMed]
- Binley, A.; Ullah, S.; Heathwaite, A.L.; Heppell, C.; Byrne, P.; Lansdown, K.; Trimmer, M.; Zhang, H. Revealing the spatial variability of water fluxes at the groundwater-surface water interface. Water Resour. Res. 2013, 49, 3978–3992. [Google Scholar] [CrossRef]
- Krause, S.; Hannah, D.M.; Fleckenstein, J.H. Hyporheic hydrology: Interactions at the groundwater-surface water interface. Hydrol. Process. 2009, 23, 2103–2107. [Google Scholar] [CrossRef]
- Schmidt, C.; Bayer-Raich, M.; Schirmer, M. Characterization of spatial heterogeneity of groundwater-stream water interactions using multiple depth streambed temperature measurements at the reach scale. Hydrol. Earth Syst. Sci. Discuss. 2006, 3, 1419–1446. [Google Scholar] [CrossRef]
- Packman, A.I.; Marion, A.; Zaramella, M.; Chen, C.; Gaillard, J.-F.; Keane, D.T. Development of layered sediment structure and its effects on pore water transport and hyporheic exchange. Water Air Soil Pollut. 2006, 6, 433–442. [Google Scholar] [CrossRef]
- Harvey, J.; Wagner, B. Streams and Ground Waters. Aquatic Ecology Series; Jones, J.B., Mulholland, P.J., Eds.; Academic Press: Cambridge, MA, USA, 2000; p. 441. [Google Scholar]
- Schmidt, C.; Martienssen, M.; Kalbus, E. Influence of water flux and redox conditions on chlorobenzene concentrations in a contaminated streambed. Hydrol. Process. 2011, 25, 234–245. [Google Scholar] [CrossRef]
- Conant, B., Jr.; Cherry, J.A.; Gillham, R.W. A PCE groundwater plume discharging to a river: Influence of the streambed and near-river zone on contaminant distributions. J. Contam. Hydrol. 2004, 73, 249–279. [Google Scholar] [CrossRef] [PubMed]
- Lapworth, D.J.; Gooddy, D.C.; Jarvie, H.P. Understanding phosphorus mobility and bioavailability in the hyporheic zone of a chalk stream. Water Air Soil Pollut. 2010, 218, 213–226. [Google Scholar] [CrossRef]
- Ciszewski, D.; Aleksander-Kwaterczak, U. Contrasting sediment and water chemistry indicates the extent of the hyporheic zone in a polluted river system. Geol. Geophys. Environ. 2016, 42, 151. [Google Scholar] [CrossRef]
- Zhang, J.; Zhang, Y.; Song, J.; Cheng, L. Evaluating relative merits of four baseflow separation methods in Eastern Australia. J. Hydrol. 2017, 549, 252–263. [Google Scholar] [CrossRef]
- Keery, J.; Binley, A.; Crook, N.; Smith, J.W.N. Temporal and spatial variability of groundwater-surface water fluxes: Development and application of an analytical method using temperature time series. J. Hydrol. 2007, 336, 1–16. [Google Scholar] [CrossRef]
- Wang, L.; Jiang, W.; Song, J.; Dou, X.; Guo, H.; Xu, S.; Zhang, G.; Wen, M.; Long, Y.; Li, Q. Investigating spatial variability of vertical water fluxes through the streambed in distinctive stream morphologies using temperature and head data. Hydrogeol. J. 2017, 25, 1283–1299. [Google Scholar] [CrossRef]
- Rau, G.C.; Andersen, M.S.; McCallum, A.M.; Acworth, R.I. Analytical methods that use natural heat as a tracer to quantify surface water-groundwater exchange, evaluated using field temperature records. Hydrogeol. J. 2010, 18, 1093–1110. [Google Scholar] [CrossRef]
- Hyun, Y.; Kim, H.; Lee, S.-S.; Lee, K.-K. Characterizing streambed water fluxes using temperature and head data on multiple spatial scales in Munsan stream, South Korea. J. Hydrol. 2011, 402, 377–387. [Google Scholar] [CrossRef]
- Song, J.; Jiang, W.; Xu, S.; Zhang, G.; Wang, L.; Wen, M.; Zhang, B.; Wang, Y.; Long, Y. Heterogeneity of hydraulic conductivity and darcian flux in the submerged streambed and adjacent exposed stream bank of the Beiluo River, Northwest China. Hydrogeol. J. 2016, 24, 2049–2062. [Google Scholar] [CrossRef]
- Zhang, G.; Song, J.; Wen, M.; Zhang, J.; Jiang, W.; Wang, L.; Kong, F.; Wang, Y. Effect of bank curvatures on hyporheic water exchange at meter scale. Hydrol. Res. 2017, 48, 355–369. [Google Scholar] [CrossRef]
- Moore, F.; Esmaeili, K.; Keshavarzi, B. Assessment of heavy metals contamination in stream water and sediments affected by the sungun porphyry copper deposit, East Azerbaijan Province, Northwest Iran. Water Qual. Expo. Health 2011, 3, 37–49. [Google Scholar] [CrossRef]
- Gupta, A.; Gupta, S.; Patil, R.S. Statistical analyses of coastal water quality for a port and harbour region in India. Environ. Monit. Assess. 2005, 102, 179–200. [Google Scholar] [CrossRef] [PubMed]
- Wennrich, R.; Mattusch, J.; Morgenstern, P.; Freyer, K.; Treutler, H.-C.; Stärk, H.-J.; Brüggemann, L.; Paschke, A.; Daus, B.; Weiss, H. Characterization of sediments in an abandoned mining area; a case study of mansfeld region, Germany. Environ. Geol. 2004, 45, 818–833. [Google Scholar] [CrossRef]
- Liu, L.; Li, F.; Xiong, D.; Song, C. Heavy metal contamination and their distribution in different size fractions of the surficial sediment of Haihe River, China. Environ. Geol. 2006, 50, 431–438. [Google Scholar] [CrossRef]
- Jain, C.K.; Sharma, M.K. Distribution of trace metals in the Hindon River System, India. J. Hydrol. 2001, 253, 81–90. [Google Scholar] [CrossRef]
- Jin, G.; Li, L. Advancement in the hyporheic exchange in rivers. Adv. Water Sci. 2008, 19, 285–293. [Google Scholar]
- Huang, S.L. Investigation of cadmium desorption from different-sized sediments. J. Environ. Eng. 2003, 129, 241–247. [Google Scholar] [CrossRef]
- Singh, A.K.; Hasnain, S.; Banerjee, D. Grain size and geochemical partitioning of heavy metals in sediments of the Damodar River—A tributary of the lower Ganga, India. Environ. Geol. 1999, 39, 90–98. [Google Scholar] [CrossRef]
- Fan, J.; He, X.; Wang, D. Experimental study on the effects of sediment size and porosity on contaminant adsorption/desorption and interfacial diffusion characteristics. J. Hydrodyn. Ser. B 2013, 25, 20–26. [Google Scholar] [CrossRef]
- Wörman, A.; Packman, A.I.; Johansson, H.; Jonsson, K. Effect of flow-induced exchange in hyporheic zones on longitudinal transport of solutes in streams and rivers. Water Resour. Res. 2002, 38. [Google Scholar] [CrossRef]
- Xie, M.; Wang, N.; Gaillard, J.F.; Packman, A.I. Hydrodynamic forcing mobilizes cu in low-permeability estuarine sediments. Environ. Sci. Technol. 2016, 50, 4615–4623. [Google Scholar] [CrossRef] [PubMed]
- Boano, F.; Harvey, J.W.; Marion, A.; Packman, A.I.; Revelli, R.; Ridolfi, L.; Wörman, A. Hyporheic flow and transport processes: Mechanisms, models, and biogeochemical implications. Rev. Geophys. 2014, 52, 603–679. [Google Scholar] [CrossRef]
- Li, Y.; Gregory, S. Diffusion of ions in sea water and in deep-sea sediments. Geochim. Cosmochim. Acta 1974, 38, 703–714. [Google Scholar]
- Sakellari, A.; Plavšić, M.; Karavoltsos, S.; Dassenakis, M.; Scoullos, M. Assessment of copper, cadmium and zinc remobilization in mediterranean marine coastal sediments. Estuar. Coast. Shelf Sci. 2011, 91, 1–12. [Google Scholar] [CrossRef]
- Huettel, M.; Ziebis, W.; Forster, S.; Luther, G. Advective transport affecting metal and nutrient distributions and interfacial fluxes in permeable sediments. Geochim. Cosmochim. Acta 1998, 62, 613–631. [Google Scholar] [CrossRef]
- Song, J.; Cheng, D.; Li, Q.; He, X.; Long, Y.; Zhang, B. An evaluation of river health for the Weihe River in Shaanxi Province, China. Adv. Meteorol. 2015, 2015, 1–13. [Google Scholar] [CrossRef]
- Song, J.; Chen, X.; Cheng, C.; Summerside, S.; Wen, F. Effects of hyporheic processes on streambed vertical hydraulic conductivity in three rivers of Nebraska. Geophys. Res. Lett. 2007, 34. [Google Scholar] [CrossRef]
- Sebok, E.; Duque, C.; Engesgaard, P.; Boegh, E. Spatial variability in streambed hydraulic conductivity of contrasting stream morphologies: Channel bend and straight channel. Hydrol. Process. 2015, 29, 458–472. [Google Scholar] [CrossRef]
- Wang, L.; Song, J.; Zhang, B.; Guo, H.; Jiang, W.; Wen, M.; Zhang, G. Spatial and temporal variations of streambed vertical hydraulic conductivity in the Weihe River, China. Water 2016, 8, 70. [Google Scholar] [CrossRef]
- Jiang, W.W.; Song, J.X.; Zhang, J.L.; Wang, Y.Y.; Zhang, N.; Zhang, X.H.; Long, Y.Q.; Li, J.X.; Yang, X.G. Spatial variability of streambed vertical hydraulic conductivity and its relation to distinctive stream morphologies in the Beiluo River, Shaanxi Province, China. Hydrogeol. J. 2015, 23, 1–10. [Google Scholar] [CrossRef]
- Hvorslev, M.J. Time Lag and Soil Permeability in Ground-Water Observations; U.S. Army Corps of Engineers Waterways Experiment Station: Vicksburg, MS, USA, 1951. [Google Scholar]
- Chen, X. Streambed hydraulic conductivity for rivers in south-central Nebraska. J. Am. Water Resour. Assoc. 2004, 40, 561–573. [Google Scholar] [CrossRef]
- Freeze, R.A.; Cherry, J. Groundwater; Prentice-Hall: Upper Saddle River, NJ, USA, 1979. [Google Scholar]
- Fanelli, R.M.; Lautz, L.K. Patterns of water, heat, and solute flux through streambeds around small dams. Ground Water 2008, 46, 671–687. [Google Scholar] [CrossRef] [PubMed]
- Käser, D.H.; Binley, A.; Heathwaite, A.L.; Krause, S. Spatio-temporal variations of hyporheic flow in a riffle-step-pool sequence. Hydrol. Process. 2009, 23, 2138–2149. [Google Scholar] [CrossRef]
- Tang, W.; Duan, S.; Shan, B.; Zhang, H.; Zhang, W.; Zhao, Y.; Zhang, C. Concentrations, diffusive fluxes and toxicity of heavy metals in pore water of the Fuyang River, Haihe Basin. Ecotoxicol. Environ. Saf. 2016, 127, 80–86. [Google Scholar] [CrossRef] [PubMed]
- Tao, Y.; Yuan, Z.; Wei, M.; Xiaona, H. Characterization of heavy metals in water and sediments in Taihu Lake, China. Environ. Monit. Assess. 2012, 184, 4367–4382. [Google Scholar] [CrossRef] [PubMed]
- Blascoa, J.; Saenz, V.; Gomez-Parra, A. Heavy metal fluxes at the sediment-water interface of three coastal ecosystems from south-west of the Iberian Peninsula. Sci. Total Environ. 2000, 247, 189–199. [Google Scholar] [CrossRef]
- Zhu, X.; Shan, B.; Tang, W.; Li, S.; Rong, N. Distributions, fluxes, and toxicities of heavy metals in sediment pore water from tributaries of the Ziya River System, Northern China. Environ. Sci. Pollut. Res. 2015, 23, 5516–5526. [Google Scholar] [CrossRef] [PubMed]
- Caetano, M.; Madureira, M.J.; Vale, C. Exchange of Cu and Cd across the sediment-water interface in intertidal mud flats from Ria Formosa (Portugal). Hydrobiologia 2007, 587, 147–155. [Google Scholar] [CrossRef]
- Ullman, W.J.; Sandstrom, M.W. Dissolved nutrient fluxes from the nearshore sediments of bowling green bay, central great barrier reef lagoon (Australia). Estuar. Coast. Shelf Sci. 1987, 24, 289–303. [Google Scholar] [CrossRef]
- Song, J.; Chen, X.; Cheng, C.; Wang, D.; Lackey, S.; Xu, Z. Feasibility of grain-size analysis methods for determination of vertical hydraulic conductivity of streambeds. J. Hydrol. 2009, 375, 428–437. [Google Scholar] [CrossRef]
- Ryan, R.J.; Boufadel, M.C. Evaluation of streambed hydraulic conductivity heterogeneity in an urban watershed. Stoch. Environ. Res. Risk Assess. 2006, 21, 309–316. [Google Scholar] [CrossRef]
- Kennedy, C.D.; Genereux, D.P.; Corbett, D.R.; Mitasova, H. Spatial and temporal dynamics of coupled groundwater and nitrogen fluxes through a streambed in an agricultural watershed. Water Resour. Res. 2009, 45. [Google Scholar] [CrossRef]
- Kurz, M.J.; Martin, J.B.; Cohen, M.J.; Hensley, R.T. Diffusion and seepage-driven element fluxes from the hyporheic zone of a karst river. Freshw. Sci. 2015, 34, 206–221. [Google Scholar] [CrossRef]
- Gomez-Velez, J.D.; Krause, S.; Wilson, J.L. Effect of low-permeability layers on spatial patterns of hyporheic exchange and groundwater upwelling. Water Resour. Res. 2014, 50, 5196–5215. [Google Scholar] [CrossRef]
- Wang, T.; Zlotnik, V.A.; Wedin, D.; Wally, K.D. Spatial trends in saturated hydraulic conductivity of vegetated dunes in the Nebraska Sand Hills: Effects of depth and topography. J. Hydrol. 2008, 349, 88–97. [Google Scholar] [CrossRef]
- Cardenas, M.B.; Wilson, J.L.; Zlotnik, V.A. Impact of heterogeneity, bed forms, and stream curvature on subchannel hyporheic exchange. Water Resour. Res. 2004, 40. [Google Scholar] [CrossRef]
- Schmidt, C.; Conant, B.; Bayer-Raich, M.; Schirmer, M. Evaluation and field-scale application of an analytical method to quantify groundwater discharge using mapped streambed temperatures. J. Hydrol. 2007, 347, 292–307. [Google Scholar] [CrossRef]
- Frei, S.; Lischeid, G.; Fleckenstein, J.H. Effects of micro-topography on surface-subsurface exchange and runoff generation in a virtual riparian wetland: A modeling study. Adv. Water Res. 2010, 33, 1388–1401. [Google Scholar] [CrossRef]
- Westbrook, S.J.; Rayner, J.L.; Davis, G.B.; Clement, T.P.; Bjerg, P.L.; Fisher, S.J. Interaction between shallow groundwater, saline surface water and contaminant discharge at a seasonally and tidally forced estuarine boundary. J. Hydrol. 2005, 302, 255–269. [Google Scholar] [CrossRef]
- Anibas, C.; Buis, K.; Verhoeven, R.; Meire, P.; Batelaan, O. A simple thermal mapping method for seasonal spatial patterns of groundwater—Surface water interaction. J. Hydrol. 2011, 397, 93–104. [Google Scholar] [CrossRef]
- Genereux, D.P.; Leahy, S.; Mitasova, H.; Kennedy, C.D.; Corbett, D.R. Spatial and temporal variability of streambed hydraulic conductivity in west bear creek, North Carolina, USA. J. Hydrol. 2008, 358, 332–353. [Google Scholar] [CrossRef]
- Song, J.; Chen, X.; Cheng, C.; Wang, D.; Wang, W. Variability of streambed vertical hydraulic conductivity with depth along the Elkhorn River, Nebraska, USA. Chin. Sci. Bull. 2010, 55, 992–999. [Google Scholar] [CrossRef]
- Pozdniakov, S.P.; Wang, P.; Lekhov, M.V. A semi-analytical generalized hvorslev formula for estimating riverbed hydraulic conductivity with an open-ended standpipe permeameter. J. Hydrol. 2016, 540, 736–743. [Google Scholar] [CrossRef]
- Leek, R.; Wu, J.Q.; Wang, L.; Hanrahan, T.P.; Barber, M.E.; Qiu, H. Heterogeneous characteristics of streambed saturated hydraulic conductivity of the Touchet River, South Eastern Washington, USA. Hydrol. Process. 2009, 23, 1236–1246. [Google Scholar] [CrossRef]
- Chen, X.H.; Burbach, M.; Cheng, C. Electrical and hydraulic vertical variability in channel sediments and its effects on streamflow depletion due to groundwater extraction. J. Hydrol. 2008, 352, 250–266. [Google Scholar] [CrossRef]
- Roque, A.J.; Didier, G. Calculating hydraulic conductivity of fine-grained soils to leachates using linear expressions. Eng. Geol. 2006, 85, 147–157. [Google Scholar] [CrossRef]
- Song, J.; Zhang, G.; Wang, W.; Liu, Q.; Jiang, W.; Guo, W.; Tang, B.; Bai, H.; Dou, X. Variability in the vertical hyporheic water exchange effected by hydraulic conductivity and river morphology at a natural confluent meander bend. Hydrol. Process. 2017. [Google Scholar] [CrossRef]
- Santos-Echeandia, J.; Prego, R.; Cobelo-García, A.; Millward, G.E. Porewater geochemistry in a Galician Ria (NW Iberian Peninsula): Implications for benthic fluxes of dissolved trace elements (Co, Cu, Ni, Pb, V, Zn). Mar. Chem. 2009, 117, 77–87. [Google Scholar] [CrossRef]
- Li, S.S.; Shan, B.Q.; Zhang, H. Heavy metal speciation in the surface sediments of Fuyang River. Environ. Chem. 2013, 32, 2016–2023. [Google Scholar]
- Li, S.S.; Shan, B.Q.; Zhang, H. Characteristics and ecological risk assessment of heavy metal pollution in surface sediments of Fuyang River. Acta Sci. Circumst. 2013, 33, 2277–2284. [Google Scholar]
- Lin, S.; Hsieh, I.J.; Huang, K.M.; Wang, C.H. Influence of the Yangtze River and grain size on the spatial variations of heavy metals and organic carbon in the east china sea continental shelf sediments. Chem. Geol. 2002, 182, 377–394. [Google Scholar] [CrossRef]
- Villaescusa-Celaya, J.; Gutiérrez-Galindo, E.; Flores-Muñoz, G. Heavy metals in the fine fraction of coastal sediments from Baja California (Mexico) and California (USA). Environ. Pollut. 2000, 108, 453–462. [Google Scholar] [CrossRef]
- Hellali, M.A.; Zaaboub, N.; Oueslati, W.; Added, A.; Aleya, L. Diagenetic processes and sediment-water exchanges of heavy metals in the Mejerda River Delta (Gulf of Tunis). Environ. Earth Sci. 2015, 74, 6665–6679. [Google Scholar] [CrossRef]
- Hou, D.; He, J.; Lu, C.; Ren, L.; Fan, Q.; Wang, J.; Xie, Z. Distribution characteristics and potential ecological risk assessment of heavy metals (Cu, Pb, Zn, Cd) in water and sediments from Lake Dalinouer, China. Ecotoxicol. Environ. Saf. 2013, 93, 135–144. [Google Scholar] [CrossRef] [PubMed]
- Szefer, P.; Szefer, K. Concentration and discrimination factors for Cd, Pb, Zn and Cu in benthos of Puck Bay, Baltic Sea. Sci. Total Environ. 1991, 105, 127–133. [Google Scholar] [CrossRef]
- Jiang, X.; Wang, W.; Wang, S.; Zhang, B.; Hu, J. Initial identification of heavy metals contamination in Taihu Lake, a eutrophic lake in China. J. Environ. Sci. 2012, 24, 1539–1548. [Google Scholar] [CrossRef]
- Gandy, C.J.; Smith, J.W.; Jarvis, A.P. Attenuation of mining-derived pollutants in the hyporheic zone: A review. Sci. Total Environ. 2007, 373, 435–446. [Google Scholar] [CrossRef] [PubMed]


| Study Sites | Site 1 | Site 2 |
|---|---|---|
| Test date | 22 August 2016 | 23 August 2016 |
| Coordinates | 108°54′56.05″ E | 108°52′20.78″ E |
| 34°09′02.28″ N | 34°06′36.62″ N | |
| Numbers of test points | 12 | 12 |
| Average width of stream (m) | 7.825 | 14.38 |
| Average velocity (m/s) | 0.265 | 0.273 |
| Max. water depth (cm) | 30 | 61 |
| Average water depth (cm) | 23.50 | 41.75 |
| Site description | Site 1 is a straight channel. Streambed sediment contains slit, clay, and coarser materials. | Site 2 is near the bend of stream. Streambed sediment contains medium sand, coarse sand and gravel. |
| Study Sites | Minimum | Maximum | Mean | Median | Std. Deviation (SD) | Coefficient of Variation (CV) | |
|---|---|---|---|---|---|---|---|
| (m/d) | Site 1 | 0.005 | 88.501 | 31.936 | 3.789 | 36.995 | 1.158 |
| Site 2 | 0.011 | 54.674 | 19.293 | 18.377 | 14.957 | 0.775 | |
| All | 0.005 | 88.501 | 25.614 | 14.543 | 28.916 | 1.129 | |
| VWEF (mm/d) | Site 1 | −647.883 | 34.410 | −208.126 | −106.005 | 236.990 | −1.139 |
| Site 2 | −527.107 | 54.485 | −149.357 | −121.292 | 156.370 | −1.047 | |
| All | −647.883 | 54.485 | −178.741 | −121.292 | 202.907 | −1.135 |
| Grain Size | Site 1 | Site 2 | |||||
|---|---|---|---|---|---|---|---|
| L | C | R | L | C | R | ||
| Average value of cumulative percentage (%) | 0.075–2 mm (sand) | 65.701 | 64.817 | 70.468 | 65.702 | 64.817 | 70.468 |
| <0.075 mm (silt-clay) | 4.425 | 2.339 | 14.067 | 0.564 | 0.871 | 1.348 | |
| Average median grain size | (mm) | 0.253 | 0.268 | 0.194 | 0.344 | 0.304 | 0.098 |
| Study Sites | Minimum | Maximum | Mean | Median | Std. Deviation (SD) | Coefficient of Variation (CV) | ||
|---|---|---|---|---|---|---|---|---|
| Cu (µg·L−1) | Site 1 | PW | 40.03 | 55.57 | 48.81 | 50.48 | 4.63 | 0.09 |
| Site 2 | PW | 26.68 | 43.48 | 37.36 | 37.94 | 4.43 | 0.12 | |
| All | SW | 33.35 | 36.20 | 34.77 | 34.78 | 1.43 | 0.04 | |
| PW | 26.68 | 55.57 | 43.08 | 41.43 | 7.30 | 0.17 | ||
| GW | 26.70 | 38.10 | 32.40 | 32.40 | 5.70 | 0.18 | ||
| Zn (µg·L−1) | Site 1 | PW | 18.48 | 152.65 | 56.20 | 47.08 | 35.39 | 0.63 |
| Site 2 | PW | 16.37 | 484.32 | 173.23 | 118.70 | 167.14 | 0.96 | |
| All | SW | 42.40 | 130.20 | 86.30 | 86.30 | 43.90 | 0.51 | |
| PW | 16.37 | 484.32 | 114.72 | 55.83 | 134.23 | 1.17 | ||
| GW | 36.30 | 108.90 | 72.60 | 72.60 | 36.30 | 0.50 | ||
© 2017 by the authors. Licensee MDPI, Basel, Switzerland. This article is an open access article distributed under the terms and conditions of the Creative Commons Attribution (CC BY) license (http://creativecommons.org/licenses/by/4.0/).
Share and Cite
Liu, Q.; Song, J.; Zhang, G.; Wang, W.; Guo, W.; Tang, B.; Kong, F.; Huo, A. Effects of Hyporheic Water Fluxes and Sediment Grain Size on the Concentration and Diffusive Flux of Heavy Metals in the Streambed. Int. J. Environ. Res. Public Health 2017, 14, 1020. https://doi.org/10.3390/ijerph14091020
Liu Q, Song J, Zhang G, Wang W, Guo W, Tang B, Kong F, Huo A. Effects of Hyporheic Water Fluxes and Sediment Grain Size on the Concentration and Diffusive Flux of Heavy Metals in the Streambed. International Journal of Environmental Research and Public Health. 2017; 14(9):1020. https://doi.org/10.3390/ijerph14091020
Chicago/Turabian StyleLiu, Qi, Jinxi Song, Guotao Zhang, Weize Wang, Weiqiang Guo, Bin Tang, Feihe Kong, and Aidi Huo. 2017. "Effects of Hyporheic Water Fluxes and Sediment Grain Size on the Concentration and Diffusive Flux of Heavy Metals in the Streambed" International Journal of Environmental Research and Public Health 14, no. 9: 1020. https://doi.org/10.3390/ijerph14091020