Thyroid Cancer Incidence around the Belgian Nuclear Sites, 2000–2014

 , ,
, ,
Abstract
:1. Introduction
2. Materials and Methods
2.1. Cancer and Population Data
2.2. Nuclear Sites and Surrogate Exposure
2.2.1. Nuclear Sites
2.2.2. Proximity
2.2.3. Prevailing Winds
2.2.4. Radioactive Discharges Estimates
2.3. Statistical Analyses
2.3.1. Descriptive Analyses
2.3.2. Incidence of Tyroid Cancer around Nuclear Sites
2.3.3. Association between Surrogate Exposures and Incidence of Thyroid Cancer around Nuclear Sites
3. Results
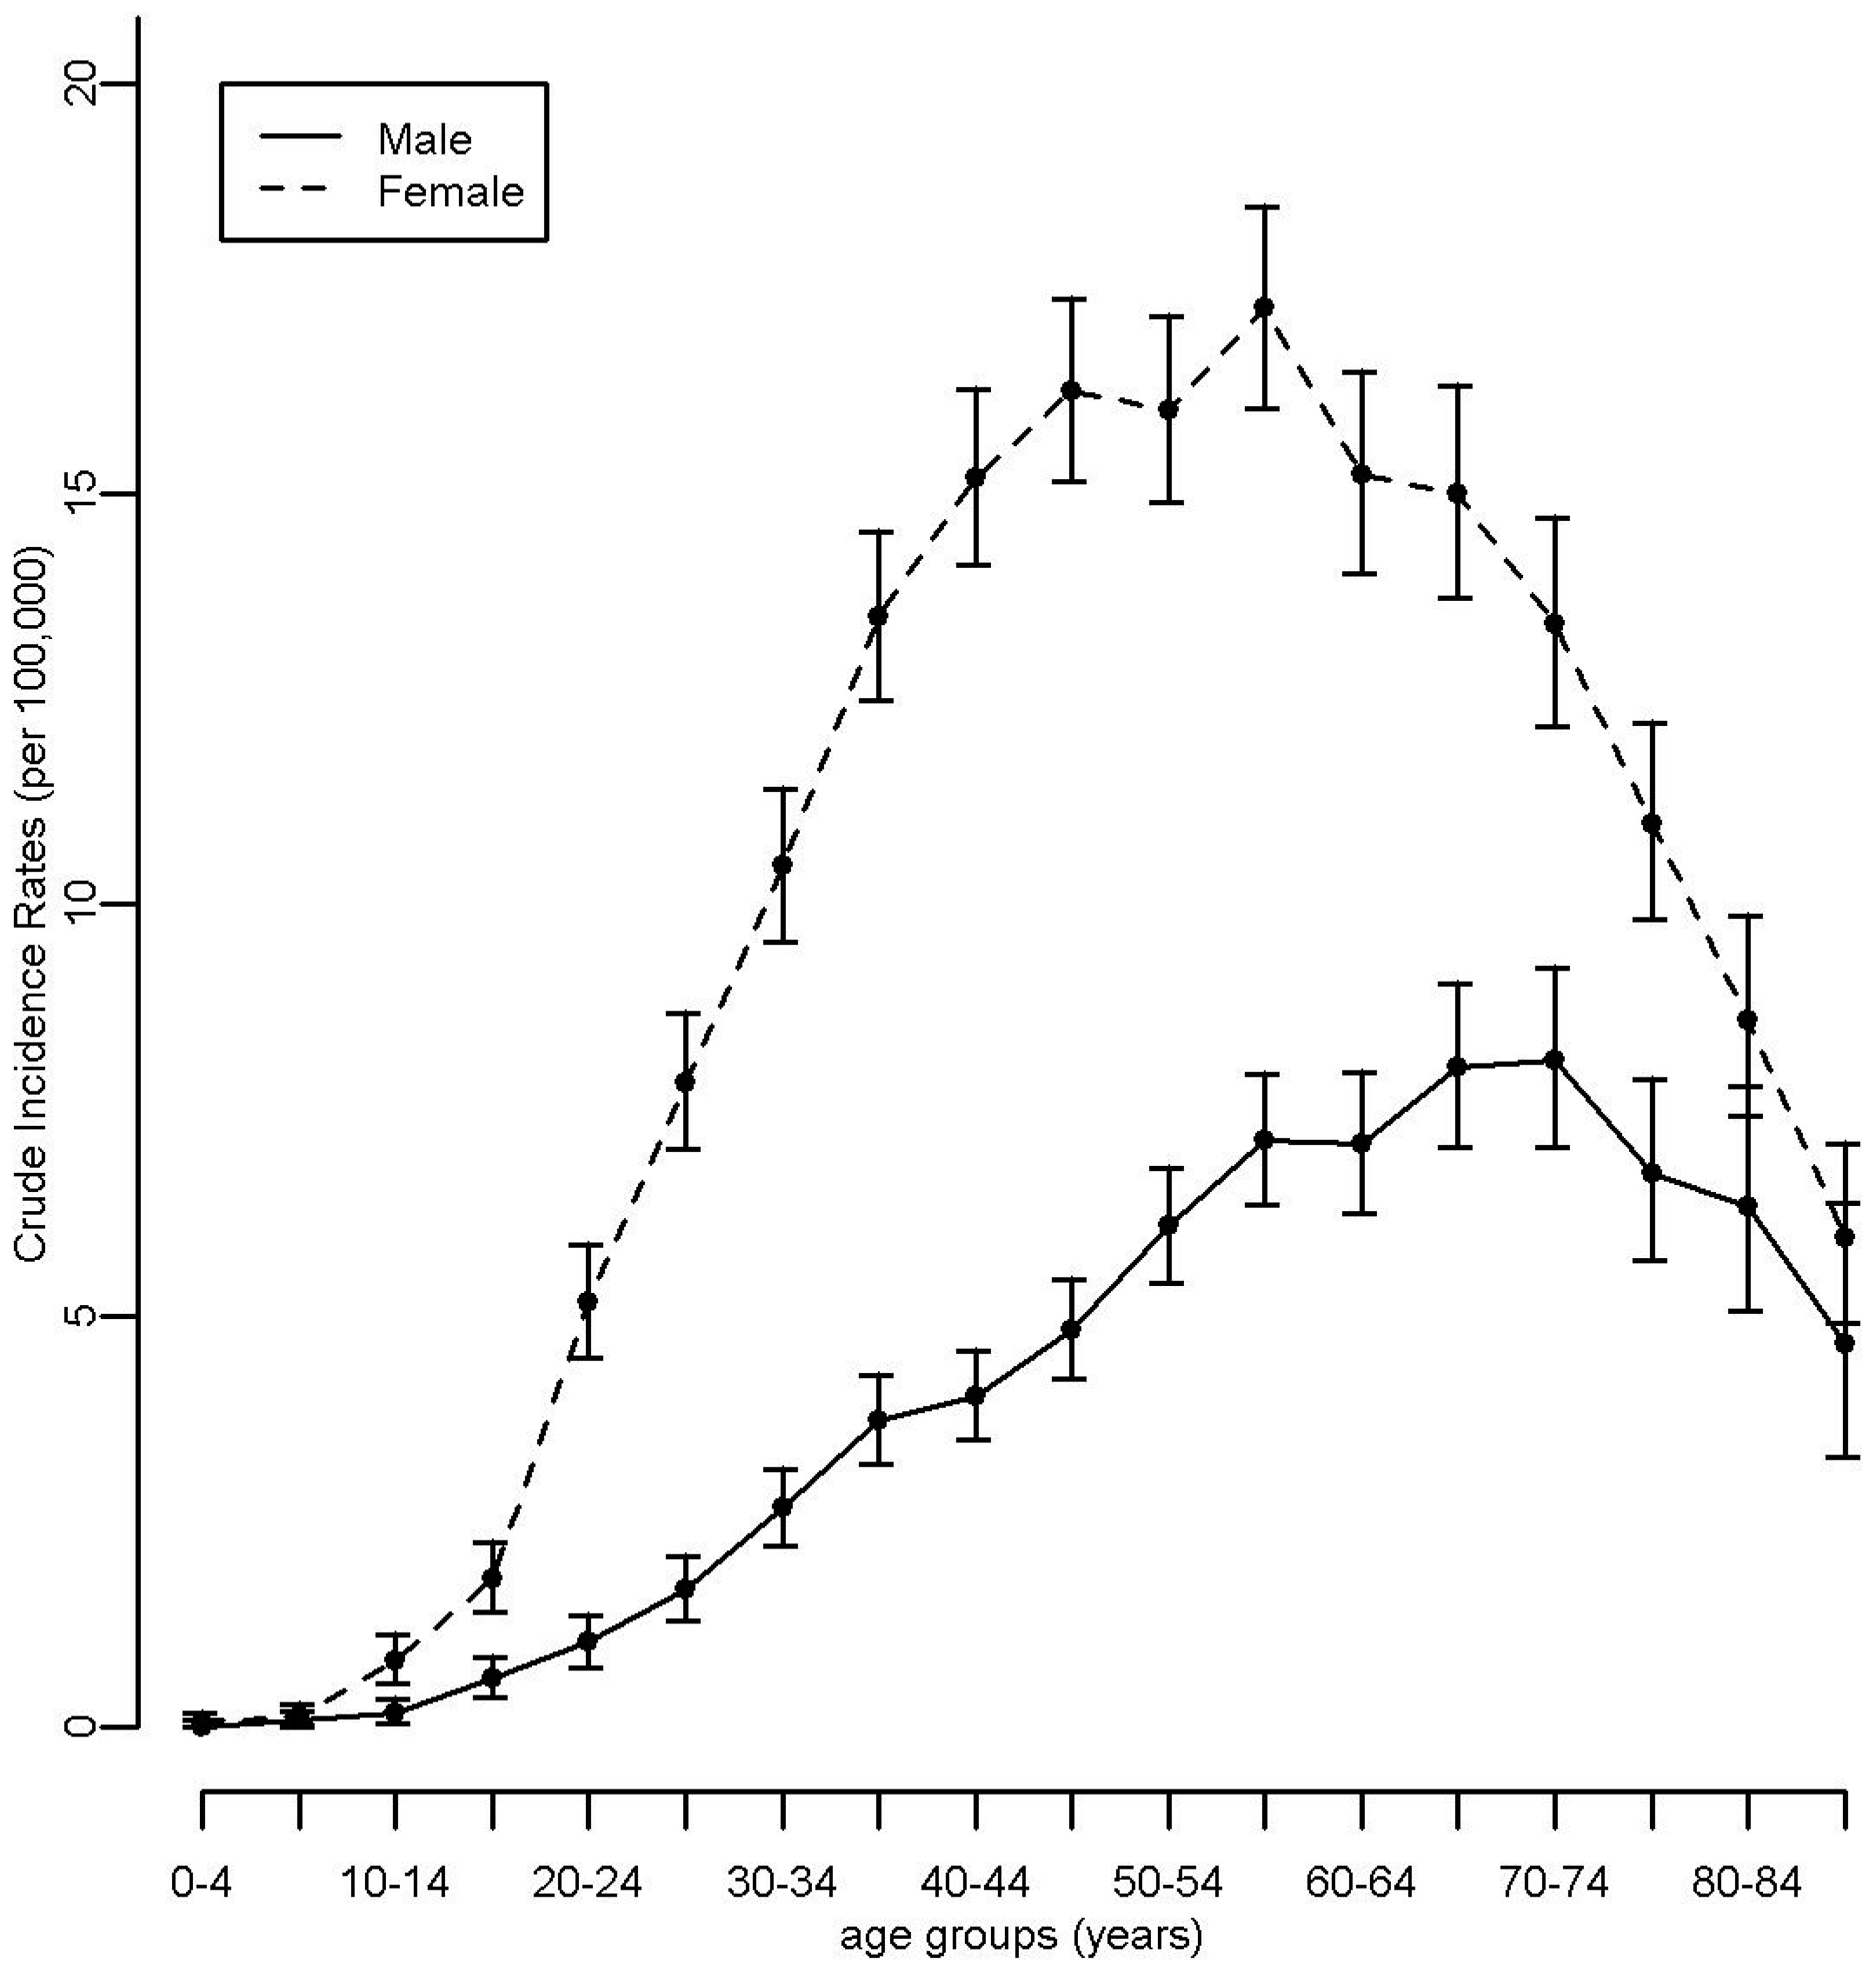
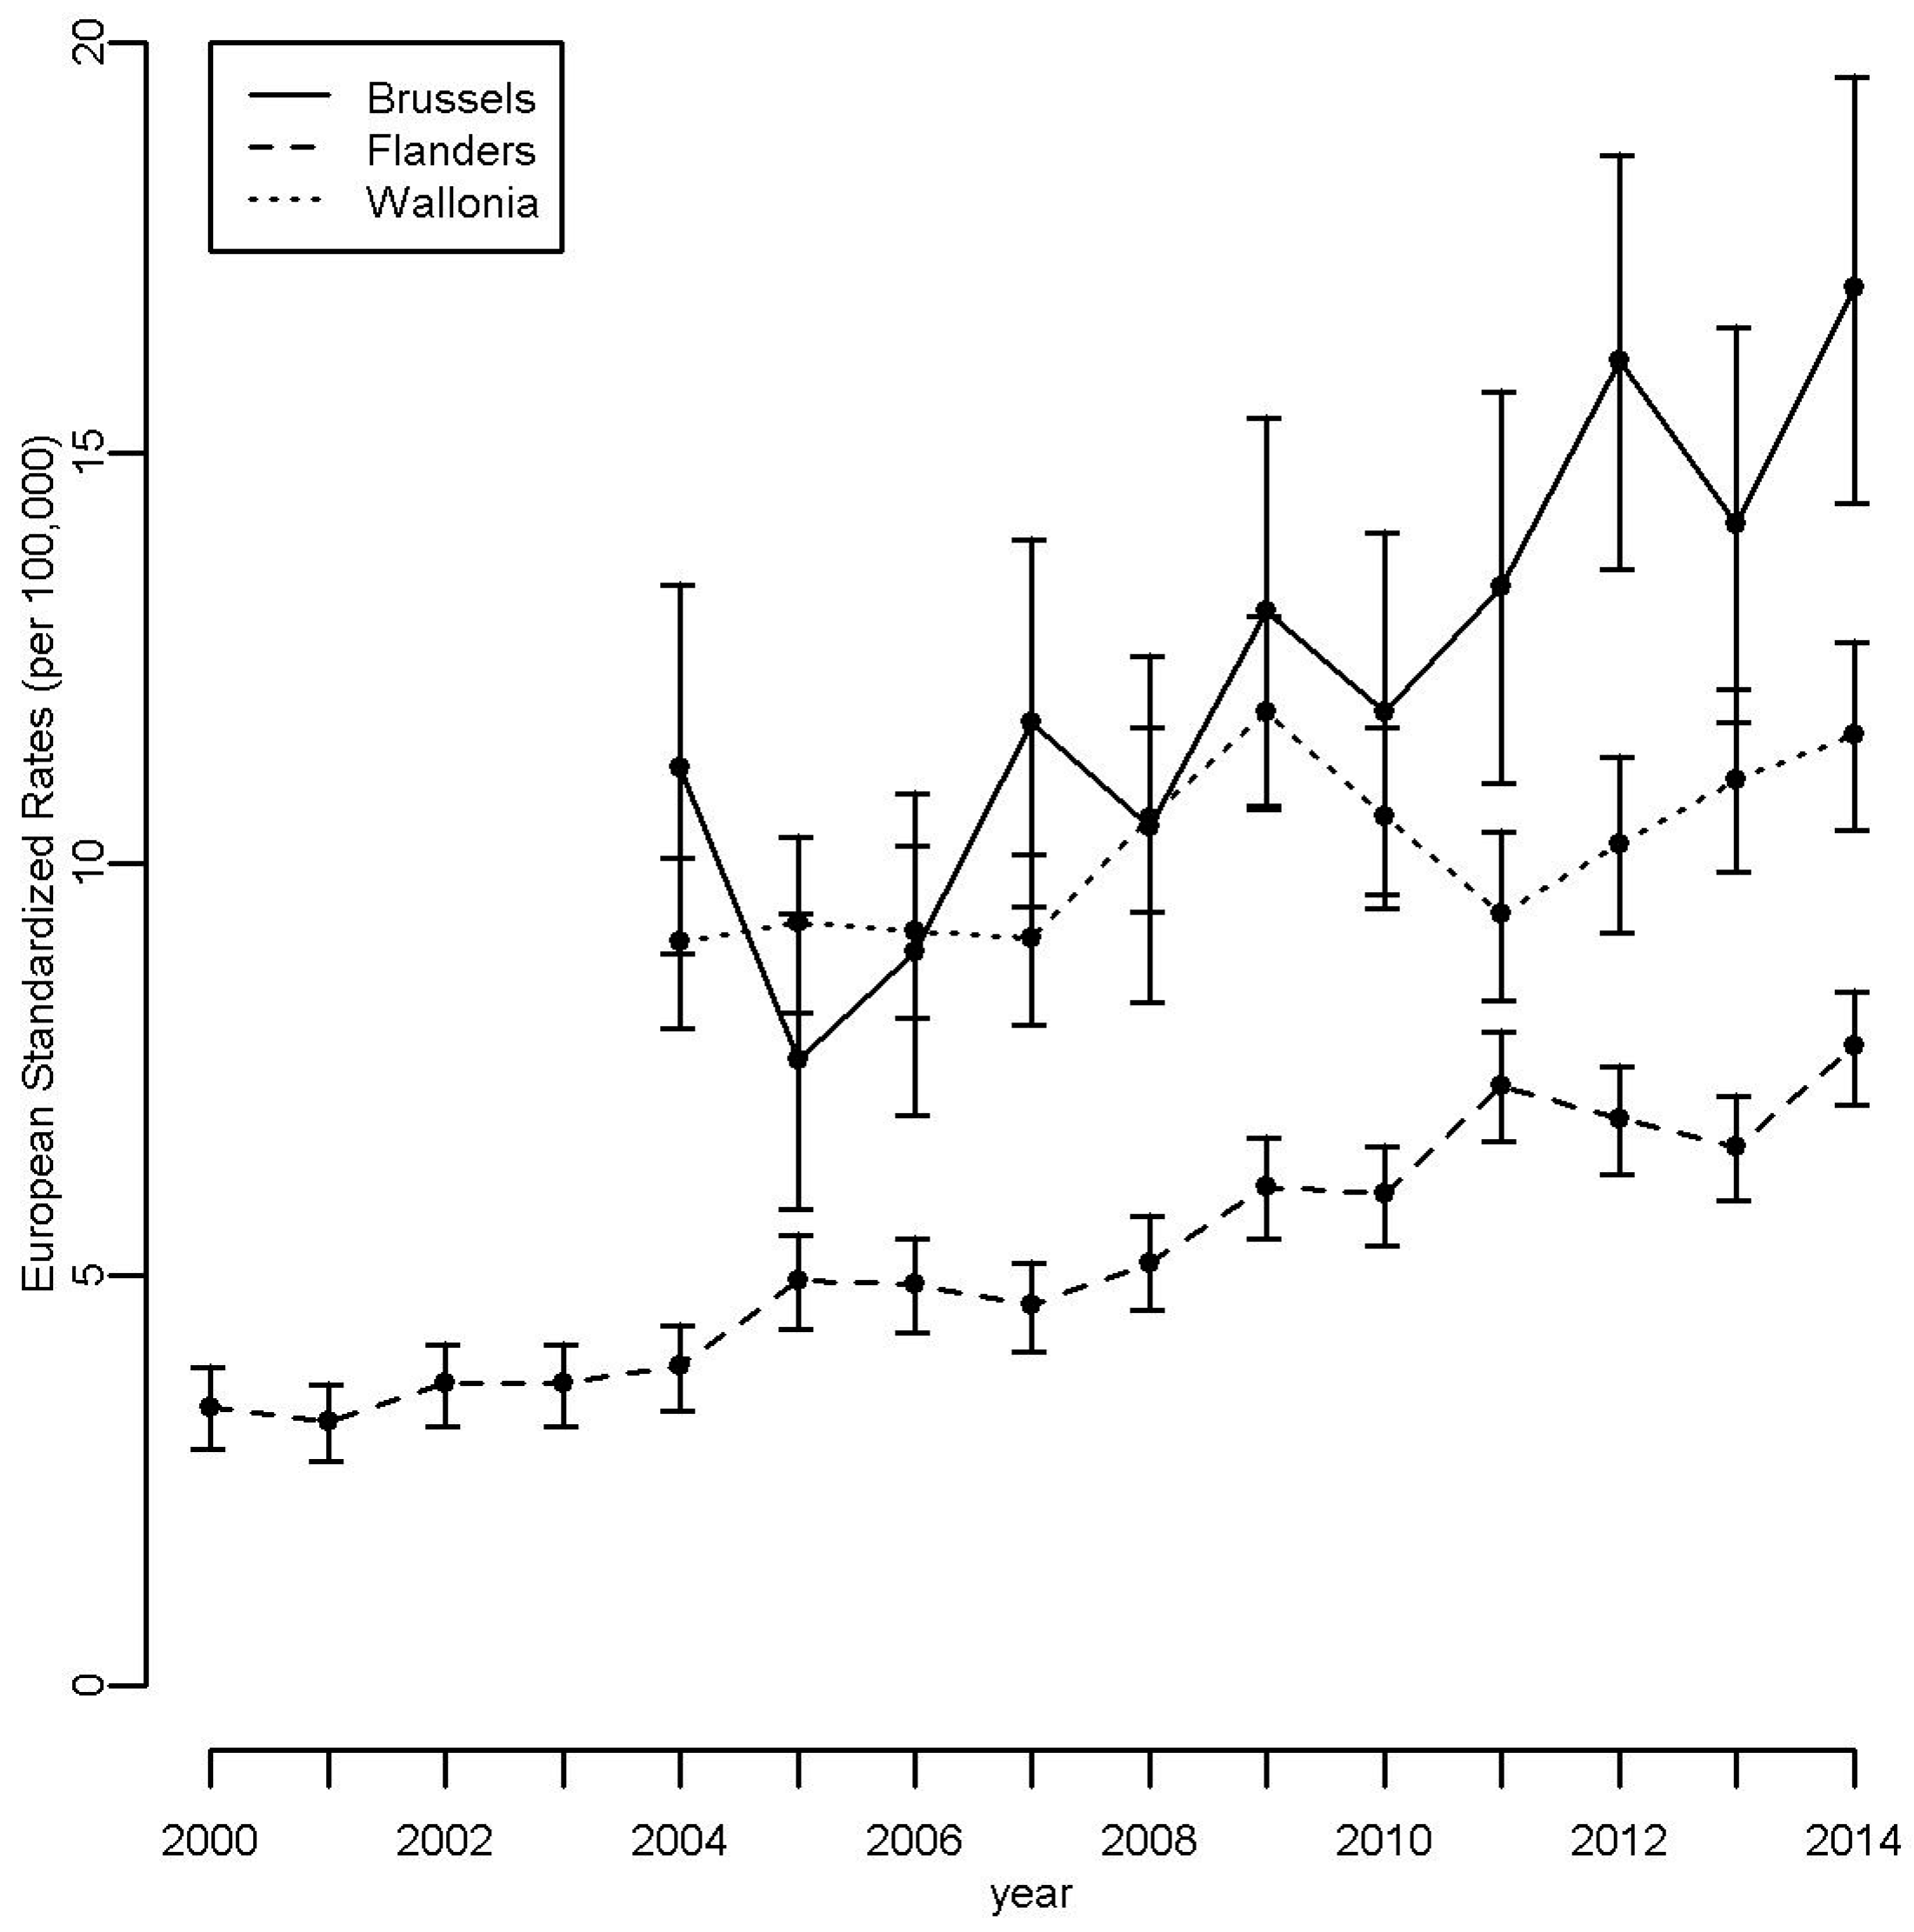
3.1. Descriptive Analyses
3.2. Incidence of Tyroid Cancer around Nuclear Sites
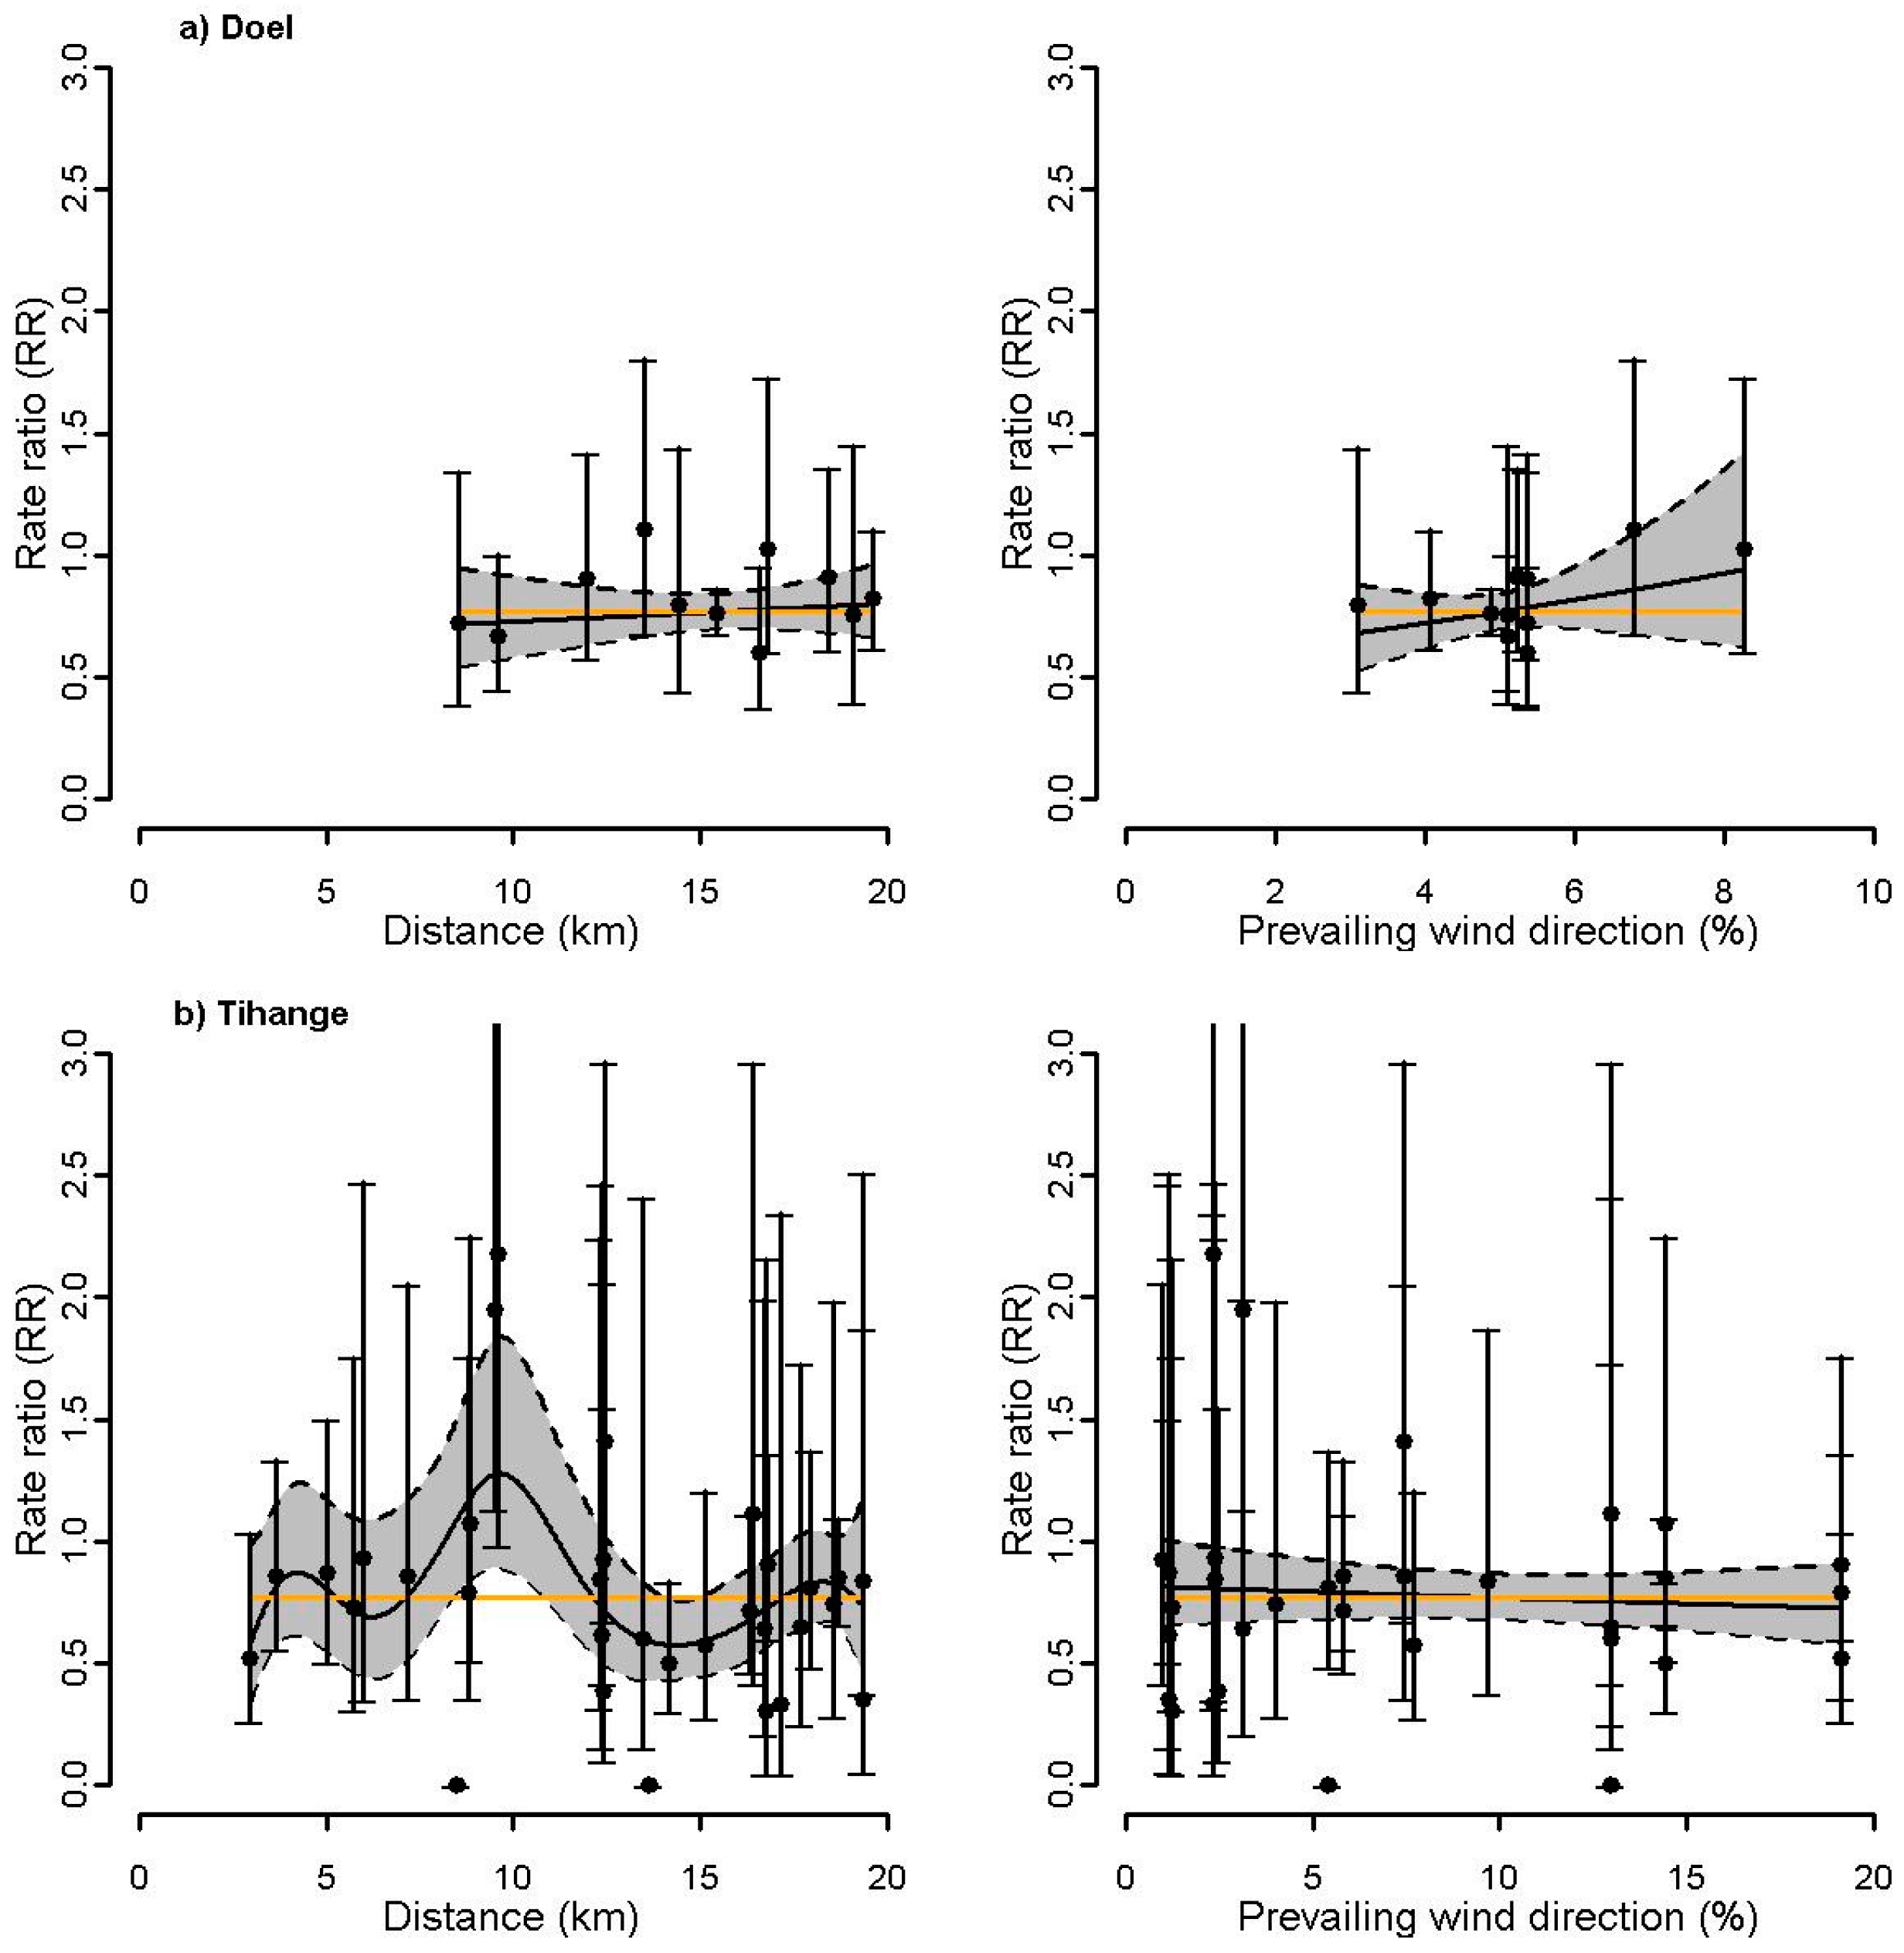
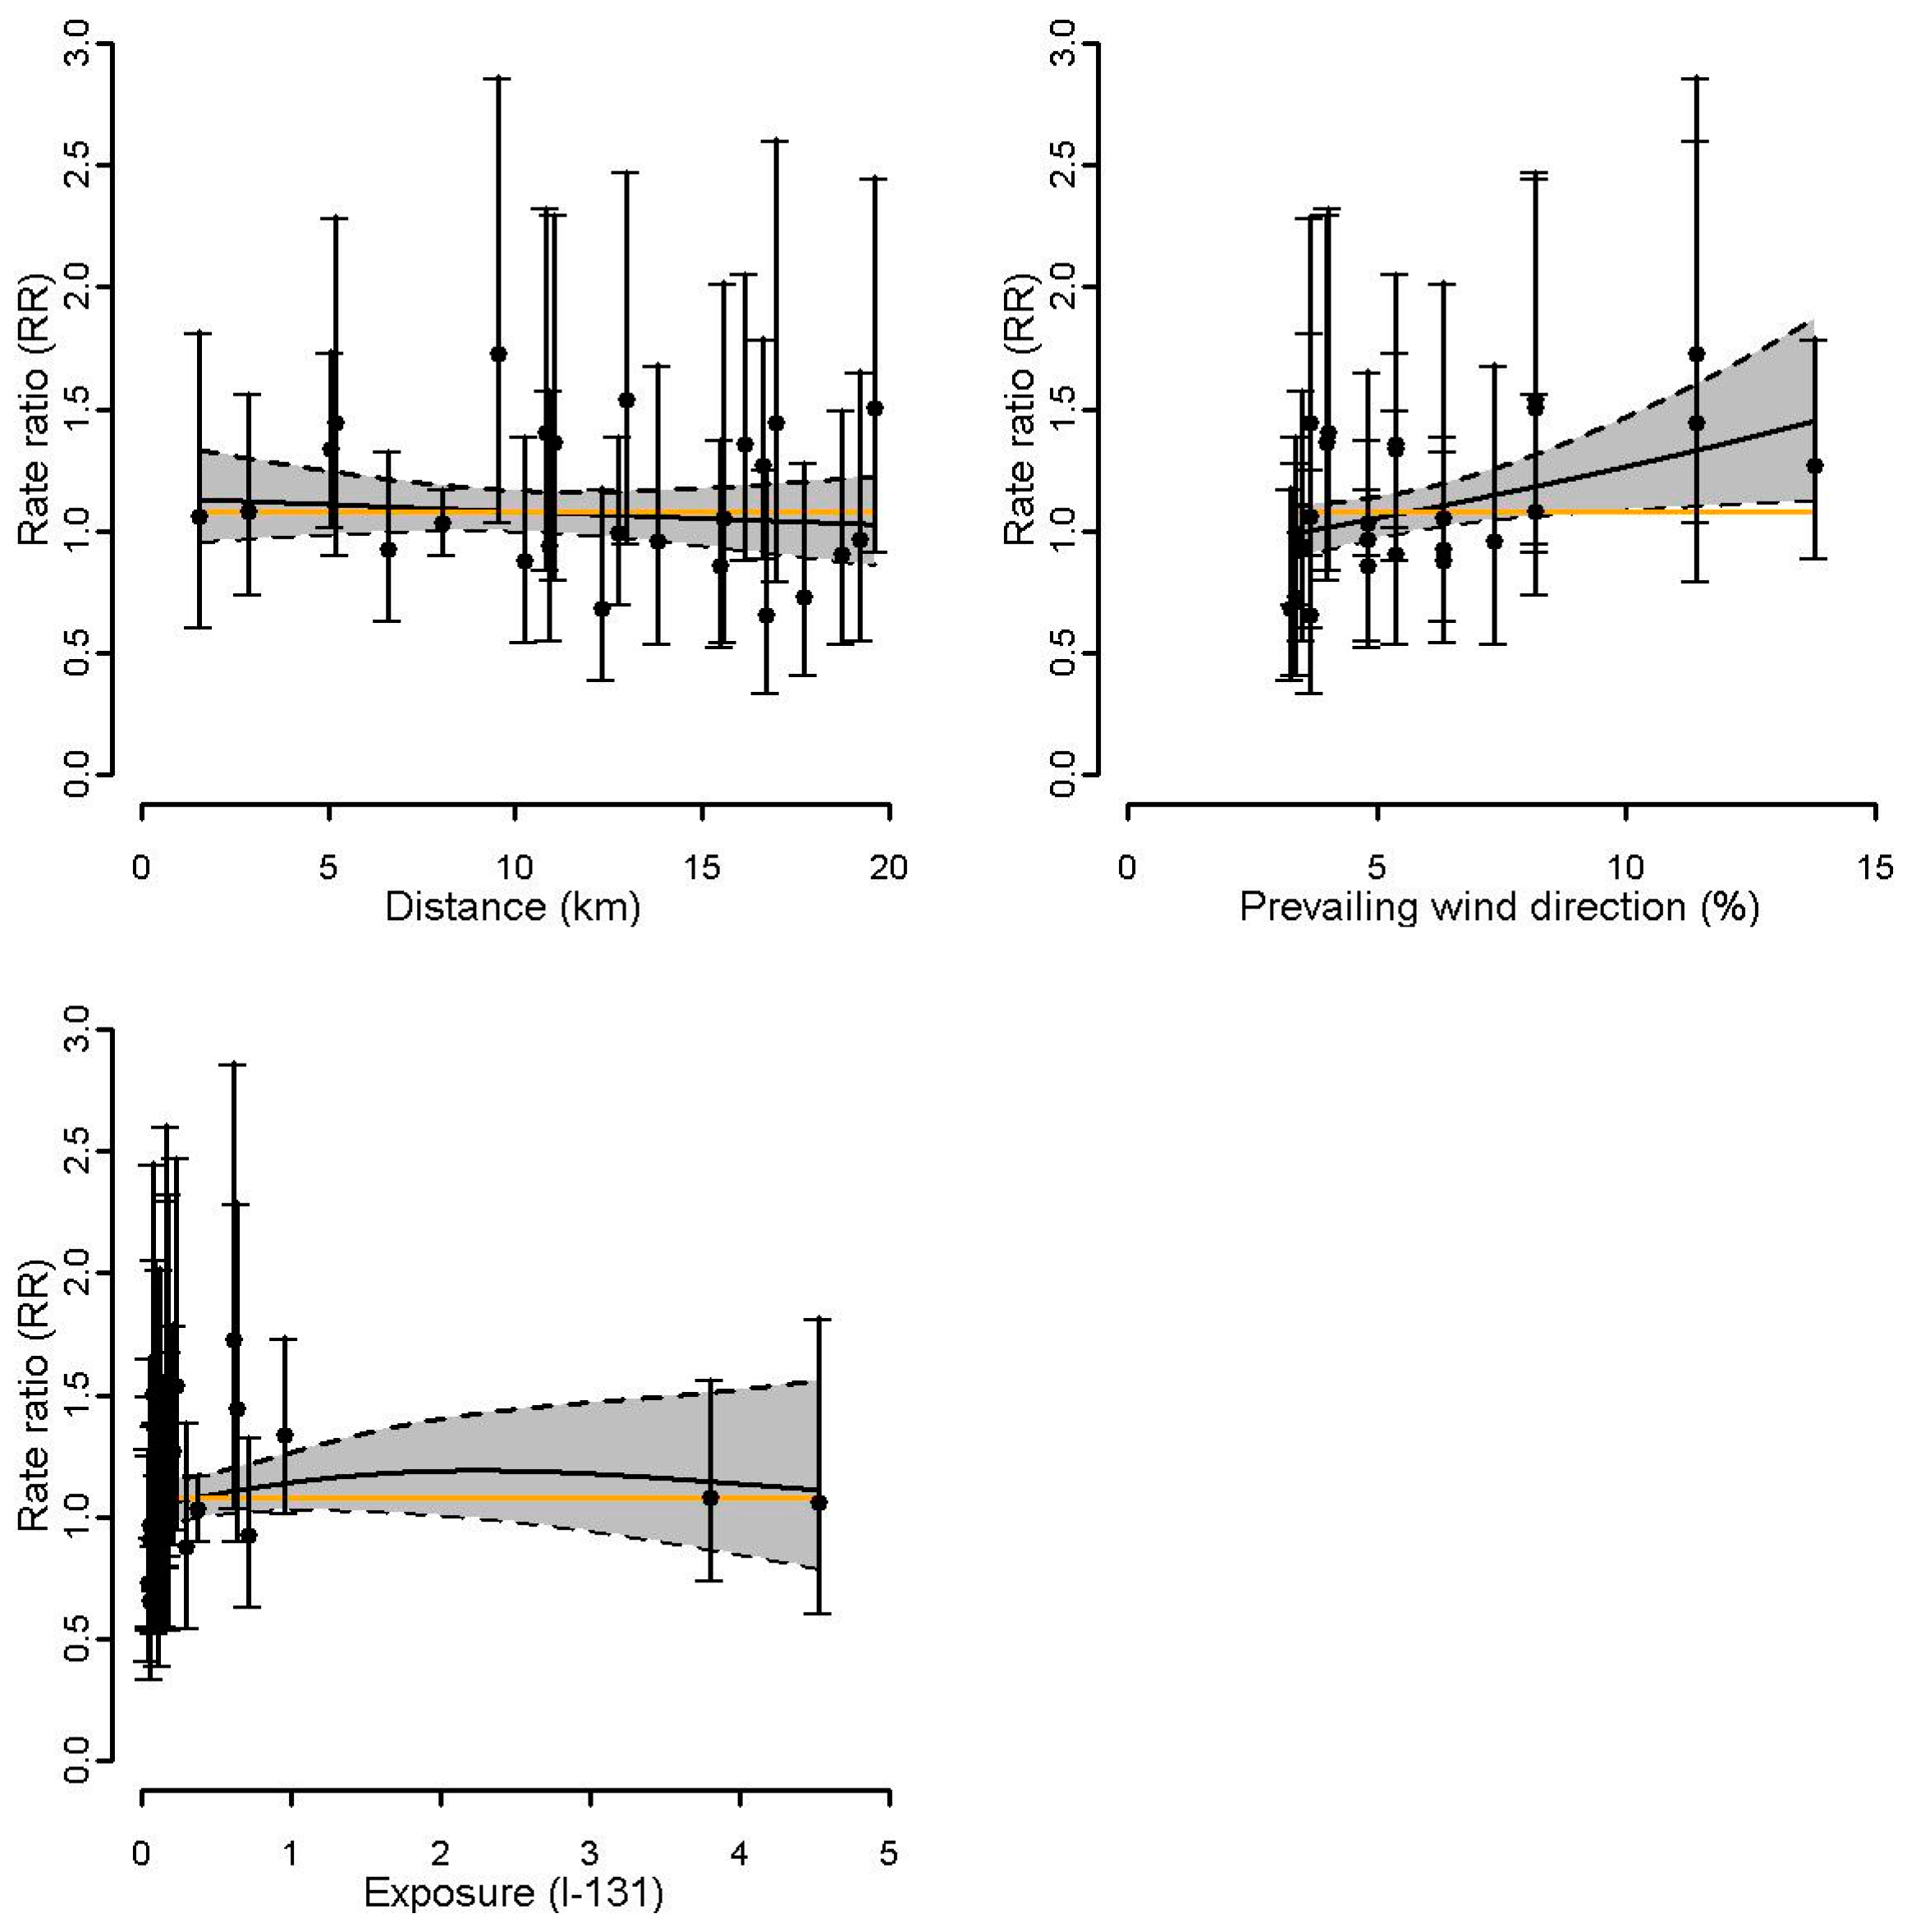
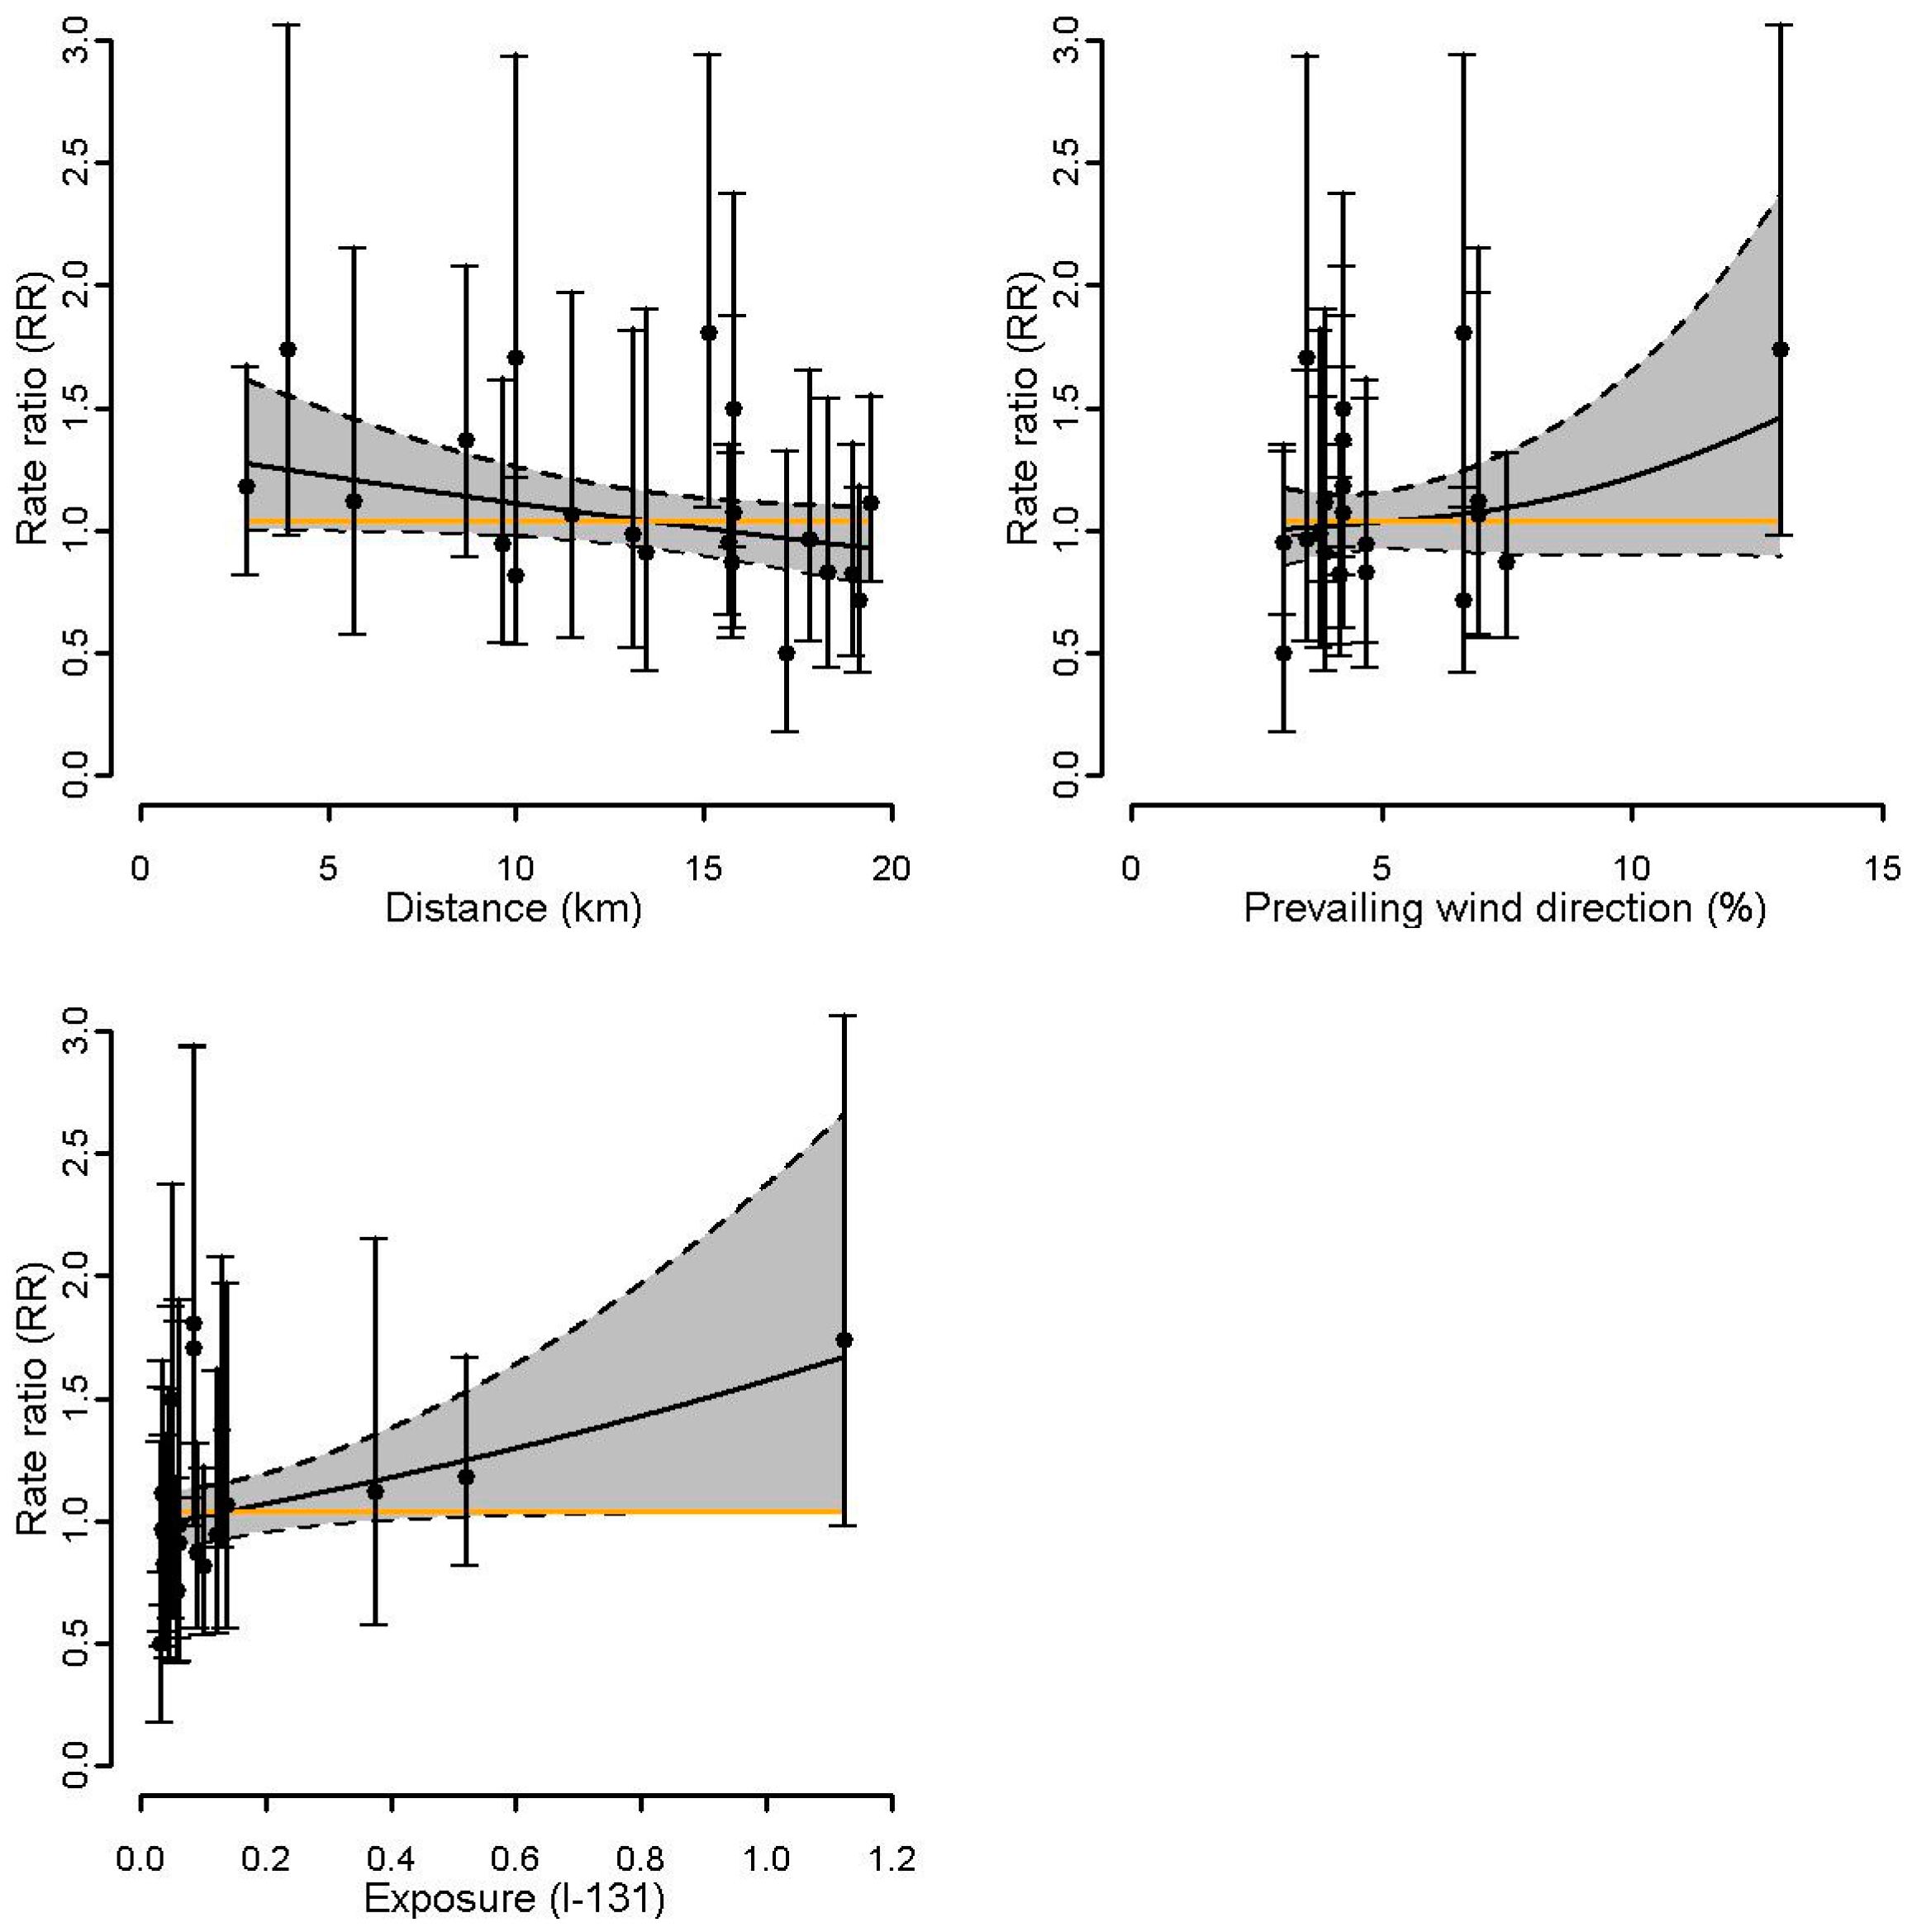
3.3. Association between Surrogate Exposures and Incidence of Thyroid Cancer around Nuclear Sites
4. Discussion
5. Conclusions
Supplementary Materials
Acknowledgments
Author Contributions
Conflicts of Interest
References
- Bollaerts, K.; Sonck, M.; Simons, K.; Fierens, S.; Poffijn, A.; Van Bladel, L.; Geraets, D.; Gosselin, P.; Van Oyen, H.; Francart, J.; et al. Thyroid cancer incidence around the Belgian nuclear sites: Surrogate exposure modelling. Cancer Epidemiol. 2015, 39, 48–54. [Google Scholar] [CrossRef] [PubMed]
- Bollaerts, K.; Fierens, S.; Van Bladel, L.; Simons, K.; Sonck, M.; Poffijn, A.; Geraets, D.; Gosselin, P.; Van Oyen, H.; Francart, J.; et al. Thyroid cancer incidence in the vicinity of nuclear sites in Belgium, 2000–2008. Thyroid 2014, 24, 906–917. [Google Scholar] [CrossRef] [PubMed]
- Sinnott, B.; Ron, E.; Schneider, A.B. Exposing the thyroid to radiation: A review of its current extent, risks, and implications. Endocr. Rev. 2010, 31, 756–773. [Google Scholar] [CrossRef] [PubMed]
- Cardis, E.; Hatch, M. The Chernobyl accident—An epidemiological perspective. Clin. Oncol. (R. Coll. Radiol.) 2011, 23, 251–260. [Google Scholar] [CrossRef] [PubMed]
- United Nations Scientific Committee on the Effects of Atomic Radiation (UNSCEAR). Sources, Effects and Risks of Ionizing Radiation, UNSCEAR 2012 Report: Report to the General Assembly, with Scientific Annexes; United Nation: New York, NY, USA, 2012. [Google Scholar]
- Furukawa, K.; Preston, D.; Funamoto, S.; Yonehara, S.; Ito, M.; Tokuoka, S.; Sugiyama, H.; Soda, M.; Ozasa, K.; Mabuchi, K. Long-term trend of thyroid cancer risk among Japanese atomic-bomb survivors: 60 years after exposure. Int. J. Cancer 2013, 132, 1222–1226. [Google Scholar] [CrossRef] [PubMed]
- Davis, S.; Kopecky, K.J.; Hamilton, T.E.; Onstad, L.; Hanford Thyroid Disease Study Team. Thyroid neoplasia, autoimmune thyroiditis, and hypothyroidism in persons exposed to Iodine 131 from the Hanford nuclear site. JAMA 2004, 292, 2600–2613. [Google Scholar] [CrossRef] [PubMed]
- Belgian Federal Government. Royal Decree of 20 July 2001 Laying down the General Regulation for the Protection of the Public, Workers and the Environment against the Hazards of Ionizing Radiation, 2001/00726. Available online: http://www.ejustice.just.fgov.be/cgi (accessed on 3 August 2017).
- Wing, S.; Richardson, D.B.; Hoffmann, W. Cancer risks near nuclear facilities: The importance of research design and explicit study hypotheses. Environ. Health Perspect. 2011, 119, 417–421. [Google Scholar] [CrossRef] [PubMed]
- Lawrence Livermore National Laboratory; National Atmospheric Release Advisory Center, USA. Hotspot—Health Physics Codes for PC. Available online: https://narac.llnl.gov/hotspot (accessed on 14 August 2017).
- McCullagh, P.; Nelder, J. Generalized Linear Models, 2nd ed.; Chapman and Hall: London, UK, 1989. [Google Scholar]
- Bithell, J.F. The choice of test for detecting raised disease risk near a point source. Stat. Med. 1995, 14, 2309–2322. [Google Scholar] [CrossRef] [PubMed]
- Wood, S. Generalized Additive Models: An Introduction with R; Chapman and Hall/CRC: London, UK, 2006. [Google Scholar]
- Eilers, P.H.C.; Marx, B.D. Flexible smoothing with B-splines and penalties. 1996, 11, 89–121. [Google Scholar] [CrossRef]
- R—A Language and Environment for Statistical Computing. R Foundation for Statistical Computing: Vienna, Austria. Available online: www.R-project.org (accessed on 14 August 2017).
- Wakefield, J. Ecologic studies revisited. Annu. Rev. Public Health 2008, 29, 75–90. [Google Scholar] [CrossRef] [PubMed]
- Kim, J.; Bang, Y.; Lee, W.J. Living near nuclear power plants and thyroid cancer risk: A systematic review and meta-analysis. Environ. Int. 2016, 87, 42–48. [Google Scholar] [CrossRef] [PubMed]
- National Research Council. Analysis of Cancer Risks in Populations near Nuclear Facilities: Phase I; National Academies Press: Washington, DC, USA, 2012. [Google Scholar]
- Hess, J.; Thomas, G.; Braselmann, H.; Bauer, V.; Bogdanova, T.; Wienberg, J.; Zitzelsberger, H.; Unger, K. Gain of chromosome band 7q11 in papillary thyroid carcinomas of young patients is associated with exposure to low-dose irradiation. Proc. Natl. Acad. Sci. USA 2011, 108, 9595–9600. [Google Scholar] [CrossRef] [PubMed]
- Kaiser, J.C.; Meckbach, R.; Eidemuller, M.; Selmansberger, M.; Unger, K.; Shpak, V.; Blettner, M.; Zitzelsberger, H.; Jacob, P. Integration of a radiation biomarker into modeling of thyroid carcinogenesis and post-Chernobyl risk assessment. Carcinogenesis 2016, 37, 1152–1160. [Google Scholar] [CrossRef] [PubMed]
- Selmansberger, M.; Feuchtinger, A.; Zurnadzhy, L.; Michna, A.; Kaiser, J.C.; Abend, M.; Brenner, A.; Bogdanova, T.; Walch, A.; Unger, K.; et al. CLIP2 as radiation biomarker in papillary thyroid carcinoma. Oncogene 2015, 34, 3917–3925. [Google Scholar] [CrossRef] [PubMed]
- Richardson, D.B.; Ashmore, J.P. Investigating time patterns of variation in radiation cancer associations. Occup. Environ. Med. 2005, 62, 551–558. [Google Scholar] [CrossRef] [PubMed]
- Sadetzki, S.; Chetrit, A.; Lubina, A.; Stovall, M.; Novikov, I. Risk of thyroid cancer after childhood exposure to ionizing radiation for tinea capitis. J. Clin. Endocrinol. Metab. 2006, 91, 4798–4804. [Google Scholar] [CrossRef] [PubMed]
- Ron, E.; Lubin, J.H.; Shore, R.E.; Mabuchi, K.; Modan, B.; Pottern, L.M.; Schneider, A.B.; Tucker, M.A.; Boice, J.D., Jr. Thyroid cancer after exposure to external radiation: A pooled analysis of seven studies. Radiat. Res. 1995, 141, 259–277. [Google Scholar] [CrossRef] [PubMed]


| RR a | |||||
|---|---|---|---|---|---|
| Nuclear Site | PY | O | E | Est. | 95% CI |
| Doel b (2000–2014) | |||||
| 0–5 km | - | - | - | - | - |
| 0–10 km | 953,438 | 34 | 49.02 | 0.68 | (0.49, 0.95) |
| 0–15 km | 1,891,550 | 80 | 98.10 | 0.81 | (0.65, 1.00) |
| 0–20 km | 11,582,195 | 462 | 590.88 | 0.77 | (0.70, 0.84) |
| Tihange c (2004–2014) | |||||
| 0–5 km | 375,054 | 28 | 38.57 | 0.72 | (0.50, 1.03) |
| 0–10 km | 951,538 | 87 | 98.26 | 0.88 | (0.72, 1.08) |
| 0–15 km | 1,546,391 | 125 | 160.05 | 0.77 | (0.65, 0.92) |
| 0–20 km | 3,368,078 | 274 | 350.06 | 0.77 | (0.68, 0.87) |
| Mol-Dessel b (2000–2014) | |||||
| 0–5 km | 632,633 | 43 | 32.95 | 1.30 | (0.97, 1.74) |
| 0–10 km | 2,045,060 | 123 | 105.79 | 1.15 | (0.97, 1.37) |
| 0–15 km | 2,569,901 | 150 | 132.68 | 1.12 | (0.96, 1.31) |
| 0–20 km | 6,285,927 | 340 | 323.53 | 1.04 | (0.94, 1.16) |
| Fleurus c (2004–2014) | |||||
| 0–5 km | 368,755 | 41 | 38.26 | 1.07 | (0.80, 1.44) |
| 0–10 km | 3,493,371 | 392 | 359.07 | 1.10 | (0.99, 1.21) |
| 0–15 km | 4,767,612 | 529 | 492.32 | 1.08 | (0.99, 1.18) |
| 0–20 km | 6,204,514 | 685 | 640.77 | 1.08 | (1.00, 1.17) |
| All sites | |||||
| 0–5 km | 1,376,442 | 112 | 109.77 | 1.02 | (0.86, 1.22) |
| 0–10 km | 7,443,407 | 636 | 612.14 | 1.05 | (0.97, 1.13) |
| 0–15 km | 10,775,454 | 884 | 883.15 | 1.01 | (0.95, 1.08) |
| 0–20 km | 27,440,714 | 1761 | 1905.23 | 0.91 | (0.87, 0.95) |
| Proximity a | Wind b | I-131 c | |||||||
|---|---|---|---|---|---|---|---|---|---|
| Stone | LRS | LRS Rank | Stone | LRS | LRS Rank | Stone | LRS | LRS Rank | |
| Doel | 0.81 | 0.68 | 0.65 | 0.31 | 0.19 | 0.26 | - | - | - |
| Tihange | 0.45 | 0.45 | 0.52 | 0.80 | 0.71 | 0.69 | - | - | - |
| Mol-Dessel | 0.10 | 0.04 | 0.05 | 0.11 | 0.19 | 0.18 | 0.06 | 0.03 | 0.08 |
| Fleurus | 0.35 | 0.25 | 0.24 | 0.01 | 0.01 | 0.01 | 0.10 | 0.08 | 0.03 |
| All | <0.01 | <0.01 | <0.001 | 0.51 | 0.45 | 0.38 | - | - | - |
© 2017 by the authors. Licensee MDPI, Basel, Switzerland. This article is an open access article distributed under the terms and conditions of the Creative Commons Attribution (CC BY) license (http://creativecommons.org/licenses/by/4.0/).
Share and Cite
Demoury, C.; De Smedt, T.; De Schutter, H.; Sonck, M.; Van Damme, N.; Bollaerts, K.; Molenberghs, G.; Van Bladel, L.; Van Nieuwenhuyse, A. Thyroid Cancer Incidence around the Belgian Nuclear Sites, 2000–2014. Int. J. Environ. Res. Public Health 2017, 14, 988. https://doi.org/10.3390/ijerph14090988
Demoury C, De Smedt T, De Schutter H, Sonck M, Van Damme N, Bollaerts K, Molenberghs G, Van Bladel L, Van Nieuwenhuyse A. Thyroid Cancer Incidence around the Belgian Nuclear Sites, 2000–2014. International Journal of Environmental Research and Public Health. 2017; 14(9):988. https://doi.org/10.3390/ijerph14090988
Chicago/Turabian StyleDemoury, Claire, Tom De Smedt, Harlinde De Schutter, Michel Sonck, Nancy Van Damme, Kaatje Bollaerts, Geert Molenberghs, Lodewijk Van Bladel, and An Van Nieuwenhuyse. 2017. "Thyroid Cancer Incidence around the Belgian Nuclear Sites, 2000–2014" International Journal of Environmental Research and Public Health 14, no. 9: 988. https://doi.org/10.3390/ijerph14090988