Response to Noise Emitted by Wind Farms in People Living in Nearby Areas

Abstract
:1. Introduction
- Analyze the relationships between the percentage of people being annoyed by the wind turbine noise and noise levels outside their dwellings or the distance from the nearest wind turbine,
- Explore objective (or situational) factors and subjective (or individual) factors affecting the perceived annoyance.
2. Material and Methods
2.1. Questionnaire Survey
2.2. Noise Exposure Evaluation
2.3. Data Analysis
3. Results
3.1. Study Population
3.2. Noise Exposure Evaluation
3.3. Questionnaire Survey
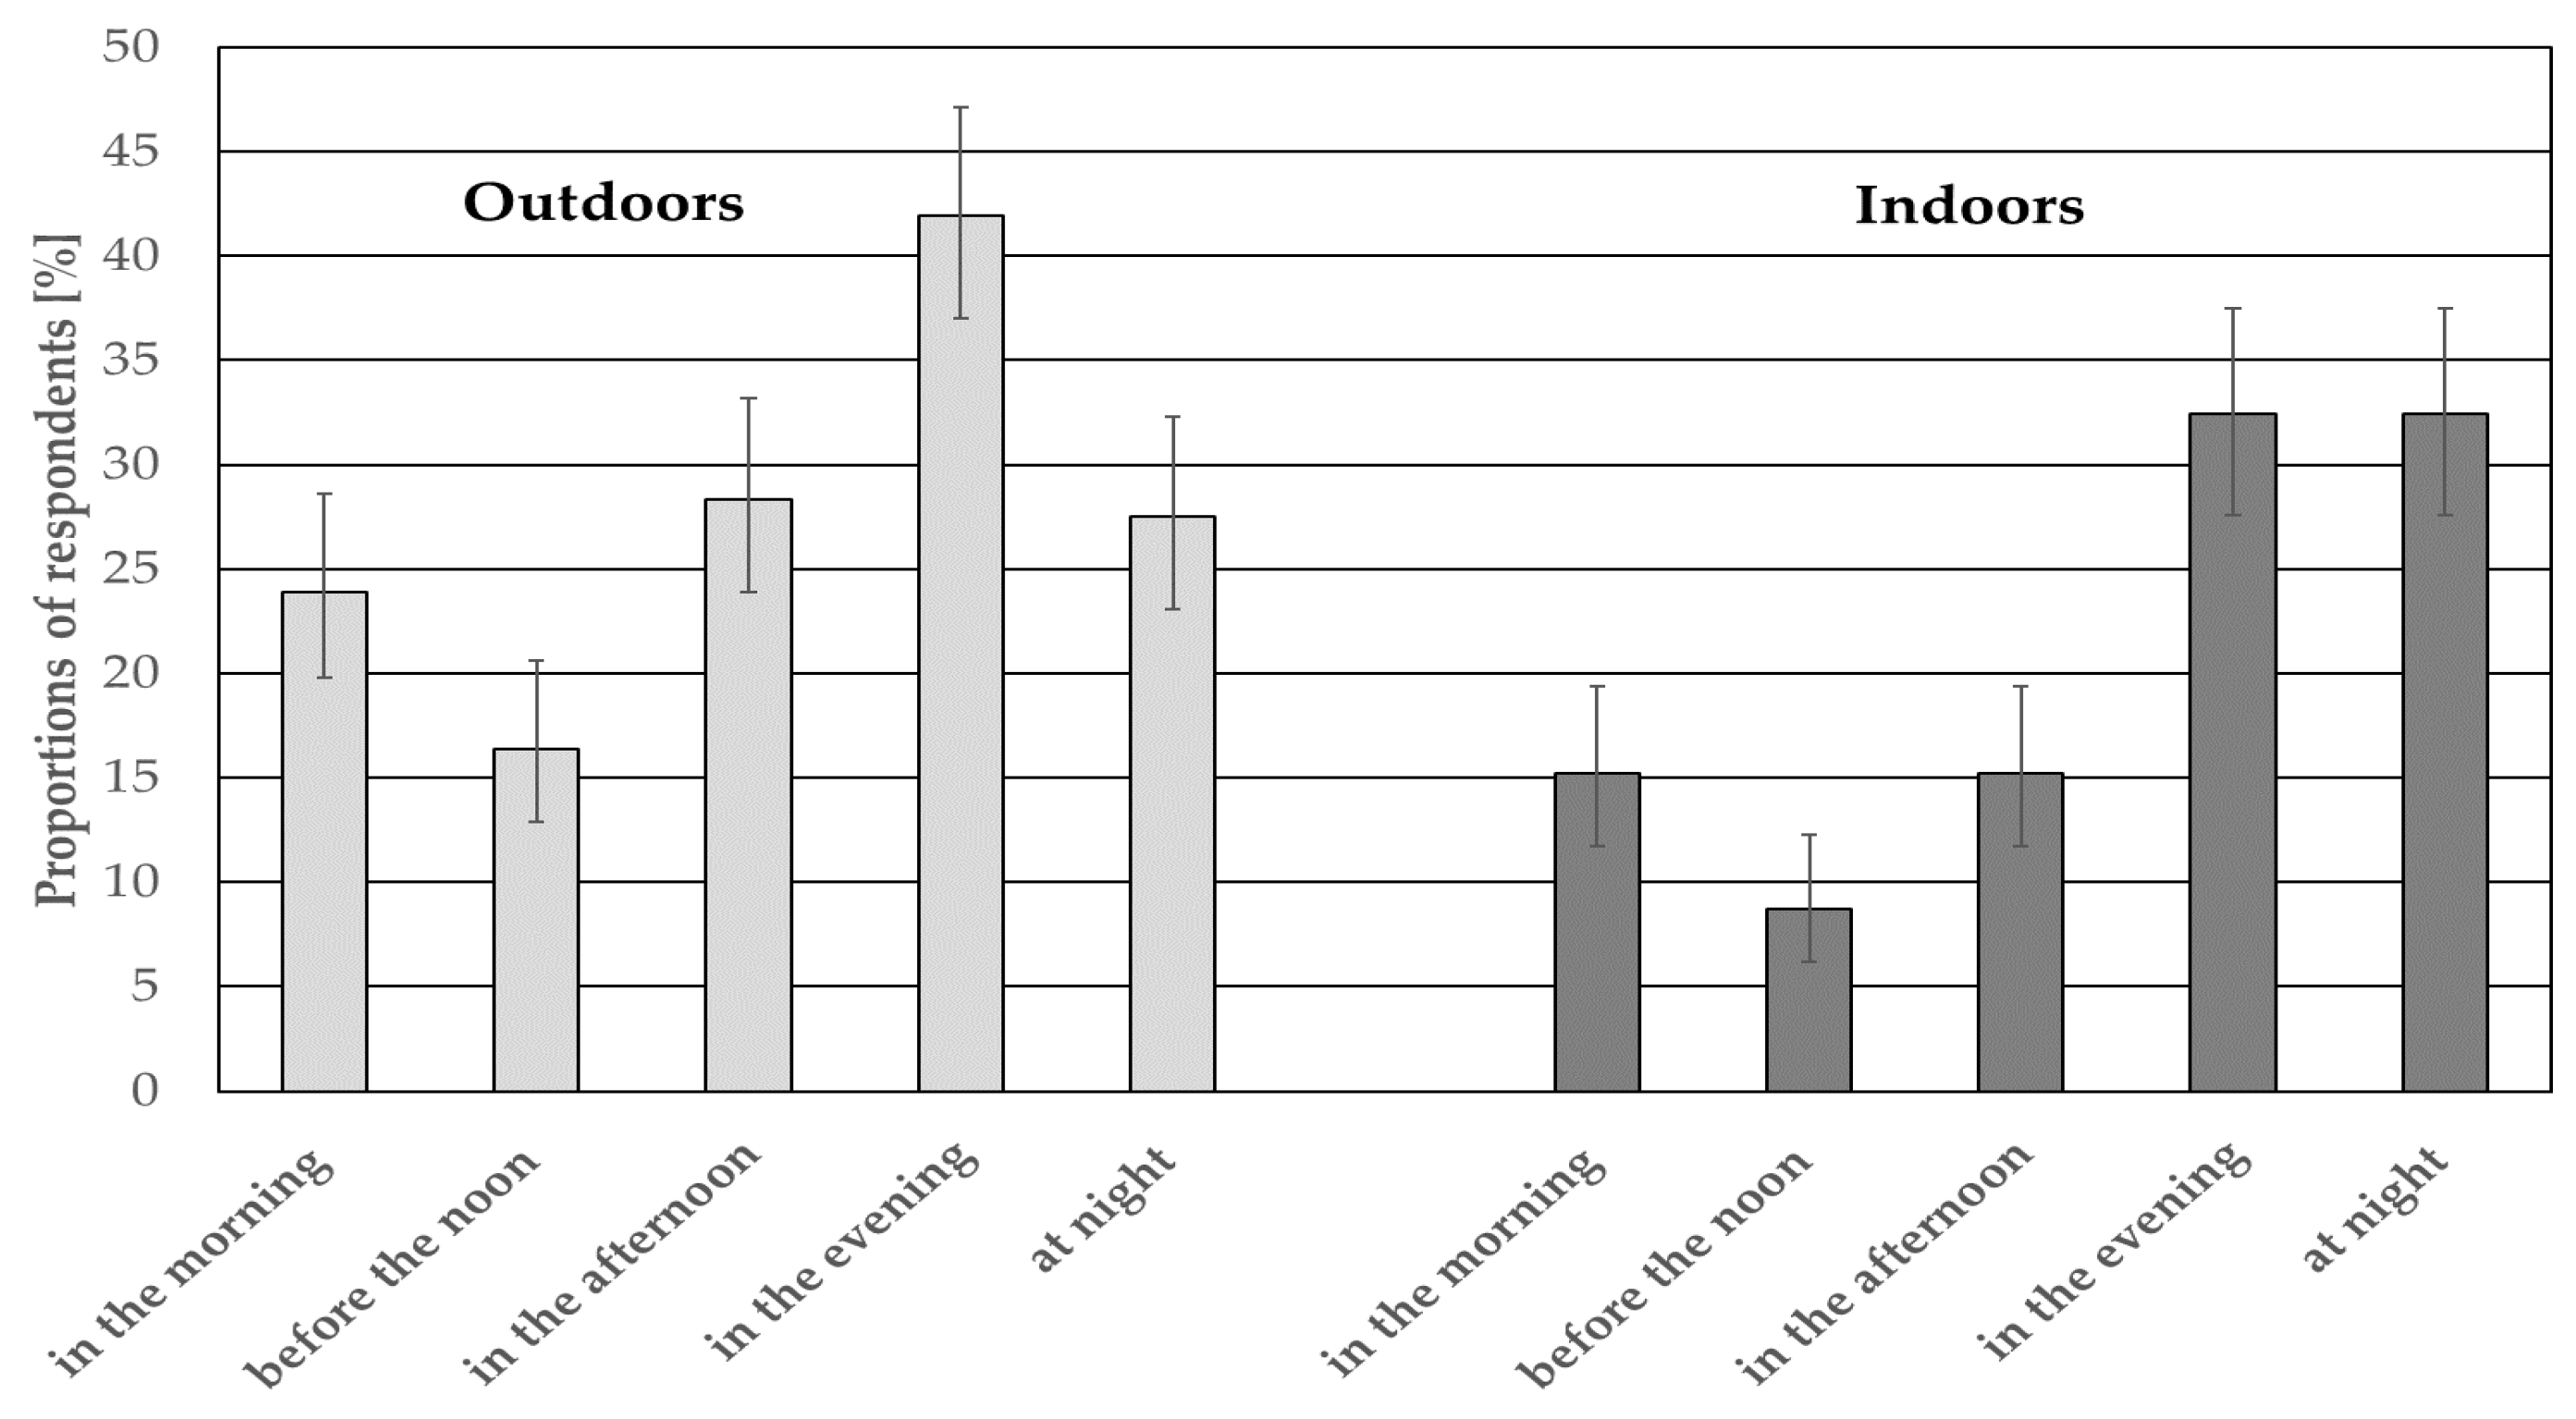
3.3.1. Main Results—Assessment of Environmental Conditions
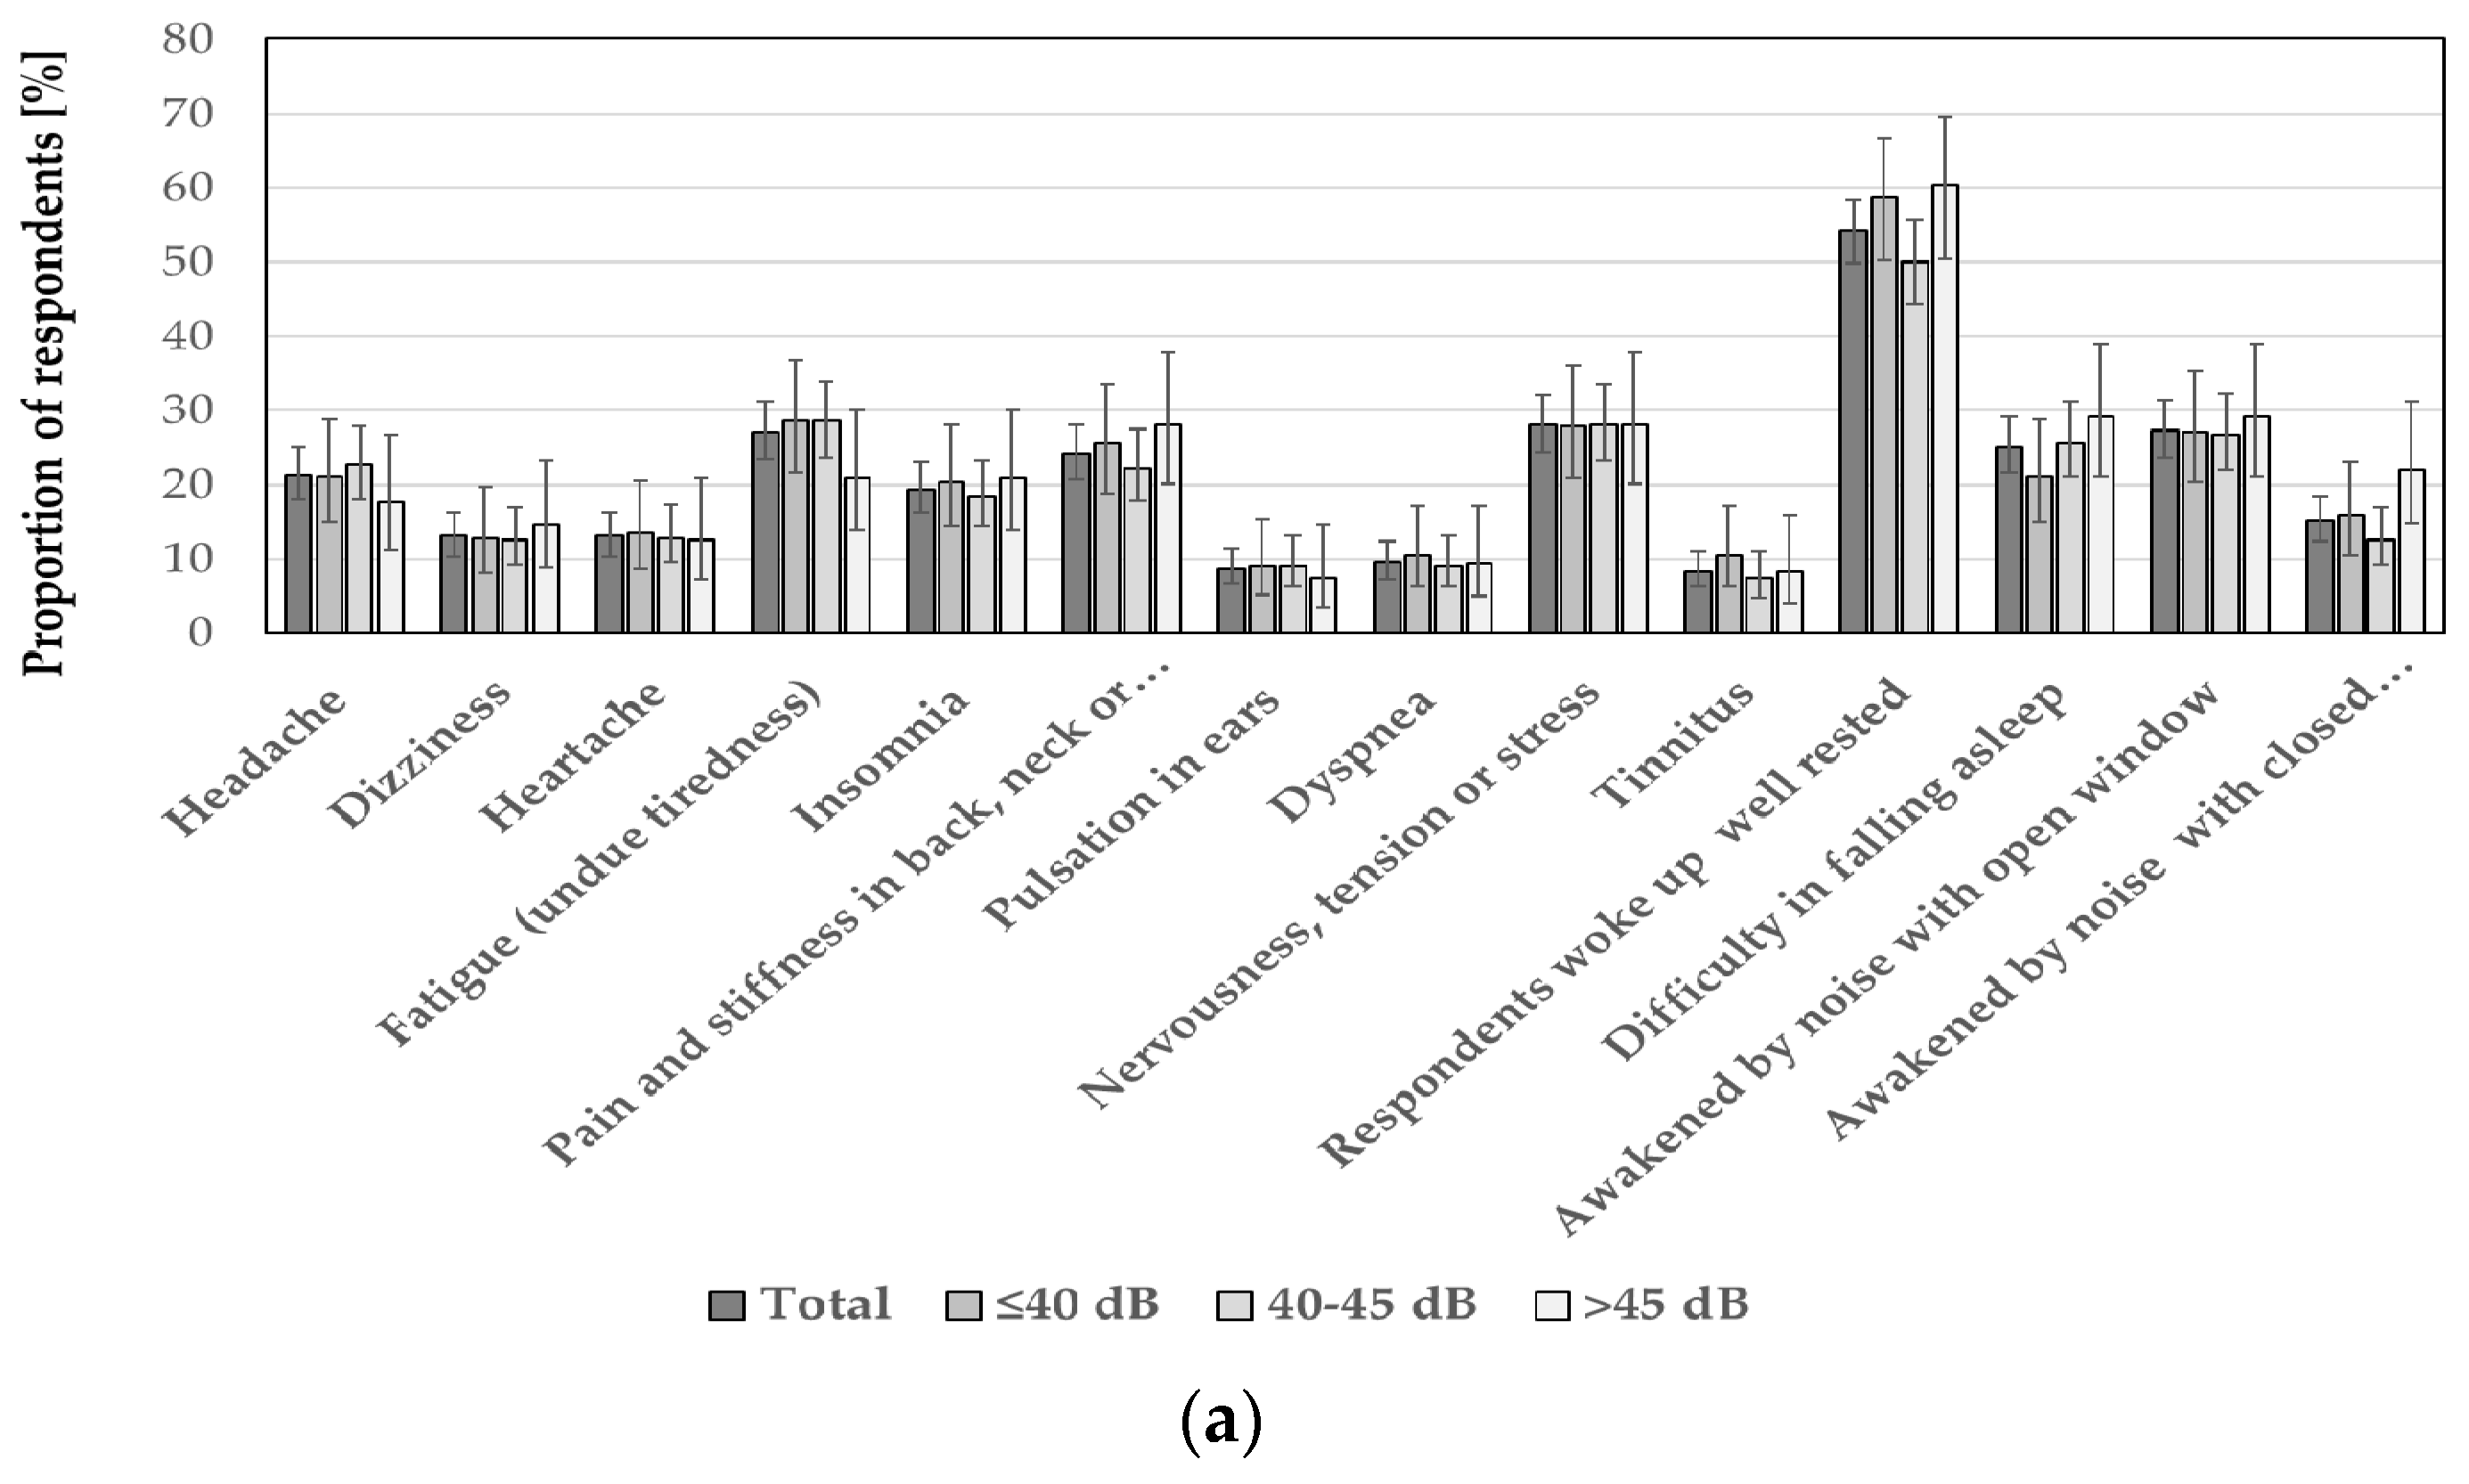
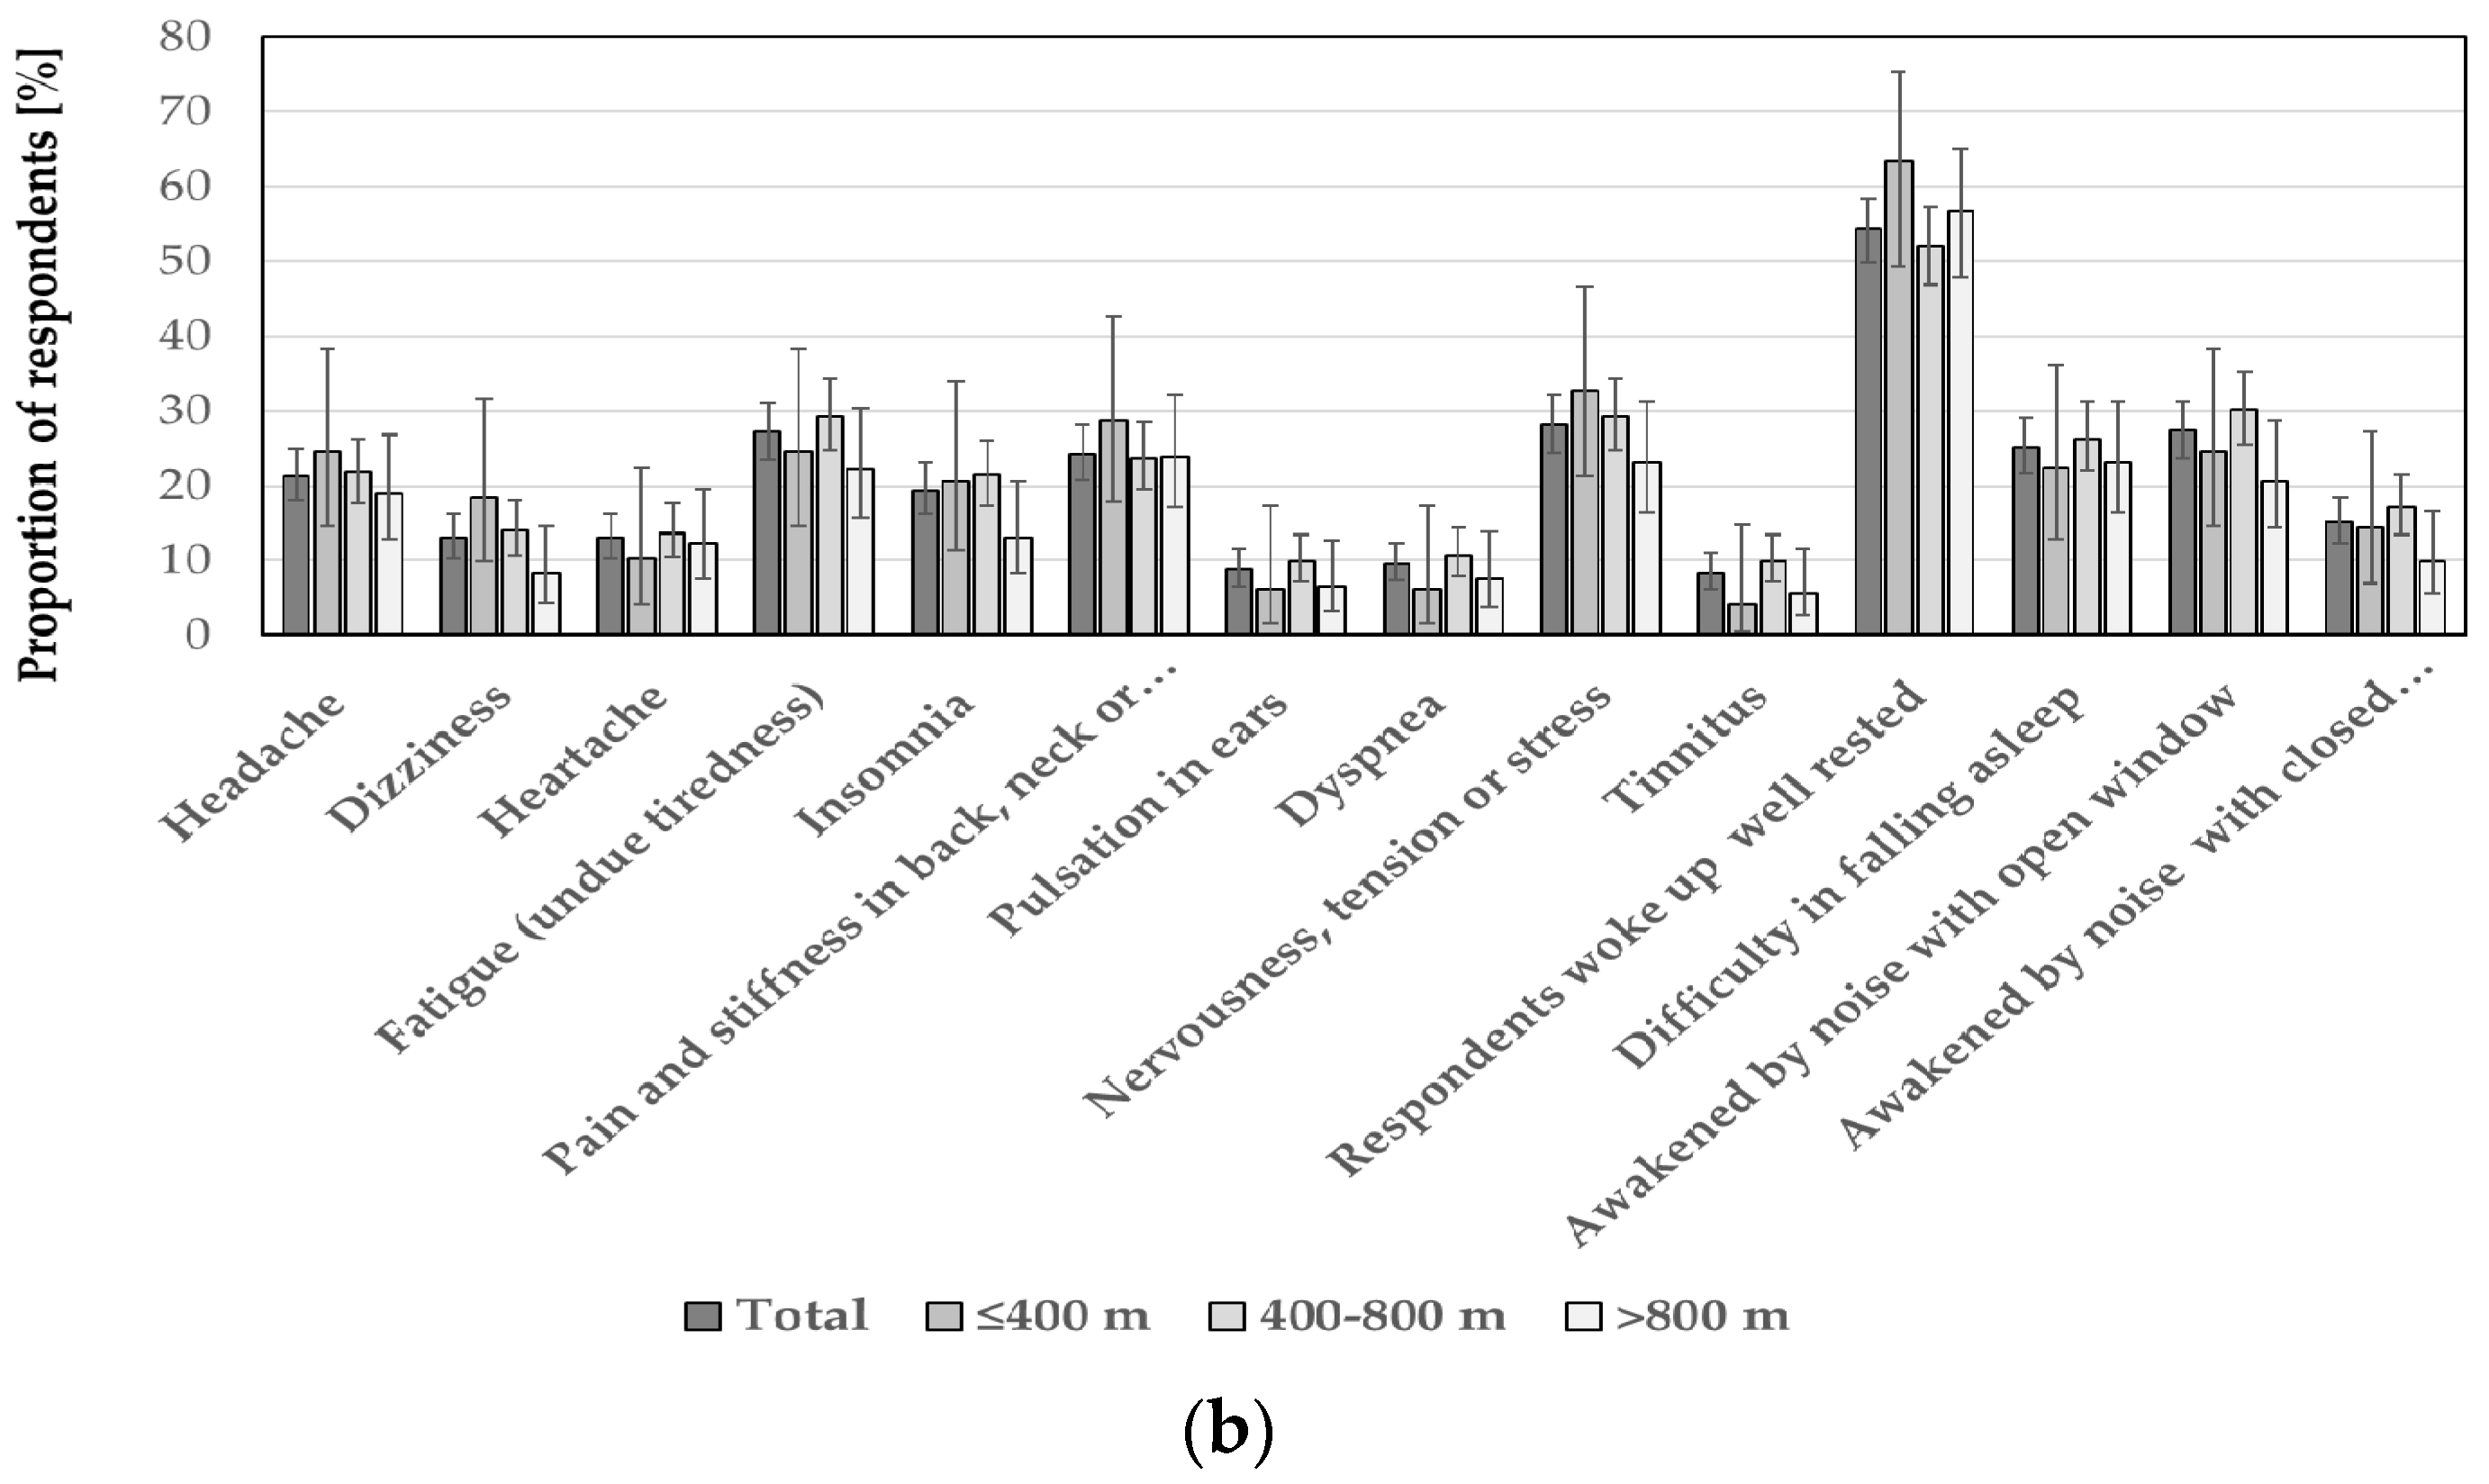
3.3.2. Self-Assessment of Physical Health and Well-Being
3.4. Factors Affecting Perception of Annoyance and Self-Reported Health
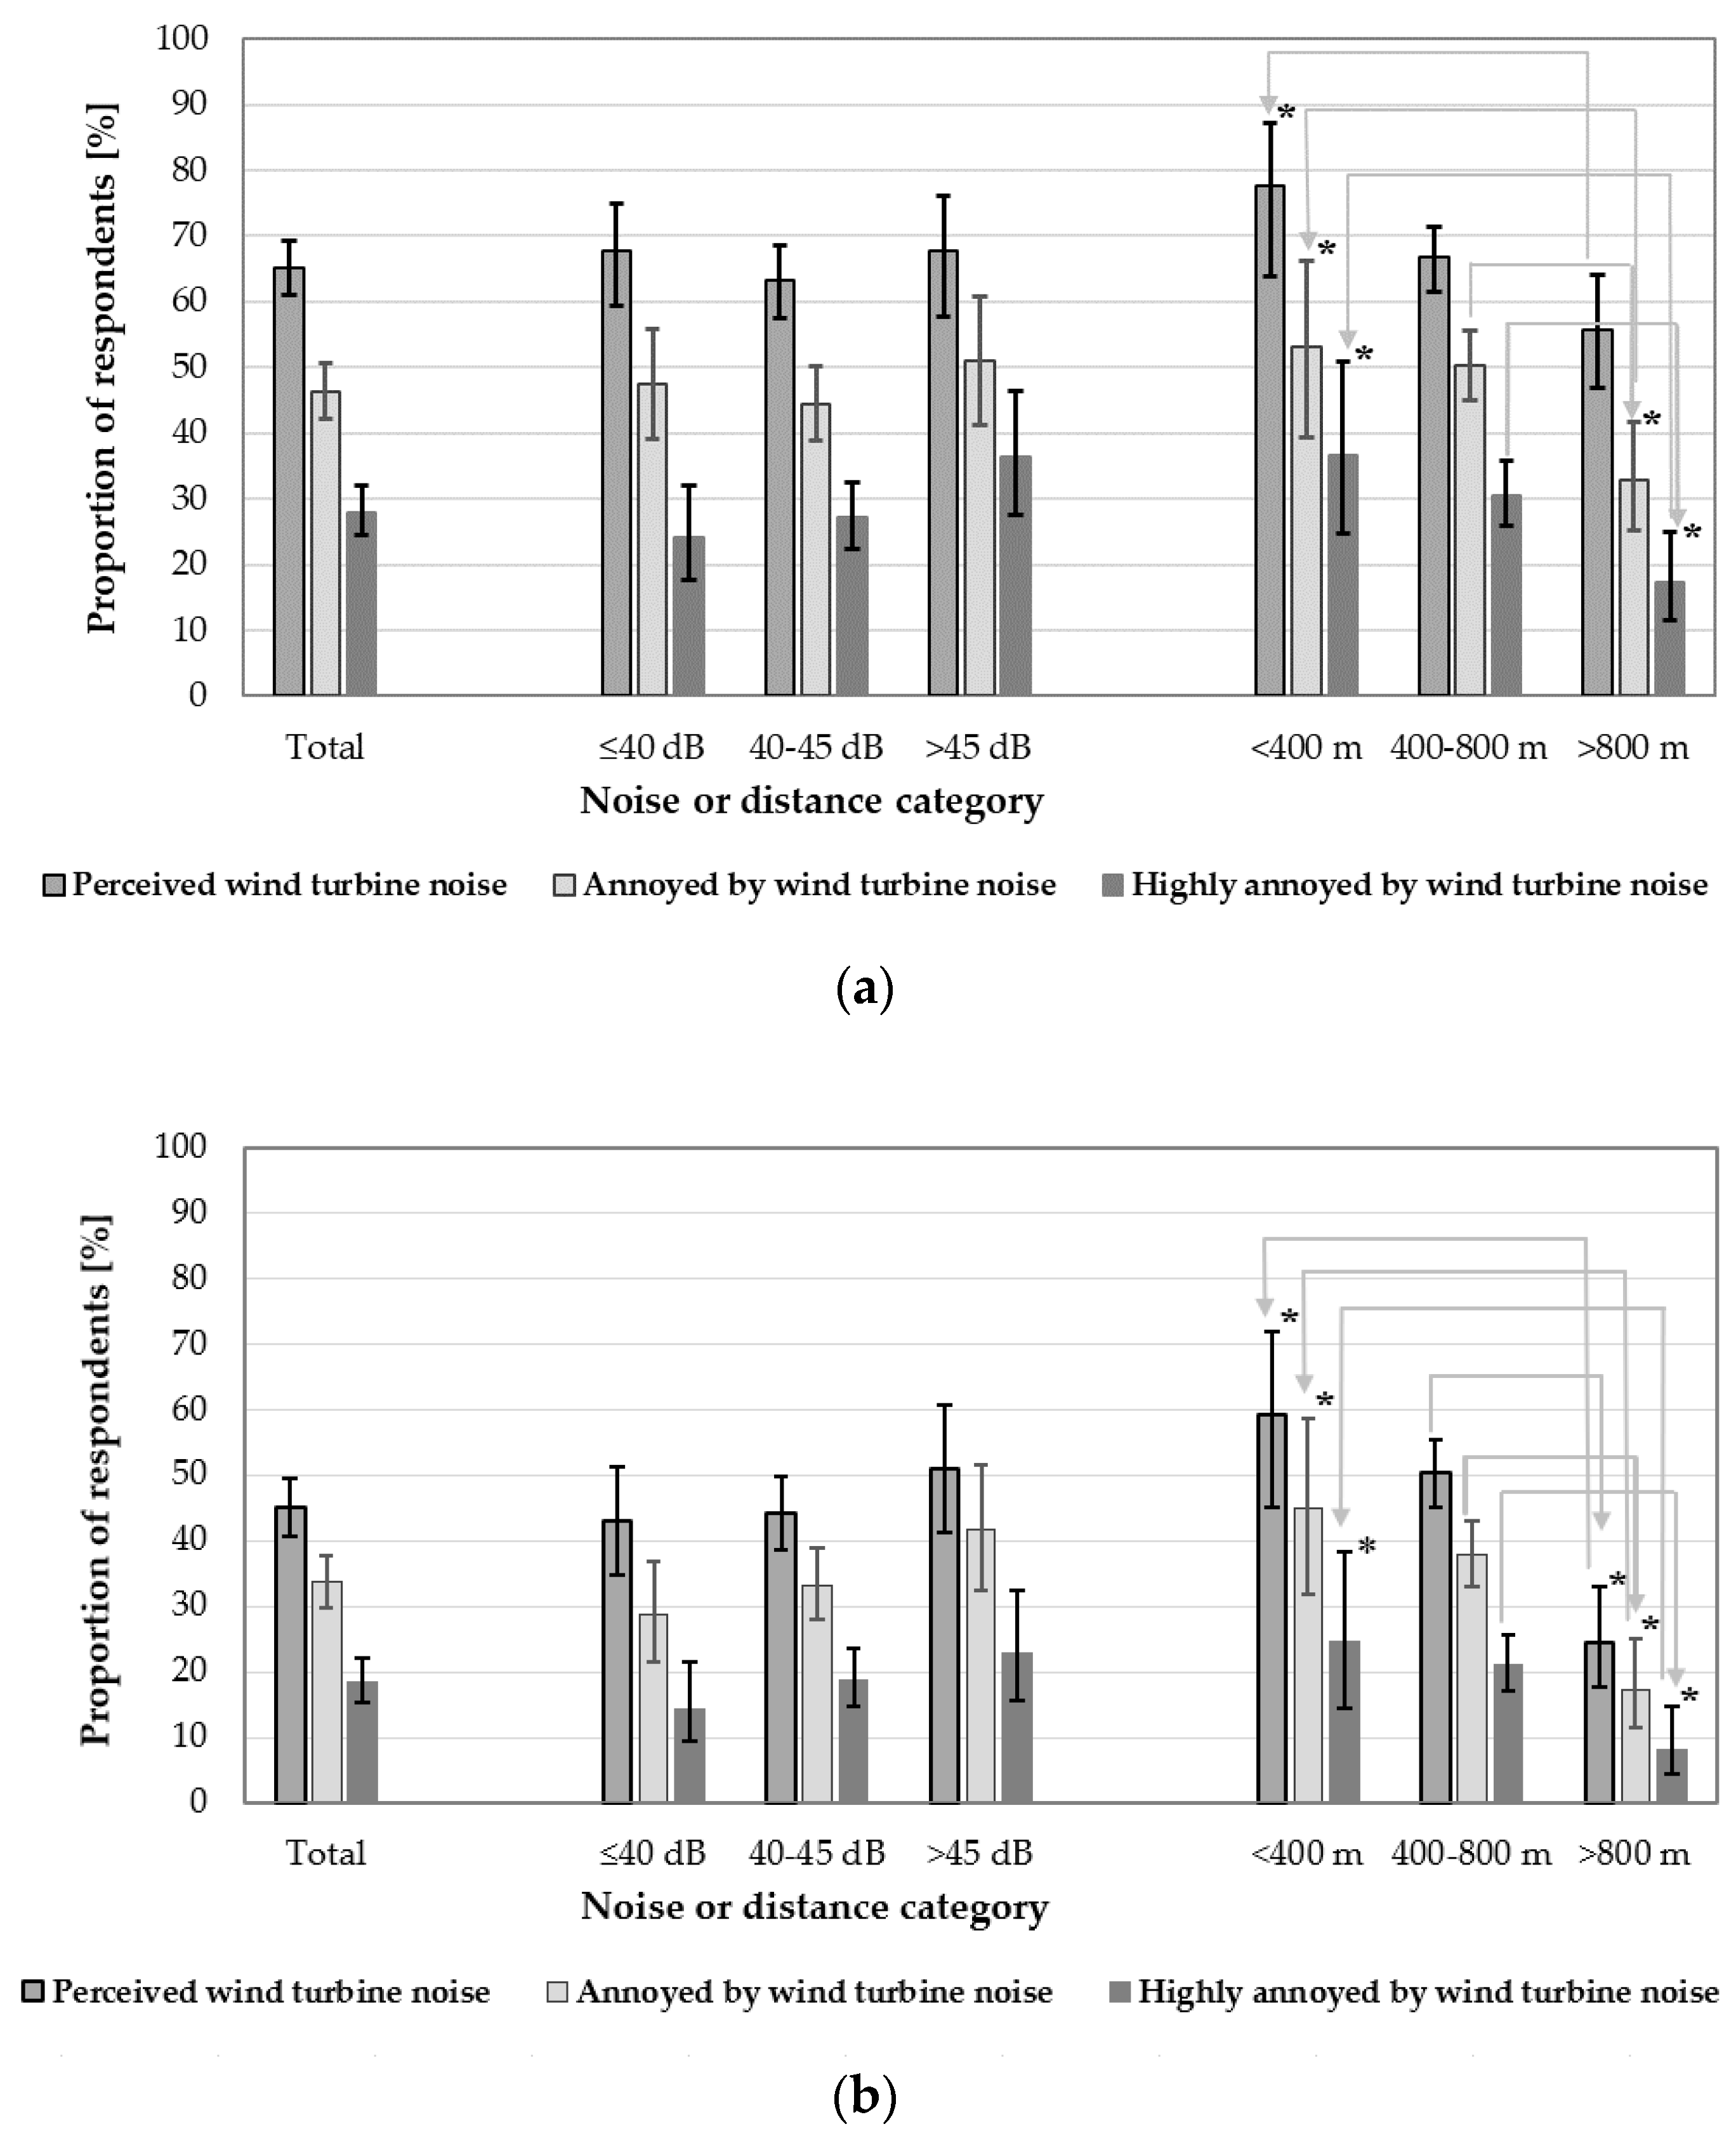
3.4.1. Annoyance Related to Wind Turbine Noise
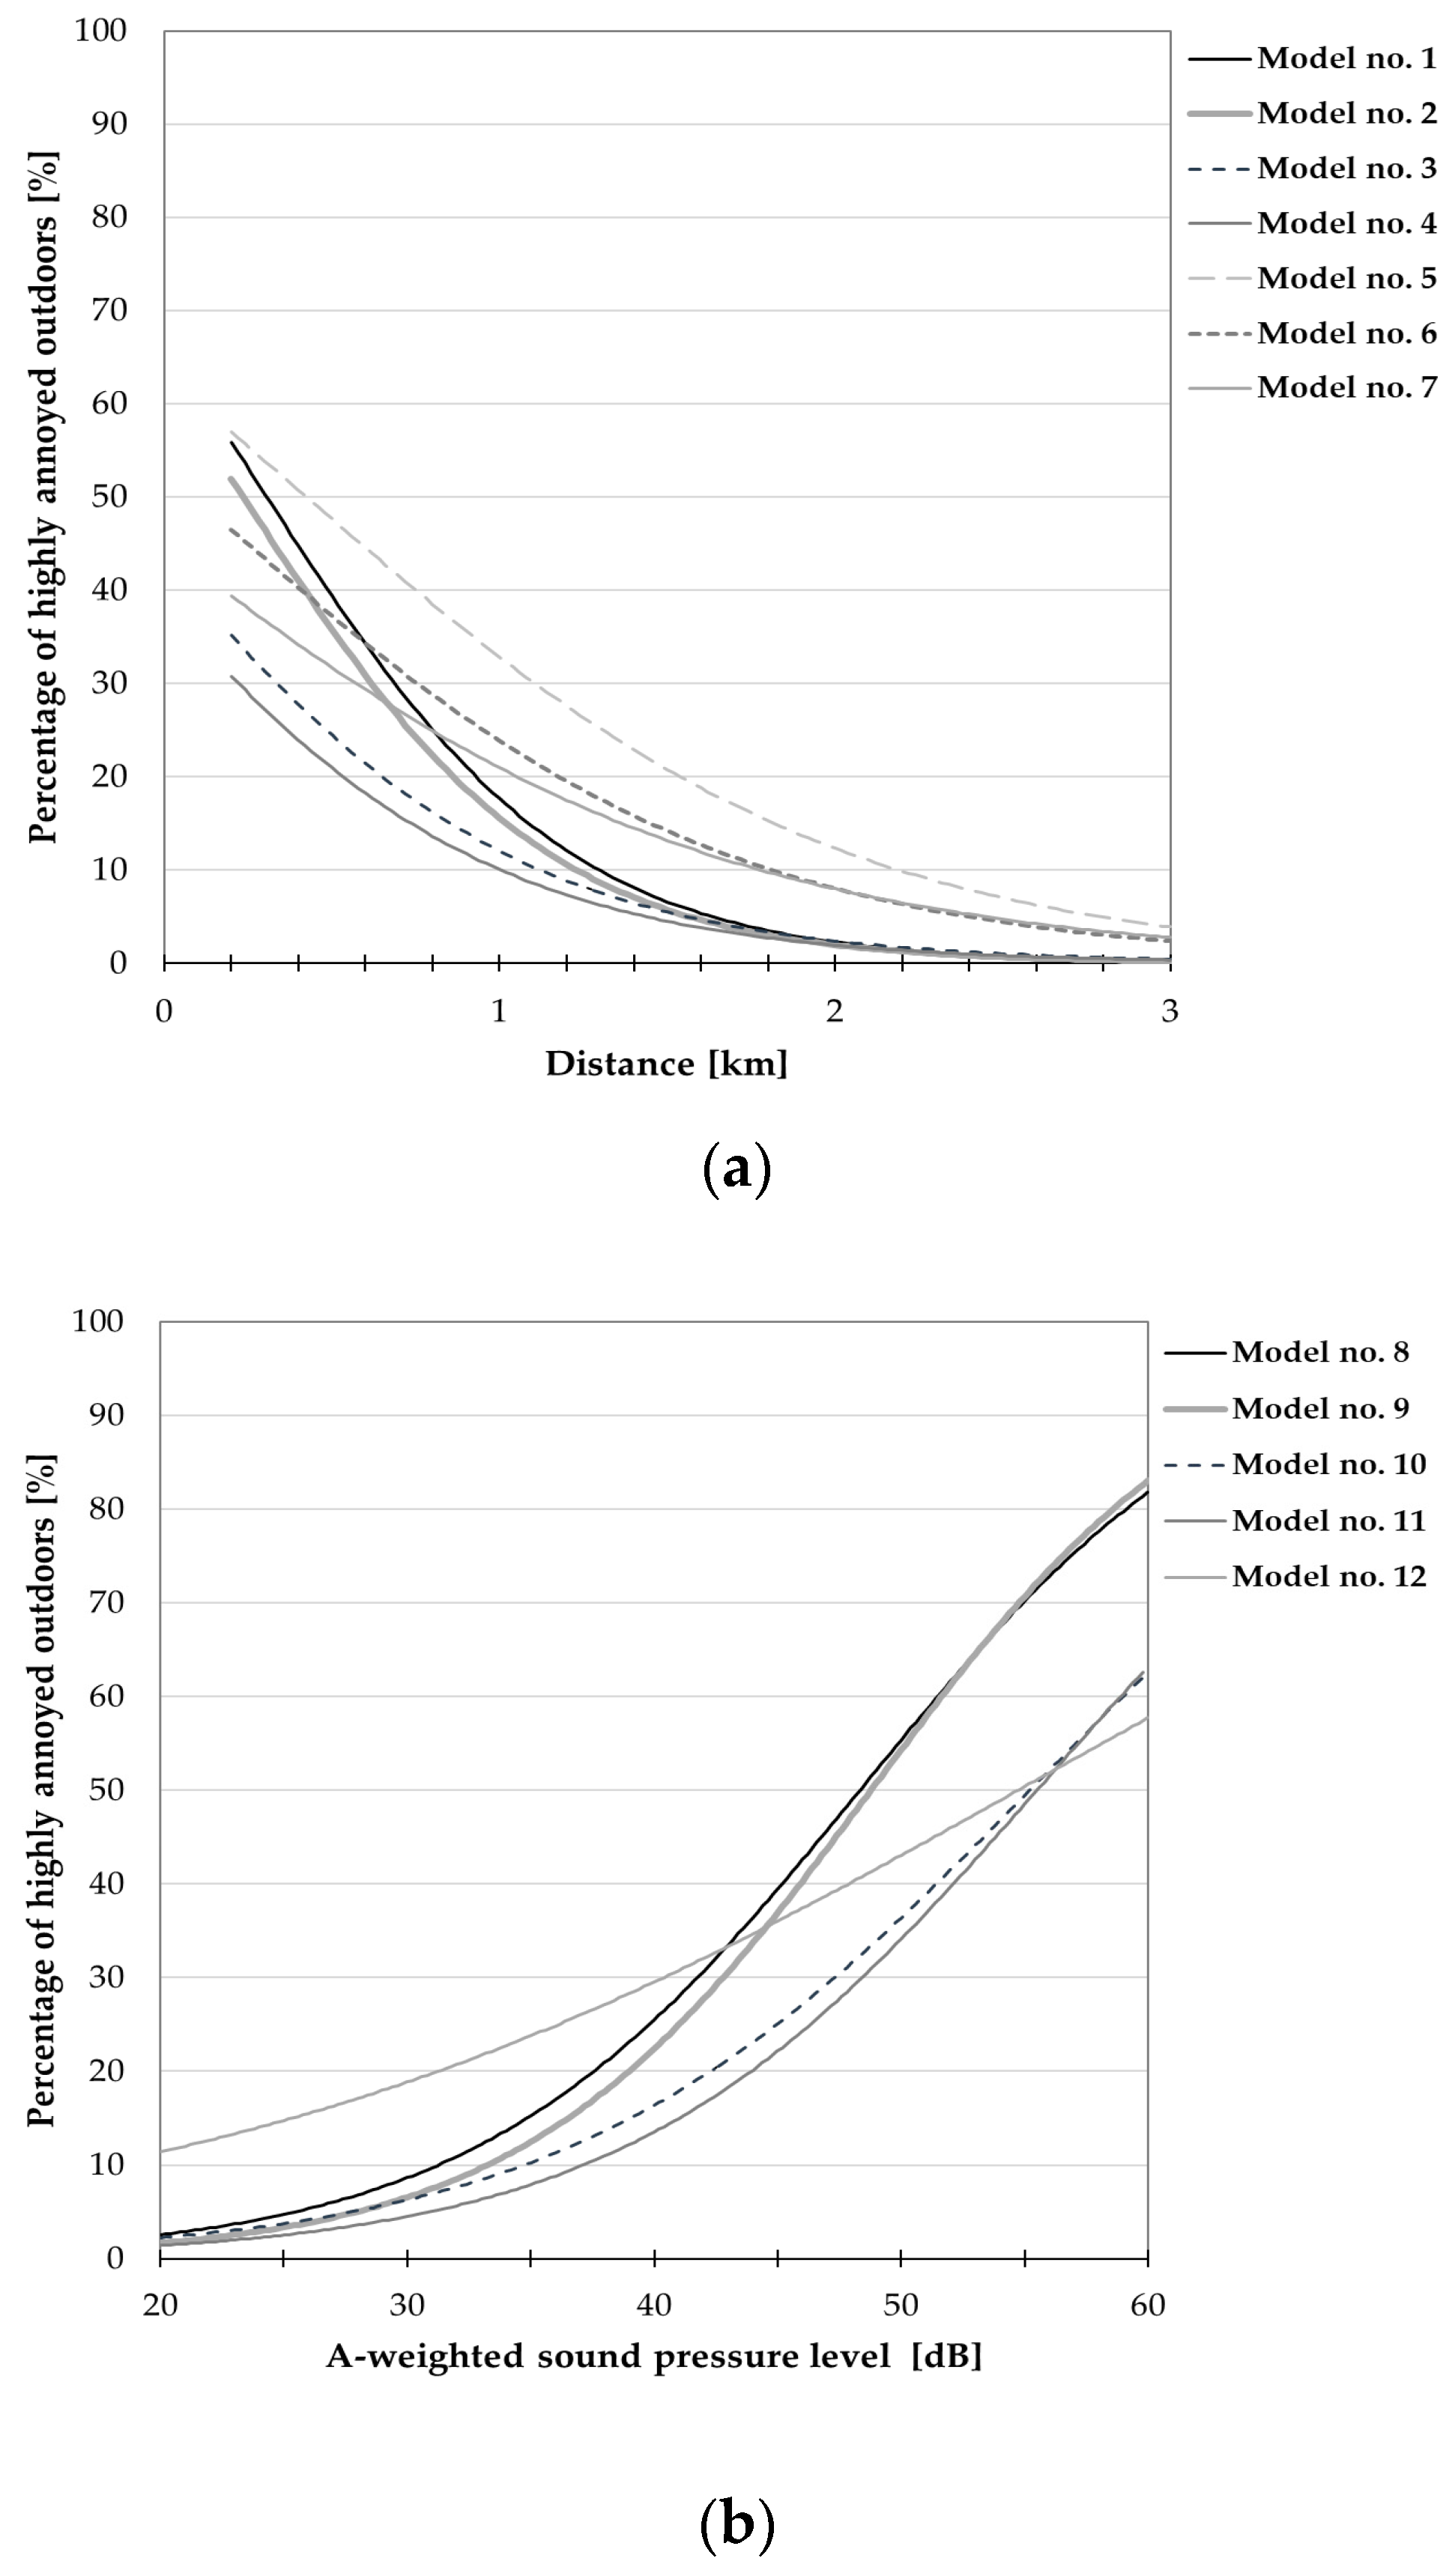
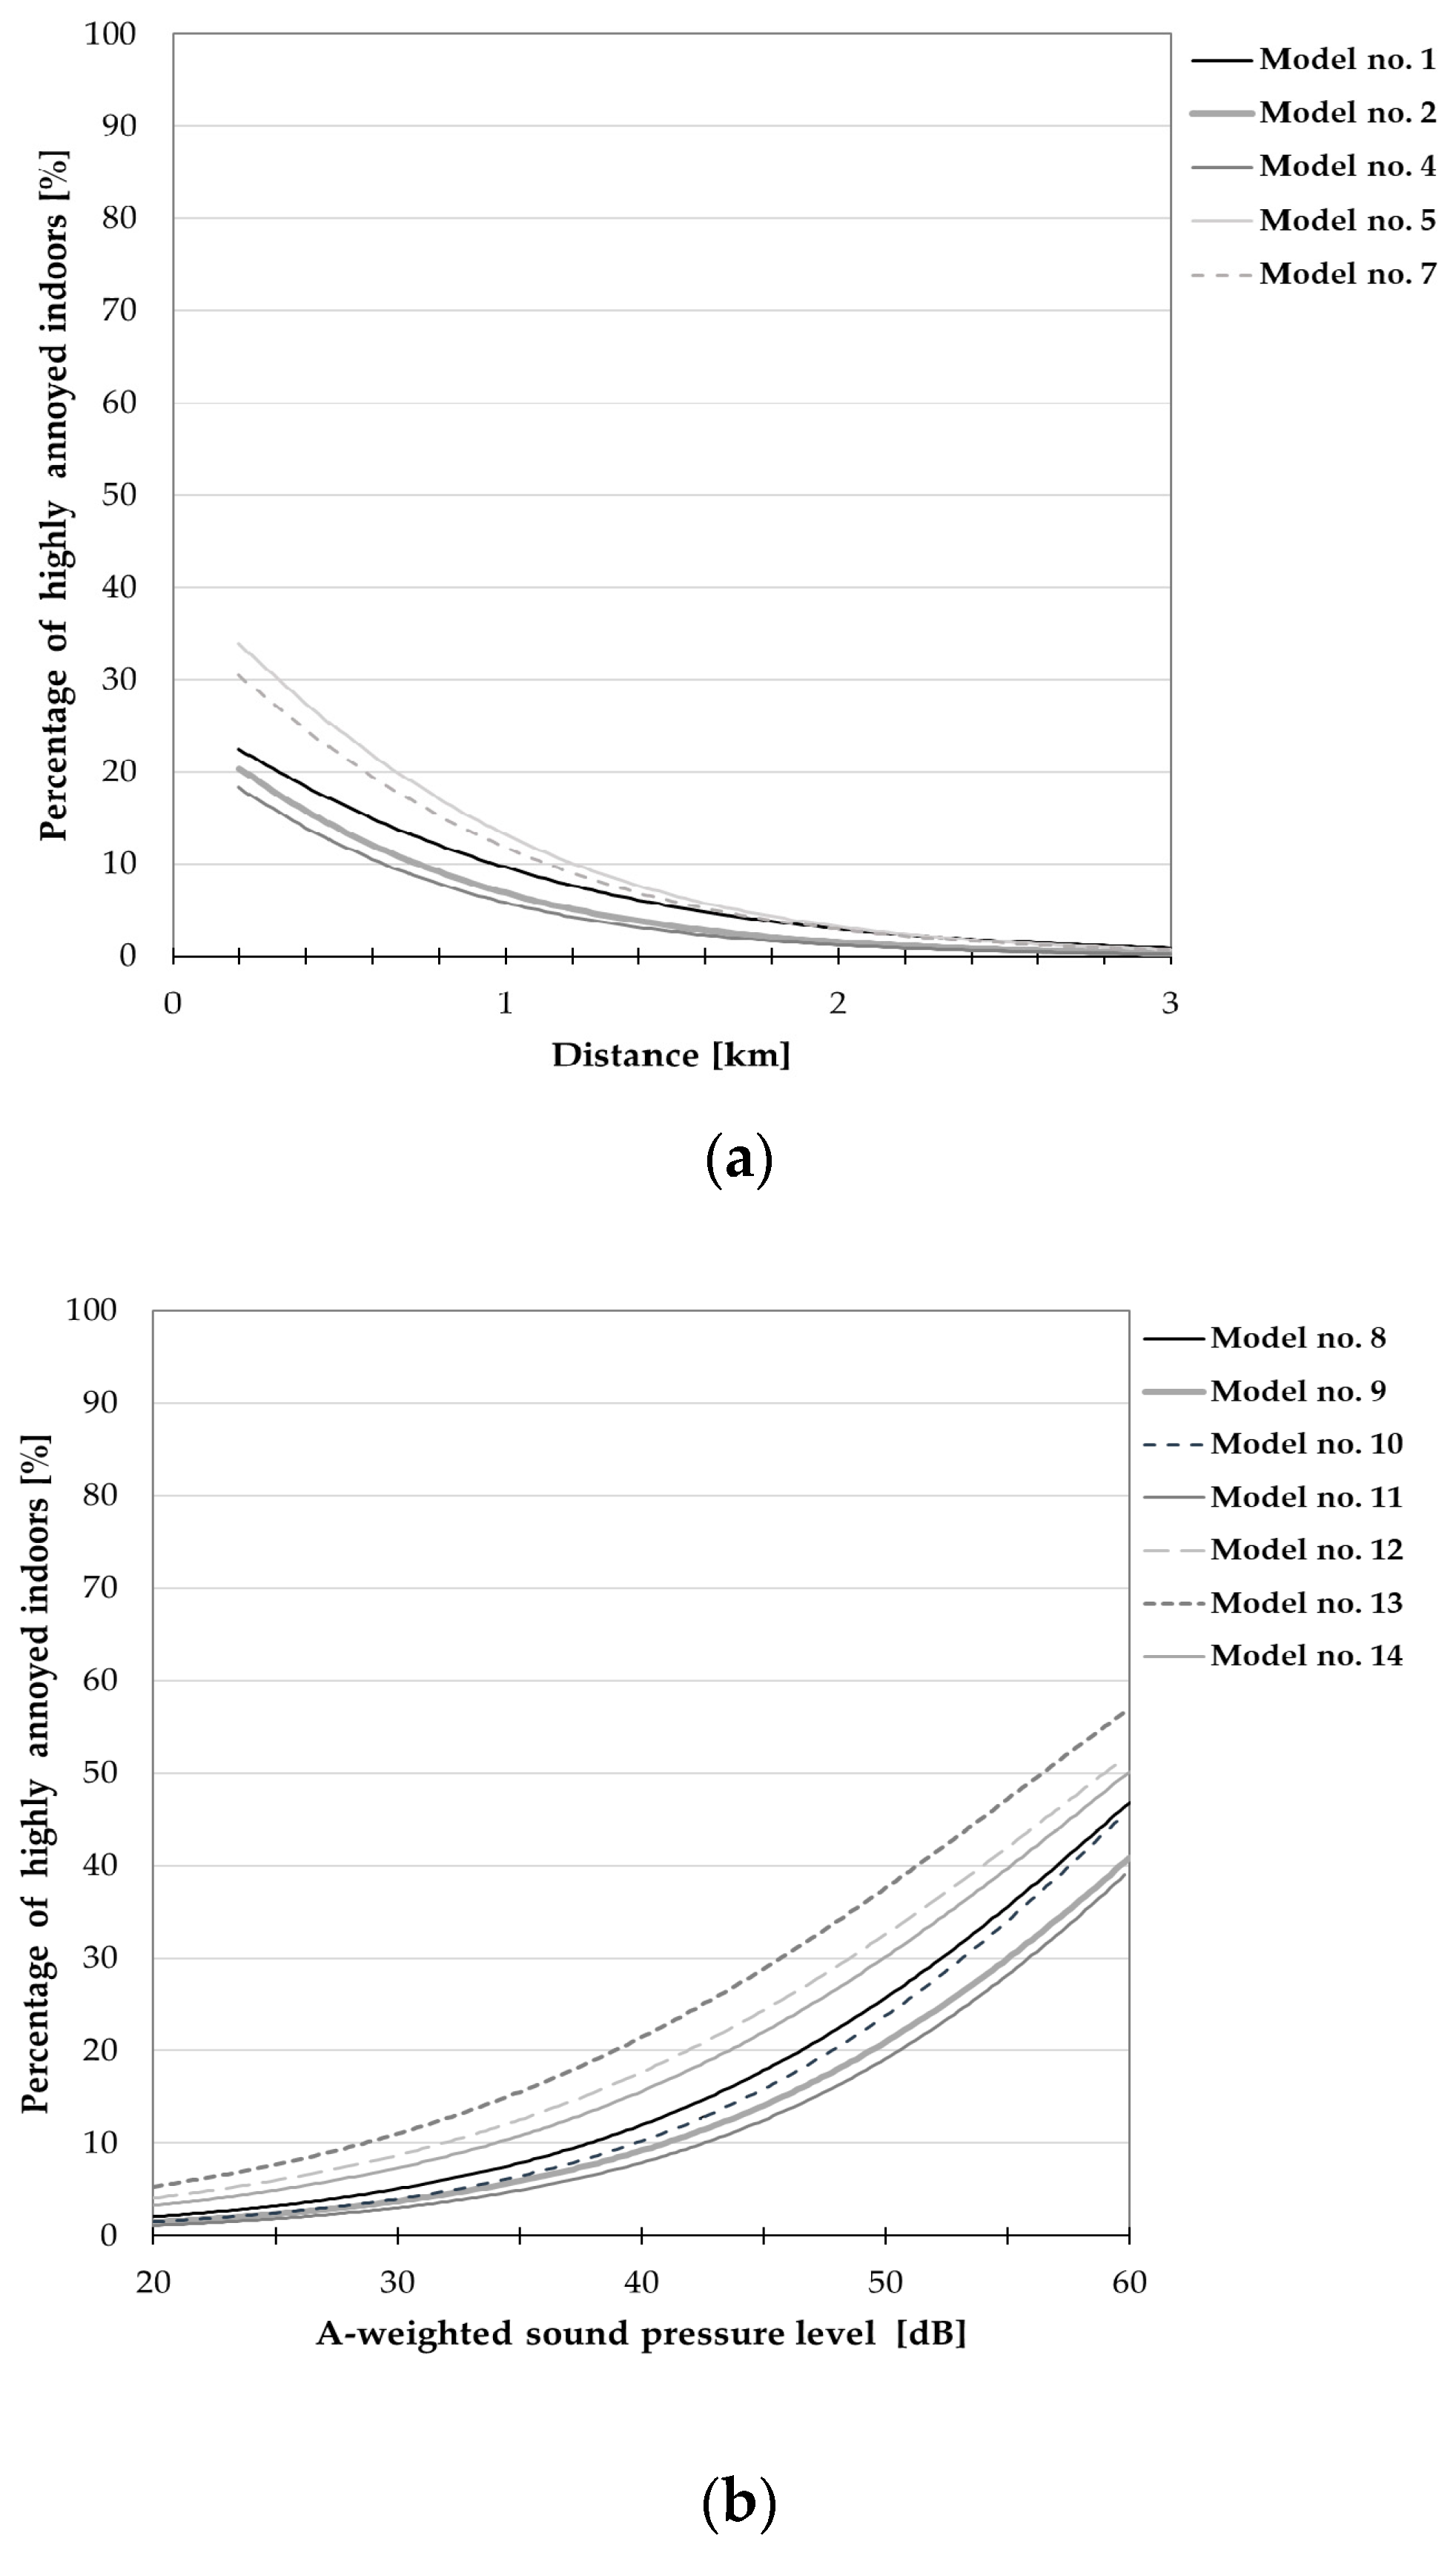
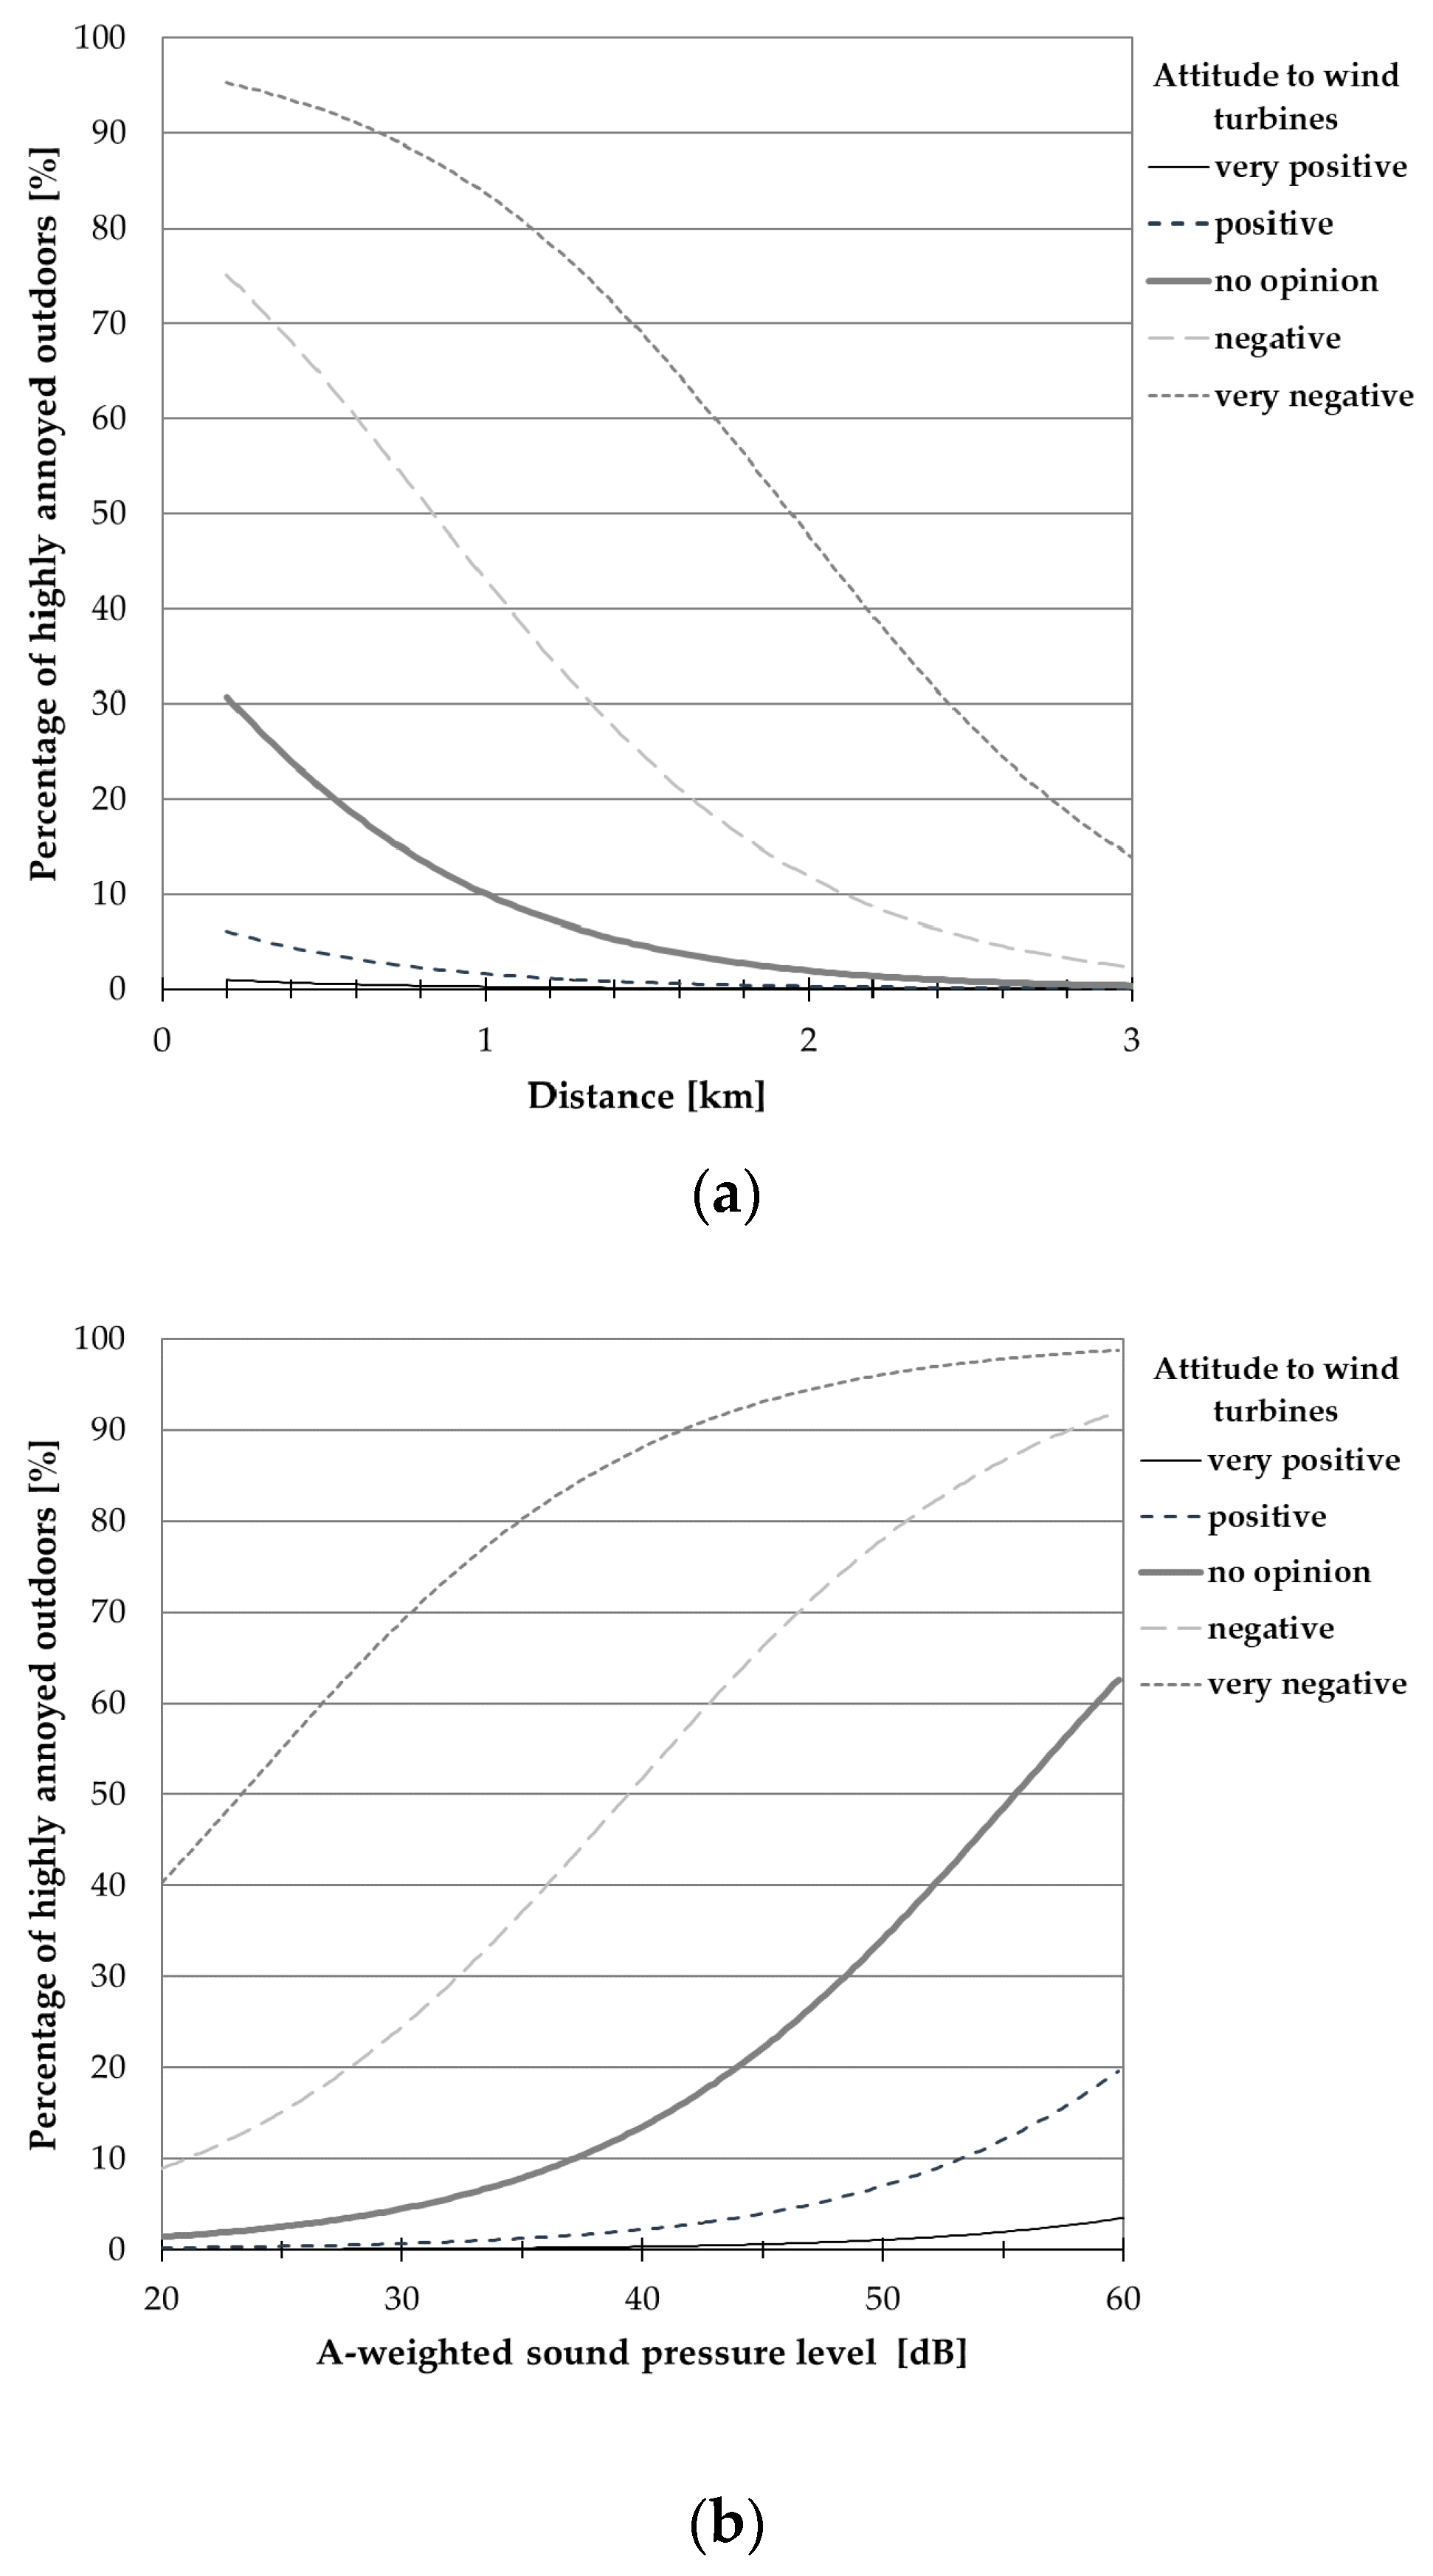
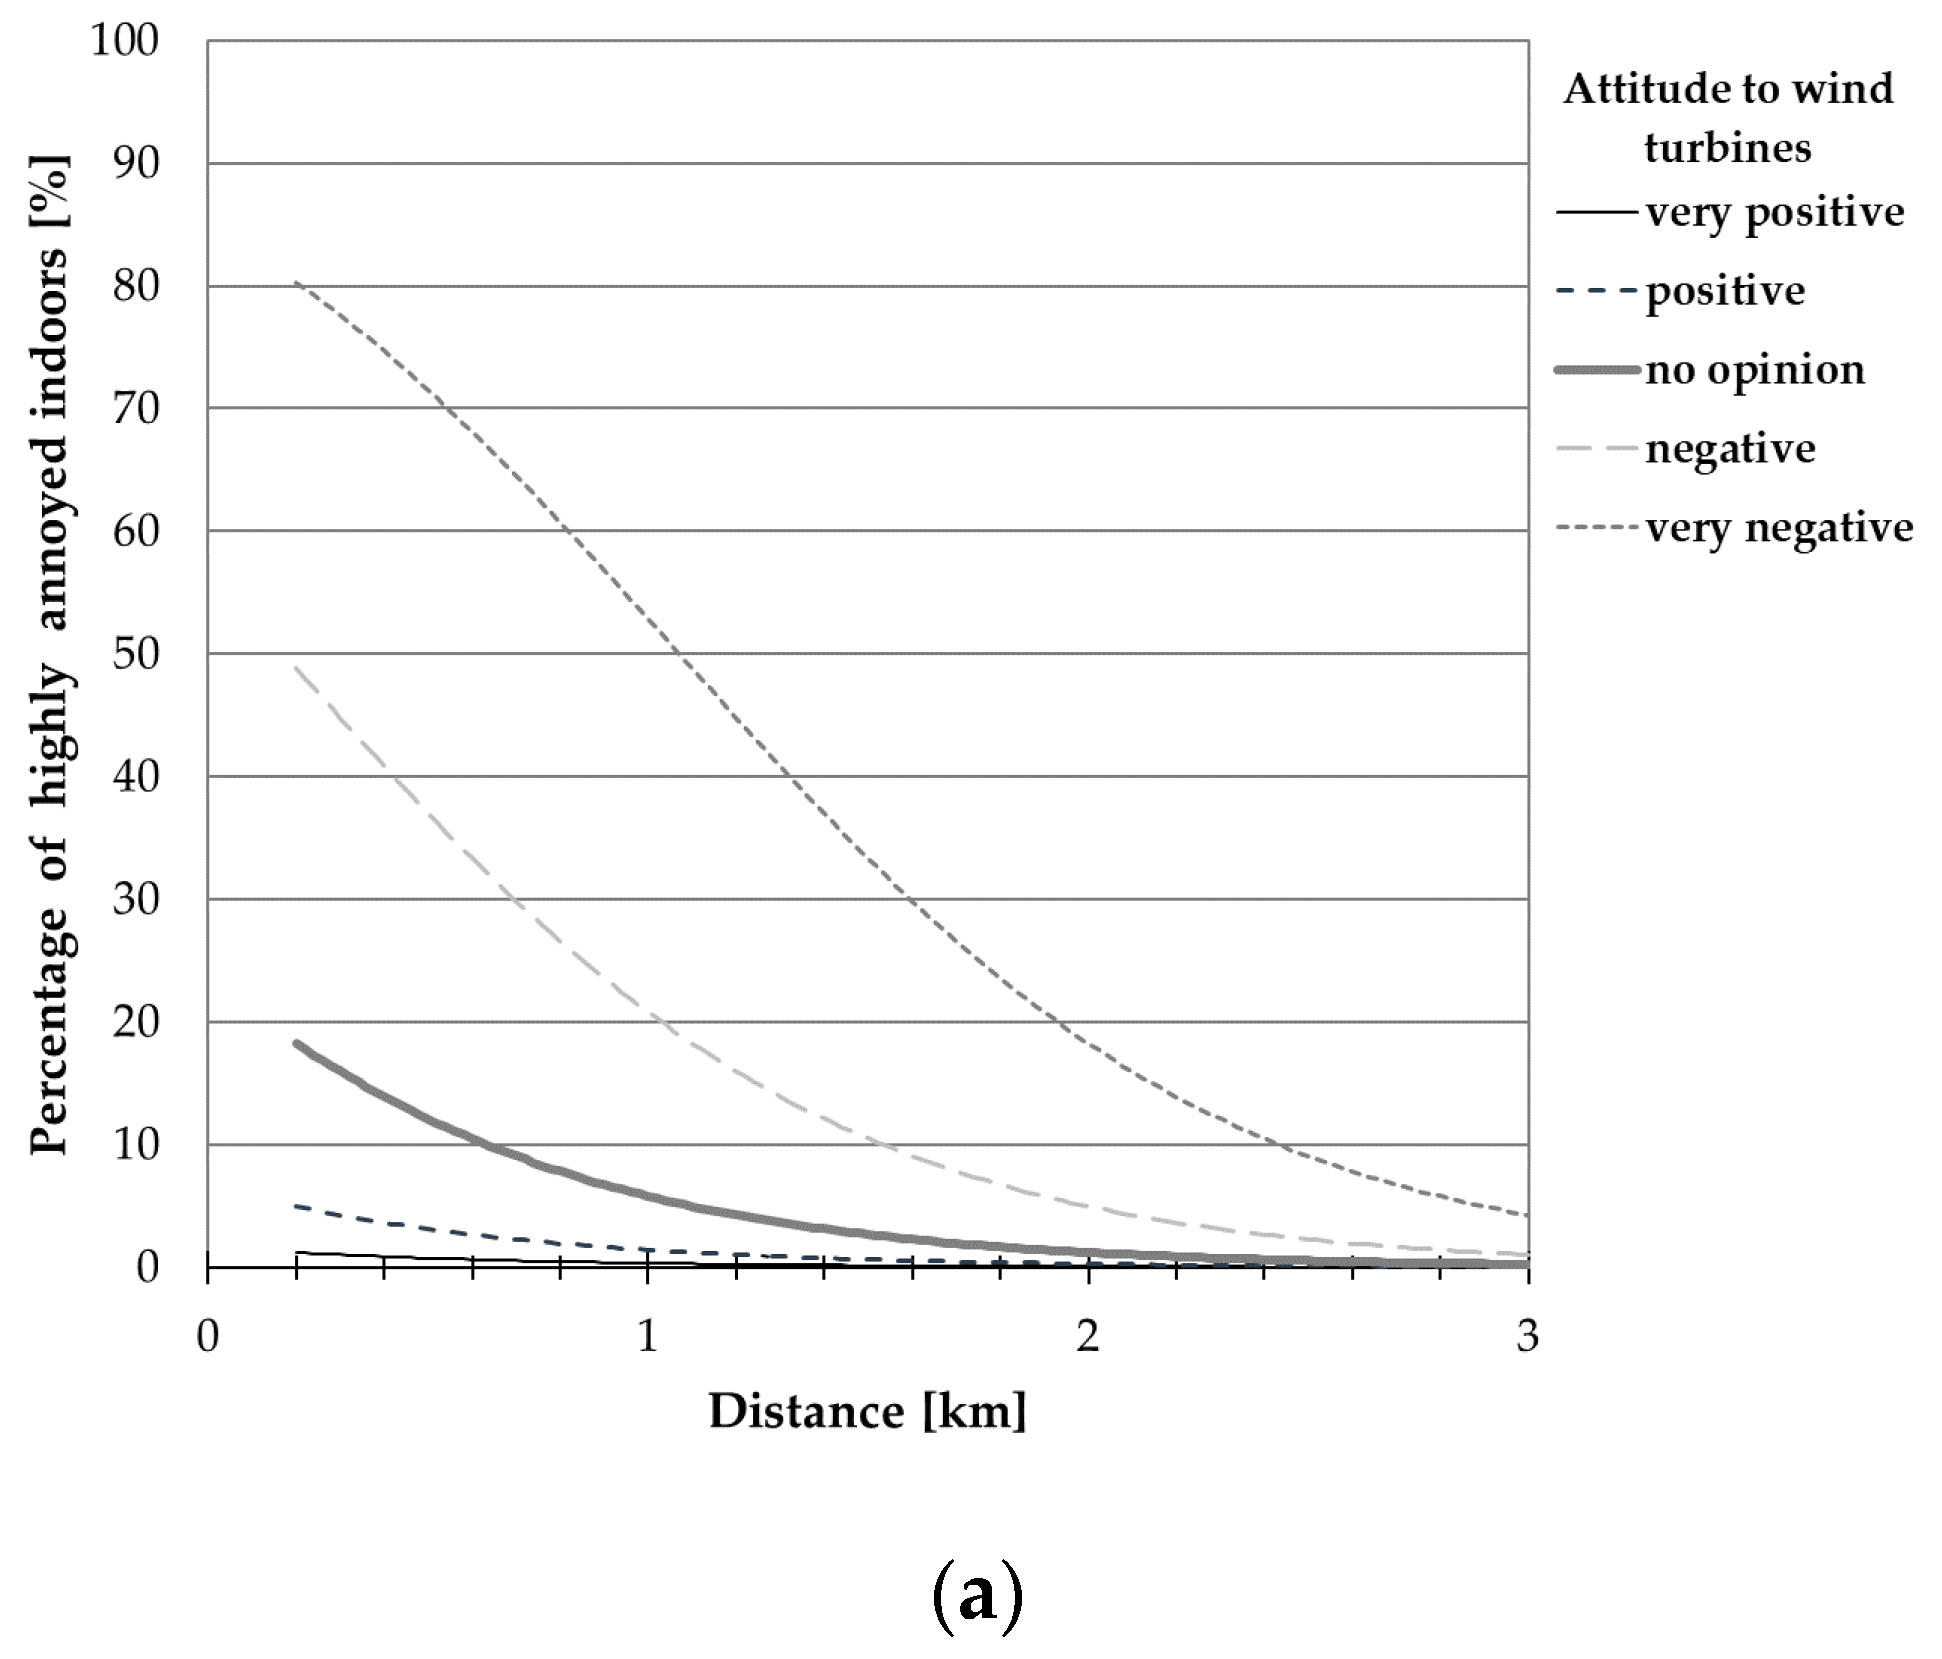
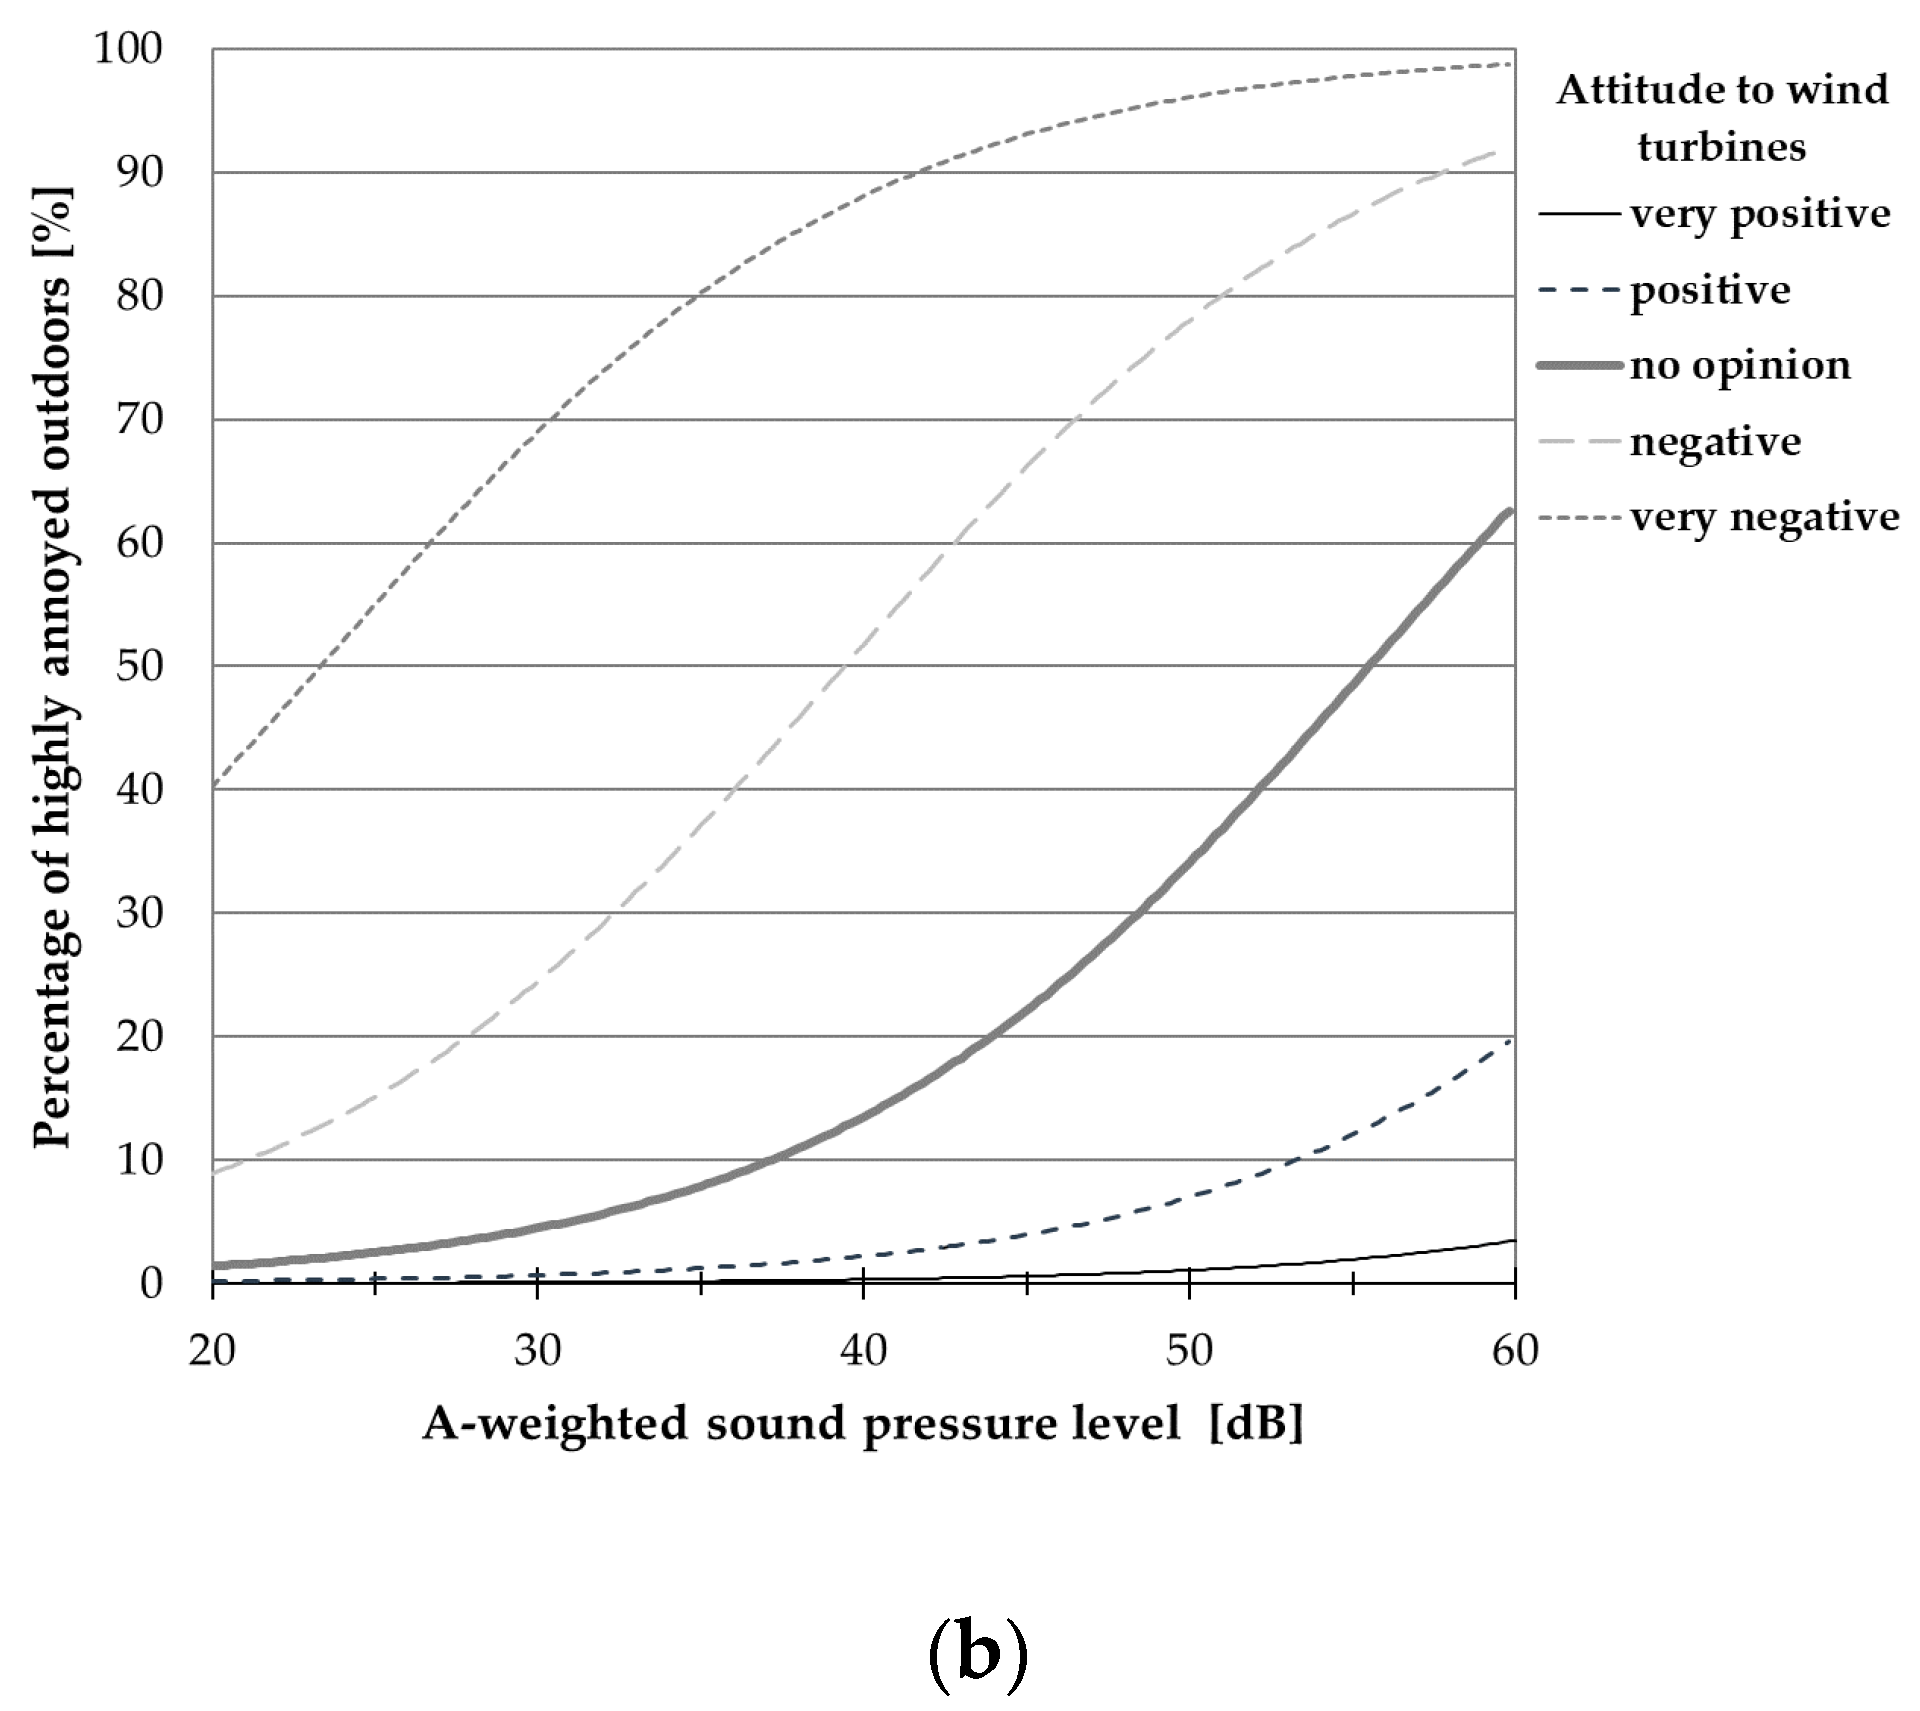
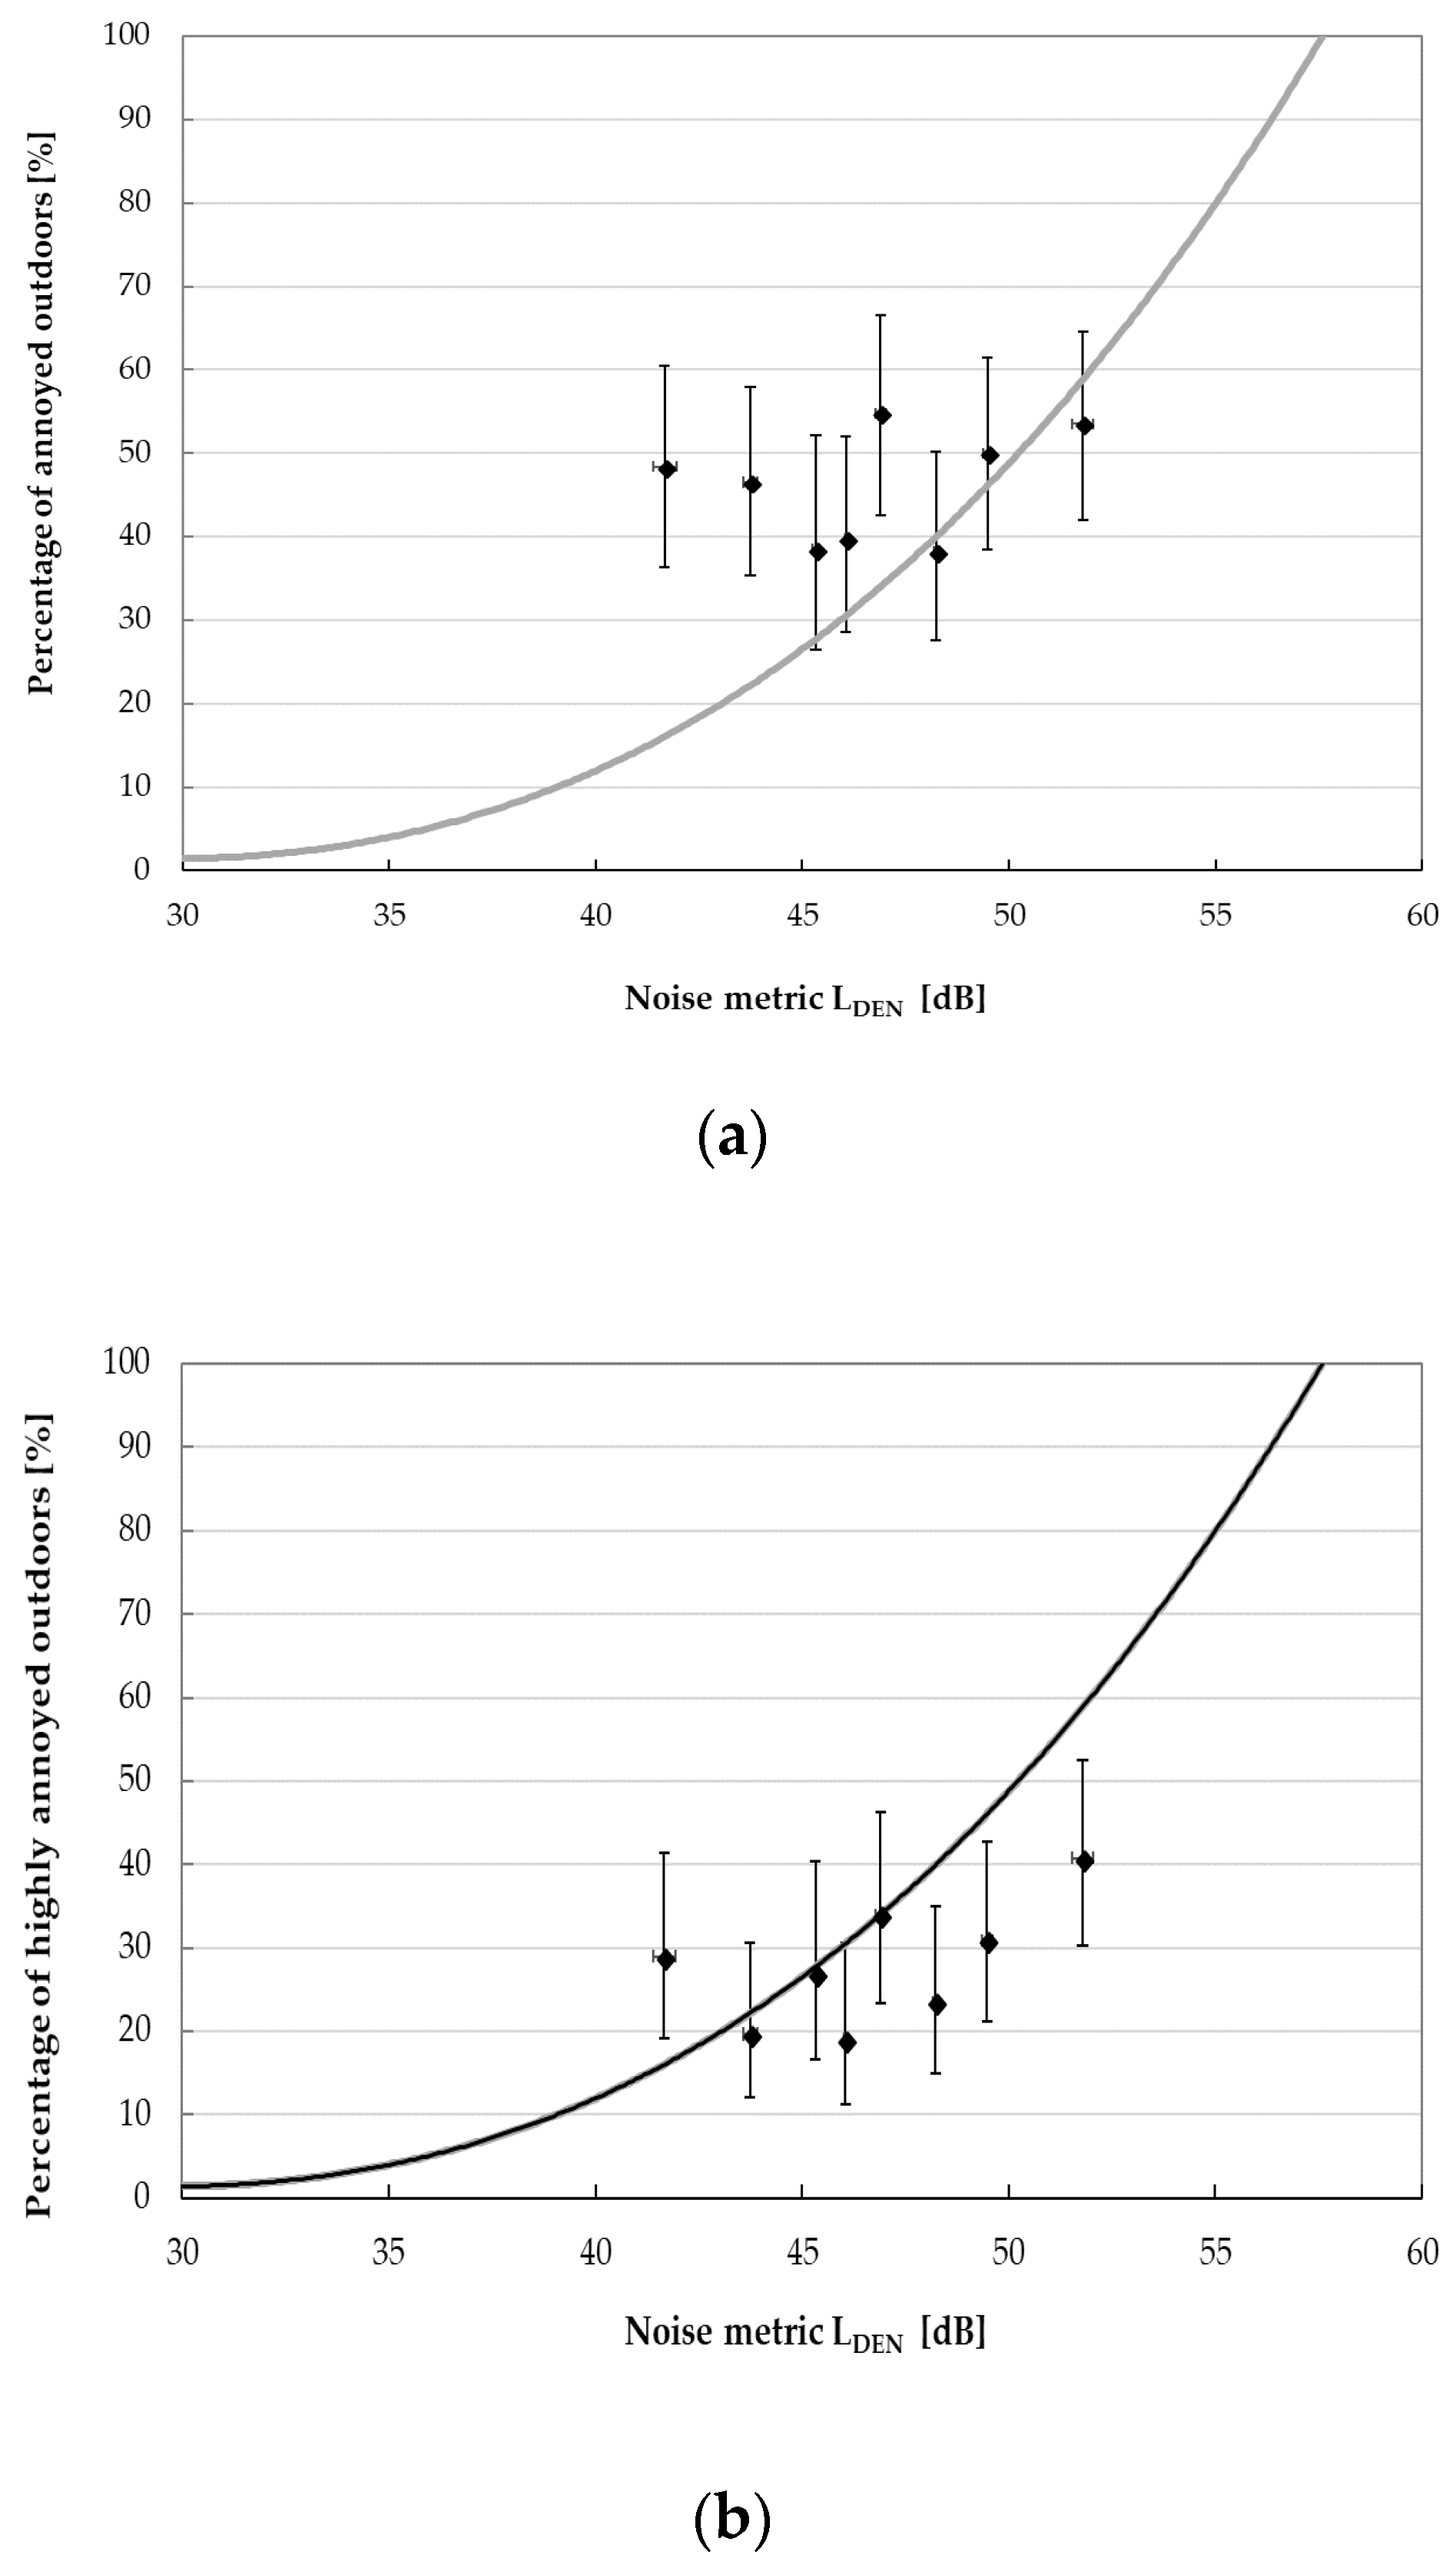
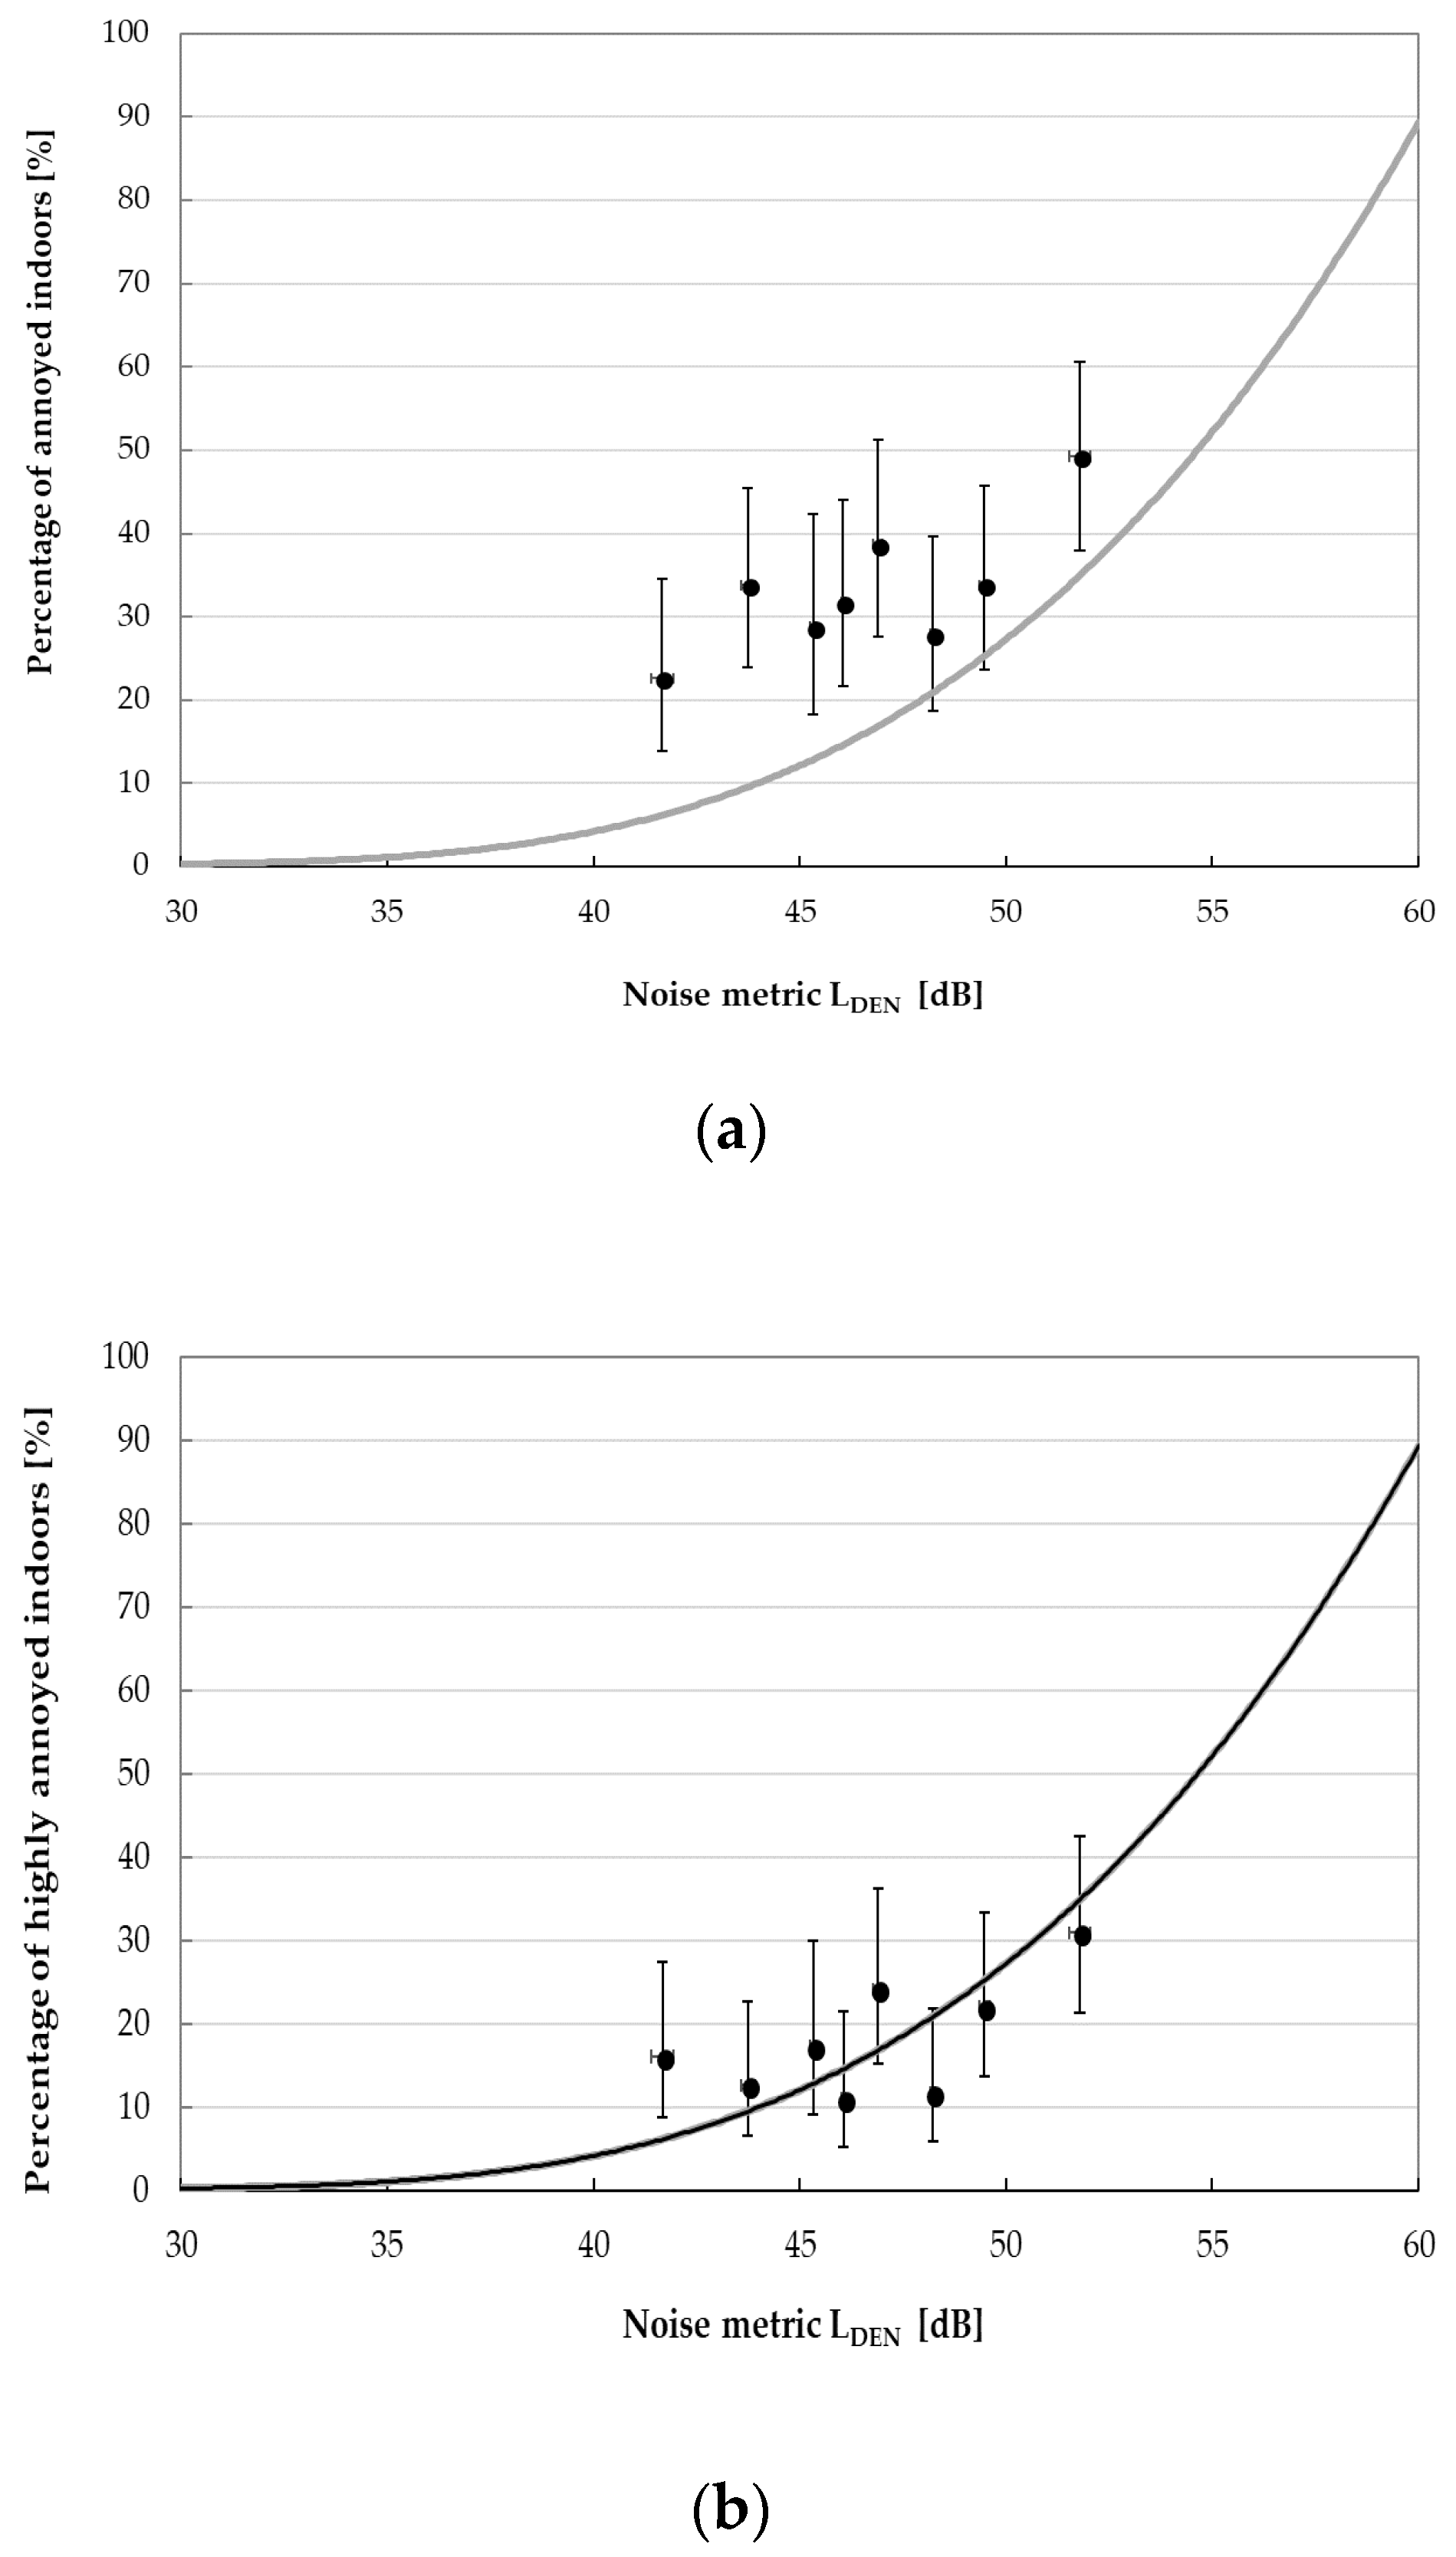
3.4.2. Exposure-Response Relationships
3.4.3. Factors Affecting Perception of Self-Reported Health
4. Discussion
5. Conclusions
Author Contributions
Funding
Acknowledgments
Conflicts of Interest
References
- Pedersen, E.; Persson Waye, K. Perception and annoyance due to wind turbine noise—A dose-response relationship. J. Acoust. Soc. Am. 2004, 116, 3460–3470. [Google Scholar] [CrossRef] [PubMed]
- Pedersen, E.; Persson Waye, K. Wind turbine noise, annoyance and self-reported health and well-being in different living environments. Occup. Environ. Med. 2007, 64, 480–486. [Google Scholar] [CrossRef] [PubMed]
- Pedersen, E.; Van den Berg, F.; Bakker, R.; Bouma, J. Response to noise from modern wind farms in The Netherlands. J. Acoust. Soc. Am. 2009, 126, 634–643. [Google Scholar] [CrossRef] [PubMed]
- Knopper, L.D.; Ollson, C.A. Health effects and wind turbines: A review of the literature. Environ. Health 2010, 78, 1–10. [Google Scholar] [CrossRef] [PubMed]
- Bakker, R.H.; Pedersen, E.; van den Berg, G.P.; Stewart, R.E.; Lok, W.; Bouma, J. Impact of wind turbine sound on annoyance, self-reported sleep disturbances and psychological distress. Sci. Total Environ. 2012, 425, 42–45. [Google Scholar] [CrossRef] [PubMed]
- Pedersen, E. City dweller responses to multiple stressors intruding into their homes: Noise, light, odour, and vibration. Int. J. Environ. Res. Public Health 2015, 12, 3246–3263. [Google Scholar] [CrossRef] [PubMed]
- Persson Waye, K.; Öhtrsöm, E. Psycho-acoustic characters of relevance for annoyance of wind turbine noise. J. Sound Vib. 2002, 250, 65–73. [Google Scholar] [CrossRef]
- Lee, S.; Kim, K.; Choi, W.; Lee, S. Annoyance caused by amplitude modulation of wind turbine noise. Noise Control Eng. J. 2011, 59, 38–46. [Google Scholar] [CrossRef]
- Pedersen, E.; Larsman, P. The impact of visual factor on noise annoyance among people living in the vicinity of wind turbines. J. Environ. Psychol. 2008, 28, 379–389. [Google Scholar] [CrossRef]
- Maffei, L.; Iachini, T.; Masullo, M.; Aletta, F.; Sorrentino, F.; Senese, V.P.; Ruotolo, F. The effects of vision-related aspects on noise perception of wind turbines in quiet areas. Int. J. Environ. Res. Public Health 2013, 10, 1681–1697. [Google Scholar] [CrossRef] [PubMed]
- Michaud, D.S.; Feder, K.; Keith, S.E.; Voicescu, S.A.; Marro, L.; Than, J.; Guay, M.; Denning, A.; McGuire, D.; Bower, T.; et al. Exposure to wind turbine noise: Perceptual responses and reported health effects. J. Acoust. Soc. Am. 2016, 139, 1443–1454. [Google Scholar] [CrossRef] [PubMed] [Green Version]
- Michaud, D.S.; Keith, S.E.; Feder, K.; Voicescu, S.A.; Marro, L.; Than, J.; Guay, M.; Denning, A.; Lavigne, E.; Whelan, C.; et al. Personal and situational variables associated with wind turbine noise annoyance. J. Acoust. Soc. Am. 2016, 139, 1455–1466. [Google Scholar] [CrossRef] [PubMed] [Green Version]
- Michaud, D.S.; Feder, K.; Keith, S.E.; Voicescu, S.A.; Marro, L.; Than, J.; Guay, M.; Denning, A.; Bower, T.; Villeneuve, P.J.; et al. Self-reported and measured stress related responses associated with exposure to wind turbine noise. J. Acoust. Soc. Am. 2016, 139, 1467–1479. [Google Scholar] [CrossRef] [PubMed] [Green Version]
- Michaud, D.S.; Feder, K.; Voicescu, S.A.; Marro, L.; Than, J.; Guay, M.; Lavigne, E.; Denning, A.; Murray, B.J.; Weiss, S.K.; et al. Clarifications on the design and interpretation of conclusions from health Canada’s study on wind turbine noise and health. Acoust. Aust. 2018, 46, 99–110. [Google Scholar] [CrossRef]
- Mroczek, B.; Kurpas, D.; Karakiewicz, B. Influence of distances between places of residence and wind farms on the quality of life in nearby areas. Ann. Agric. Environ. Med. 2012, 19, 692–696. [Google Scholar] [PubMed]
- Mroczek, B. Quality of Life of People Living in Wind Farm Areas; PPH Zapol: Szczecin, Poland, 2013. (In Polish) [Google Scholar]
- Pawlaczyk-Łuszczyńska, M.; Dudarewicz, A.; Zaborowski, K.; Zamojska-Daniszewska, M.; Waszkowska, M. Evaluation of annoyance from the wind turbine noise: A pilot study. Int. J. Occup. Med. Environ. Health 2014, 27, 364–388. [Google Scholar] [CrossRef] [PubMed] [Green Version]
- Makowska, Z.; Merecz, D. Polish adaptation of David Goldberg’s General Health Questinnaires: GHQ-12 and GHQ-28. In Assessment of Mental Health Status Using David Goldberg’s Questionnaires. Guide for Users of GHQ-12 and GHQ-28; Dudek, B., Ed.; Nofer Institute of Occupational Medicine: Łódź, Poland, 2001. (In Polish) [Google Scholar]
- Makowska, Z.; Merecz, D.; Mościcka, A.; Kolasa, W. The validity of general health questionnaires, GHQ-12 and GHQ-28, in mental health studies of working people. Int. J. Occup. Med. Environ. Health 2002, 15, 353–362. [Google Scholar] [PubMed]
- International Organization for Standardization. Attenuation of Sound during Propagation Outdoors. Part 2: General Method of Calculation; ISO 9613-2; International Organization for Standardization: Geneva, Switzerland, 1996. [Google Scholar]
- Geoportal.gov.pl. Head Office of Geodesy and Cartography; Geoportal.gov.pl: Warszawa, Poland, 2014. [Google Scholar]
- Directive, E. U. Directive 2002/49/EC of the European Parliament and of the Council of 25 June 2002 relating to the assessment and management of environmental noise. Off. J. Eur. Commun. 2002, L189, 12–25. [Google Scholar]
- Van den Berg, F. Criteria for wind farm noise: Lmax and Lden. In Proceedings of the 7th European Conference on Noise Control, Euronoise (Acoustics ’08), Paris, France, 29 June–4 July 2008. [Google Scholar]
- Regulation of the Minister of the Environment of October 30, 2014 on The Requirements for the Measurement of Emission Volumes and Measurements of the Amount of Water Consumed. Available online: http://prawo.sejm.gov.pl/isap.nsf/download.xsp/WDU20140001542/O/D20141542.pdf (accessed on 23 July 2018). (In Polish)
- Nagelkerke, N.J.D. A note on the general definition of the coefficient of determination. Biometrika 1991, 78, 691–692. [Google Scholar] [CrossRef]
- Leventhall, G.; Pelmear, P.; Benton, S. A Review of Published Research on Low Frequency Noise and Its Effects; Department for Environment, Food Rural Affairs: London, UK, 2003.
- ISO. International Standard ISO 226: Acoustics—Normal Equal-Loudness-Level Contours; ISO: Geneva, Switzerland, 2003. [Google Scholar]
- Pedersen, E. Health aspects associated with wind turbine noise—Results from three field studies. Noise Control Eng. J. 2011, 59, 47–53. [Google Scholar] [CrossRef]
- Shepherd, D.; McBride, D.; Welch, D.; Dirks, K.N.; Hill, E.M. Evaluating the impact of wind turbine noise on health-related quality of life. Noise Health 2011, 13, 333–339. [Google Scholar] [CrossRef] [PubMed]
- Nissenbaum, M.A.; Aramini, J.J.; Hanning, C.D. Effects of industrial wind turbine noise on sleep and health. Noise Health 2012, 14, 237–243. [Google Scholar] [CrossRef] [PubMed]
- Magari, S.R.; Smith, C.E.; Schiff, M.; Rohr, A.C. Evaluation of community response to wind turbine-related noise in western New York state. Noise Health 2014, 16, 228–239. [Google Scholar] [CrossRef] [PubMed]
- Song, K.; Di, G.; Xu, Y.; Chen, X. Community survey on noise impacts induced by 2 MW wind turbines in China. J. Low Freq. Noise Vib. Act. Control 2016, 35, 279–290. [Google Scholar] [CrossRef] [Green Version]
- Krogh, C.M.E.; Gillis, L.; Kouwen, N.; Aramini, J. WindVOiCe, a self-reporting survey: adverse health effects, industrial wind turbines, and the need for vigilance monitoring. Bul. Sci. Technol. Soc. 2011, 31. [Google Scholar] [CrossRef]
- Leventhall, G. Infrasound from wind turbines—Facts, fiction or deception. Can. Acoust. 2006, 34, 29–34. [Google Scholar]
- O’Neal, R.D.; Hellweg, R.D., Jr.; Lampeter, R.M. Low frequency noise and infrasound from wind turbines. Noise Control Eng. J. 2011, 59, 135–157. [Google Scholar] [CrossRef]
- Schultz, T.J. Synthesis of social surveys on noise annoyance. J. Acoust. Soc. Am. 1978, 64, 73–85. [Google Scholar] [CrossRef]
- Janssen, S.A.; Vos, H.; Eisses, A.R.; Pedersen, E. A comparison between exposure-response relationships for wind turbine annoyance and annoyance due to other noise sources. J. Acoust. Soc. Am. 2011, 130, 3746–3753. [Google Scholar] [CrossRef] [PubMed]
- Pedersen, E.; Van den Berg, F.; Bakker, R.; Bouma, J. Can road traffic mask sound from wind turbines? Response to wind turbine sound at different levels of road traffic sound. Energy Policy 2010, 38, 2520–2527. [Google Scholar] [CrossRef] [Green Version]
- Night Noise Guidelines for Europe World Health Organization Regional Office for Europe, Copenhagen 2009. Available online: http://www.euro.who.int/__data/assets/pdf_file/0017/43316/E92845.pdf (accessed on 13 July 2018).
- Davya, J.L.; Burgemeisterb, K.; Hillmanc, D. Wind turbine sound limits: Current status and recommendations based on mitigating noise annoyance. Appl. Acoust. 2018, 140, 288–295. [Google Scholar] [CrossRef]


| No. | Area | Localization | Number of Respondents | Wind Farm | Power Installed | Wind Turbines | |||
|---|---|---|---|---|---|---|---|---|---|
| Quantity Pcs. | Power | Sound Power Level | Type | ||||||
| 1 | 32.2 km2 | Kuyavian-Pomeranian Province, Lipno County | 64 | Farm No. 1 | 34 MW | 17 | 2 MW | 104.0 dB | Vestas V-90 |
| 600 kW | 6 | 100 kW | 99.0 dB | - | |||||
| 2 | 45.2 km2 | West Pomeranian Province, Koszalin County | 52 | Farm No. 2 | 50 MW | 25 | 2 MW | 105.5 dB | Vestas V-80 |
| 3 | 73.9 km2 | West Pomeranian Province, Bialogard County | 21 | Farm No. 3 | 90 MW | 60 | 1.5 MW | 105.1 dB | Fuhrländer Fl 1500 77 |
| 4 | 4.7 km2 | West Pomeranian Province, Slawno County | 35 | Farm No. 4 | 20 MW | 10 | 2 MW | 105.5 dB | Vestas V-80 |
| 660 kW | 5 | 132 kW | 99.0 dB | Seewind | |||||
| 5 | 4.9 km2 | West Pomeranian Province, Slawno County | 35 | Farm No. 5 | 22.5 MW | 9 | 2.5 MW | 103.5 dB | Nordex N90 |
| 6 | 15.6 km2 | West Pomeranian Province, Slawno County | 28 | Farm No. 6 | 50 MW | 20 | 2.5 MW | 105.0 dB | GE 2.5xl |
| 7 | 11.2 km2 | West Pomeranian Province, Puck County | 102 | Farm No. 7 | 8 MW | 4 | 2 MW | 105.5 dB | Vestas V80 |
| 10 MW | 4 | 2.5 MW | 103.5 dB | Nordex N80 | |||||
| 3.2 MW | 4 | 800 kW | 102.5 dB | Enercon E40 | |||||
| 1.2 MW | 2 | 600 kW | 99.0 dB | WestWind | |||||
| Farm No. 8 | 22 MW | 11 | 2 MW | 105.0 dB | Gamesa G87 T78 | ||||
| 8 | 20.87 km2 | Podlasie Province, Suwalki County | 106 | Farm No. 9 | 41.4 MW | 18 | 2.3 MW | 107.0 dB | Siemens SWT-2.3-93 |
| 9 | 14.55 km2 | Subcarpathia Province, Krosno County | 74 | Farm No. 10 | 36 MW | 18 | 2 MW | 104.2 dB | - |
| Characteristic | Respondents | ||||||
|---|---|---|---|---|---|---|---|
| Total | Noise Category | Distance Category | |||||
| ≤40 dB | 40–45 dB | > 45 dB | ≤400 m | 400–800 m | >800 m | ||
| Age (year) (M ± SD) | 46.7 ± 15.8 | 48.5 ± 15.9 | 46.5 ± 15.7 | 44.4 ± 15.6 | 44.2 ± 15.1 | 47.3 ± 15.8 | 45.8 ± 15.8 |
| Range | 18.0–88.4 | 19.0–88.4 | 18.2–83.3 | 18.0–78.7 | 18.0–78.2 | 19.4–88.4 | 18.2–82.4 |
| Gender: male (%) | 41.8 | 38.2 | 41.5 | 47.4 | 40.8 | 44.1 | 35.5 |
| Occupation (%) | |||||||
| employed | 53.8 | 44.4 a | 55.2 | 62.5 a | 69.4 b | 53.5 | 48.4 b |
| students | 1.7 | 1.5 | 1.7 | 2.1 | 4.1 | 1.4 | 1.6 |
| pensioners | 23.4 | 27.1 | 22.9 | 19.8 | 16.3 | 24.6 | 23.0 |
| farmers | 15.1 | 11.3 | 15.6 | 18.8 | 24.5 | 15.0 | 11.5 |
| Residence: detached houses/farms (%) | 84.8 | 84.5 | 82.7 | 91.6 | 83.7 | 86.4 | 80.8 |
| Sensitive to (%) | |||||||
| noise | 68.3 | 70.3 | 65.2 | 74.5 | 85.4 a | 65.3 a | 69.7 |
| landscape littering | 63.6 | 66.4 | 60.1 | 70.2 | 77.1 | 63.4 | 58.8 |
| air pollution | 65.9 | 76.2 a | 59.7 a | 70.2 | 83.3 a | 61.9 a | 70.0 |
| Negative (%) | |||||||
| Attitude to wind turbines in general | 40.3 | 38.3 a | 38.6 b | 47.3 a,b | 48.9 a | 43.2b | 28.0 a,b |
| Attitude to visual impact of wind turbines | 32.3 | 34.4 | 29.9 | 36.8 | 36.7 | 35.1a | 22.7 a |
| Self-assessment of physical health | 23.0 | 22.7 | 22.3 | 25.3 | 28.6 | 23.4 | 19.7 |
| Self-assessment of hearing status | 15.2 | 13.0 | 17.1 | 12.9 | 11.9 | 17.7 | 9.6 |
| Score in the GHQ-12 (M ± SD) | 12.5 ± 6.1 | 12.3 ± 5.6 | 11.5 ± 4.8 | 12.0 ± 7.6 | 13.3 ± 8.2 | 12.7 ± 6.1 | 11.5 ± 4.8 |
| Range | 1.0–36.0 | 1.0–31.0 | 2.0–36.0 | 2.0–33.0 | 3.0–33.0 | 1.0–36.0 | 5.0–31.0 |
| Respondents (%) | |||||||
| Classified as cases on the basis of the GHQ-12 score | 35.0 | 32.5 | 37.4 | 32.0 | 31.7 | 38.3 | 28.3 |
| Who can see at least one wind turbine from their dwelling | 93.4 | 91.0 | 94.1 | 94.8 | 98.0 | 93.9 | 90.2 |
| With profits from wind turbines | 6.1 | 0.0 a | 6.6 b | 12.6 a,b | 6.1 | 7.9 a | 0.9 a |
| Study group (n) | 517 | 133 | 288 | 96 | 49 | 346 | 122 |
| Spearman’s Rank Correlation Coefficient | |||||||||
|---|---|---|---|---|---|---|---|---|---|
| 1 | 2 | 3 | 4 | 5 | 6 | 7 | 8 | 9 | |
| 1. Age | −0.470 | 0.050 | −0.032 | 0.012 | 0.106 | 0.093 | −0.413 | 0.096 | |
| 2. Education | 0.152 | 0.176 | −0.014 | −0.101 | 0.016 | 0.285 | −0.040 | ||
| 3. Sensitivity to noise | 0.674 | −0.432 | 0.342 | 0.306 | −0.244 | 0.229 | |||
| 4. Sensitivity to landscape littering | −0.508 | 0.464 | 0.438 | −0.222 | 0.318 | ||||
| 5. Opinion about wind turbines impact on health | −0.756 | −0.661 | 0.422 | −0.345 | |||||
| 6. Attitude to wind turbines in general | 0.757 | −0.424 | 0.467 | ||||||
| 7. Attitude to visual impact of wind turbines | −0.260 | 0.337 | |||||||
| 8. Self-assessment of physical health | −0.406 | ||||||||
| 9. Score in the GHQ-12 | |||||||||
| Study Group | Number of Subjects | A-Weighted Sound Pressure Level (dB) | Day-Evening-Night Noise Level, Lden (dB) | Distance (m) |
|---|---|---|---|---|
| M ± SD (Me) | ||||
| Range | ||||
| Total subjects | 517 | 42.1 ± 3.1 (41.7) | 46.8 ± 3.1 (46.4) | 665 ± 194 (656) |
| 33.7–49.9 | 38.4–54.6 | 204–1726 | ||
| Noise category | ||||
| ≤40 dB | 133 | 38.1 ± 1.4 (38.1) | 42.8 ± 1.4 (42.8) | 819 ± 163 (795) |
| 33.7–40.0 | 38.4–44.7 | 353–1726 | ||
| 40–45 dB | 288 | 42.4 ± 1.5 (42.1) | 47.1 ± 1.5 (46.8) | 669 ± 156 (648) |
| 40.1–46.0 | 44.8–50.7 | 235–998 | ||
| >45 dB | 96 | 46.4 ± 1.5 (46.3) | 51.1 ± 1.5 (51.0) | 440 ± 97 (441) |
| 43.6–49.9 | 48.3–54.6 | 204–617 | ||
| Distance category | ||||
| ≤400 m | 49 | 46.3 ± 2.4 (46.7) | 51.0 ± 2.4 (51.4) | 344 ± 51 (365) |
| 39.3–49.9 | 44.0–54.6 | 204–92 | ||
| 400–800 m | 346 | 42.4 ± 2.7 (42.7) | 47.1 ± 2.7 (47.4) | 622 ± 108 (618) |
| 37.0–47.6 | 41.7–52.3 | 403–800 | ||
| >800 | 122 | 39.4 ± 2.2 (40.4) | 44.1 ± 2.2 (45.1) | 915 ± 125 (891) |
| 33.7–42.0 | 38.4–46.7 | 801–1726 | ||
| Environmental Nuisances | Proportion of Respondents (%) | |||
|---|---|---|---|---|
| 95% CI | ||||
| Annoyed | Highly Annoyed | |||
| Outdoors | Indoors | Outdoors | Indoors | |
| Wind turbine noise | 46.4 (42.2–50.7) | 33.7 (29.7–37.8) | 28.0 (24.4–32.1) | 18.4 (15.3–22.0) |
| Road-traffic noise | 28.4 (24.7–32.5) | 18.4 (15.3–22.0) | 12.0 (9.5–15.1) | 9.7 (7.4–12.6) |
| Noise from hand held and stationary power tools | 17.0 (14.0–20.5) | 10.8 (8.4–13.8) | 6.6 (4.7–9.1) | 3.9 (2.5–5.9) |
| Noise from agricultural machinery | 12.8 (10.2–15.9) | 7.7 (5.7–10.4) | 4.3 (2.8–6.4) | 2.5 (1.4–4.3) |
| Odors from agriculture | 18.6 (15.5–22.2) | 6.4 (4.6–8.9) | 7.4 (5.4–10.0) | 2.7 (1.6–4.6) |
| Aircraft noise | 12.8 (10.2–15.9) | 7.2 (5.2–9.7) | 3.9 (2.5–5.9) | 2.9 (1.7–4.8) |
| Odors from industry | 18.2 (15.1–21.8) | 7.0 (5.1–9.5) | 8.9 (6.7–11.7) | 3.7 (2.3–5.7) |
| Railway noise | 0.8 (0.2–2.1) | 1.0 (0.4–2.3) | 0.6 (0.1–1.8) | 0.2 (0.0–1.2) |
| Group of Respondents | Proportion of Respondents (%) | |||||
|---|---|---|---|---|---|---|
| (95% Cl) | ||||||
| Perceived Wind Turbine Noise | Annoyed by Wind Turbine Noise | Highly Annoyed by Wind Turbine Noise | ||||
| Outdoors | Indoors | Outdoors | Indoors | Outdoors | Indoors | |
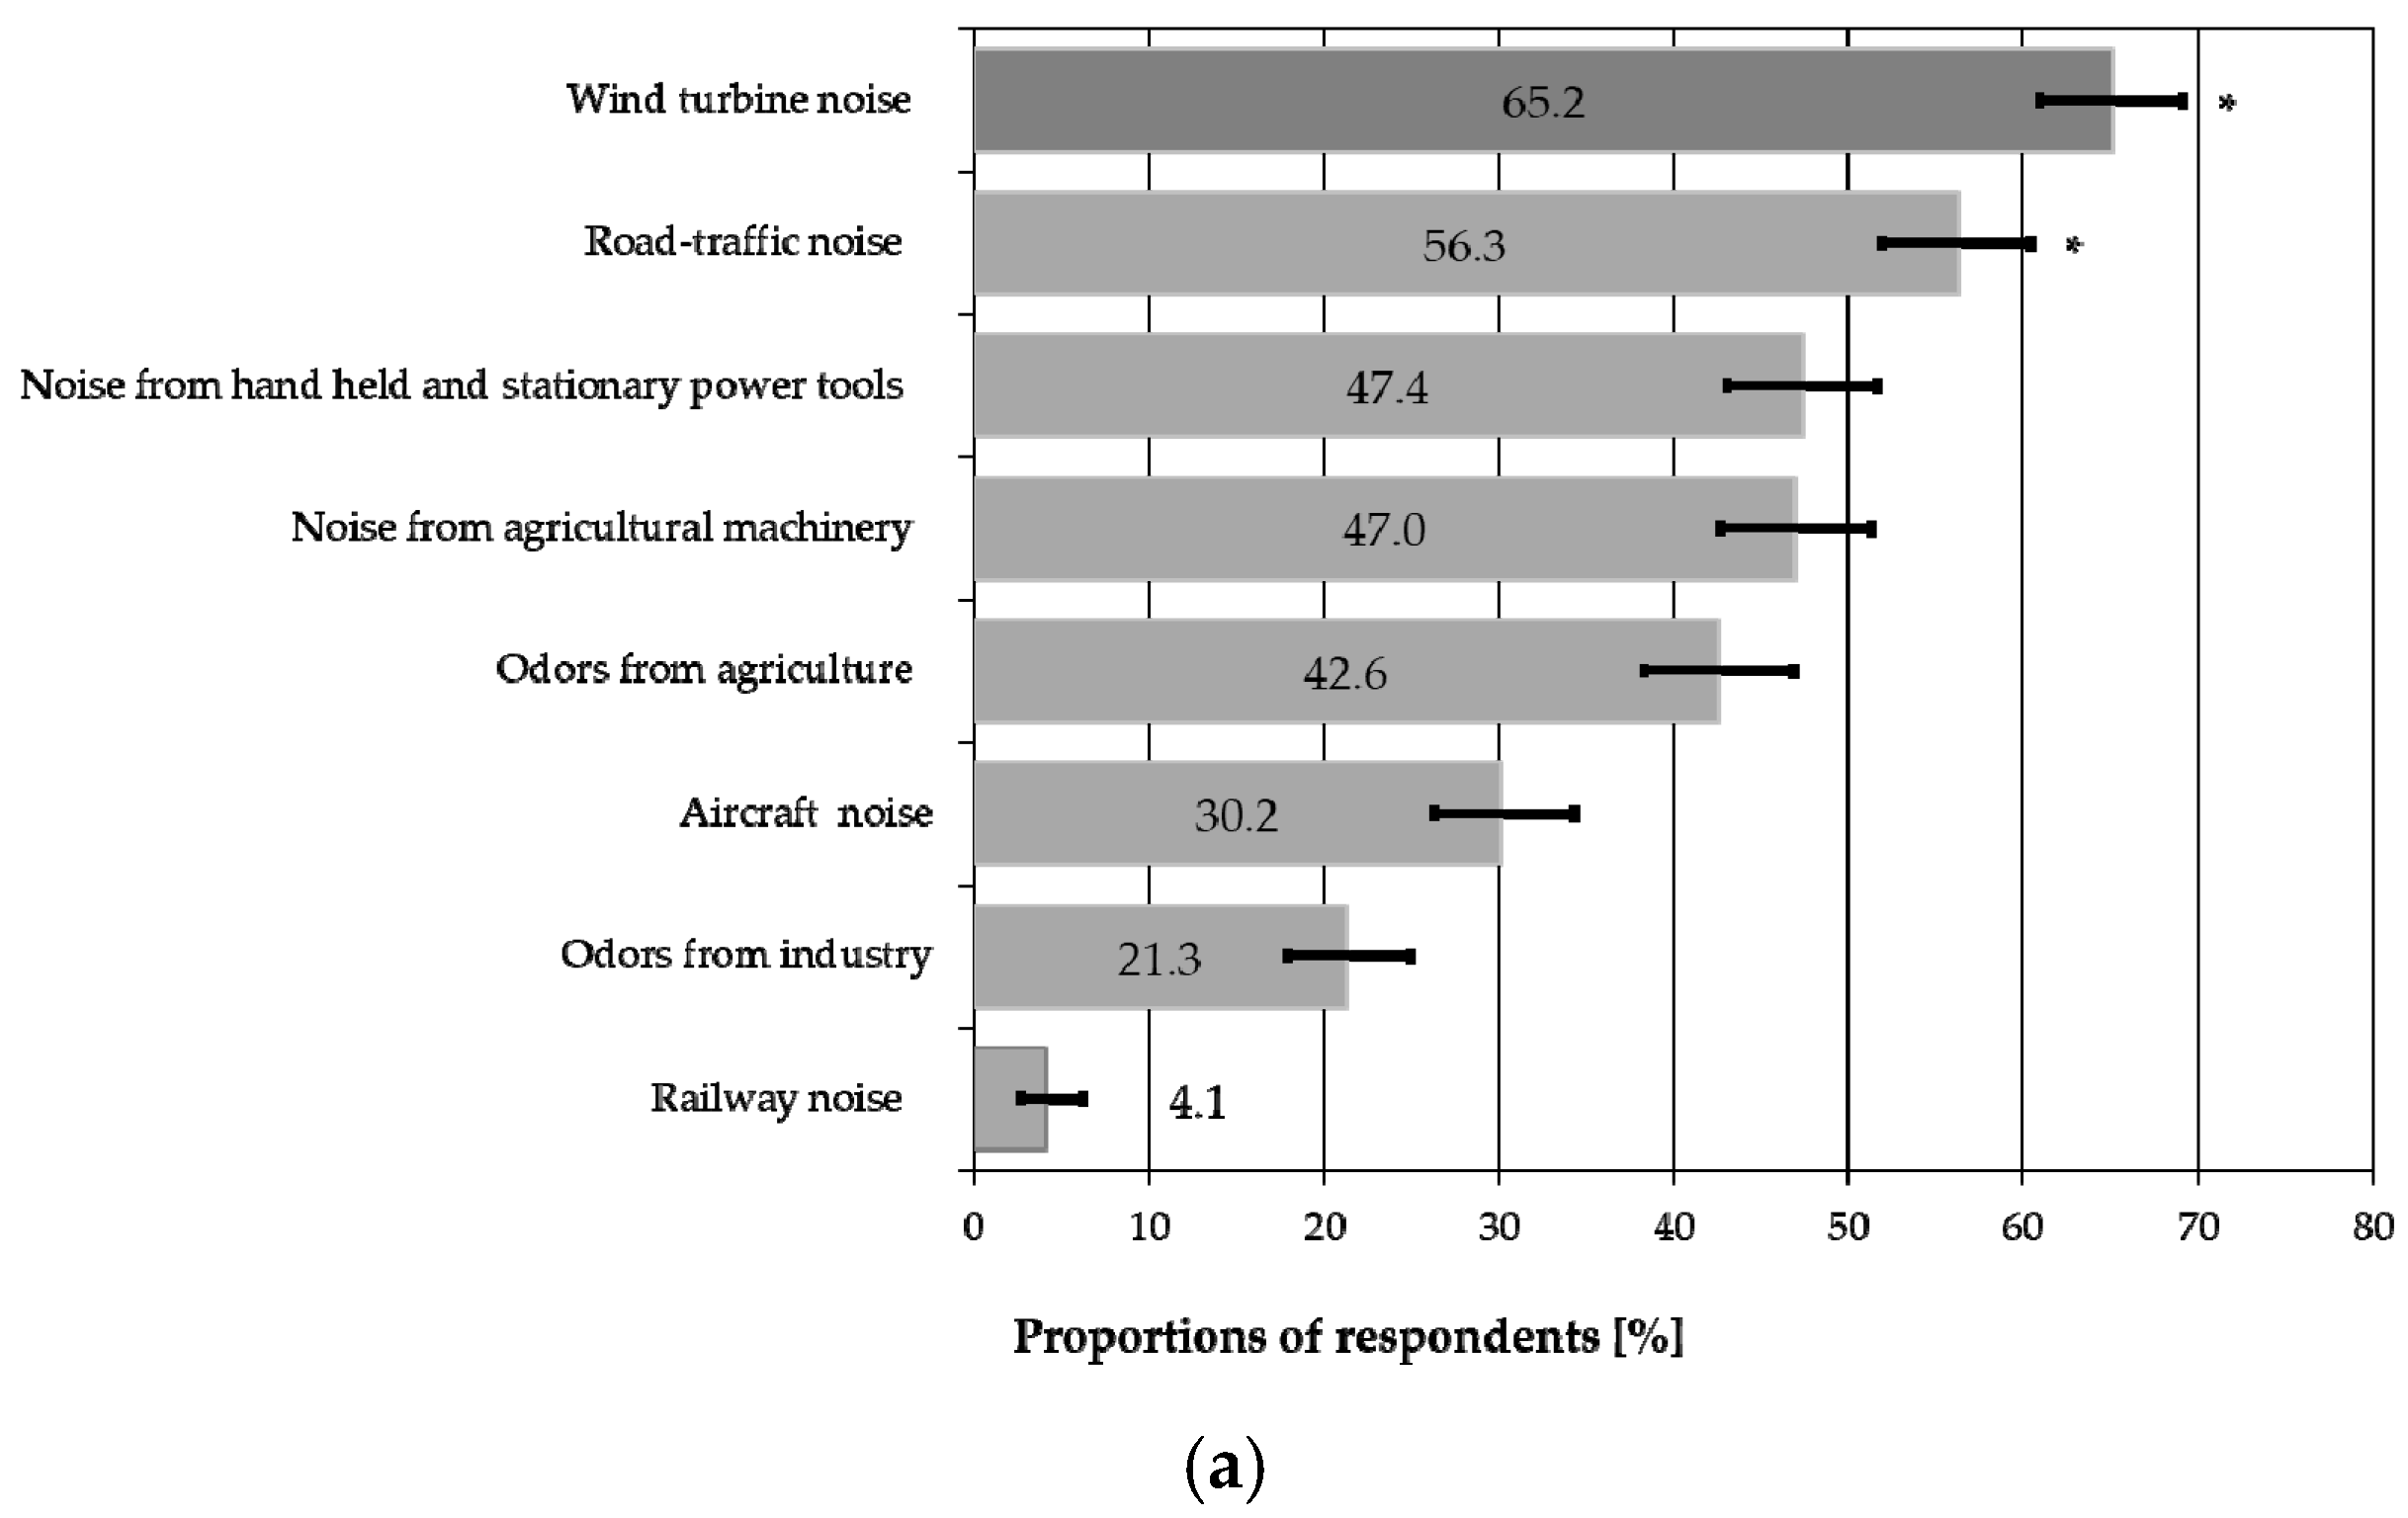
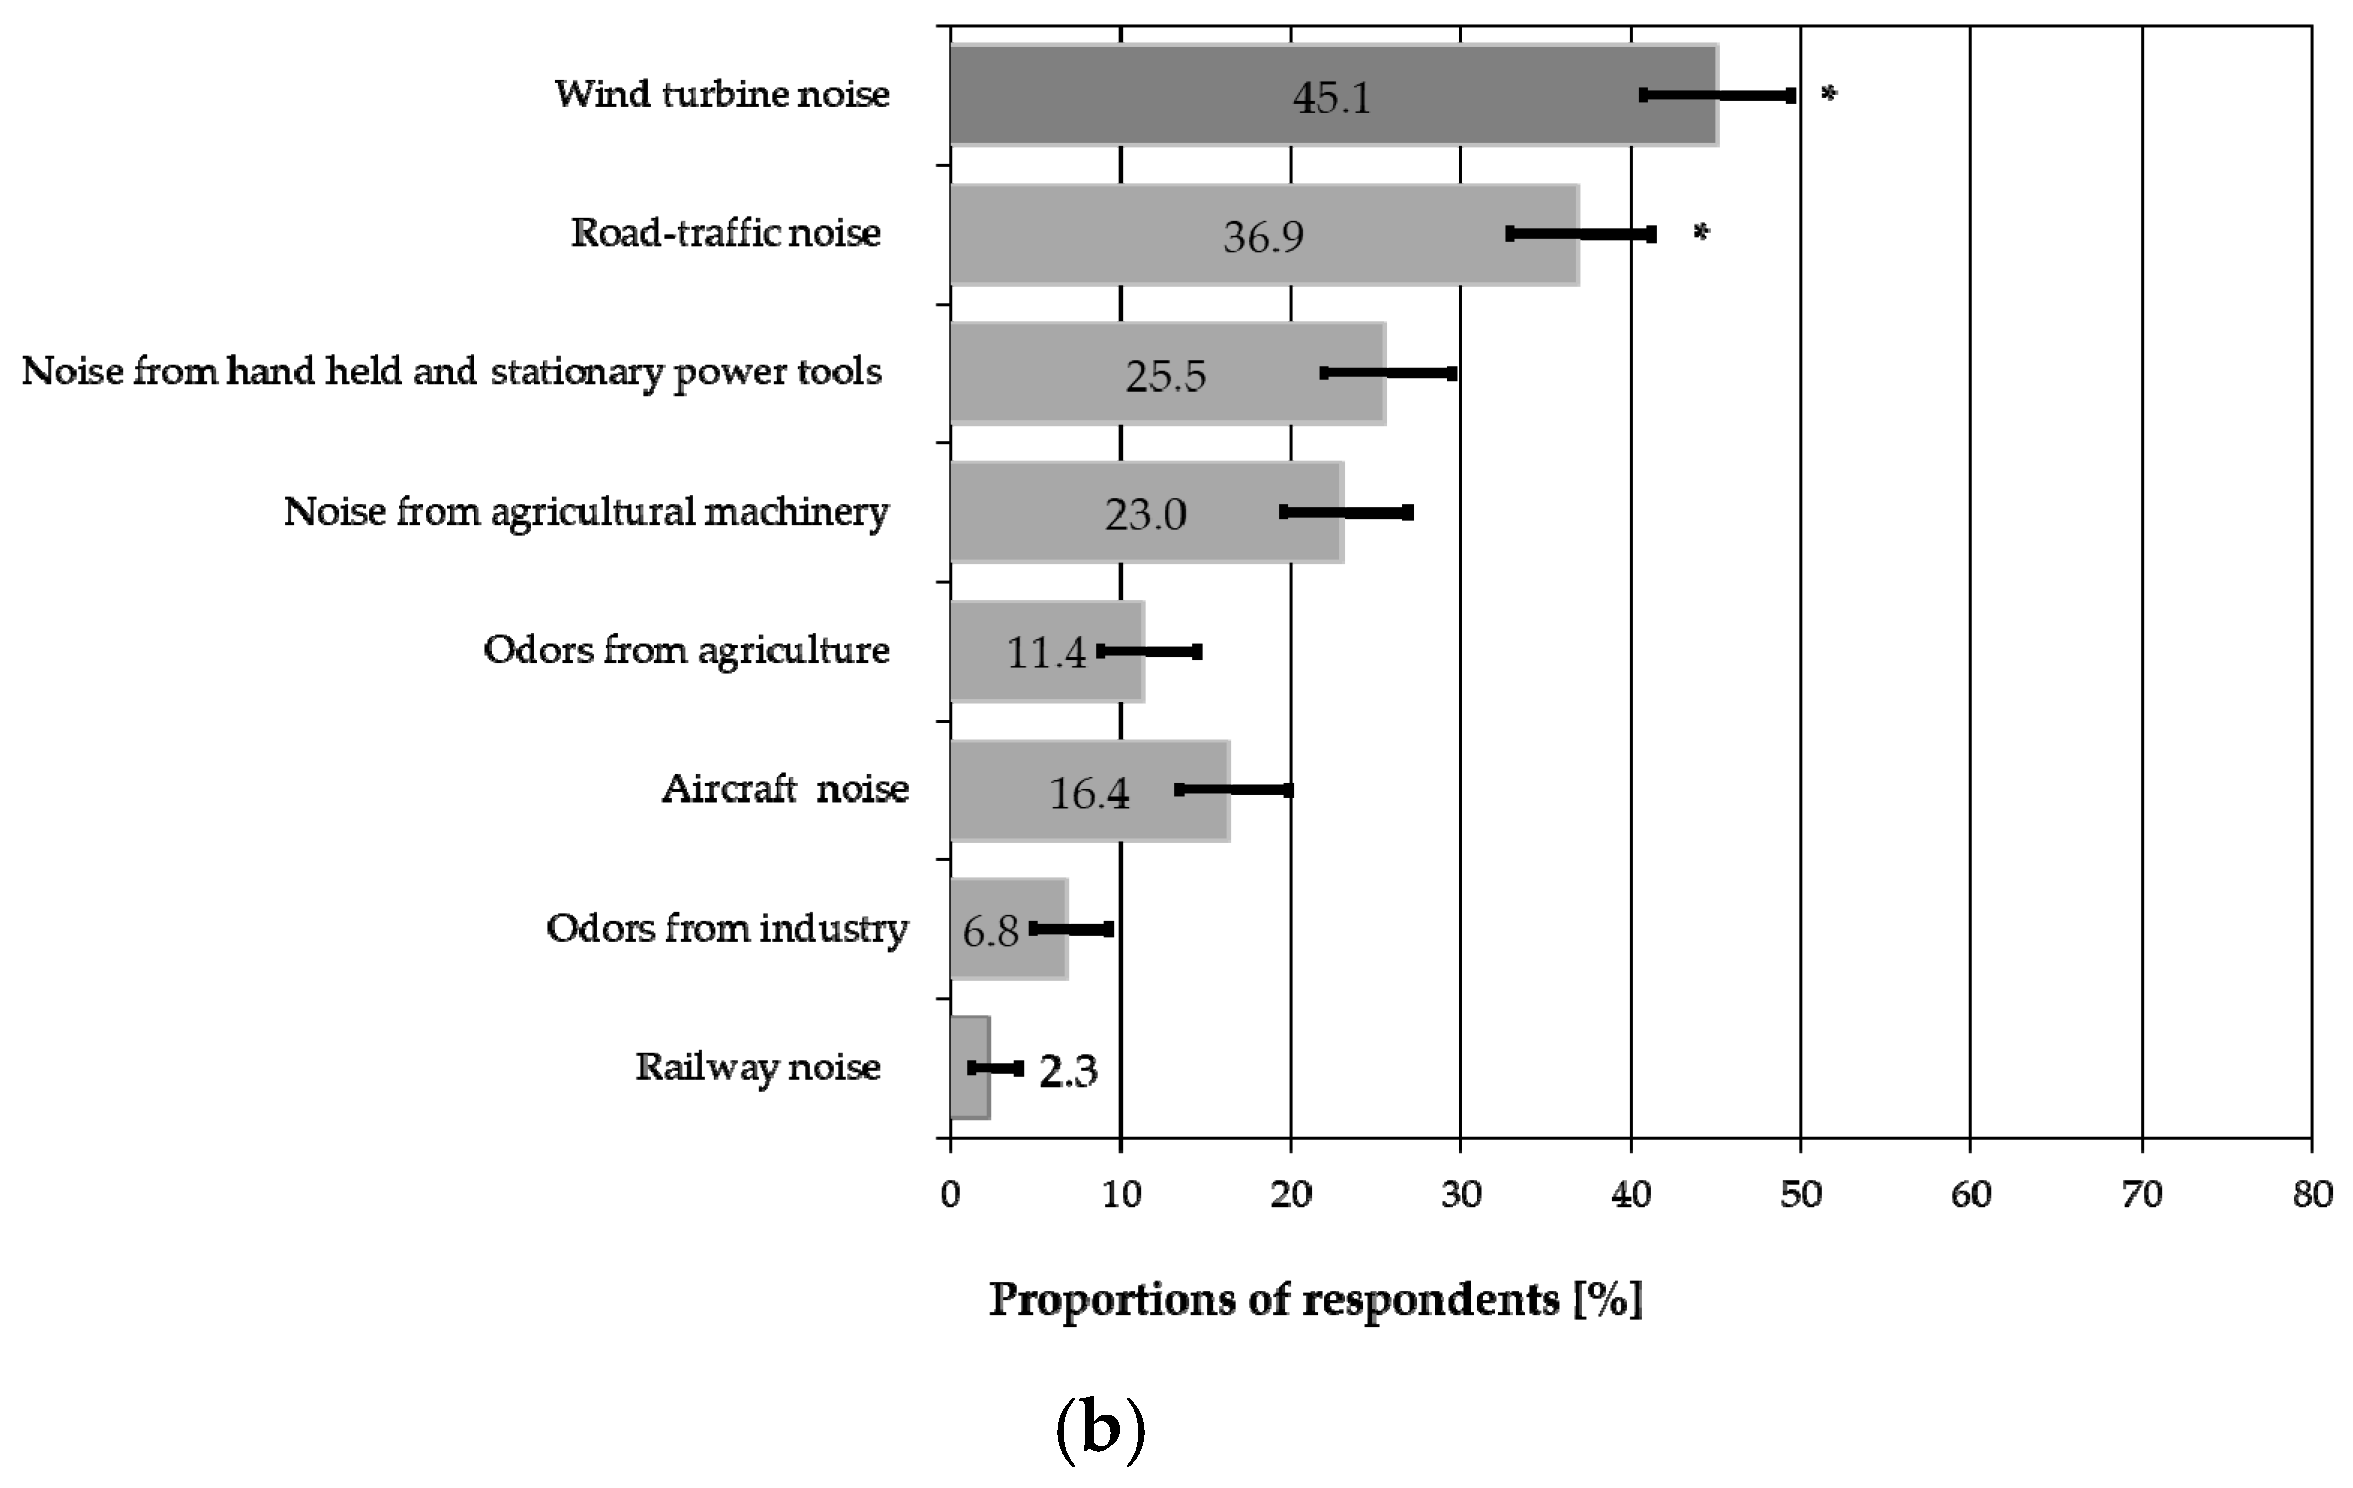
| Total | 65.2 | 45.1 | 46.4 | 33.7 | 28.0 | 18.4 |
| (61.0–69.2) | (40.8–49.4) | (42.2–50.7) | (29.7–37.8) | (24.4–32.1) | (15.3–22.0) | |
| Noise category | ||||||
| ≤40 dB | 67.7 | 42.9 | 47.4 | 28.6 | 24.1 | 14.3 |
| (59.3–75.0) | (34.8–51.4) | (39.1–55.8) | (21.6–36.8) | (17.6–32.1) | (9.3–21.4) | |
| 40–45 dB | 63.2 | 44.1 | 44.4 | 33.3 | 27.1 | 18.8 |
| (57.5–68.6) | (38.5–49.9) | (38.8–50.2) | (28.1–39.0) | (22.3–32.5) | (14.7–23.7) | |
| >45 dB | 67.7 | 51.0 | 51.0 | 41.7 | 36.5 | 22.9 |
| (57.8–76.2) | (41.2–60.8) | (41.2–60.8) | (32.3–51.7) | (27.5–46.5) | (15.6–32.4) | |
| Distance category | ||||||
| ≤400 m | 77.6 | 59.2 | 53.1 | 44.9 | 36.7 | 24.5 |
| (63.9–87.1) | (45.2–71.8) | (39.4–66.3) a | (31.9–58.7) a | (24.7–50.8) a | (14.5–38.3) a | |
| 400–800 m | 66.8 | 50.3 | 50.3 | 37.9 | 30.6 | 21.1 |
| (61.6–71.5) | (45.0–55.5) | (45.0–55.5) | (32.9–43.1) b | (26.0–35.7) b | (17.1–25.7) b | |
| >800 m | 55.7 | 24.6 | 32.8 | 17.2 | 17.2 | 8.2 |
| (46.9–64.2) | (17.8–33.0) | (25.1–41.6) a | (11.5–25.0) a,b | (11.5–25.0) a,b | (4.4–14.6) a,b | |
| Proportion of Respondents (%) | |||||
|---|---|---|---|---|---|
| 95% CI | |||||
| Total | Not Annoyed Outdoors | Annoyed Outdoors | Not Highly Annoyed Outdoors | Highly Annoyed Outdoors | |
| Negative self-assessment of physical health | 23.0 | 11.1 | 36.6 | 14.2 | 23.0 |
| (19.5–26.8) | (7.8–15.4) | (30.7–42.9) | (11.0–18.2) | (19.5–26.8) | |
| Negative self-assessment of hearing status | 15.2 | 6.3 | 24.3 | 8.2 | 15.2 |
| (12.1–19.1) | (3.7–10.7) | (18.9–30.7) | (5.5–12.1) | (12.1–19.1) | |
| Cases according to the GHQ-12 score | 35.0 | 19.9 | 52.6 | 23.8 | 35.0 |
| (30.6–39.8) | (15.2–25.7) | (45.6–59.6) | (19.3–29.0) | (30.6–39.8) | |
| Headache | 21.3 | 11.2 | 32.9 | 14.5 | 21.3 |
| (18.0–25.0) | (8.0–15.5) | (27.3–39.1) | (11.3–18.5) | (18.0–25.0) | |
| Dizziness | 13.0 | 5.8 | 21.3 | 7.0 | 13.0 |
| (10.3–16.2) | (3.5–9.3) | (16.5–26.9) | (4.8–10.1) | (10.3–16.2) | |
| Heartache | 13.0 | 5.8 | 21.3 | 7.8 | 13.0 |
| (10.3–16.2) | (3.5–9.3) | (16.5–26.9) | (5.5–11.0) | (10.3–16.2) | |
| Fatigue (undue tiredness) | 27.1 | 14.1 | 42.1 | 17.5 | 27.1 |
| (23.4–31.1) | (10.5–18.7) | (36.0–48.4) | (14.0–21.7) | (23.4–31.1) | |
| Insomnia | 19.3 | 8.3 | 32.1 | 9.4 | 19.3 |
| (16.2–23.0) | (5.6–12.2) | (26.5–38.2) | (6.8–12.9) | (16.2–23.0) | |
| Pain and stiffness in the back, neck or shoulders | 24.2 | 16.2 | 33.3 | 20.2 | 24.2 |
| (20.7–28.1) | (12.4–21.1) | (27.7–39.5) | (16.4–24.6) | (20.7–28.1) | |
| Pulsation in ears | 8.7 | 1.8 | 16.7 | 3.8 | 8.7 |
| (6.6–11.5) | (0.7–4.3) | (12.5–21.9) | (2.2–6.3) | (6.6–11.5) | |
| Dyspnea | 9.5 | 6.9 | 12.5 | 6.2 | 9.5 |
| (7.2–12.3) | (4.4–10.5) | (8.9–17.4) | (4.1–9.2) | (7.2–12.3) | |
| Nervousness, tension or stress | 28.0 | 16.2 | 41.7 | 18.5 | 28.0 |
| (24.4–32.1) | (12.4–21.1) | (35.6–48.0) | (14.9–22.8) | (24.4–32.1) | |
| Tinnitus | 8.3 | 2.5 | 15.0 | 3.5 | 8.3 |
| (6.2–11.0) | (1.1–5.3) | (11.0–20.1) | (2.0–6.0) | (6.2–11.0) | |
| Waking up well rested | 54.2 | 63.2 | 43.8 | 60.2 | 54.2 |
| (49.8–58.4) | (57.3–68.6) | (37.6–50.1) | (55.2–65.1) | (49.8–58.4) | |
| Having difficulty in falling asleep | 25.1 | 13.4 | 38.8 | 15.9 | 25.1 |
| (21.6–29.1) | (9.8–17.9) | (32.8–45.1) | (12.5–19.9) | (21.6–29.1) | |
| Awakened by noise with closed window | 27.3 | 12.6 | 44.2 | 14.8 | 27.3 |
| (23.6–31.3) | (9.2–17.1) | (38.0–50.5) | (11.5–18.8) | (23.6–31.3) | |
| Awakened by noise with open window | 15.1 | 5.8 | 25.8 | 6.2 | 15.1 |
| (12.3–18.5) | (3.5–9.3) | (20.7–31.7) | (4.1–9.2) | (12.3–18.5) | |
| Awakened by wind turbines | 33.7 | 1.7 | 62.5 | 9.5 | 33.7 |
| (29.0–38.7) | (0.4–5.3) | (55.5–69.0) | (6.4–14.0) | (29.0–38.7) | |
| Explanatory Variables | High Annoyance Outdoors | |||||||
|---|---|---|---|---|---|---|---|---|
| Odds Ratio (95% CI) | p | Odds Ratio (95% CI) | p | Odds Ratio (95% CI) | p | Odds Ratio (95% CI) | p | |
| Age | 1.01 (0.98–1.03) | 0.530 | 1.01 (0.98–1.03) | 0.610 | 1.01 (0.99–1.03) | 0.461 | 1.01 (0.98–1.03) | 0.534 |
| Gender | 1.46 (0.77–2.80) | 0.248 | 1.48 (0.78–2.83) | 0.234 | 1.41 (0.74–2.68) | 0.290 | 1.43 (0.75–2.71) | 0.273 |
| Education | 0.93 (0.68–1.28) | 0.669 | 0.93 (0.67–1.28) | 0.650 | 0.93 (0.68–1.29) | 0.677 | 0.93 (0.68–1.28) | 0.671 |
| Sensitivity to noise | 1.72 (1.19–2.47) | 0.004 | 1.74 (1.21–2.52) | 0.003 | - | - | - | - |
| Sensitivity to landscape littering | - | - | - | - | 1.32 (0.93–1.86) | 0.121 | 1.32 (0.93–1.87) | 0.116 |
| Attitude to wind turbines | 5.02 (3.50–7.21) | 0.000 | 4.99 (3.48–7.16) | 0.000 | 4.91 (3.37–7.14) | 0.000 | 4.88 (3.36–7.09) | 0.000 |
| Sound pressure level | 1.15 (1.03–1.29) | 0.014 | - | - | 1.15 (1.02–1.28) | 0.017 | - | - |
| Distance from the nearest wind turbine | - | - | 0.13 (0.02–0.75) | 0.023 | - | - | 0.16 (0.03–0.90) | 0.038 |
| Power of the nearest wind turbine | 0.65 (0.18–2.30) | 0.503 | 0.58 (0.16–2.11) | 0.411 | 0.74 (0.22–2.52) | 0.626 | 0.67 (0.19–2.33) | 0.526 |
| Height of the nearest wind turbine | 1.02 (0.98–1.06) | 0.283 | 1.04 (1.00–1.08) | 0.077 | 1.02 (0.98–1.06) | 0.370 | 1.03 (0.99–1.08) | 0.123 |
| Duration of wind farm operation | 0.86 (0.69–1.07) | 0.181 | 0.95 (0.78–1.15) | 0.573 | 0.88 (0.71–1.10) | 0.260 | 0.97 (0.80–1.17) | 0.720 |
| Having turbines visible from the dwelling | 0.34 (0.08–1.48) | 0.150 | 0.39 (0.09–1.65) | 0.199 | 0.43 (0.10–1.84) | 0.255 | 0.49 (0.12–2.04) | 0.325 |
| Profits from wind turbines | 1.34 (0.32–5.71) | 0.688 | 1.46 (0.34–6.16) | 0.609 | 1.17 (0.28–4.94) | 0.833 | 1.28 (0.30–5.38) | 0.740 |
| Terrain shape | 2.74 (1.22–6.16) | 0.015 | 2.53 (1.14–5.60) | 0.022 | 3.02 (1.36–6.71) | 0.007 | 2.81 (1.28–6.15) | 0.010 |
| Road-traffic intensity | 1.43 (0.44–4.70) | 0.554 | 1.81 (0.59–5.58) | 0.302 | 1.52 (0.48–4.83) | 0.479 | 1.87 (0.62–5.62) | 0.262 |
| Explanatory Variables | High Annoyance Indoors | |||||||
|---|---|---|---|---|---|---|---|---|
| Odds Ratio (95% CI) | p | Odds Ratio (95% CI) | p | Odds Ratio (95% CI) | p | Odds Ratio (95% CI) | p | |
| Age | 1.03 (1.00–1.05) | 0.026 | 1.02 (1.00–1.05) | 0.031 | 1.03 (1.00–1.05) | 0.023 | 1.02 (1.00–1.05) | 0.028 |
| Gender | 1.14(0.62–2.12) | 0.672 | 1.15 (0.62–2.13) | 0.653 | 1.12 (0.61–2.07) | 0.715 | 1.13 (0.61–2.09) | 0.688 |
| Education | 1.23 (0.90–1.68) | 0.203 | 1.23 (0.89–1.68) | 0.206 | 1.20 (0.87–1.65) | 0.265 | 1.20 (0.88–1.66) | 0.253 |
| Sensitivity to noise | 1.50 (1.03–2.17) | 0.033 | 1.51 (1.04–2.19) | 0.032 | - | - | - | - |
| Sensitivity to landscape littering | - | - | - | - | 1.34 (0.94–1.92) | 0.103 | 1.32 (0.93–1.89) | 0.121 |
| Attitude to wind turbines | 3.43 (2.44–4.82) | 0.000 | 3.39 (2.41–4.76) | 0.000 | 3.38 (2.37–4.82) | 0.000 | 3.37 (2.36–4.80) | 0.000 |
| Sound pressure level | 1.12 (1.01–1.24) | 0.040 | - | - | 1.11 (1.00–1.24) | 0.043 | - | - |
| Distance from the nearest wind turbine | - | - | 0.22 (0.04–1.22) | 0.083 | - | - | 0.25 (0.05–1.38) | 0.112 |
| Power of the nearest wind turbine | 1.11 (0.33–3.72) | 0.867 | 0.99 (0.27–3.70) | 0.989 | 1.18 (0.35–3.96) | 0.784 | 1.07 (0.32–3.61) | 0.917 |
| Height of the nearest wind turbine | 1.01 (0.97–1.05) | 0.679 | 1.02 (0.98–1.06) | 0.351 | 1.01 (0.97–1.05) | 0.768 | 1.02 (0.98–1.06) | 0.411 |
| Duration of wind farm operation | 0.97 (0.82–1.16) | 0.750 | 1.03 (0.89–1.21) | 0.668 | 0.99 (0.83–1.18) | 0.917 | 1.05 (0.90–1.23) | 0.513 |
| Having turbines visible from the dwelling | 0.75 (0.15–3.74) | 0.725 | 0.80 (0.16–3.88) | 0.781 | 0.82 (0.17–4.04) | 0.810 | 0.89 (0.19–4.20) | 0.878 |
| Profits from wind turbines | 0.67 (0.29–1.55) | 0.354 | 0.68(0.30–1.56) | 0.361 | 0.75 (0.33–1.71) | 0.492 | 0.76 (0.33–1.71) | 0.503 |
| Terrain shape | 0.99 (0.21–4.63) | 0.986 | 1.03(0.22–4.79) | 0.965 | 0.96 (0.21–4.37) | 0.954 | 1.01 (0.22–4.66) | 0.990 |
| Road-traffic intensity | 3.65 (1.06–12.61) | 0.04 | 3.96(1.18–13.32) | 0.026 | 3.81 (1.11–13.09) | 0.033 | 4.11 (1.23–13.76) | 0.022 |
| Explanatory Variable | Model No. | Odds Ratio (95% CI) | p | Pseudo-R2 | CCR |
|---|---|---|---|---|---|
| High Annoyance Outdoors | |||||
| Distance | 1 | 0.11 (0.02–0.52) | 0.006 | 0.659 | 87.7 |
| Traffic intensity | 4.23 (2.25–7.97) | 0.000 | |||
| Attitude to wind turbines | 5.45 (3.88–7.64) | 0.000 | |||
| Sensitivity to noise | 1.56 (1.11–2.21) | 0.012 | |||
| Distance | 2 | 0.11 (0.02–0.51) | 0.005 | 0.645 | 87.5 |
| Attitude to wind turbines | 4.43 (2.40–8.19) | 0.000 | |||
| Sensitivity to noise | 6.09 (4.37–8.48) | 0.000 | |||
| Distance | 3 | 0.18 (0.04–0.78) | 0.022 | 0.625 | 87.3 |
| Traffic intensity | 5.94 (4.24–8.34) | 0.000 | |||
| Attitude to wind turbines | 1.69 (1.21–2.36) | 0.002 | |||
| Distance | 4 | 0.18 (0.04–0.75) | 0.019 | 0.606 | 87.3 |
| Attitude to wind turbines | 6.77 (4.85–9.44) | 0.000 | |||
| Distance | 5 | 0.28 (0.09–0.83) | 0.021 | 0.214 | 75.4 |
| Sensitivity to noise | 2.63 (2.02–3.43) | 0.000 | |||
| Distance | 6 | 0.29 (0.10–0.86) | 0.027 | 0.174 | 72.7 |
| Traffic intensity | 5.34 (3.40–8.39) | 0.000 | |||
| Distance | 7 | 0.33 (0.12–0.92) | 0.034 | 0.013 | 72.0 |
| Sound pressure level | 8 | 1.14 (1.03–1.25) | 0.008 | 0.658 | 87.5 |
| Traffic intensity | 4.08 (2.19–7.60) | 0.000 | |||
| Attitude to wind turbines | 5.62 (3.98–7.92) | 0.000 | |||
| Sensitivity to noise | 1.54 (1.09–2.17) | 0.014 | |||
| Sound pressure level | 9 | 1.15 (1.05–1.27) | 0.003 | 0.646 | 88.1 |
| Attitude to wind turbines | 4.31 (2.35–7.90) | 0.000 | |||
| Sensitivity to noise | 6.32 (4.50–8.87) | 0.000 | |||
| Sound pressure level | 10 | 1.11 (1.02–1.22) | 0.023 | 0.625 | 86.3 |
| Traffic intensity | 6.01 (4.28–8.44) | 0.000 | |||
| Attitude to wind turbines | 1.68 (1.21–2.34) | 0.002 | |||
| Sound pressure level | 11 | 1.13 (1.03–1.23) | 0.010 | 0.608 | 86.5 |
| Attitude to wind turbines | 6.87 (4.91–9.60) | 0.000 | |||
| Sound pressure level | 12 | 0.28 (0.09–0.83) | 0.021 | 0.214 | 75.4 |
| Sensitivity to noise | 2.63 (2.02–3.43) | 0.000 | |||
| Sound pressure level | 13 | 1.06 (1.00–1.13) | 0.071 | 0.170 | 72.0 |
| Traffic intensity | 5.29 (3.37–8.29) | 0.000 | |||
| Sound pressure level | 14 | 1.09 (1.01–1.17) | 0.071 | 0.009 | 72.0 |
| Explanatory Variable | Model No. | Odds Ratio (95% CI) | p | Pseudo-R2 | CCR |
|---|---|---|---|---|---|
| High Annoyance Indoors | |||||
| Distance | 1 | 0.29 (0.06–1.29) | 0.103 | 0.476 | 86.7 |
| Traffic intensity | 3.43 (1.33–8.84) | 0.011 | |||
| Attitude to wind turbines | 3.40 (2.51–4.61) | 0.000 | |||
| Sensitivity to noise | 1.51 (1.05–2.16) | 0.024 | |||
| Distance | 2 | 0.21 (0.05–0.93) | 0.040 | 0.458 | 86.5 |
| Attitude to wind turbines | 3.73 (2.76–5.05) | 0.000 | |||
| Sensitivity to noise | 1.47 (1.04–2.08) | 0.028 | |||
| Distance | 3 | 0.27 (0.06–1.20) | 0.085 | 0.463 | 87.1 |
| Traffic intensity | 3.21 (1.26–8.13) | 0.014 | |||
| Attitude to wind turbines | 3.90 (2.90–5.24) | 0.000 | |||
| Distance | 4 | 0.20 (0.04–0.90) | 0.036 | 0.446 | 87.3 |
| Attitude to wind turbines | 4.27 (3.18–5.71) | 0.000 | |||
| Distance | 5 | 0.22 (0.06–0.76) | 0.017 | 0.168 | 69.9 |
| Sensitivity to noise | 2.50 (1.83–3.40) | 0.000 | |||
| Distance | 6 | 0.34 (0.10–1.18) | 0.089 | 0.125 | 81.6 |
| Traffic intensity | 7.59 (3.23–17.85) | 0.000 | |||
| Distance | 7 | 0.23 (0.07–0.77) | 0.017 | 0.019 | 81.6 |
| Sound pressure level | 8 | 1.10 (1.00–1.20) | 0.039 | 0.480 | 86.7 |
| Traffic intensity | 3.72 (1.45–9.52) | 0.006 | |||
| Attitude to wind turbines | 3.41 (2.52–4.61) | 0.000 | |||
| Sensitivity to noise | 1.50 (1.05–2.14) | 0.027 | |||
| Sound pressure level | 9 | 1.10 (1.01–1.20) | 0.033 | 0.458 | 63.4 |
| Attitude to wind turbines | 3.76 (2.78–5.09) | 0.000 | |||
| Sensitivity to noise | 1.46 (1.04–2.05) | 0.031 | |||
| Sound pressure level | 10 | 1.11 (1.01–1.21) | 0.025 | 0.468 | 87.1 |
| Traffic intensity | 3.52 (1.40–8.87) | 0.008 | |||
| Attitude to wind turbines | 3.89 (2.90–5.22) | 0.000 | |||
| Sound pressure level | 11 | 1.11 (1.01–1.21) | 0.024 | 0.448 | 87.5 |
| Attitude to wind turbines | 4.29 (3.20–5.75) | 0.000 | |||
| Sound pressure level | 12 | 1.08 (1.01–1.17) | 0.031 | 0.164 | 81.0 |
| Sensitivity to noise | 2.48 (1.82–3.37) | 0.000 | |||
| Sound pressure level | 13 | 1.08 (1.01–1.16) | 0.029 | 0.130 | 87.1 |
| Traffic intensity | 7.96 (3.39–18.70) | 0.000 | |||
| Sound pressure level | 14 | 1.09 (1.01–1.17) | 0.022 | 0.017 | 81.6 |
| Constant | SE | p | Distance | SE | p | Terrain Shape | SE | p | Attitude to Wind Turbines | SE | p | Sensitivity to Noise | SE | p | |
| 1 | −5.494 | 0.768 | 0.000 | −2.218 | 0.796 | 0.006 | 1.443 | 0.322 | 0.000 | 1.695 | 0.172 | 0.000 | 0.446 | 0.176 | 0.012 |
| 2 | −4.581 | 0.650 | 0.000 | −2.212 | 0.781 | 0.005 | 1.489 | 0.313 | 0.000 | 1.806 | 0.168 | 0.000 | − | − | − |
| 3 | −5.409 | 0.758 | 0.000 | −1.717 | 0.748 | 0.022 | − | − | − | 1.782 | 0.172 | 0.000 | 0.525 | 0.170 | 0.002 |
| 4 | −4.290 | 0.632 | 0.000 | −1.725 | 0.732 | 0.019 | − | − | − | 1.912 | 0.170 | 0.000 | − | − | − |
| 5 | −1.148 | 0.402 | 0.004 | −1.244 | 0.559 | 0.027 | 1.676 | 0.230 | 0.000 | − | − | − | − | − | − |
| 6 | −2.788 | 0.540 | 0.000 | −1.277 | 0.554 | 0.022 | − | − | − | − | − | − | 0.968 | 0.135 | 0.000 |
| 7 | −0.208 | 0.354 | 0.556 | −1.119 | 0.525 | 0.034 | − | − | − | − | − | − | − | − | − |
| Constant | SE | p | Sound Pressure Level | SE | p | Terrain Shape | SE | p | Attitude to Wind Turbines | SE | p | Sensitivity Noise | SE | p | |
| 8 | −12.368 | 2.258 | 0.000 | 0.129 | 0.048 | 0.008 | 1.405 | 0.317 | 0.000 | 1.726 | 0.175 | 0.000 | 0.431 | 0.174 | 0.014 |
| 9 | −12.046 | 2.200 | 0.000 | 0.141 | 0.048 | 0.003 | 1.461 | 0.308 | 0.000 | 1.844 | 0.172 | 0.000 | − | − | − |
| 10 | −11.067 | 2.141 | 0.000 | 0.107 | 0.047 | 0.023 | − | − | − | 1.794 | 0.173 | 0.000 | 0.519 | 0.168 | 0.002 |
| 11 | −10.496 | 2.066 | 0.000 | 0.120 | 0.046 | 0.010 | − | − | − | 1.927 | 0.171 | 0.000 | − | − | − |
| 12 | −6.112 | 1.480 | 0.000 | 0.059 | 0.033 | 0.075 | − | − | − | − | − | − | 0.961 | 0.134 | 0.000 |
| 13 | −4.375 | 1.356 | 0.001 | 0.057 | 0.032 | 0.071 | 1.666 | 0.229 | 0.000 | − | − | − | − | − | − |
| 14 | −3.354 | 1.338 | 0.013 | 0.057 | 0.032 | 0.071 | − | − | − | − | − | − | − | − | − |
| Model No. | Constant | SE | p | Distance | SE | p | Traffic Intensity | SE | p | Attitude to Wind Turbines | SE | p | Sensitivity to Noise | SE | p |
| 1 | −5.904 | 0.911 | 0.000 | −1.247 | 0.764 | 0.103 | 1.231 | 0.482 | 0.011 | 1.224 | 0.154 | 0.000 | 0.411 | 0.182 | 0.024 |
| 2 | −4.846 | 0.770 | 0.000 | −1.556 | 0.757 | 0.040 | − | − | − | 1.316 | 0.154 | 0.000 | 0.386 | 0.176 | 0.028 |
| 3 | −4.994 | 0.785 | 0.000 | −1.328 | 0.769 | 0.085 | 1.165 | 0.474 | 0.014 | 1.361 | 0.150 | 0.000 | − | − | − |
| 4 | −4.076 | 0.670 | 0.000 | −1.613 | 0.766 | 0.036 | − | − | − | 1.451 | 0.149 | 0.000 | − | − | − |
| 5 | −3.111 | 0.636 | 0.000 | −1.519 | 0.636 | 0.017 | − | − | − | − | − | − | 0.915 | 0.158 | 0.000 |
| 6 | −2.472 | 0.592 | 0.000 | −1.065 | 0.625 | 0.089 | 2.027 | 0.435 | 0.000 | − | − | − | − | − | − |
| 7 | −0.528 | 0.408 | 0.196 | −1.486 | 0.620 | 0.017 | − | − | − | − | − | − | − | − | − |
| Constant | SE | p | Sound Pressure Level | SE | p | Traffic Intensity | SE | p | Attitude to Wind Turbines | SE | p | Sensitivity to Noise | SE | p | |
| 8 | −10.701 | 2.059 | 0.000 | 0.093 | 0.045 | 0.039 | 1.314 | 0.478 | 0.006 | 1.225 | 0.154 | 0.000 | 0.403 | 0.182 | 0.027 |
| 9 | −9.903 | 2.013 | 0.000 | 0.096 | 0.045 | 0.033 | − | − | − | 1.325 | 0.154 | 0.000 | 0.378 | 0.174 | 0.031 |
| 10 | −10.170 | 2.009 | 0.000 | 0.101 | 0.045 | 0.025 | 1.258 | 0.470 | 0.008 | 1.359 | 0.150 | 0.000 | − | − | − |
| 11 | −9.415 | 1.967 | 0.000 | 0.101 | 0.045 | 0.024 | − | − | − | 1.457 | 0.149 | 0.000 | − | − | − |
| 12 | −7.502 | 1.682 | 0.000 | 0.081 | 0.038 | 0.031 | − | − | − | − | − | − | 0.908 | 0.157 | 0.000 |
| 13 | −6.533 | 1.584 | 0.000 | 0.079 | 0.036 | 0.029 | 2.075 | 0.434 | 0.000 | − | − | − | − | − | − |
| 14 | −5.075 | 1.574 | 0.001 | 0.085 | 0.037 | 0.022 | − | − | − | − | − | − | − | − | − |
| Explanatory Variable | ||||||
|---|---|---|---|---|---|---|
| Odds Ratio (95% CI) | ||||||
| Distance a | Highly Annoyed Outdoors b | Highly Annoyed Indoors b | A–weighted Sound Pressure Level a | Highly Annoyed Outdoors c | Highly Annoyed Indoors c | |
| Negative self–assessment of physical health | 0.51 (0.16–1.67) | 5.48 (3.38–8.88) | 7.05 (4.15–12.01) | 1.05 (0.98–1.13) | 5.46 (3.37–8.83) | 6.99 (4.11–11.87) |
| Negative self–assessment of hearing status | 0.63 (0.13–3.06) | 4.77 (2.61–8.73) | 5.71 (3.03–10.75) | 1.06 (0.97–1.16) | 4.64 (2.55–8.47) | 5.46 (2.92–10.24) |
| “Cases” according to the GHQ–12 score | 0.58 (0.20–1.64) | 5.36 (3.34–8.59) | 4.68 (2.75–7.98) | 1.04 (0.98–1.11) | 5.30 (3.31–8.49) | 4.62 (2.72–7.85) |
| Headache | 0.68 (0.22–2.11) | 3.99 (2.50–6.36) | 4.07 (2.44–6.77) | 1.00 (0.93–1.07) | 4.04 (2.53–6.43) | 4.16 (2.50–6.93) |
| Dizziness | 0.27 (0.06–1.11) | 5.31 (3.04–9.29) | 5.99 (3.38–10.63) | 1.05 (0.97–1.14) | 5.41 (3.10–9.45) | 6.12 (3.45–10.85) |
| Heartache | 0.68 (0.17–2.83) | 4.36 (2.48–7.65) | 4.47 (2.48–8.05) | 0.98 (0.90–1.07) | 4.45 (2.54–7.80) | 4.64 (2.58–8.37) |
| Fatigue (undue tiredness) | 0.86 (0.30–2.47) | 5.36 (3.42–8.39) | 4.33 (2.65–7.09) | 0.98 (0.92–1.04) | 5.46 (3.48–8.55) | 4.48 (2.73–7.34) |
| Insomnia | 0.37 (0.11–1.26) | 8.37 (5.02–13.95) | 5.90 (3.50–9.94) | 1.03 (0.96–1.11) | 8.51 (5.11–14.18) | 6.05 (3.58–10.20) |
| Pain and stiffness in back. neck or shoulders | 0.57 (0.19–1.75) | 1.97 (1.25–3.08) | 2.07 (1.25–3.43) | 1.01 (0.95–1.08) | 1.99 (1.27–3.12) | 2.11 (1.27–3.49) |
| Pulsation in ears | 0.86 (0.16–4.73) | 6.57 (3.30–13.08) | 5.42 (2.77–10.61) | 1.01 (0.91–1.11) | 6.51 (3.28–12.93) | 5.40 (2.76–10.54) |
| Dyspnea | 0.89 (0.17–4.81) | 3.13 (1.66–5.93) | 4.78 (2.46–9.30) | 0.97 (0.88–1.07) | 3.19 (1.69–6.03) | 4.95 (2.54–9.64) |
| Nervousness. tension or stressed | 0.48 (0.17–1.35) | 5.00 (3.23–7.74) | 4.20 (2.59–6.81) | 1.01 (0.95–1.07) | 5.12 (3.31–7.92) | 4.35 (2.68–7.05) |
| Tinnitus | 0.59 (0.10–3.49) | 6.68 (3.28–13.59) | 5.94 (2.97–11.85) | 1.00 (0.91–1.11) | 6.76 (3.33–13.74) | 6.08 (3.05–12.13) |
| Respondent woke up well–rested | 0.79 (0.32–1.96) | 0.42 (0.28–0.62) | 0.50 (0.32–0.80) | 1.01 (0.95–1.06) | 0.42 (0.28–0.63) | 0.51 (0.32–0.81) |
| Difficulty in falling asleep | 0.85 (0.29–2.48) | 5.59 (3.55–8.80) | 5.26 (3.20–8.65) | 1.04 (0.97–1.11) | 5.47 (3.48–8.60) | 5.13 (3.13–8.42) |
| Awakened by noise with open window | 1.08 (0.39–2.99) | 8.38 (5.35–13.12) | 8.13 (4.93–13.39) | 1.01 (0.95–1.07) | 8.20 (5.26–12.79) | 7.99 (4.85–13.14) |
| Awakened by noise with closed window | 0.94 (0.25–3.49) | 9.00 (5.18–15.62) | 7.76 (4.49–13.40) | 1.02 (0.95–1.11) | 8.78 (5.07–15.19) | 7.55 (4.38–13.01) |
| Awakened by wind turbines | 0.94 (0.25–3.49) | 38.03 (20.36–71.02) | 19.50 (10.10–37.64) | 1.03 (0.96–1.11) | 38.17 (20.44–71.28) | 19.87 (10.27–38.42) |
© 2018 by the authors. Licensee MDPI, Basel, Switzerland. This article is an open access article distributed under the terms and conditions of the Creative Commons Attribution (CC BY) license (http://creativecommons.org/licenses/by/4.0/).
Share and Cite
Pawlaczyk-Łuszczyńska, M.; Zaborowski, K.; Dudarewicz, A.; Zamojska-Daniszewska, M.; Waszkowska, M. Response to Noise Emitted by Wind Farms in People Living in Nearby Areas. Int. J. Environ. Res. Public Health 2018, 15, 1575. https://doi.org/10.3390/ijerph15081575
Pawlaczyk-Łuszczyńska M, Zaborowski K, Dudarewicz A, Zamojska-Daniszewska M, Waszkowska M. Response to Noise Emitted by Wind Farms in People Living in Nearby Areas. International Journal of Environmental Research and Public Health. 2018; 15(8):1575. https://doi.org/10.3390/ijerph15081575
Chicago/Turabian StylePawlaczyk-Łuszczyńska, Małgorzata, Kamil Zaborowski, Adam Dudarewicz, Małgorzata Zamojska-Daniszewska, and Małgorzata Waszkowska. 2018. "Response to Noise Emitted by Wind Farms in People Living in Nearby Areas" International Journal of Environmental Research and Public Health 15, no. 8: 1575. https://doi.org/10.3390/ijerph15081575