Abstract
Little research has been done to evaluate the occupational health of electronic waste (e-waste) recycling workers in Latin America. The objective of this study was to complete comprehensive health evaluations on e-waste recycling workers in Chile and to compare those that work in informal (i.e., independent) to those that work in formal (i.e., established company) settings. A cross-sectional study in the summer of 2017 recruited 78 informal recycling workers from two cities and 15 formal e-waste recycling workers from a single recycling facility to assess exposures and health outcomes. Participants completed a health questionnaire and underwent a full health assessment. Herein, only health questionnaire data are reported. Participants were primarily male, middle-aged, married with children, and had worked in e-waste recycling for an average of 12 years. Participants generally reported good health status, and their prevalence of chronic diseases was comparable to national rates. Workers frequently reported exposures to several occupational stressors, including noise and insufficient income, as well as other mental health stressors. Occupational injuries were commonly reported and use of safety equipment was low. Only a few significant differences, generally of a rather small magnitude, were found between informal and formal workers. In conclusion, from survey data, we did not identify major risks to health among e-waste workers, and only minor differences between workers in informal and formal settings.
1. Introduction
The World Health Organization (WHO) has declared the production of electronic waste (e-waste) to be a growing global environmental health problem [1,2,3,4,5]. In 2005, annual e-waste generation was estimated at 35 million tons. This figure is increasing, and greater production occurs in developed countries, with later transfer to low- and middle-income countries for reuse or recycling [6]. E-waste is defined as comprising discarded, nonworking electronic products—e.g., cell phones, computers, and home appliances— and their components, which are no longer considered useful by the owner or manufacturer [7]. They are a source of hazardous constituents, such as heavy metals, but also valuable materials, including copper, gold, silver, and rare earth metals [1].
E-waste recycling occurs in formal and informal settings [2]. Formal settings involve well-established recycling plants specifically designed for recycling electronics, with at least some proper ventilation and protection for the workers laboring on them. Such facilities recycle between 12% and 35% of all e-waste generated in developed countries [7]. Informal recycling, on the other hand, tends to involve independent workers, or small groups of workers or families—sometimes including children—who often use hazardous techniques such as cutting, acid baths, heating/smelting, and open burning of materials, without the use of personal protection equipment or engineering controls [2,8]. Informal recycling occurs more often in developing countries. Generally, formal recycling of e-waste is considered better for workers and the environment when compared to informal recycling [9].
Conditions often present in informal recycling are associated with increased risks to human and environment health, which has heightened awareness in the scientific communities and governmental agencies [1,2,5]. Human exposure to the pollutants of e-waste recycling is not isolated to the occupational setting and can spill into the environment of the general population, which can include vulnerable populations such as children and pregnant women living in or near informal recycling sites [2,3]. These exposures have been linked to a range of health effects, including disrupted thyroid function and cellular expression, adverse neonatal effects, and decreased lung function, among others [3].
Environmental contamination issues associated with e-waste recycling have been described worldwide [2], as have e-waste disposal policy options, e-waste reduction strategies, and, to a lesser degree, human health impacts of e-waste [2]. Studies focusing mainly on informal recyclers have been conducted in middle–lower income countries such as China [10,11], Ghana [12,13], and Vietnam [14], and have subsequently found high levels of endocrine disruptors and heavy metals in samples of hair, urine, and blood [2]. In China, these contaminants have been found at high levels in the surrounding population as well, specifically in samples from human placenta, breast milk, and blood [15,16,17,18]. On the other hand, among formal recyclers in higher income countries like France [19], Sweden [9] and the United States [20], high levels of heavy metals have been reported in blood, urine, skin, and clothing. While studies have investigated exposures for informal e-waste workers from low-income countries in Asia and Africa, little is known about these exposures in middle- and high-income countries outside the United States and Europe. Very little is known in Latin America, with the exception of a study in Uruguay in a pediatric population [21]. Additionally, while several studies have assessed contamination or human health impacts, few have examined the association between exposure and health outcomes, and even fewer have evaluated these associations among both informal and formal e-waste recycling workers.
As of 2017, Chile had a population of over 17 million inhabitants. It is highly urbanized (>87%) and centralized, with more than 41% of the total population living in the capital city of Santiago [22]. The gross domestic product (GDP) has substantially increased in the past fifteen years, reaching US$247,028 billion in 2016 [23], promoted by a neoliberal market economy [24,25]. The model has positioned Chile as one of the most economically developed countries in the region and a member of the Organization for Economic Cooperation and Development (OECD). However, the Chilean economy is also one of the most unequal in the world, with a Gini coefficient of 0.50 [26]. Chile’s accelerated growth has boosted the technological sector and demand for new electronics. This has resulted in the highest per capita production of e-waste in Latin America, at 9.9 kg per person per year [27]. As a consequence, a small, formal recycling industry has emerged, and, since 2016, new e-waste recycling laws have been passed that regulate certification recycling companies and include Extended Producer Responsibility (EPR) requirements [27,28].
Despite the presence of legislation addressing e-waste recycling, informal recyclers operate in the country, though the full extent of their operations is unknown. Informal recycling networks usually include collectors, who collect e-waste from residential areas and companies; recyclers, who dismantle e-waste into their constituent parts and recover valuable materials; scrap dealers, who buy raw materials and products from recyclers and collectors; and repair shops, which use parts salvaged by recyclers to repair broken goods to return them to use. The overall objective of this study is to complete comprehensive health evaluations of e-waste recycling workers in Chile and compare those that work informally (i.e., in independent settings) to those that work formally (i.e., in well-established companies). The nature and location of e-waste activities done by workers in Chile, particularly those in the informal sector, is unknown. Therefore, the first challenge was to identify and recruit informal and formal workers willing to participate. This study was conducted shortly after the passage of e-waste disposal regulations in Chile; therefore, our study represents a baseline comparison between formal and informal e-waste recycling workers.
2. Methods
2.1. Study Design and Sites
A cross-sectional study was conducted from July to August 2017. Since the overall population of informal workers is unknown, this study utilized convenience sampling of workers from two cities of the country where informal recycling was thought to occur at significant levels. The two cities sampled were Santiago, the largest city in the country, and Temuco, a mid-size city of about 300,000 inhabitants [22] (Figure 1). To recruit informal workers, in a first step, several network of workers were contacted to identify sections of the cities where recycling activities were usually performed. Then, these sections were visited by field personnel in order to contact individuals for recruitment purposes. On the other hand, formal workers were recruited from a single mid-size formal recycling facility.
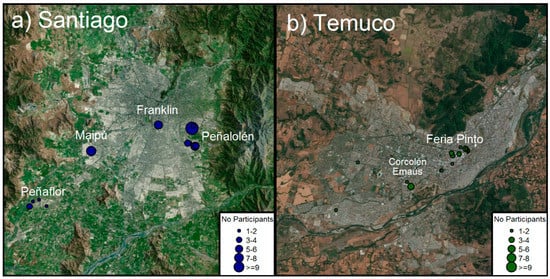
Figure 1.
Study site: (a) map of Santiago; (b) map of Temuco.
2.2. Participant Recruitment
In June and July 2017, informal sites were identified across the two cities at e-waste collection sites, repair shops, public fairs, and flea markets. In July and August 2017, each site was visited and potential participants were identified. Potential participants were then screened to confirm that they fell into one of the recycling activities targeted in our study (i.e., collectors, recyclers, repairers, or scrap dealers). For formal workers, a recycling company was contacted, and authorization was requested from the owner to carry out the study. In both settings, research staff explained the study objectives, procedures, and measurements to potential participants in detail, and interested individuals then signed a Spanish-language consent form.
2.3. Health Assessment
Participant data collection in Santiago, Temuco, and at the formal recycling company took place in August 2017. Since e-waste work is related to several different kinds of exposure (e.g., air pollution, noise, stress, injuries) and many potential health outcomes as shown in previous studies [2], the questionnaire and exposure assessment was comprehensive. Table 1 summarizes the full set of procedures participants completed in the study. All participants were asked to complete a questionnaire and health assessment, provide blood and urine samples, undergo air sampling and noise monitoring, and complete a daily activity log. This manuscript will focus only on the results from the questionnaire. Four items from the questionnaire were drawn from Cohen’s perceived stress scale; these items addressed the frequency with which participants: felt unable to control important things in life; were confident about personal ability to handle problems; felt things were going their way; and felt they could not overcome difficulties [29].

Table 1.
Summary of participant activities.
Additionally, a subset of participants also provided surface wipe samples in their homes or workplaces, were filmed for later activity analysis, and participated in focus groups designed to explore particular aspects of informal e-waste recycling. These activities will be described elsewhere.
The study protocol was approved by Health Sciences and Behavioral Sciences Institutional Review Board (IRB-HSBS) of the University of Michigan (Study eResearch ID: HUM00114562), and the Ethics Committee for Research in Human Beings of the Faculty of Medicine, University of Chile (approval 101-2017).
2.4. Data Analysis
An initial exploratory analysis was performed to identify, and correct, typing errors and missing values. Then, descriptive analysis of the variables was carried out using absolute and relative frequencies, for categorical variables, and measures of central tendency and dispersion, for continuous ones. Differences between sites and types of recyclers were explored using chi-squared test (χ2) and analysis of variance (ANOVA), with a significance level of p < 0.05.
3. Results
3.1. Sociodemographic and Occupational Characteristics of the Population
From the initial 190 people invited, 93 agreed to participate: 53 informal recyclers in Santiago, 25 informal recyclers in Temuco, and 15 workers at the formal recycling company (Figure 1). In Santiago, participants were mainly clustered around four sites: Peñalolén, Peñaflor, Maipú, and Persa Bío-Bío, with participants from Peñalolén, Peñaflor, and Maipú being mostly collectors and recyclers, and those from Persa Bío-Bío being mostly repairers. In Temuco, participants were clustered around three sites: Feria Pinto, Corcolén Park, and Emmaus, with participants from Feria Pinto and Emmaus being mostly repairers, and those at Corcolén being recyclers. The 15 participants from the formal recycling plant were mostly operators, with some administrative staff, working in all sections of the recycling process (sorting, dismantling, shredding, packaging, shipping).
Sociodemographic characteristics of the participants are shown in Table 2. Most participants (74%) were male, with an average age of 47 years, and lived in households of approximately four people. About half of the participants were married with children. Their education level included primarily basic (8 years) or medium school (12 years); only 16% reached higher education with college or technical degrees. Informal workers were slightly more likely to be male, and were slightly older than formal workers. E-waste recycling was the main source of income for most participants (83%). More than one-third of participants (37%) reported other sources of income. Monthly income was around US$500, which is above the minimum salary in Chile (i.e. US$445 per month). More than 20% of participants reported income above US$1000. Notably, there was no difference in reported income between formal and informal workers. Overall, participants had low-to-medium income and were similar to workers in other technical jobs in Chile [30].
Table 2.
Sociodemographic characteristics of the study population, by job type and site.
Work history was evaluated and presented in Table 3. Most participants were currently employed (97%) and working in e-waste related jobs (99%). They had been involved in e-waste activities for approximately 12 years on average, and most (61%) worked 5–8 hours per day in a 6-day work week on average. The most commonly reported e-waste activities were recycling (62%), collecting (34%), repairing (31%), and dealing scrap (25%). Participants identified their primary role in the e-waste processes as recyclers (46%), collectors (42%), repairers (34%), and scrap dealing (10%). Compared to informal workers, formal workers worked in direct recycling activities, had e-waste work as their main source of income, and had been working in this sector for a shorter time (<2 years on average).
Table 3.
Work history and recycling activities, by job type and site.
3.2. Self-Reported Health
Results for self-reported health are shown in Table 4. Overall, most participants (>60%) assessed their health status as good or better, with a small fraction (~30%) reporting fair or poor health. The most commonly reported acute conditions (>20% reporting occasionally or frequently experiencing these conditions) were headache or dizziness, abnormal heart beat, breathing problems, and nausea or stomach ache in the previous two weeks. A small fraction of the participants (~5%) reported more serious symptoms such as blood in urine and blood in stool. Only a fraction of the workers (~30%) sought medical treatment for any these conditions, mostly in the formal health care system.
Table 4.
Health characteristics of the study population, by job type and site.
Regarding chronic conditions, 31% of participants were current smokers, consistent with the national prevalence of smoking in Chile (33.3%) [31]. Most participants did not report chronic diseases. Among those who did, the most common were high blood pressure (26%), diabetes mellitus (14%), and asthma (5.4%). Medication use was common among participants with these conditions. A small fraction of participants (16%) reported that they suffer conditions that limit their work and a surprisingly high amount (22%) reported unintentional weight loss during the past year. Few significant differences were found when comparing formal and informal workers.
3.3. Self-Reported Personal and Occupational Stressors
Personal and occupational stressors are reported in Table 5. Slightly more than 40% of participants felt they were sometimes or very often unable to control important matters in their lives and that they could not overcome difficulties. Insufficient income to support themselves and their families was also reported by 59% of participants. However, most workers reported that they decide their work methods (77%), that they have not experienced violence or harassment at work (83%) and that work does not interfere with their family responsibilities or leisure time (62%). Slightly more formal workers reported that income was not sufficient to support the family (p = 0.029); however, the difference was fairly small.
Table 5.
Self-reported personal and occupational stressors in the study population, by job type and site.
Self-reported exposure to noise is shown in Table 6. A majority (59%) of participants reported working in loud noise sometimes or more often than sometimes, with an average duration of 8.8 ± 11 years. Several participants reported difficulty hearing (28%) that had started in adulthood (89%). However, diagnosis of hearing loss by a medical professional was rare among workers (8.6%). Finally, approximately one-third of workers reported experiencing tinnitus after being exposed to loud noise. Informal workers reported having worked in conditions of loud noise for approximately 2.5 times longer (approximately 9 years) on average than formal workers (3.6 years).
Table 6.
Self-reported noise exposure in the study population, by job type and site.
3.4. Self-Reported Occupational Injuries
Participants reported an average of 3 ± 7.1 occupational injuries in the past six months (Table 7). Reported injuries included cuts and lacerations (31%), contusions and abrasions (16%), and puncture wounds (8.6%) most frequently and most often occurred to workers’ hands (38%) and feet or lower legs (16%). Most participants did not receive formal medical care to treat their wounds (69%) while a small fraction (14%) received treatment at a hospital or clinic. Most workers did not miss work due to their injuries (76%) but among those who did miss work, 35% lost five or more days. The most frequent activities at the time of injury were dismantling (32%), sorting (16%) and collecting (8.6%) e-waste.
Table 7.
Self-report injuries in the study population, by job type and site.
Most participants reported that tools and e-waste components (59%) or work tasks (53%) were what caused their injuries. Only 17% of participants reported receiving instruction or training on how to prevent injuries (17%). The use of safety equipment was relatively rare. While 57% of workers reported wearing leather/rubber gloves and 50% reported wearing rubber-soled boots or shoes, only about one-third wore safety glasses or a face shield, and only 16% wore a dust mask. Finally, approximately half (51%) reported moderate pain (visual analogous scale, VAS 4.9 ± 2.0) in their hands or wrists after working with e-waste. Slightly higher prevalence (61%) was found for reported muscle soreness from sitting in the same position. When comparing formal and informal workers we found that formal workers reported less injuries that required less medical care of any kind. Formal workers also reported more frequent use of leather/rubber gloves and rubber-soled boots or shoes than informal workers. Formal workers reported significantly lower intensity of muscle soreness but not prevalence of muscle soreness when compared to informal workers.
4. Discussion
While a number of studies of informal e-waste recycling workers have been conducted worldwide [2], little is known about this industry in middle- and high-income countries outside United States and Europe. Our study of 93 workers appears to be the first study of e-waste recyclers in Chile, and adds to the very sparse literature on e-waste recycling in Latin America [21]. Informal sector participants in this study worked for more than a decade, on average, suggesting that this industry has emerged relatively recently in Chile. Workers generally reported good overall health status and the prevalence of chronic diseases reported was comparable to national levels. Although workers reported several stressors, insufficient income to support themselves and their families was the most common issue among all participants. The prevalence of injuries was high (an average of three injuries in the past 6 months), and the use of protective equipment was generally low. The most common injuries were cuts and lacerations to the hands that occurred during the dismantling of e-waste products. Beyond visible injuries, participants reported experiencing pain in their hands and muscle soreness often after e-waste recycling work. The majority of workers reported being exposed to high levels of noise at least sometimes. We found few differences between informal and formal recycling workers; formal workers were slightly younger, more likely to work mainly as recyclers, and had less experience working with e-waste than did the informal workers.
Studies of informal e-waste recycling workers have been conducted in Ghana [12,13,32] China [10,11], Vietnam [14], and India [4]. As with our study, these workers were mostly male, except in Vietnam where workers were mostly female; however, workers in other studies were generally less educated, younger, and had a lower income with longer and more unstable working hours than participants in Chile. Workers in Ghana [32] worked in e-waste recycling for less time than Chilean workers. E-waste recycling activities most often reported by informal workers in other countries included collecting, dismantling, and scraping, while in Chile there was a high prevalence of repairing and reselling of e-waste as well. Health effects and behaviors also differed between our sample and those conducted on informal e-waste recycling workers outside of Chile. A study conducted in Ghana [32] suggests that e-waste recycling workers there smoked less in comparison to our sample, but reported more cardiovascular symptoms. The informal workers in our study reported a range of symptoms that is generally consistent with a previous study [4] that showed informal e-waste recycling work is associated with diseases in the skin, stomach, respiratory tract and other organs. Other existing studies did not report on these conditions and their relation to e-waste recycling.
Studies of formal e-waste recycling workers are uncommon. A handful of such studies have been conducted in the United States [20], France [19], and Sweden [9]. Only the Swedish study characterized its population but did not describe their primary recycling activities. Formal e-waste recycling workers in Chile were mainly involved in recycling activities such as sorting, scraping, dismantling, and baling, which were all activities previously described for other studies of formal workers [9,19,20]. None of these studies had a health history evaluation, so no relevant comparison could be made.
Occupational exposure to stressors among informal e-waste recycling workers assessed in Ghana [32], reported moderate to high levels of stress, work in unfavorable physical conditions, as well as violence or harassment in their occupational environment, and insufficient income to support themselves for most participants. Chilean informal e-waste recycling workers did not report substantial exposures to occupational stressors, violence, or harassment. However, our Chilean participants did commonly report insufficient income to support themselves and their families. Informal e-waste recyclers in Ghana [32] reported greater intensity of occupational noise exposure, while Chilean workers reported longer noise exposure times. Difficulty hearing and reported diagnosis of a hearing loss was twice as frequent among Chilean informal e-waste workers as compared to Ghanaians [32]. We did not identify other studies that quantified occupational injuries among e-waste recycling workers. Overall, it appears that exposure to stressors, and their health impacts, may be lower in Chile than in similar studies performed in developing nations.
There are limitations to our study that may reduce the generalizability of our findings. First, the representativeness of our sample is unknown, as the workforce of Chilean e-waste recyclers is not well understood, especially in the informal sector. We tried to obtain the most representative sample possible by searching for participants in both informal and formal settings and across several cities in Chile. Second, our finding that workers did not report major health problems may simply be a reflection of the healthy worker effect [33]. Third, our cross-sectional assessment of exposures and health status may not accurately capture changes in these factors that have occurred over time, or the long-term average status and can therefore not prove causality. Finally, it is possible that participant responses were subject to social desirability bias, which could partially explain both the low health risks and the differences found between formal and informal.
5. Conclusions
Our study is among the first to directly compare exposures and health status among formal and informal e-waste recycling workers anywhere, and the first study of e-waste recyclers in Chile. The results of our questionnaire indicated that e-waste workers in Chile did not present major chronic health effects but rather small effect for injuries and stress, with the latter possibly due to income insecurity. Only a few significant differences, generally of a rather small magnitude, were found between informal and formal workers.
Electronic waste recycling in Chile seems to differ from other studied areas in the methods of reuse as well as the population that participates in the sector. Further research is needed to fully understand and evaluate the long-term impact of both formal and informal sectors in Chile. However, this research, in combination with previously published literature, lends credence to the idea that e-waste recycling differs significantly by country and in each case should be considered a special context. Therefore, to establish country-specific and appropriate policies and safety measures while simultaneously maintaining economic flexibility for those involved, evaluation and understanding of the context should be completed first. Finally, by providing a baseline assessment of exposures and health conditions among informal and formal e-waste recycling workers, we have established a comparison point for subsequent studies both to evaluate the impacts of the new e-waste recycling law in Chile and to compare it with other contexts and countries over time.
Supplementary Materials
The following are available online at http://www.mdpi.com/1660-4601/16/3/386/s1. Table S1. Symptoms experienced in the last 2 weeks of the study population, by job type and site; Table S2. Self-report of stress in the study population, by job type and site.
Author Contributions
R.L.N. is the principal investigator and conceived and designed the study, acquired funding, and undertook a critical revision of the manuscript. K.Y., D.P.-G. (Daniela Pinto-Galleguillos), D.P.-G. (Denisse Parra-Giordano), and P.R.-R. carried out the data collection plan, data analyses, data interpretation, wrote the manuscript, and undertook a critical revision of the manuscript. A.A. (Amaranta Agost), M.V., L.M.S., K.G., A.A. (Aubrey Arain), and F.R. were involved in the data collection plan, data collection, and revision to the manuscript.
Funding
This works has been supported by a grant from the Graham Sustainable Institute of the University of Michigan.
Acknowledgments
This study was funded by the University of Michigan Graham Sustainability Institute. The authors wish to thank the participating workers, without whom this study would not have been possible. The authors are also indebted to the following individuals for their assistance with data collection: Alejandra Parra, Daniela Gonzalez, Suzanne Chou, Alexandra Clayton, Margaux Empey, and Liliane Bentley.
Conflicts of Interest
No potential conflict of interest was reported by the authors.
References
- Heacock, M.; Kelly, C.B.; Asante, K.A.; Birnbaum, L.S.; Bergman, Å.L.; Bruné, M.-N.; Buka, I.; Carpenter, D.O.; Chen, A.; Huo, X.; et al. E-Waste and Harm to Vulnerable Populations: A Growing Global Problem. Environ. Health Perspect. 2016, 124, 550–555. [Google Scholar] [CrossRef] [PubMed]
- Bakhiyi, B.; Gravel, S.; Ceballos, D.; Flynn, M.A.; Zayed, J. Has the question of e-waste opened a Pandora’s box? An overview of unpredictable issues and challenges. Environ. Int. 2018, 110, 173–192. [Google Scholar] [CrossRef] [PubMed]
- Grant, K.; Goldizen, F.C.; Sly, P.D.; Brune, M.N.; Neira, M.; van den Berg, M.; Norman, R.E. Health consequences of exposure to e-waste: A systematic review. Lancet Glob. Heal. 2013, 1. [Google Scholar] [CrossRef]
- Lundgren, K. The global Impact of e-Waste: Addressing the Challenge; International Labour Organization: Geneva, Switzerland, 2012; ISBN 9789221268970. [Google Scholar]
- Kiddee, P.; Naidu, R.; Wong, M.H. Electronic waste management approaches: An overview. Waste Manag. 2013, 33, 1237–1250. [Google Scholar] [CrossRef] [PubMed]
- Breivik, K.; Armitage, J.M.; Wania, F.; Jones, K.C. Tracking the Global Generation and Exports of e-Waste. Do Existing Estimates Add up? Environ. Sci. Technol. 2014, 48, 8735–8743. [Google Scholar] [CrossRef] [PubMed]
- Baldé, C.P.; Wang, F.; Kuehr, R.; Huisman, J. The Global E-Waste Monitor 2014; United Nations University, IAS—SCYCLE: Bonn, Germany, 2015; ISBN 9789280845556. [Google Scholar]
- Gu, Y.; Wu, Y.; Xu, M.; Wang, H.; Zuo, T. The stability and profitability of the informal WEEE collector in developing countries: A case study of China. Resour. Conserv. Recycl. 2016, 107, 18–26. [Google Scholar] [CrossRef]
- Julander, A.; Lundgren, L.; Skare, L.; Grander, M.; Palm, B.; Vahter, M.; Liden, C. Formal recycling of e-waste leads to increased exposure to toxic metals: An occupational exposure study from Sweden. Environ. Int. 2014, 73, 243–251. [Google Scholar] [CrossRef]
- Chen, K.; Zheng, J.; Yan, X.; Yu, L.; Luo, X.; Peng, X.; Yu, Y.; Yang, Z.; Mai, B. Dechlorane Plus in paired hair and serum samples from e-waste workers: Correlation and differences. Chemosphere 2015, 123, 43–47. [Google Scholar] [CrossRef]
- Zheng, J.; Yan, X.; Chen, S.J.; Peng, X.W.; Hu, G.C.; Chen, K.H.; Luo, X.J.; Mai, B.X.; Yang, Z.Y. Polychlorinated biphenyls in human hair at an e-waste site in China: Composition profiles and chiral signatures in comparison to dust. Environ. Int. 2013, 54, 128–133. [Google Scholar] [CrossRef]
- Carlson, K. Electronic Waste Worker Health. In Proceedings of the Eighth International Conference on Information and Communication Technologies and Development—ICTD ‘16; ACM Press: New York, NY, USA, 2016; pp. 1–4. [Google Scholar]
- Srigboh, R.K.; Basu, N.; Stephens, J.; Asampong, E.; Perkins, M.; Neitzel, R.L.; Fobil, J. Multiple elemental exposures amongst workers at the Agbogbloshie electronic waste (e-waste) site in Ghana. Chemosphere 2016, 164, 68–74. [Google Scholar] [CrossRef]
- Eguchi, A.; Nomiyama, K.; Minh Tue, N.; Trang, P.T.K.; Hung Viet, P.; Takahashi, S.; Tanabe, S. Residue profiles of organohalogen compounds in human serum from e-waste recycling sites in North Vietnam: Association with thyroid hormone levels. Environ. Res. 2015, 137, 440–449. [Google Scholar] [CrossRef] [PubMed]
- Xu, L.; Huo, X.; Zhang, Y.; Li, W.; Zhang, J.; Xu, X. Polybrominated diphenyl ethers in human placenta associated with neonatal physiological development at a typical e-waste recycling area in China. Environ. Pollut. 2015, 196, 414–422. [Google Scholar] [CrossRef] [PubMed]
- Xu, L.; Ge, J.; Huo, X.; Zhang, Y.; Lau, A.T.Y.; Xu, X. Differential proteomic expression of human placenta and fetal development following e-waste lead and cadmium exposure in utero. Sci. Total Environ. 2016, 550, 1163–1170. [Google Scholar] [CrossRef] [PubMed]
- Li, X.; Tian, Y.; Zhang, Y.; Ben, Y.; Lv, Q. Accumulation of polybrominated diphenyl ethers in breast milk of women from an e-waste recycling center in China. J. Environ. Sci. (China) 2017, 52, 305–313. [Google Scholar] [CrossRef] [PubMed]
- Lin, X.; Xu, X.; Zeng, X.; Xu, L.; Zeng, Z.; Huo, X. Decreased vaccine antibody titers following exposure to multiple metals and metalloids in e-waste-exposed preschool children. Environ. Pollut. 2017, 220, 354–363. [Google Scholar] [CrossRef] [PubMed]
- Lecler, M.-T.; Zimmermann, F.; Silvente, E.; Clerc, F.; Chollot, A.; Grosjean, J. Exposure to hazardous substances in Cathode Ray Tube (CRT) recycling sites in France. Waste Manag. 2015, 39, 226–235. [Google Scholar] [CrossRef] [PubMed]
- Ceballos, D.; Beaucham, C.; Page, E. Metal exposures at three U.S. electronic scrap recycling facilities. J. Occup. Environ. Hyg. 2017, 14, 401–408. [Google Scholar] [CrossRef]
- Pascale, A.; Sosa, A.; Bares, C.; Battocletti, A.; Moll, M.J.; Pose, D.; Laborde, A.; González, H.; Feola, G. E-Waste Informal Recycling: An Emerging Source of Lead Exposure in South America. Ann. Glob. Heal. 2016, 82, 197–201. [Google Scholar] [CrossRef] [PubMed]
- National Statistics Institute 2017 Census results. Available online: http://www.censo2017.cl (accessed on 12 June 2018).
- World Bank Economic data of Chile. Available online: https://www.worldbank.org/en/country/chile (accessed on 12 June 2018).
- Project biography of Chile History of Chile: recent history, neoliberal model. Available online: http://www.biografiadechile.cl/detalle.php?IdContenido=527&IdCategoria=23&IdArea=155&TituloPagina=Historia%20de%20Chile (accessed on 14 June 2018).
- Solimano, A. Capitalismo a la Chilena. Y la Prosperidad de las élites; Editorial Catalonia: Catalonia, Spain, 2012; ISBN 9789563241426. [Google Scholar]
- OECD. In it together, why less inequality benefits all in Chile. Available online: http://www.oecd.org/social/in-it-together-why-less-inequality-benefits-all-9789264235120-en.htm (accessed on 14 June 2018).
- Magalini, F.; Kuehr, R.; Baldé, C.P. eWaste en América Latina. eWaste en Am. Lat. 2015, 1–38. Available online: https://www.gsma.com/latinamerica/wp-content/uploads/2015/11/gsma-unu-ewaste2015-spa.pdf (accessed on 10 June 2018).
- Alarcón Espinoza, K.S.; Moraga Sariego, P. Gestión y Tratamiento Jurídico de los Residuos de Aparatos Eléctricos y Electrónicos, en el Contexto de la Regulación Genérica de los Residuos Sólidos en Chile; University of Chile: San Diego, CA, USA, 2012. [Google Scholar]
- Cohen, S.; Kamarck, T.; Mermelstein, R. A Global Measure of Perceived Stress. J. Health Soc. Behav. 1983, 24, 385–396. [Google Scholar] [CrossRef]
- Vallebuona, C. Primera Encuesta Nacional de Condiciones de Empleo, Equidad, Trabajo, Salud y Calidad de Vida de los Trabajadores y Trabajadoras en Chile, ENETS; Santiago, Chile, 2011; Available online: http://www.dt.gob.cl/portal/1629/articles-99630_recurso_1.pdf (accessed on 26 June 2018).
- Ministry of Health National health survey 2016-2017, first results. Available online: https://www.minsal.cl/wp-content/uploads/2017/11/ENS-2016-17_PRIMEROS-RESULTADOS.pdf (accessed on 26 June 2018).
- Burns, K.N.; Sun, K.; Fobil, J.N.; Neitzel, R.L. Heart Rate, Stress, and Occupational Noise Exposure among ElectronicWaste Recycling Workers. Int. J. Environ. Res. Public Health 2016, 13, 140. [Google Scholar] [CrossRef]
- Chowdhury, R.; Shah, D.; Payal, A. Healthy worker effect phenomenon: Revisited with emphasis on statistical methods—A review. Indian J. Occup. Environ. Med. 2017, 21, 2. [Google Scholar] [CrossRef] [PubMed]
© 2019 by the authors. Licensee MDPI, Basel, Switzerland. This article is an open access article distributed under the terms and conditions of the Creative Commons Attribution (CC BY) license (http://creativecommons.org/licenses/by/4.0/).