A Mass Transfer Analysis of Competitive Binding of Pb, Cd, and Zn from Binary Systems onto a Fixed Zeolite Bed


Abstract
:
1. Introduction
2. Materials and Methods
2.1. Zeolite Sample
2.2. Solutions
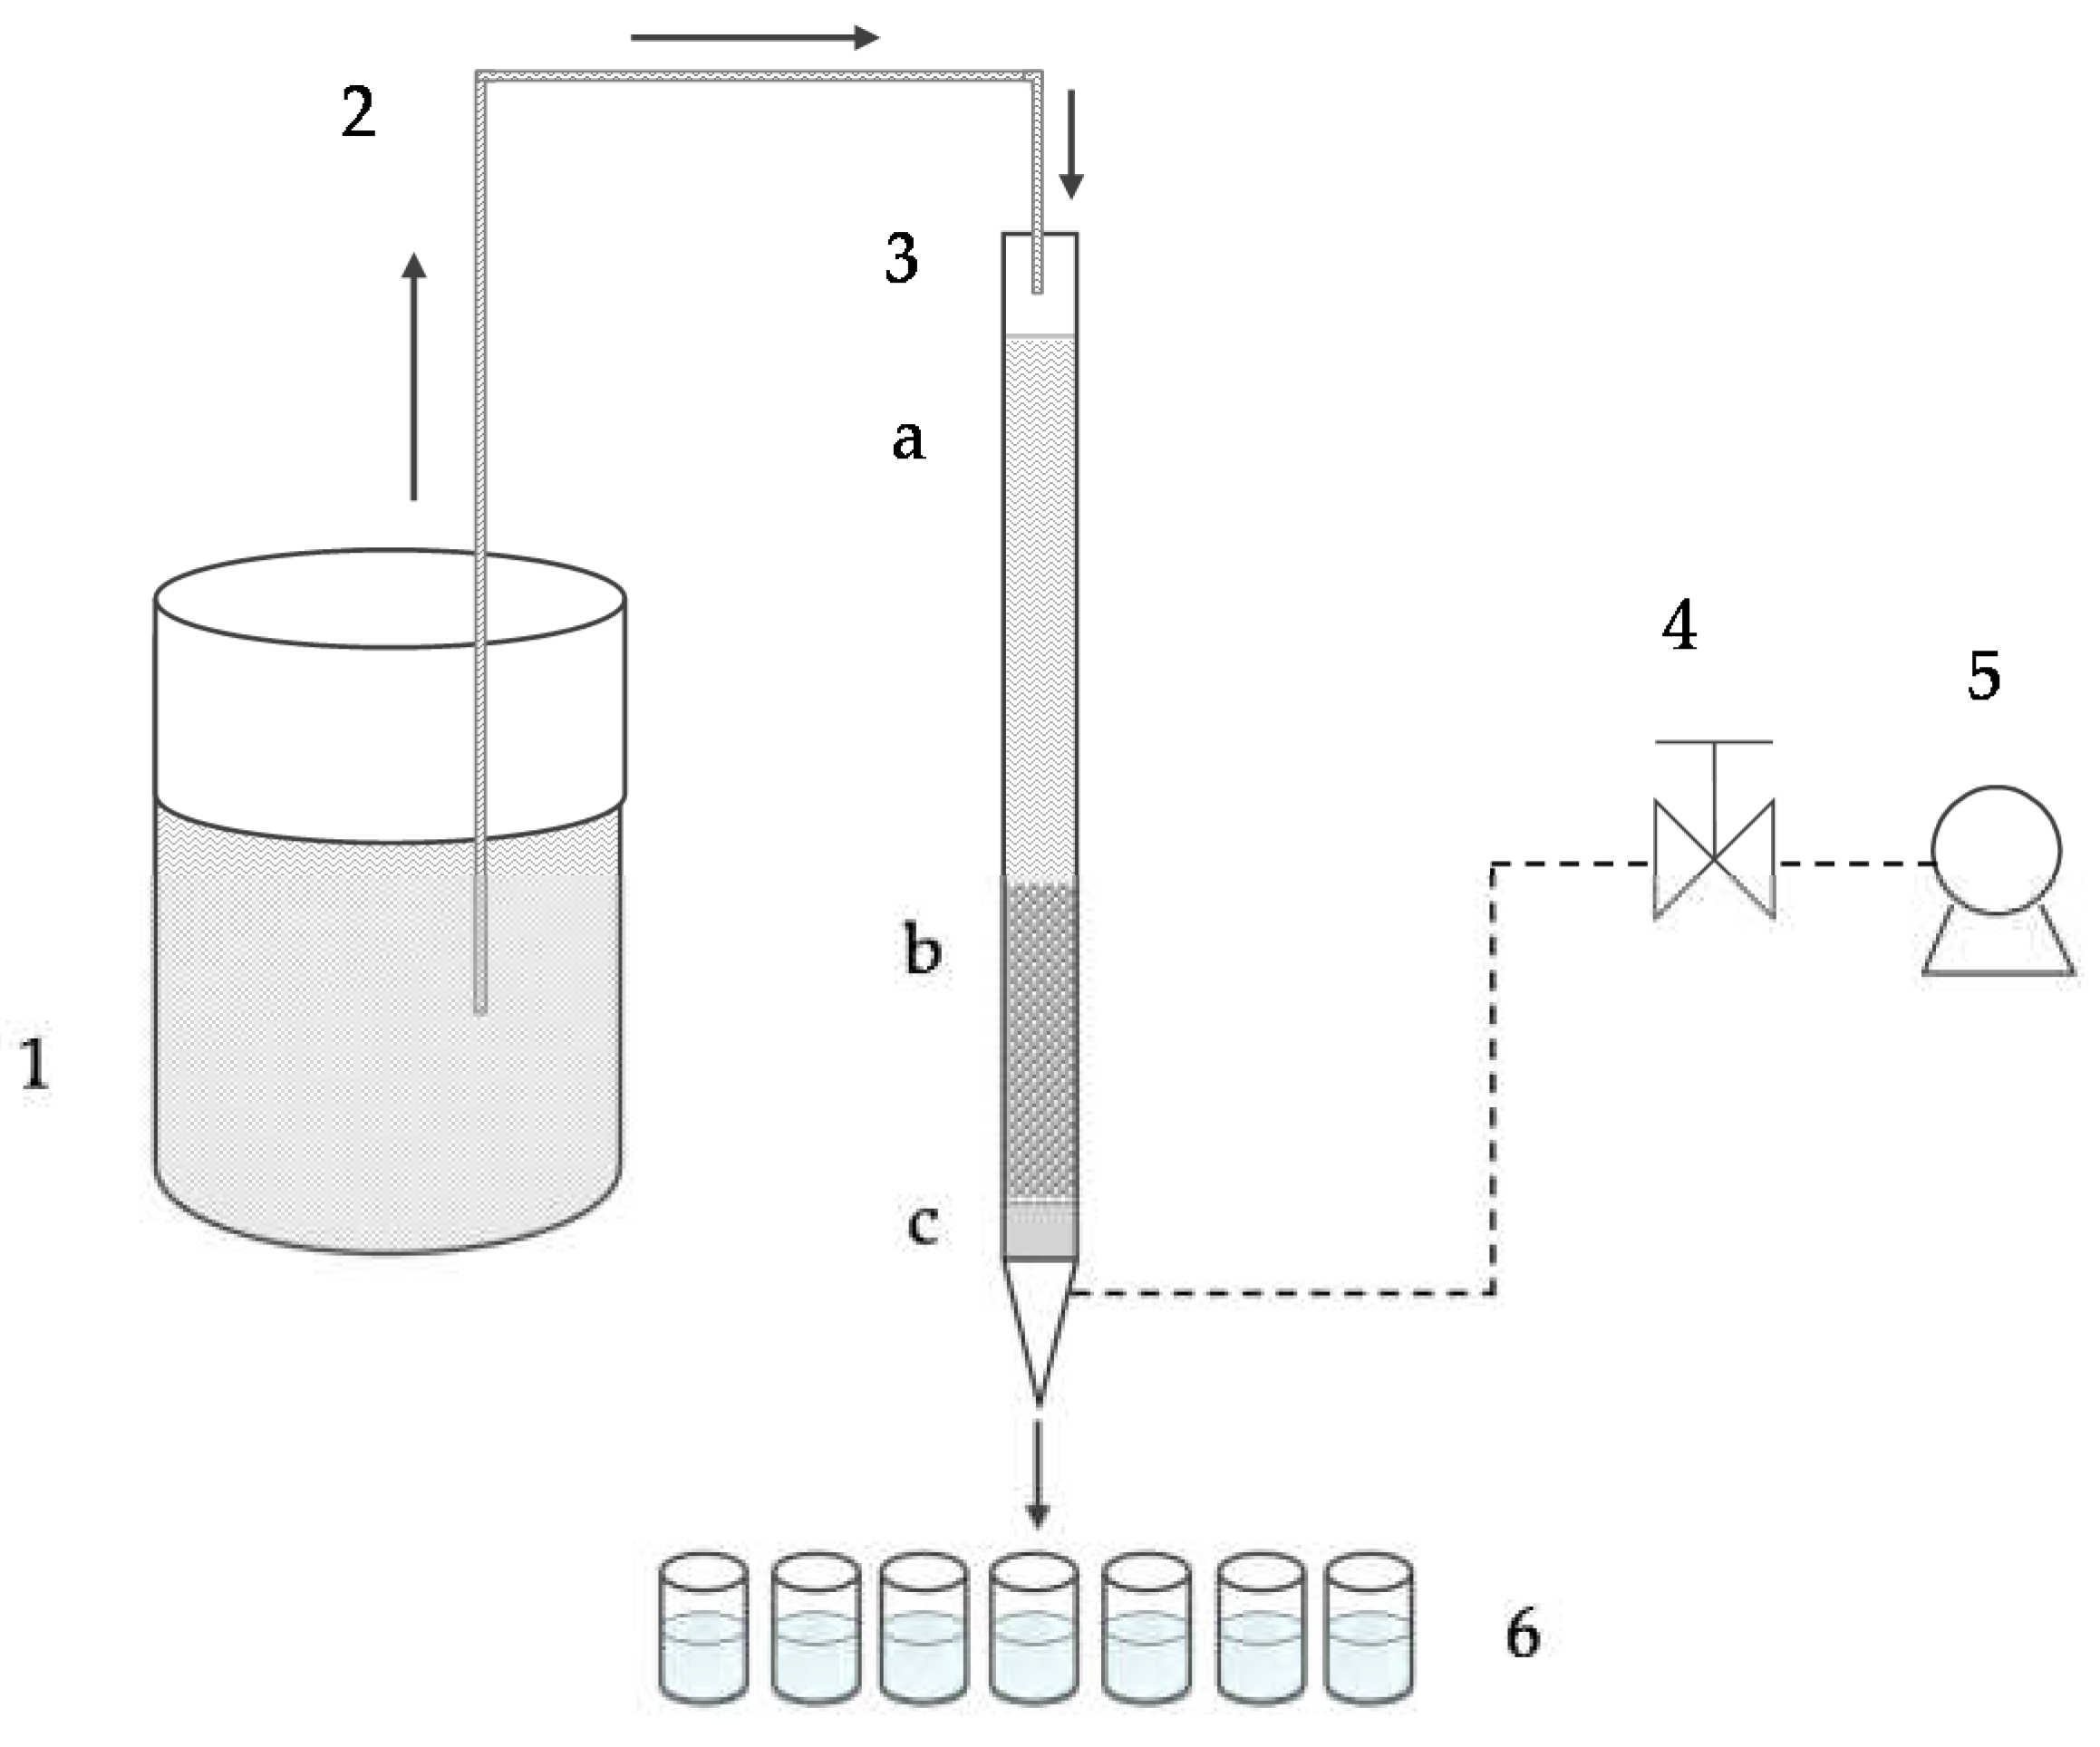
2.3. Column Studies
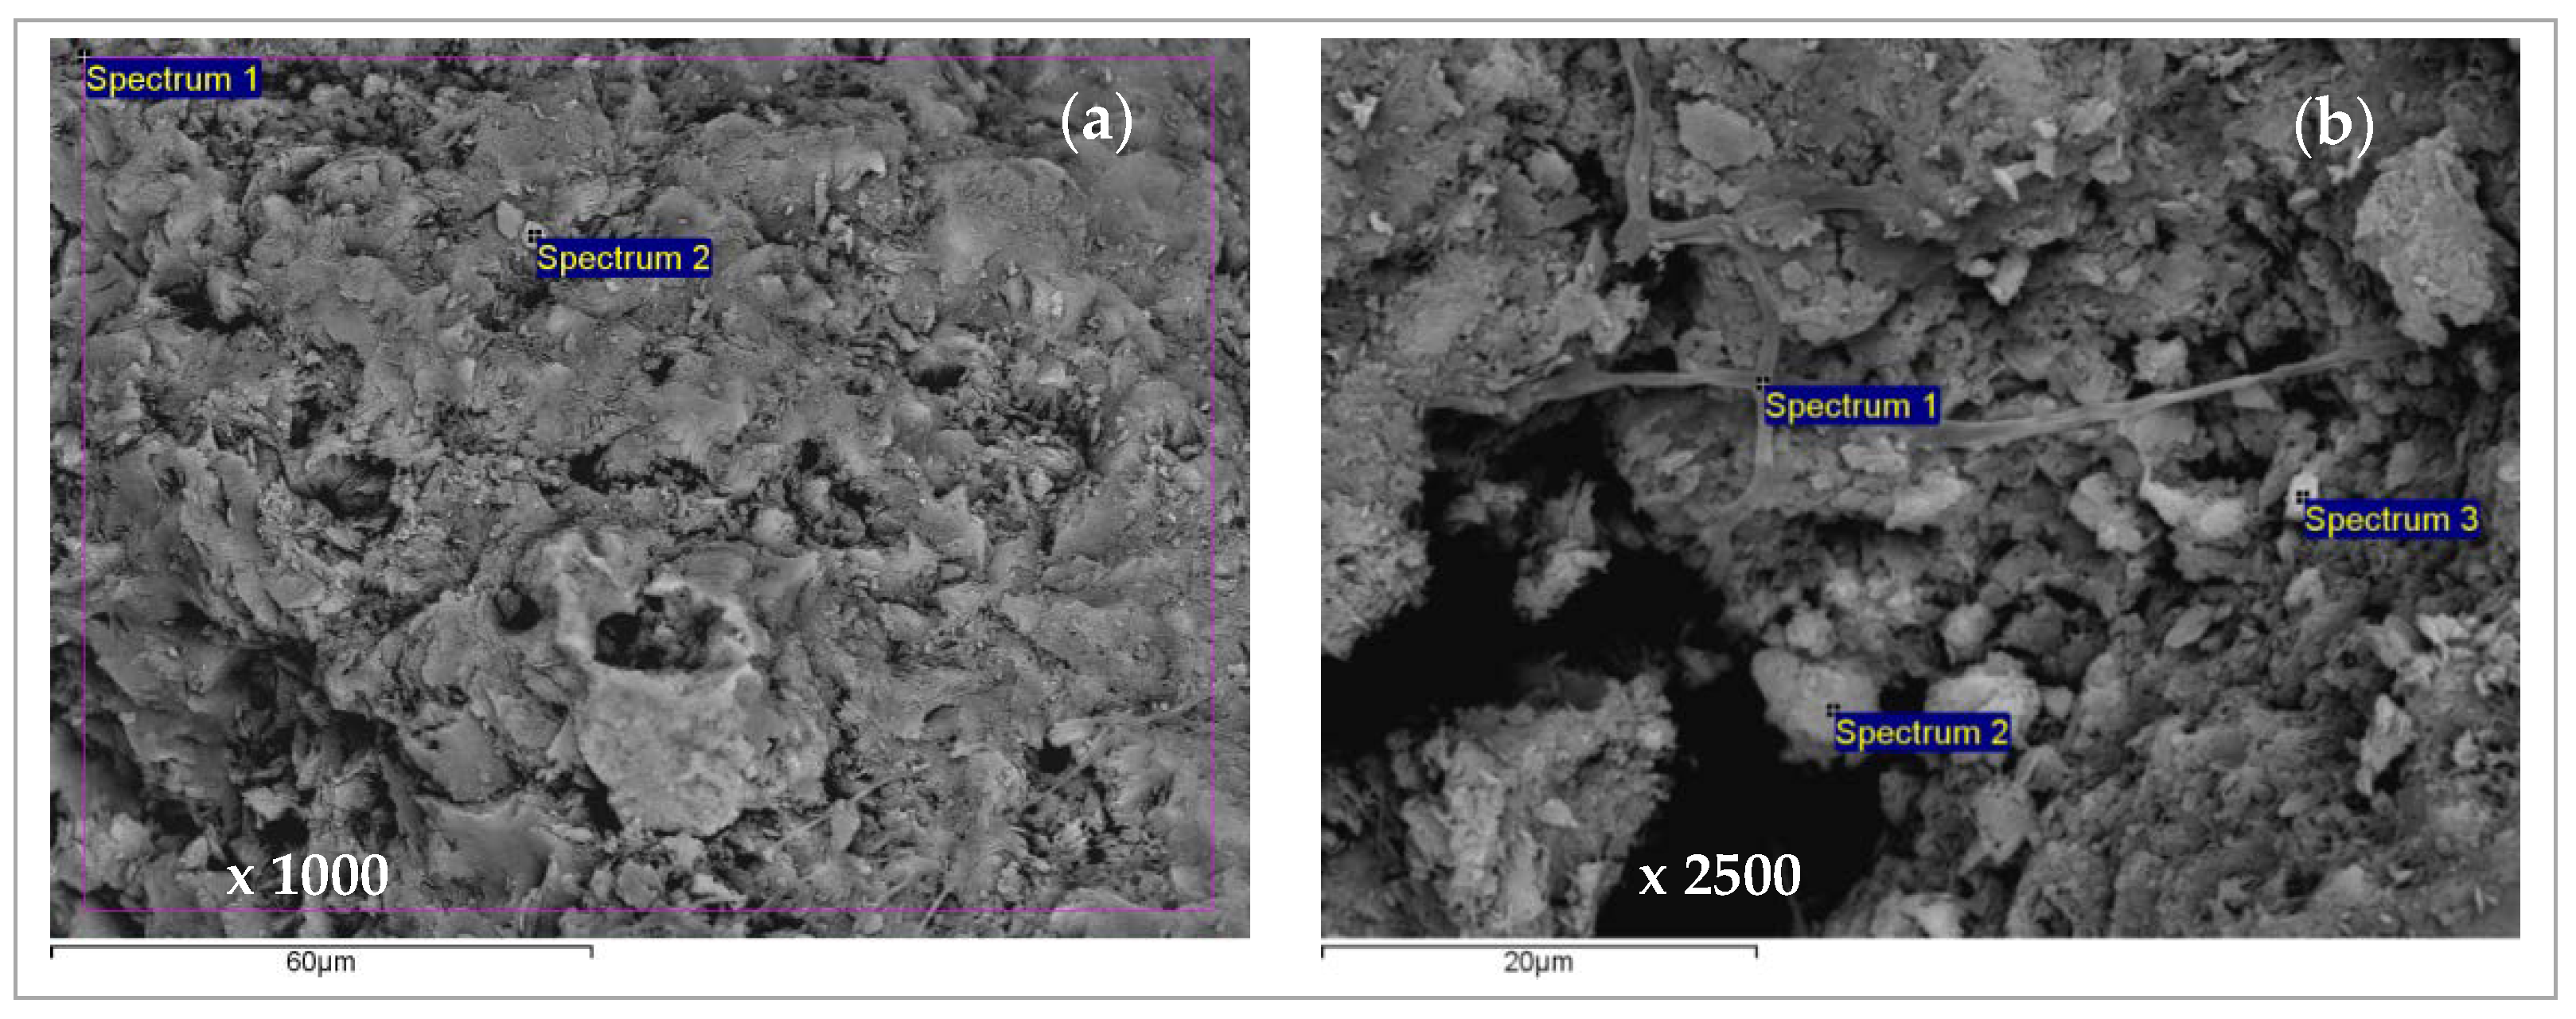
2.4. Scanning Electron Microscopy and Energy Dispersive Spectroscopy (SEM-EDS) Characterization of Saturated Zeolite
3. Results and Discussion
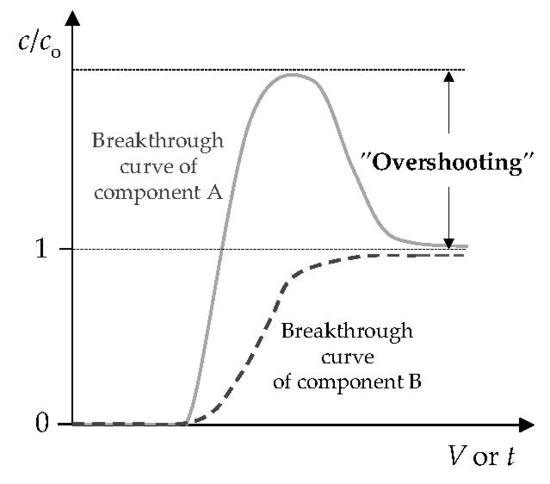
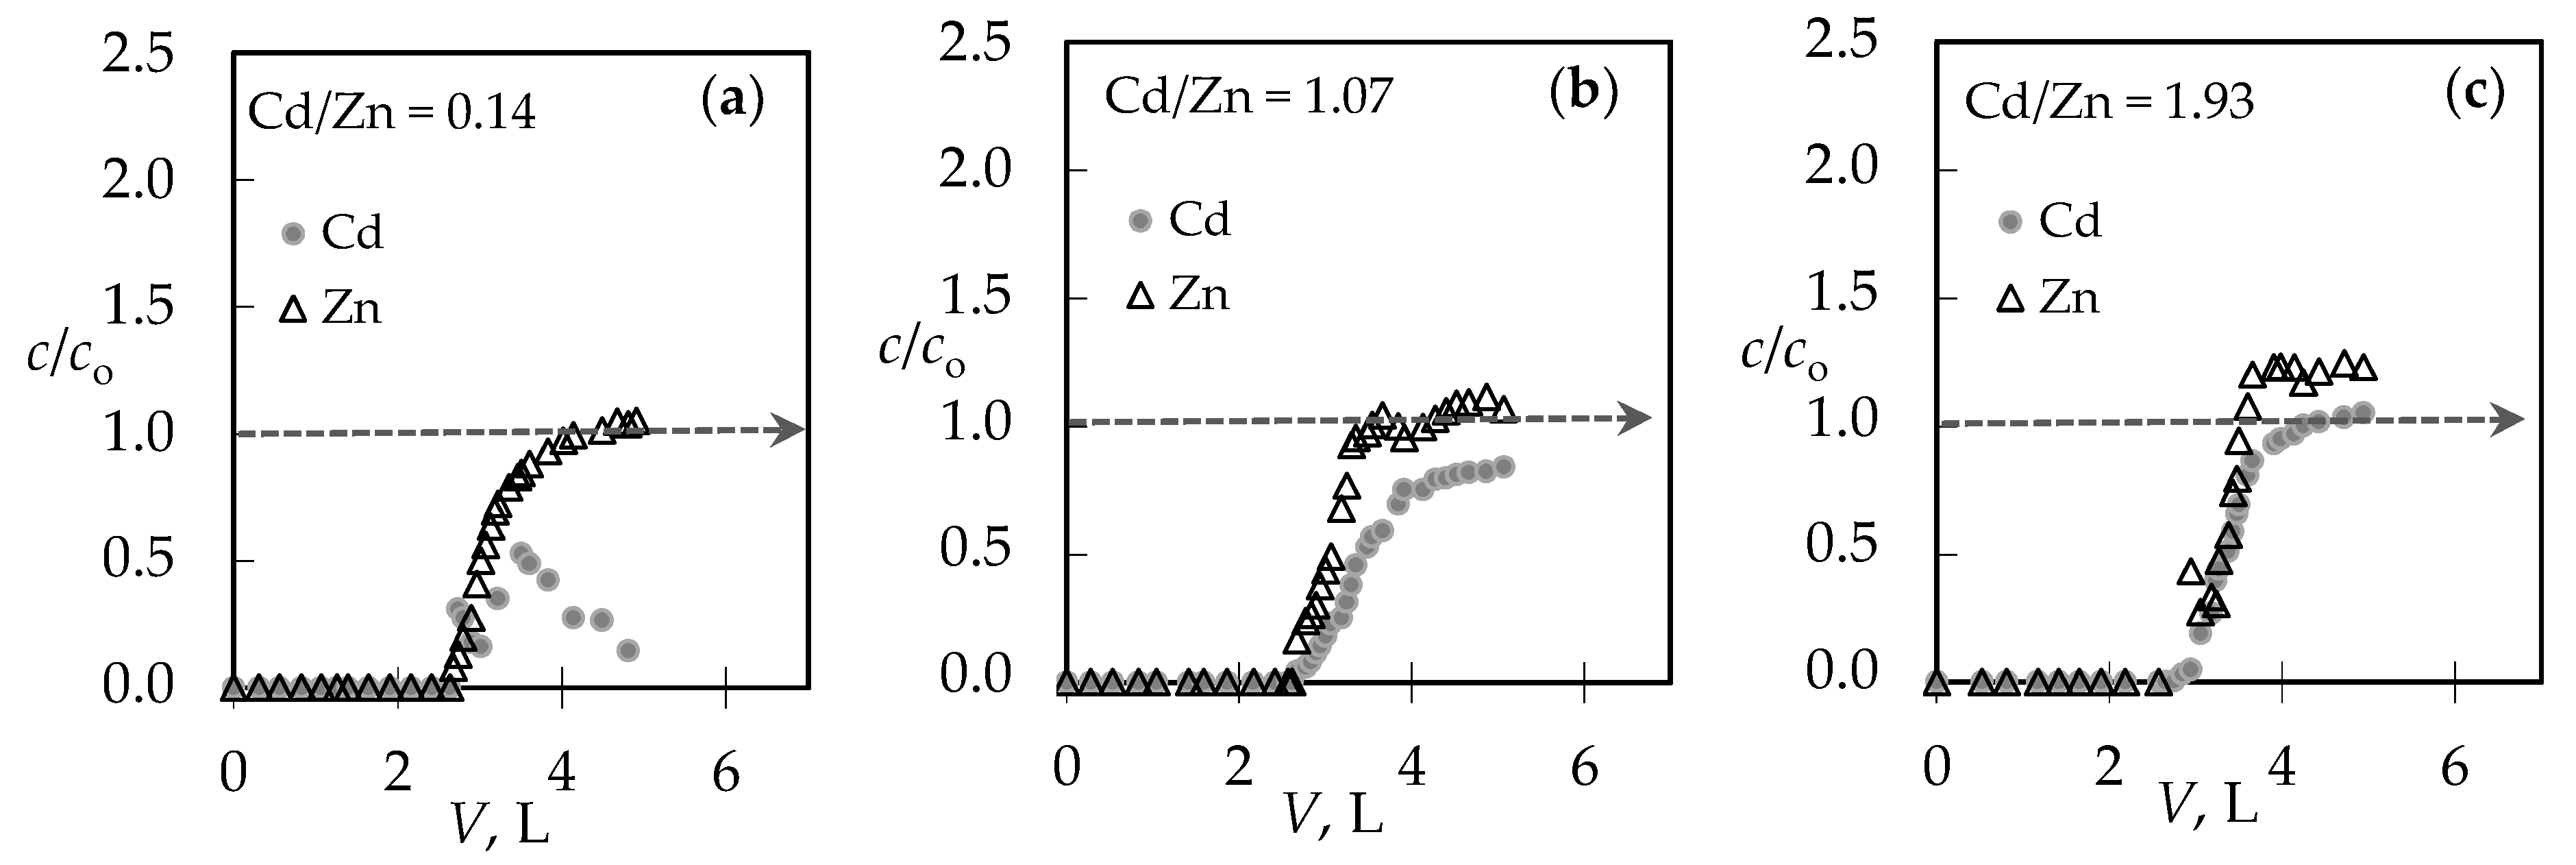
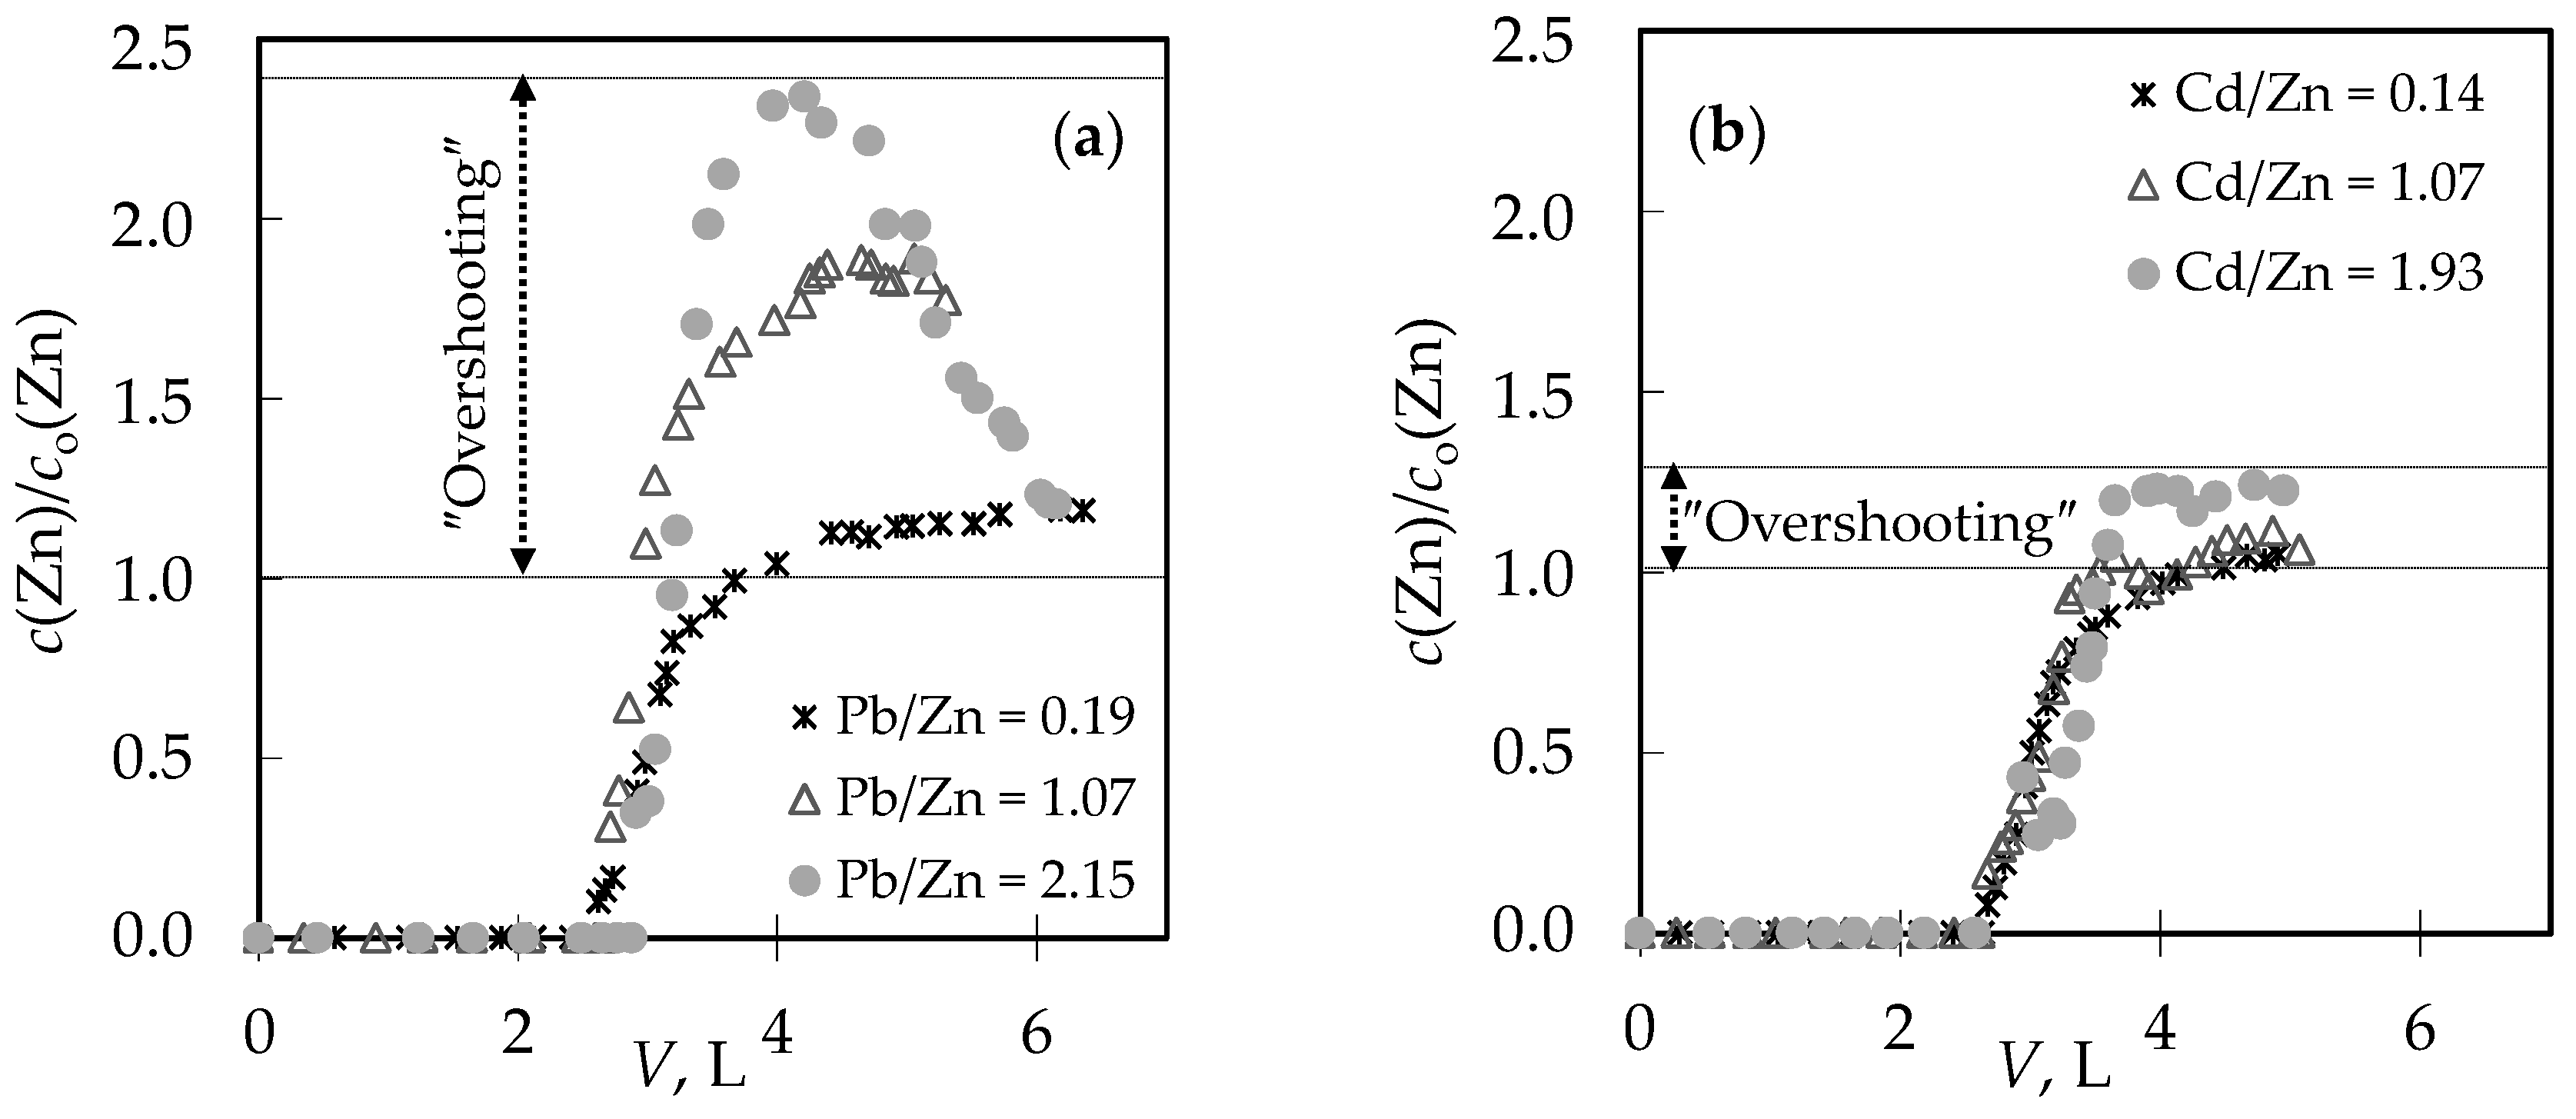
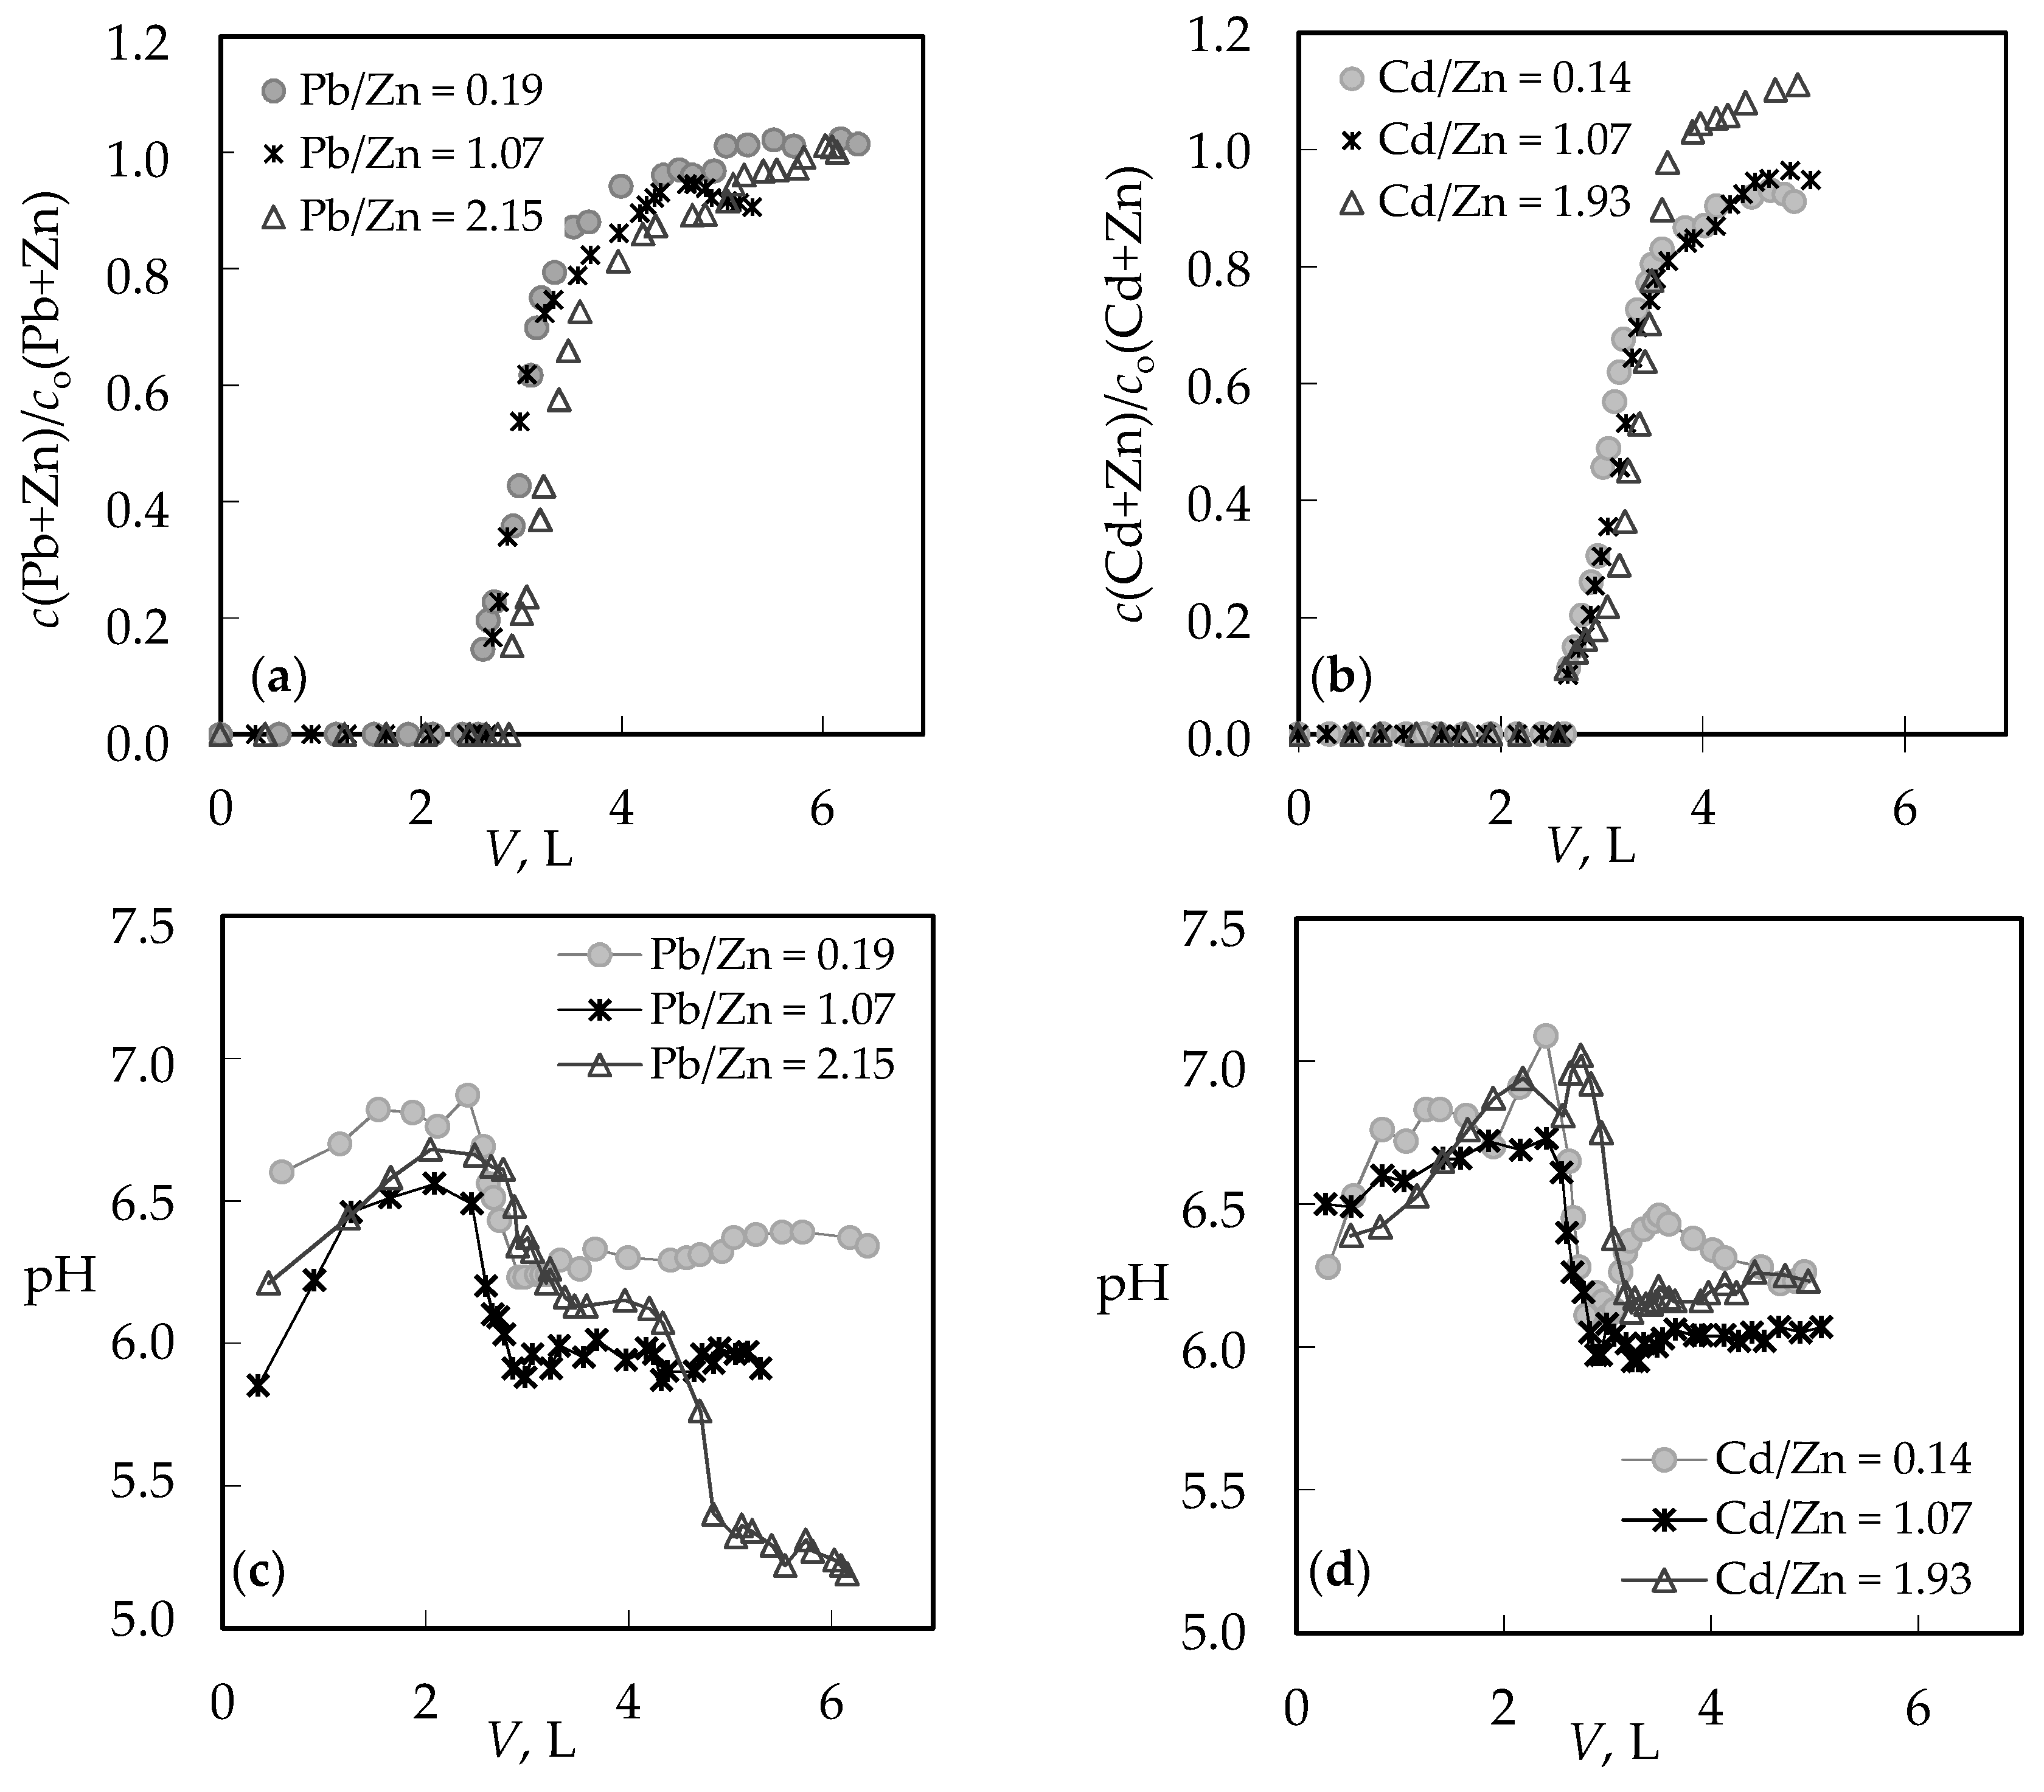
3.1. The Comparison of Breakthrough Curves for (Pb + Zn) and (Cd + Zn) Binary Systems
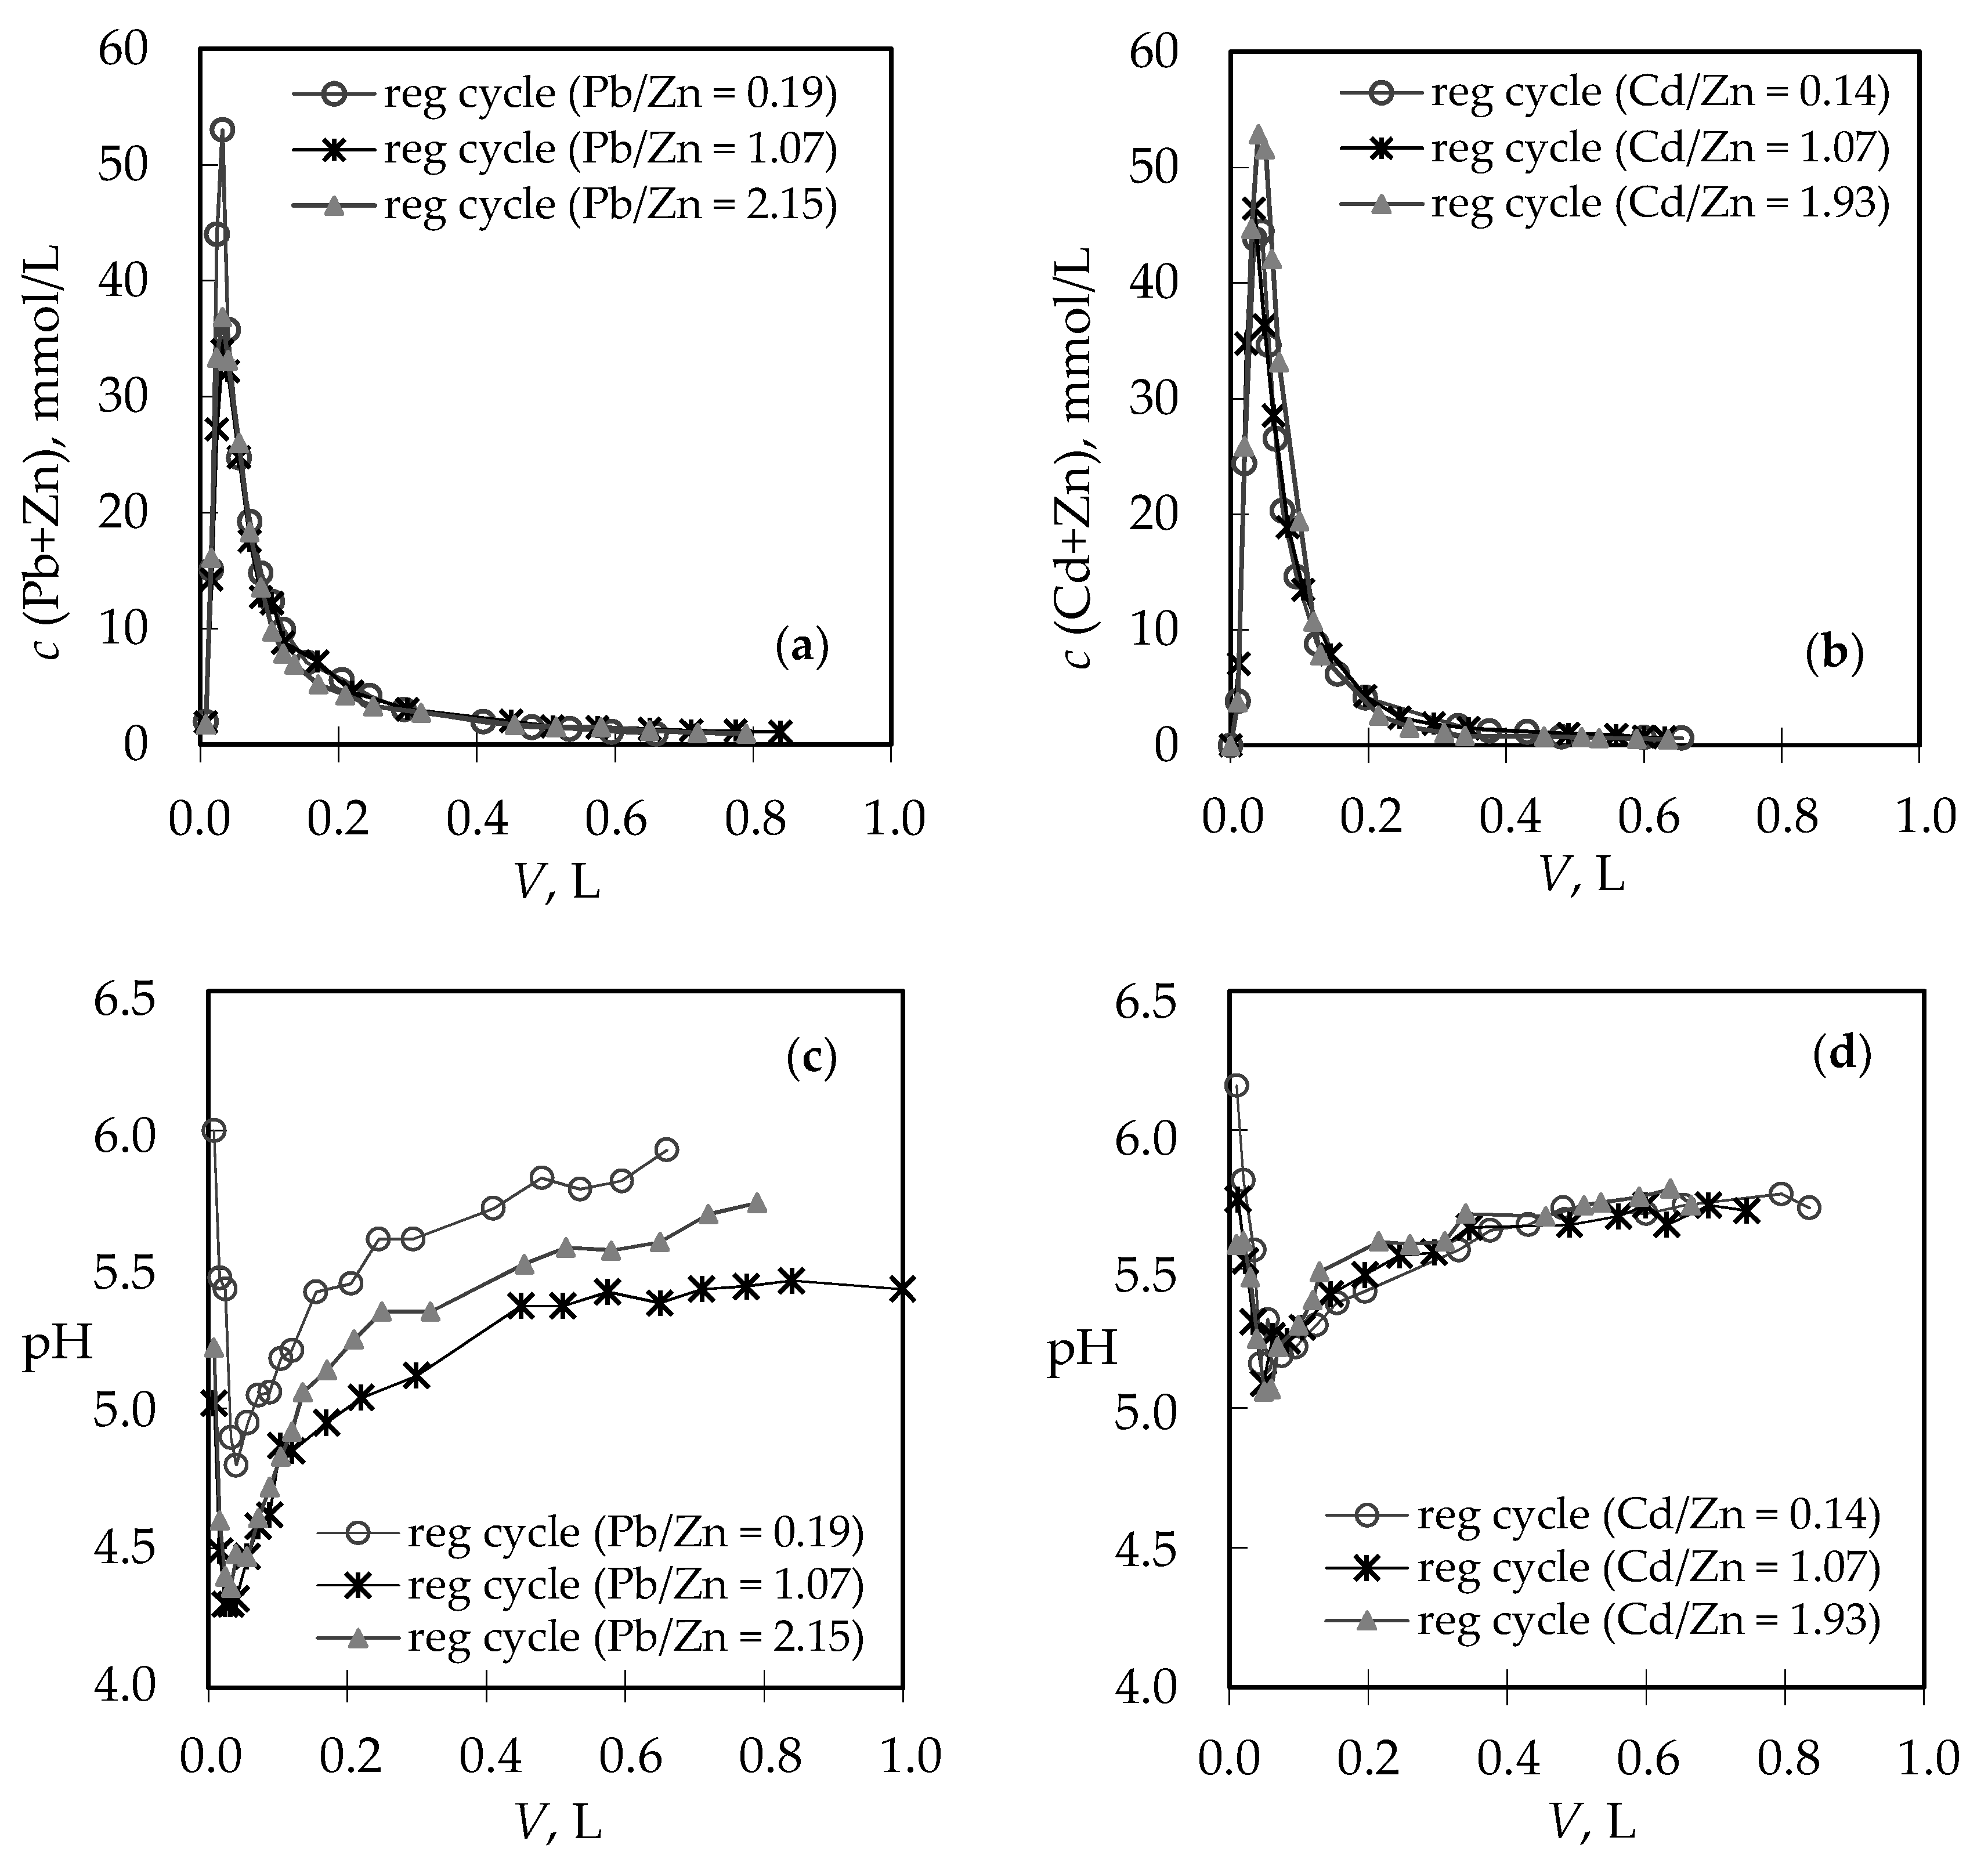
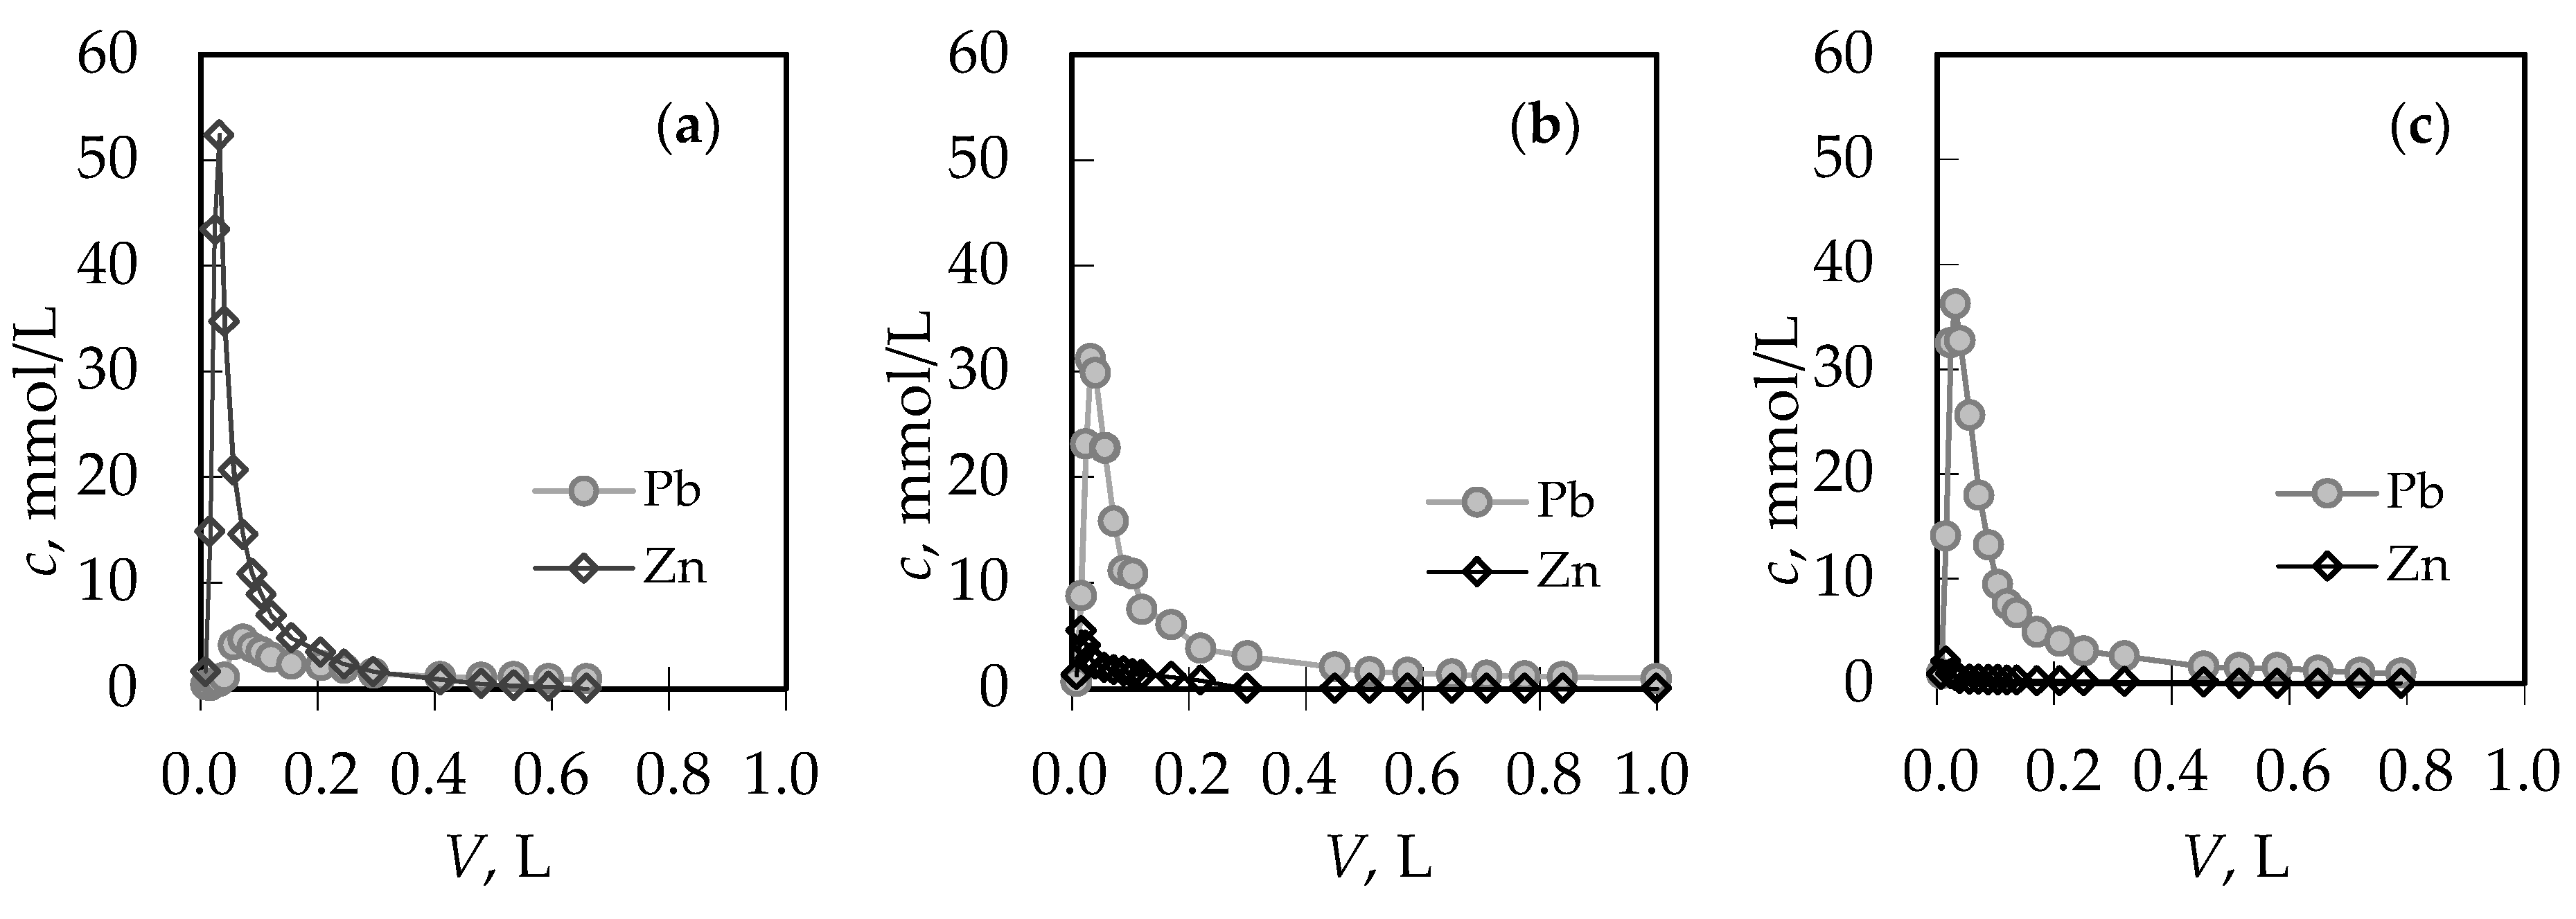
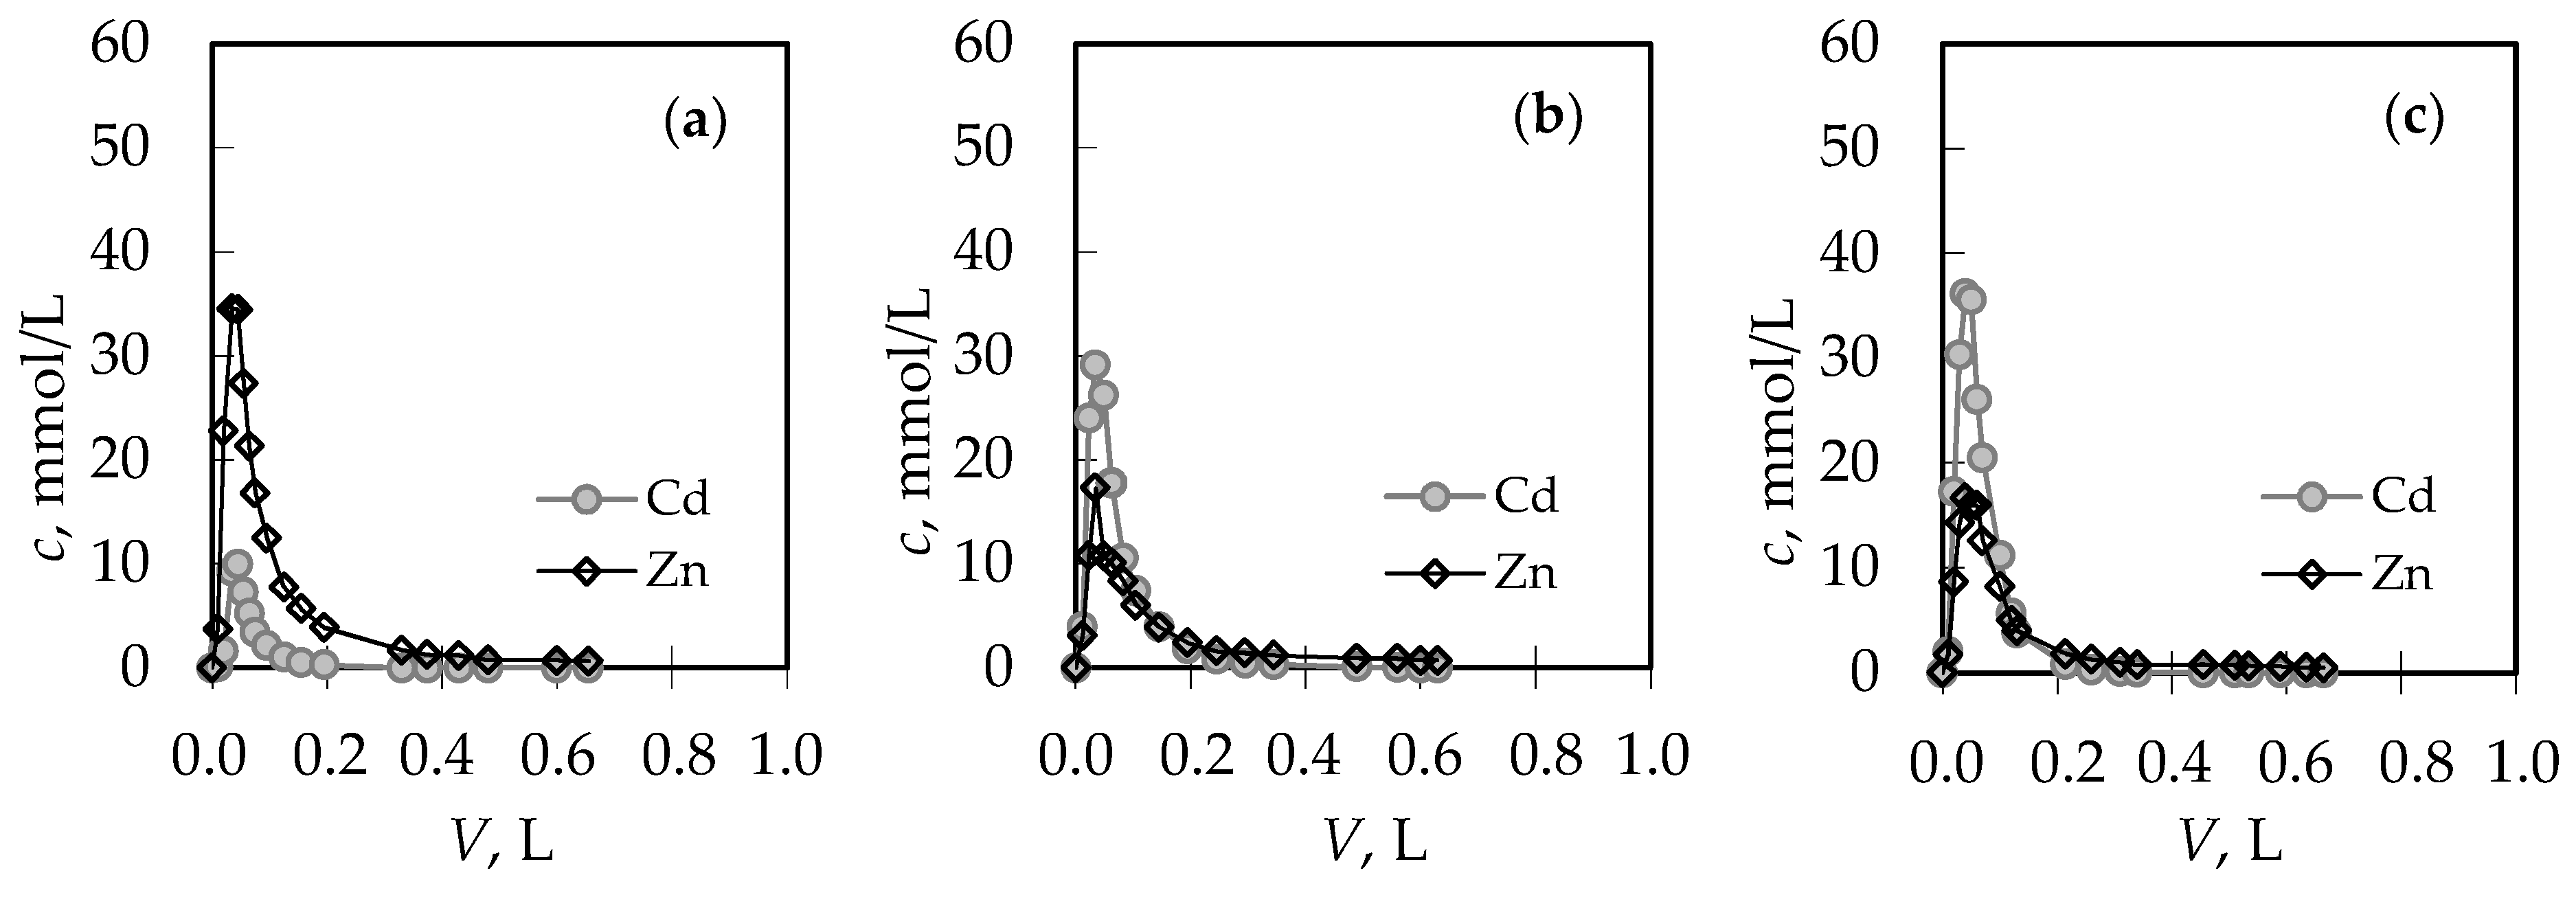
3.2. Analysis of the Regeneration Curves in the Binary (Pb + Zn) and (Cd + Zn) Systems
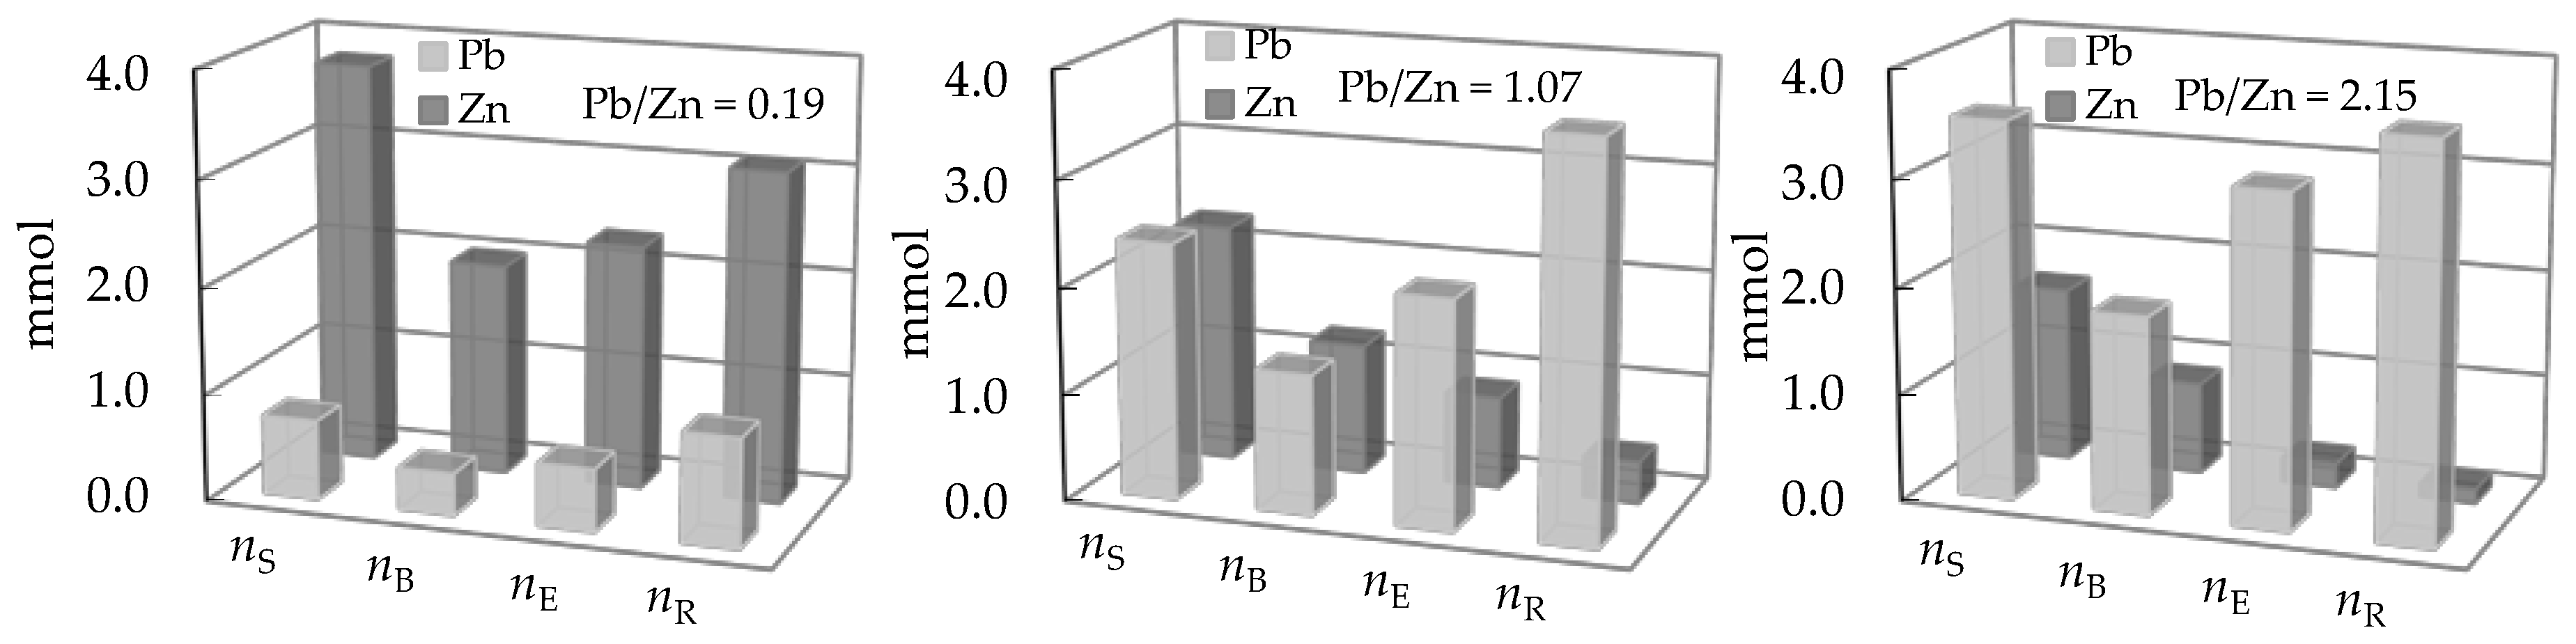
3.3. Comparison of the Amount of Ions Removed During Service and Regeneration Cycles
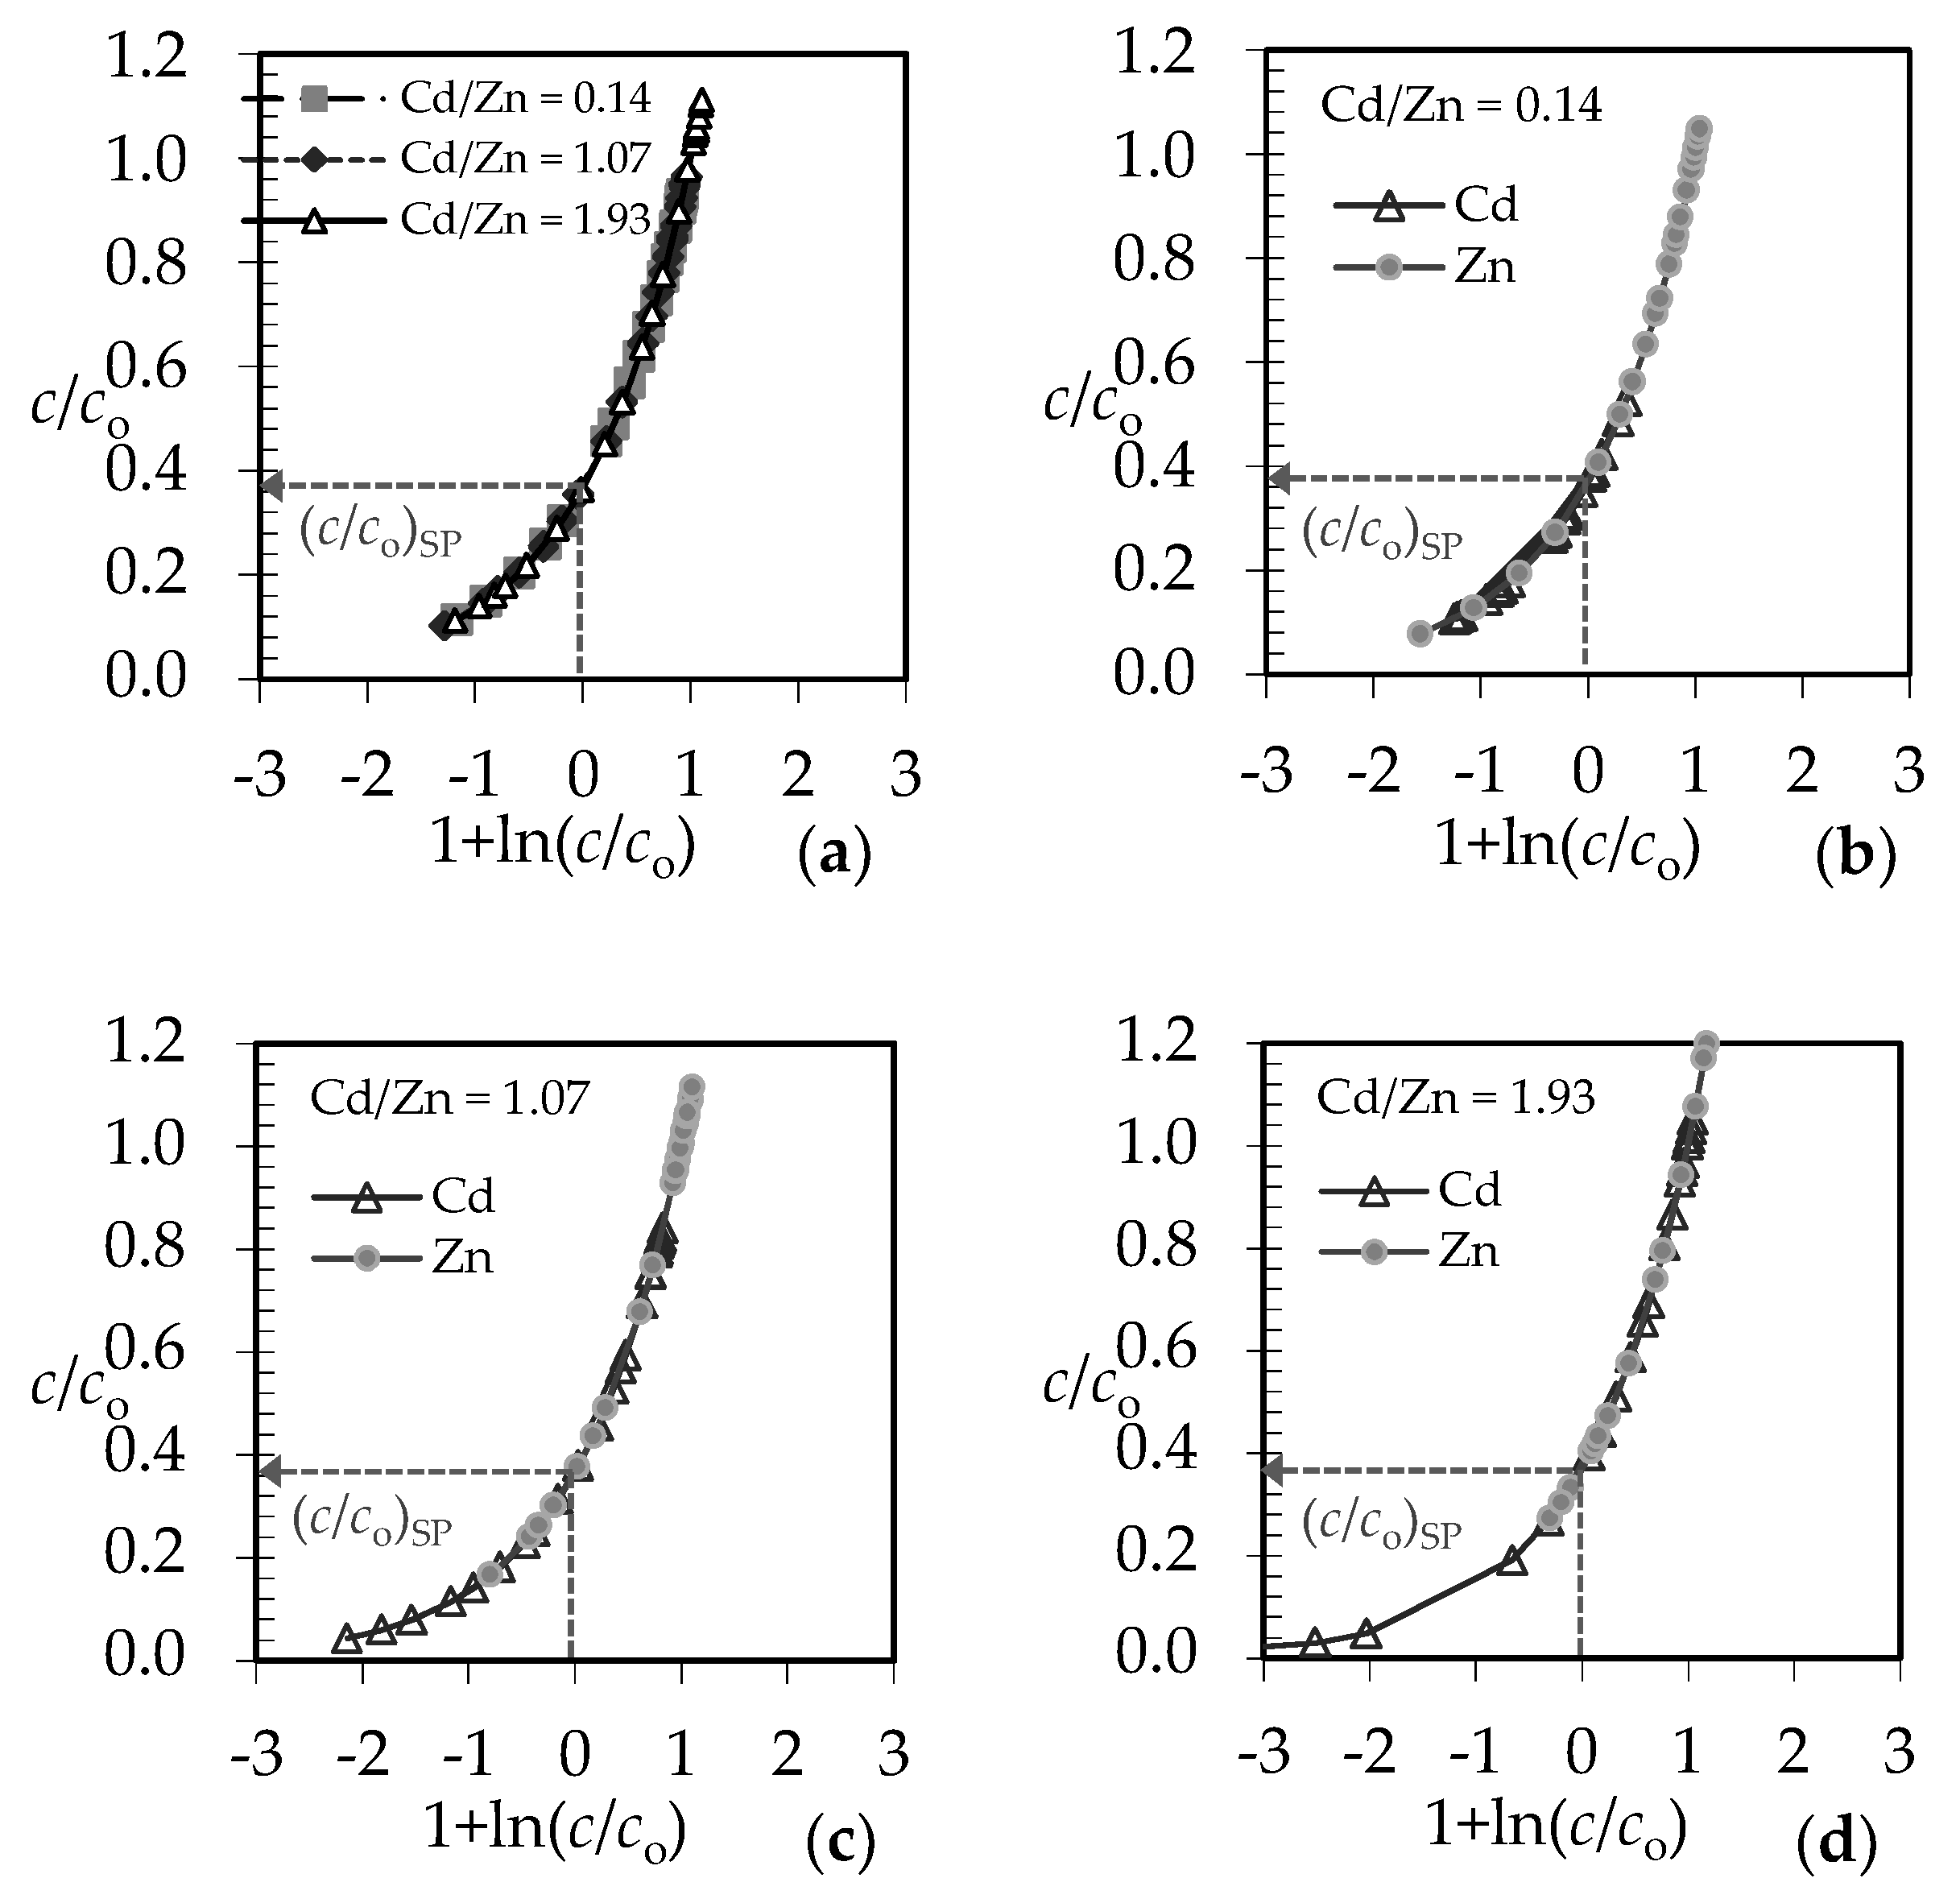
3.4. Qualitative Evaluation of the Overall Mass Transfer Coefficient in the (Pb + Zn) and (Cd + Zn) Binary Systems
3.5. Quantitative Determination of the Overall Mass Transfer Coefficient in the (Pb + Zn) and (Cd + Zn) Binary Systems
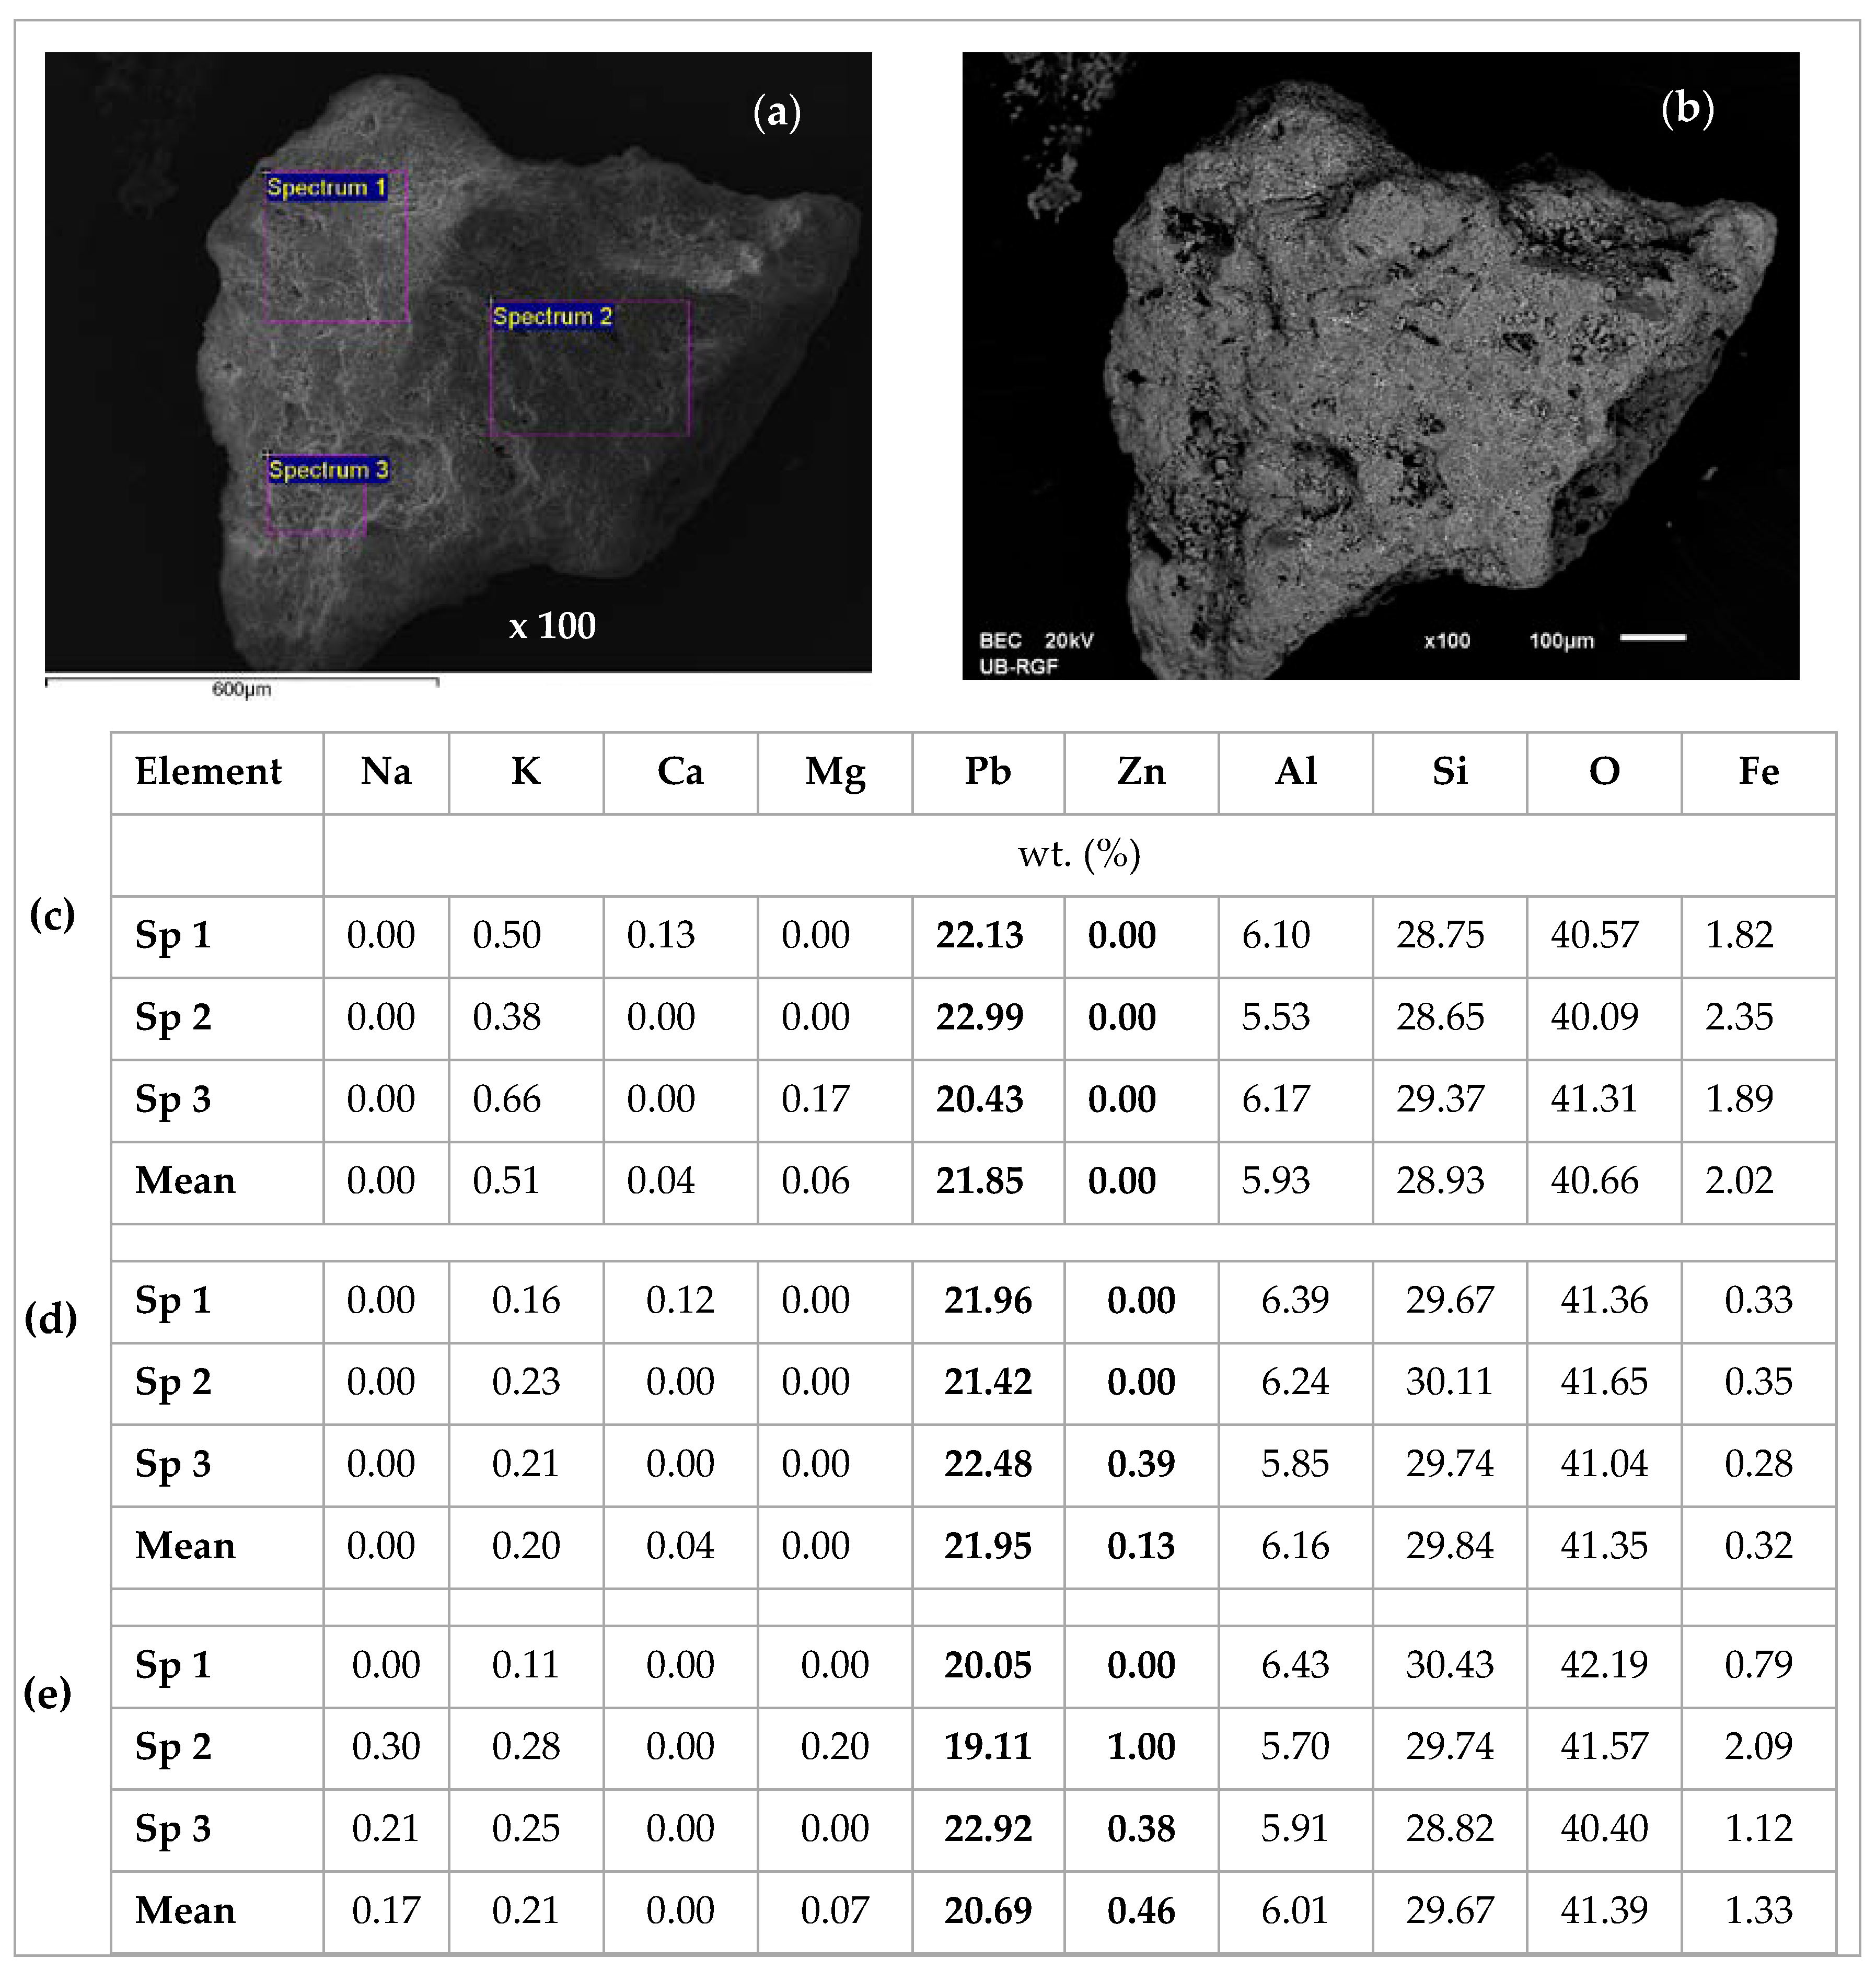
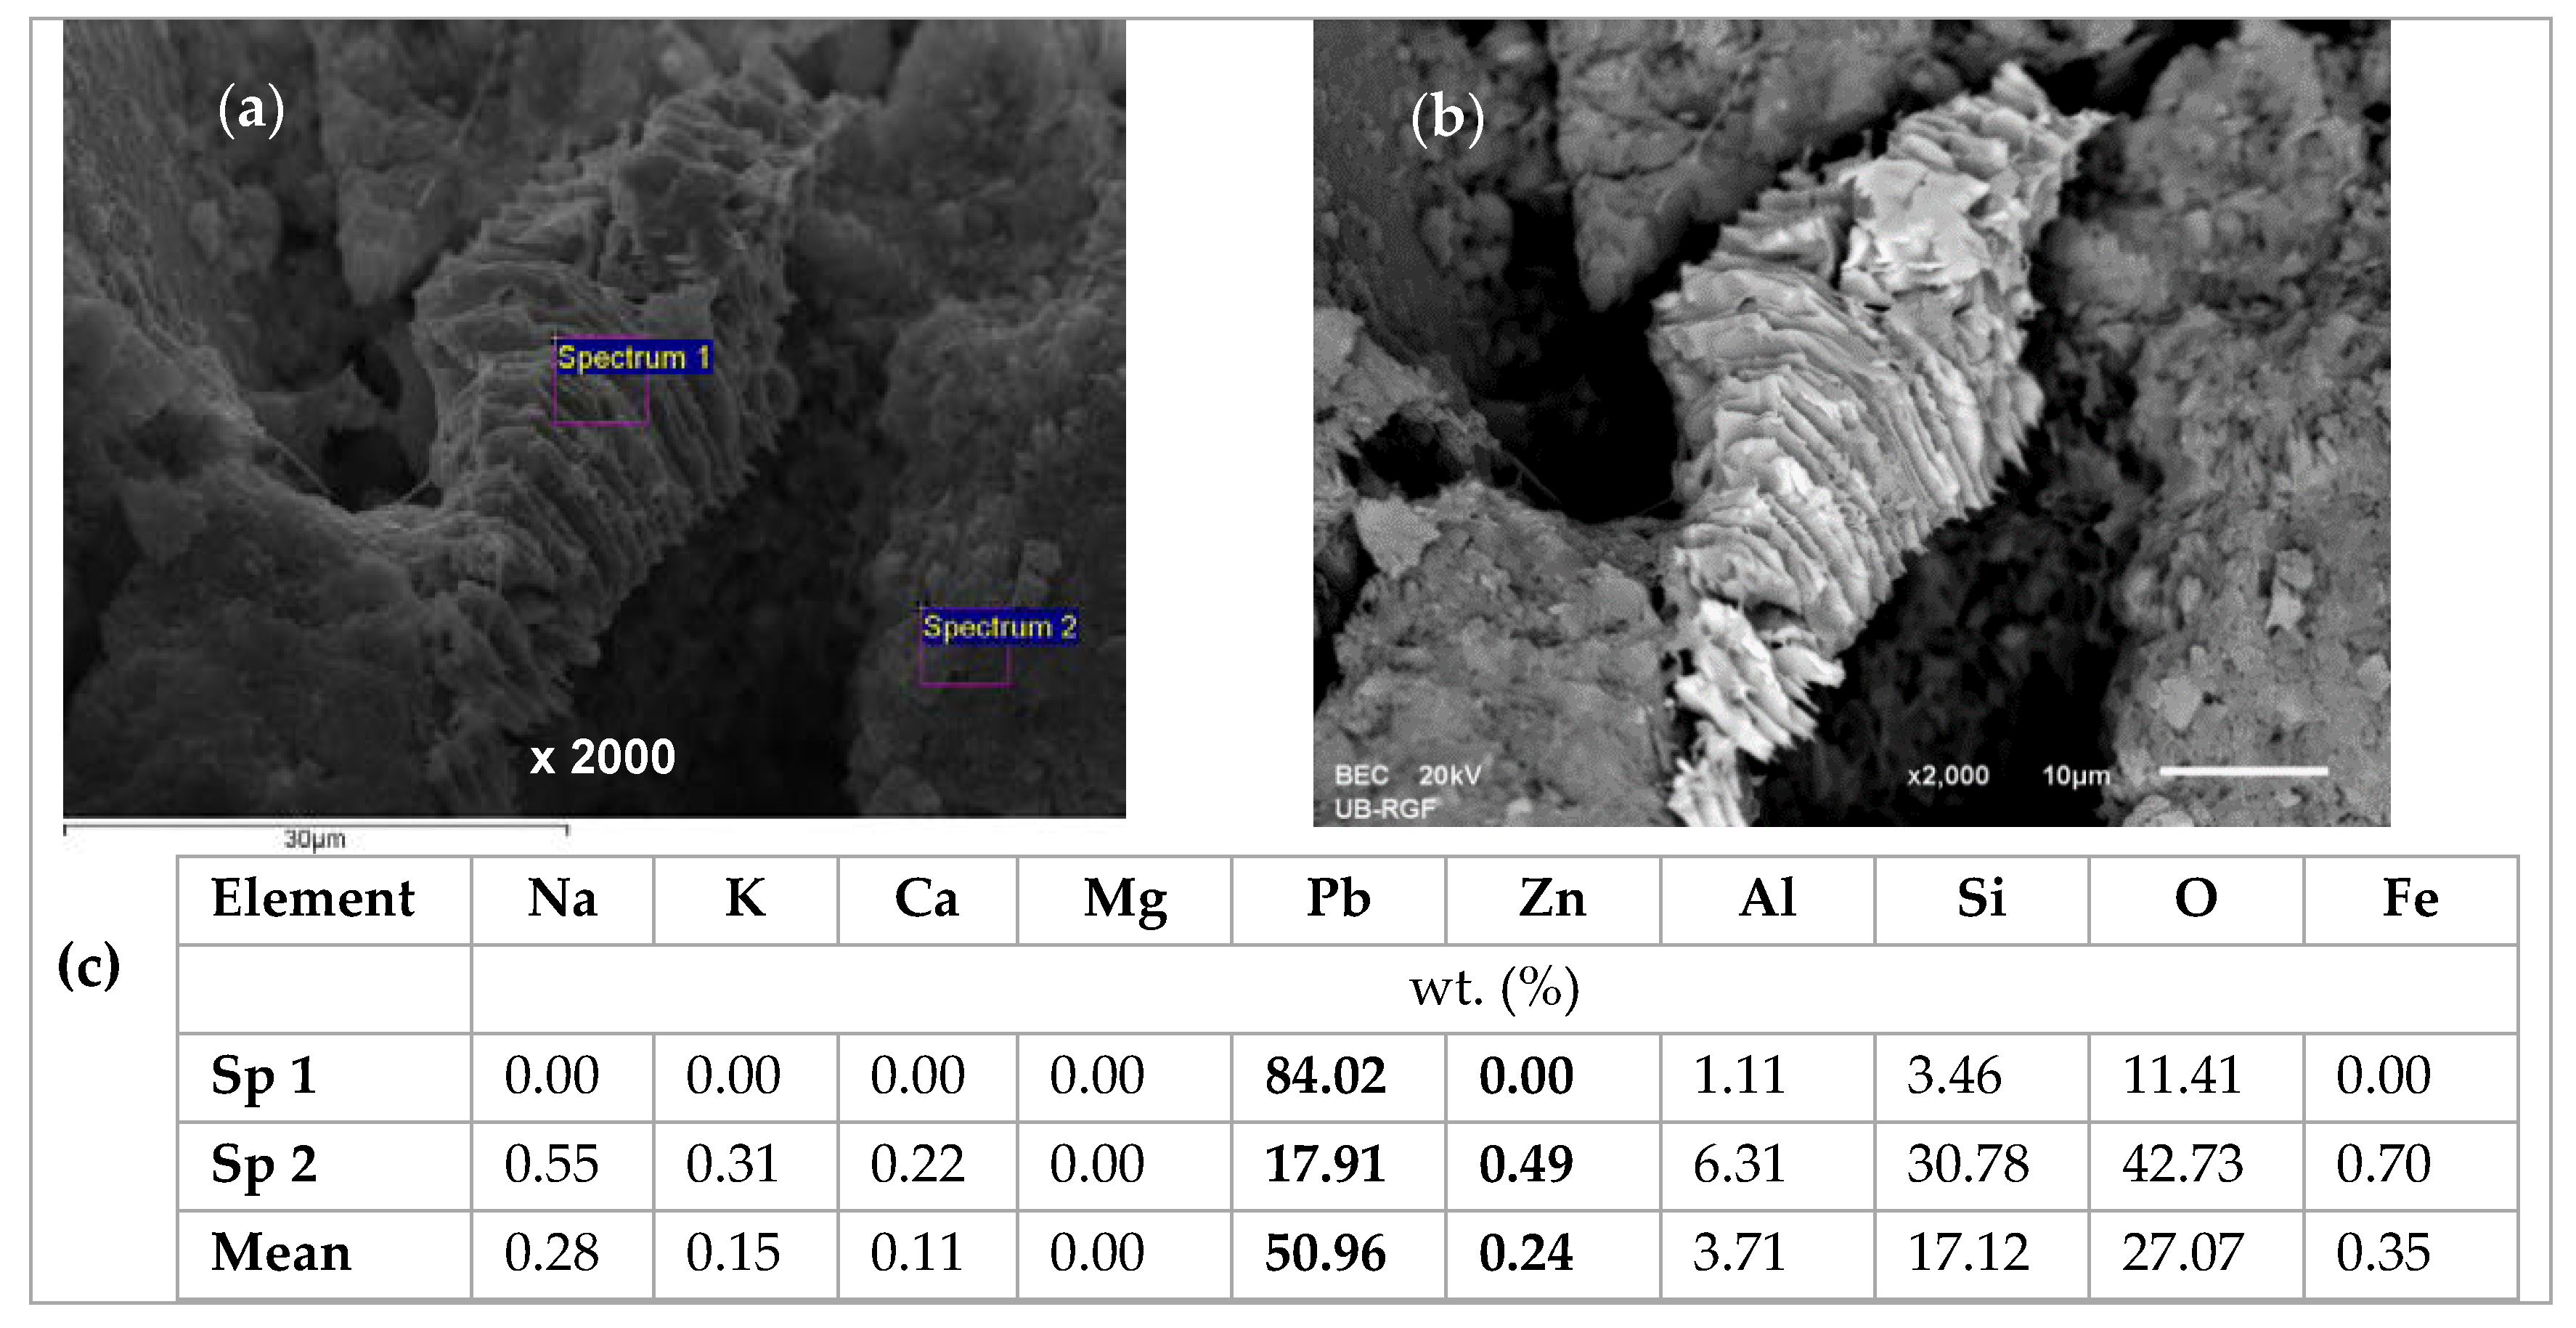
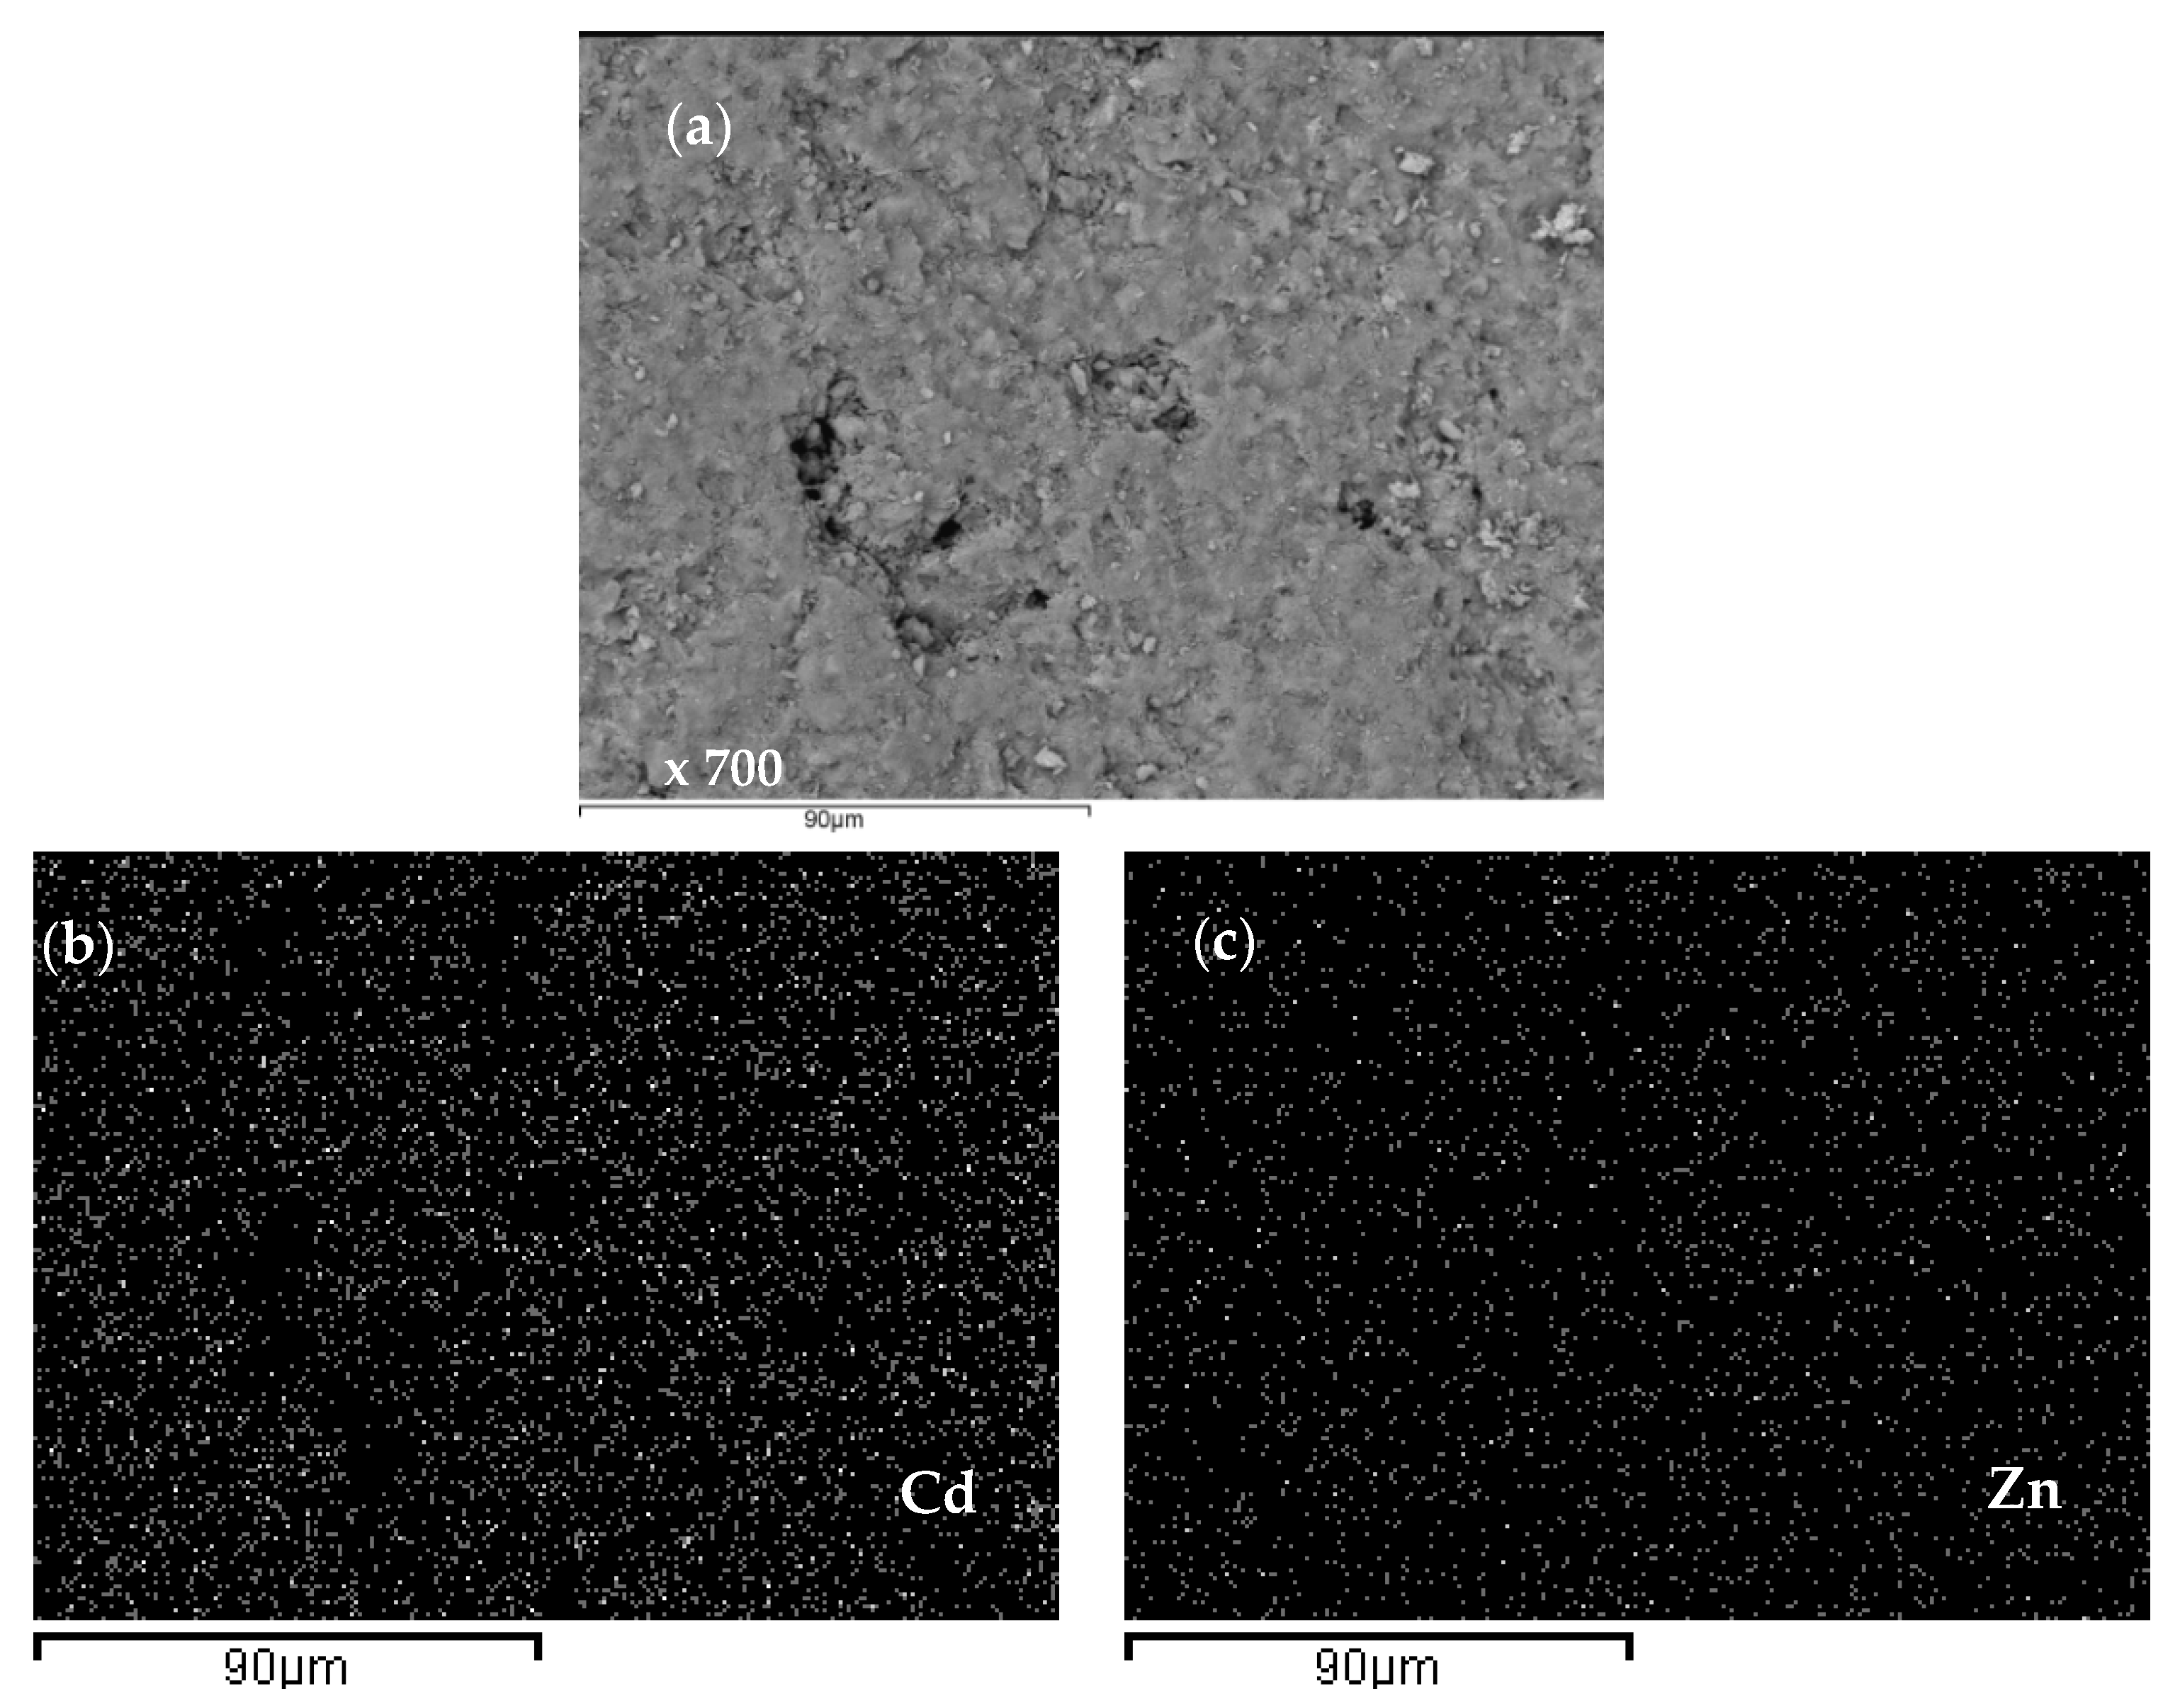
3.6. Scanning Electron Microscopy and Energy Dispersive Spectroscopy (SEM-EDS) Results
4. Conclusions
Author Contributions
Acknowledgments
Conflicts of Interest
References
- Aksu, A. Sources of metal pollution in the urban atmosphere (A case study: Tuzla, Istanbul). J. Environ. Health Sci. Eng. 2015, 13, 1–10. [Google Scholar] [CrossRef]
- Ejidike, I.P.; Onianwa, P.C. Assessment of Trace Metals Concentration in Tree Barks as Indicator of Atmospheric Pollution within Ibadan City, South-West, Nigeria. J. Anal. Methods Chem. 2015, 2015. [Google Scholar] [CrossRef] [PubMed]
- Viard, B.; Pihan, F.; Promeyrat, S.; Pihan, J.C. Integrated assessment of heavy metal (Pb, Zn, Cd) highway pollution: Bioaccumulation in soil, graminaceae and land snails. Chemosphere 2004, 55, 1349–1359. [Google Scholar] [CrossRef]
- Wang, X.; Sato, T.; Xing, B.; Tao, S. Health risks of heavy metals to the general public in Tianjin, China via consumption of vegetables and fish. Sci. Total Environ. 2005, 350, 28–37. [Google Scholar] [CrossRef]
- Qu, C.S.; Ma, Z.W.; Yang, J.; Liu, Y.; Bi, J.; Huang, L. Human Exposure Pathways of Heavy Metals in a Lead-Zinc Mining Area, Jiangsu Province, China. PLoS ONE 2012, 7, e46793. [Google Scholar] [CrossRef] [PubMed]
- Vilar, V.J.P.; Loureiro, J.M.; Botelho, C.M.; Boaventura, R.A. Continuous biosorption of Pb/Cu and Pb/Cd in fixed-bed column using algae Gelidium and granulated agar extraction algal waste. J. Hazard. Mater. 2008, 154, 1173–1182. [Google Scholar] [CrossRef]
- Duruibe, J.O.; Ogwuegbu, M.O.C.; Egwurugwu, J.N. Heavy metal pollution and human biotoxic effects. Int. J. Phys. Sci. 2007, 2, 112–118, Article Number: 59CA35213127. Available online: http://www.academicjournals.org/IJPS (accessed on 27 August 2018).
- Nagajyoti, P.C.; Lee, K.D.; Sreekanth, T.V.M. Heavy metals, occurrence and toxicity for plants: A review. Environ. Chem. Lett. 2010, 8, 199–216. [Google Scholar] [CrossRef]
- Wang, J.; Zhao, Y.; Zhang, P.; Yang, L.; Xu, H.; Xi, G. Adsorption characteristics of a novel ceramsite for heavy metal removal from stormwater runoff. Chin. J. Chem. Eng. 2018, 26, 96–103. [Google Scholar] [CrossRef]
- Decision No 2455/2001/EC. Official Journal of the European Communities, L 331/1. Available online: http://eur-lex.europa.eu/LexUriServ/LexUriServ.do?uri=OJ:L:2001:331:0001:0005:EN:PDF (accessed on 27 August 2018).
- Fu, F.; Wang, Q. Removal of heavy metal ions from wastewaters: A review. J. Environ. Manag. 2011, 92, 407–418. [Google Scholar] [CrossRef]
- Girardi, F.; Hackbarth, F.V.; De Souza, S.M.A.G.U.; De Souza, A.A.U.; Boaventura, R.A.R.; Vilar, V.J.P. Marine Macroalgae Pelvetia canaliculata (Linnaeus) as Natural Cation Exchangers for Metal Ions Separation: A Case Study on Copper and Zinc Ions Removal. Chem. Eng. J. 2014, 247, 320–329. [Google Scholar] [CrossRef]
- Hackbarth, F.V.; Girardi, F.; De Souza, S.M.A.G.U.; De Souza, A.A.U.; Boaventura, R.A.R.; Vilar, V.J.P. Marine macroalgae Pelvetia canaliculata (Phaeophyceae) as a natural cation exchanger for cadmium and lead ions separation in aqueous solutions. Chem. Eng. J. 2014, 242, 294–305. [Google Scholar] [CrossRef]
- Barakat, M.A. New trends in removing heavy metals from industrial wastewater. Arab. J. Chem. 2011, 4, 361–377. [Google Scholar] [CrossRef] [Green Version]
- Igwe, J.C.; Abia, A.A. A bioseparation process for removing heavy metals from waste water using biosorbents. Afr. J. Biotechnol. 2006, 5, 1167–1179. Available online: http://www.academicjournals.org/AJB (accessed on 17 January 2019).
- Bueno, B.Y.M.; Torem, M.L.; Molina, F.; de Mesquita, L.M.S. Bisorption of lead (II), chromium (III) and copper (II) by R. opacus: Equilibrium and kinetic studies. Miner. Eng. 2008, 21, 65–75. [Google Scholar] [CrossRef]
- Wang, S.; Peng, Y. Natural zeolites as effective adsorbents in water and wastewater treatment. Chem. Eng. J. 2010, 156, 11–24. [Google Scholar] [CrossRef]
- Saka, C.; Şahin, Ö.; Küçük, M.M. Applications on agricultural and forest waste adsorbents for the removal of lead (II) from contaminated waters. Int. J. Environ. Sci. Technol. 2012, 9, 379–394. [Google Scholar] [CrossRef] [Green Version]
- Singh, J.; Ali, A.; Prakash, V. Removal of lead (II) from synthetic and batteries wastewater using agricultural residues in batch/column mode. Int. J. Environ. Sci. Technol. 2014, 11, 1759–1770. [Google Scholar] [CrossRef]
- Lakshmipathy, R.; Sarada, N.C. A fixed bed column study for the removal of Pb2+ ions by watermelon rind. Environ. Sci. Water Res. Technol. 2015, 1, 244–250. [Google Scholar] [CrossRef]
- Sivaprakash, B.; Rajamohan, N.; Mohamed Sadhik, A. Batch and column sorption of heavy metal from aqueous solution using a marine alga sargassum tenerrimum. Int. J. ChemTech Res. 2010, 2, 155–162. Available online: https://pdfs.semanticscholar.org/37f5/893283bc6ee9d6b953d8fcf57772fd93bc5b.pdf (accessed on 17 January 2019).
- Mishra, A.; Tripathi, B.D. Removal of metal ions from aqueous solutions using thermally activated biosorbent: Column study. Proc. Int. Acad. Ecol. Environ. Sci. 2016, 6, 119–127. [Google Scholar]
- Mumpton, F.A. Natural zeolites: Where have we been, where are we going? In Natural Zeolites for the Third Millennium; Colella, C., Mumpton, F.A., Eds.; De Frede: Napoli, Italy, 2000; pp. 19–34. [Google Scholar]
- Han, R.; Zou, W.; Li, H.; Li, Y.; Shi, J. Copper(II) and lead(II) removal from aqueous solution in fixed-bed columns by manganese oxide coated zeolite. J. Hazard. Mater. 2006, 137, 934–942. [Google Scholar] [CrossRef] [PubMed]
- Ibrahimi, M.M.; Sayyadi, A.S. Application of natural and modified Zeolites in removing heavy metal Cations from aqueous media: An overview of including parameters affecting the process. Int. J. Geol. Agric. Environ. Sci. 2015, 3, 1–7. [Google Scholar]
- Mier, M.V.; Callejas, R.L.; Gehr, R.; Jimenez Cisneros, B.E.; Alvarez, P.J.J. Heavy metal removal with Mexican clinoptilolite: Multi-component ionic exchange. Water Res. 2001, 35, 373–378. [Google Scholar] [CrossRef]
- Inglezakis, V.J.; Loizidou, M.D.; Grigoropoulou, H.P. Ion exchange of Pb2+, Cu2+, Fe3+ and Cr3+ on natural clinoptilolite, selectivity determination and influence of acidity on metal uptake. J. Colloid Interface Sci. 2003, 261, 49–54. [Google Scholar] [CrossRef]
- Inglezakis, V.J. The concept of capacity in zeolite ion—Exchange system. J. Colloid Interface Sci. 2005, 281, 68–79. [Google Scholar] [CrossRef] [PubMed]
- Oter, O.; Akcay, H. Use of Natural Clinoptilolite to Improve Water Quality: Sorption and Selectivity Studies of Lead(II), Copper(II), Zinc(II), and Nickel(II). Water Environ. Res. 2007, 79, 329–335. [Google Scholar] [CrossRef] [PubMed]
- Krolo, P.; Krstulović, R.; Dabić, P.; Žmikić, A.; Bubić, A. Stabilization of Hazardous Zeolite Wastes in Cement Composites and its Effect on Hydration. Mater. Tehnol. 2003, 37, 327–332. [Google Scholar]
- Lata, S.; Singh, P.K.; Samadder, S.R. Regeneration of adsorbents and recovery of heavy metals: A review. Int. J. Environ. Sci. Technol. 2015, 12, 1461–1478. [Google Scholar] [CrossRef]
- Barbir, D.; Dabić, P.; Lisica, A. Effects of Mud from a Zinc-plating Plant and Zeolite Saturated with Zinc on Portland Cement Hydration and Properties of Hardened Cement Pastes. Chem. Biochem. Eng. Q. 2016, 30, 401–409. [Google Scholar] [CrossRef]
- Perić, J.; Trgo, M.; Vukojević Medvidović, N. Removal of zinc, copper and lead by natural zeolite-a comparison of adsorption isotherms. Wat. Res. 2004, 38, 1893–1899. [Google Scholar] [CrossRef] [PubMed]
- Trgo, M.; Perić, J.; Vukojević Medvidović, N. Investigations of different kinetic models for zinc ions uptake by a natural zeolitic tuff. J. Environ. Manag. 2006, 79, 298–304. [Google Scholar] [CrossRef] [PubMed]
- Vukojević Medvidović, N.; Perić, J.; Trgo, M. Column performance in lead removal from aqueous solutions by fixed bed of natural zeolite–clinoptilolite. Sep. Purif. Technol. 2006, 49, 237–244. [Google Scholar] [CrossRef]
- Vukojević Medvidović, N.; Perić, J.; Trgo, M. Testing of breakthrough curves for removal of lead ions from aqueous solutions by natural zeolite-clinoptilolite according to the Clark kinetic equation. Sep. Sci. Technol. 2008, 43, 944–959. [Google Scholar] [CrossRef]
- Perić, J.; Trgo, M.; Vukojević Medvidović, N.; Nuić, I. The effect of fixed bed depth on lead removal from aqueous solutions. Sep. Sci. Technol. 2009, 44, 3113–3127. [Google Scholar] [CrossRef]
- Vukojević Medvidović, N.; Perić, J.; Nuić, I.; Trgo, M. Zinc uptake in a fixed bed of natural zeolite. In Proceedings of the 2nd Slovenian-Croatian Symposium on Zeolites, Ljubljana, Slovenia, 1–2 October 2009; Bronić, J., Novak Tušar, N., Eds.; Croatian Zeolite Association: Zagreb, Croatia, 2009; pp. 87–90, ISBN 978-953-55373-1-1. [Google Scholar]
- Volesky, B. Detoxification of metal-bearing effluents: Biosorption for the next century. Hydrometallurgy 2001, 59, 203–216. [Google Scholar] [CrossRef]
- Vukojević Medvidović, N.; Perić, J.; Trgo, M.; Nuić, I.; Ugrina, M. Design of fixed bed column for lead removal on natural zeolite based on batch studies. Chem. Biochem. Eng. Q. 2013, 27, 21–28. [Google Scholar]
- Nuić, I.; Trgo, M.; Perić, J.; Vukojević Medvidović, N. Analysis of breakthrough curves of Pb and Zn sorption from binary solutions on natural clinoptilolite. Micropor. Mesopor. Mat. 2013, 167, 55–61. [Google Scholar] [CrossRef]
- Nuić, I.; Trgo, M.; Perić, J.; Vukojević Medvidović, N. Uptake of Pb and Zn from a binary solution onto different fixed bed depths of natural zeolite—The BDST model approach. Clay Miner. 2015, 50, 91–101. [Google Scholar] [CrossRef]
- Nuić, I.; Trgo, M.; Vukojević Medvidović, N. The application of the packed bed reactor theory to Pb and Zn uptake from the binary solution onto the fixed bed of natural zeolite. Chem. Eng. J. 2016, 295, 347–357. [Google Scholar] [CrossRef]
- Kratochvil, D.; Volesky, B. Advances in the biosorption of heavy metals. Trends Biotechnol. 1998, 16, 291–300. [Google Scholar] [CrossRef] [Green Version]
- Figueira, M.M.; Volesky, B.; Azarian, K.; Ciminelli, V.S.T. Biosorption Column Performance with a Metal Mixture. Environ. Sci. Technol. 2000, 34, 4320–4326. [Google Scholar] [CrossRef]
- Sağ, Y.; Kutsal, T. Recent Trends in the Biosorption of Heavy Metals: A Review. Biotechnol. Bioprocess Eng. 2001, 6, 376–385. [Google Scholar] [CrossRef]
- Naja, G.; Volesky, B. Multi-metal biosorption in a fixed-bed flow-through column. Colloids Surf A Physicochem. Eng. Asp. 2006, 281, 194–201. [Google Scholar] [CrossRef]
- Escudero, C.; Poch, J.; Villaescusa, I. Modelling of breakthrough curves of single and binary mixtures of Cu(II), Cd(II), Ni(II) and Pb(II) sorption onto grape stalks waste. Chem. Eng. J. 2013, 217, 129–138. [Google Scholar] [CrossRef]
- Minčeva, M.; Fajgar, R.; Markovska, L.; Meshko, V. Comparative study of Zn2+, Cd2+, and Pb2+ removal from water solution using natural clinoptilolitic zeolite and commercial granulated activated carbon. Equilibrium of Adsorption. Sep. Sci. Technol. 2008, 43, 2117–2143. [Google Scholar] [CrossRef]
- Doran, P.M. Bioprocess Engineering Principles, 2nd ed.; Elsevier Science Publishing Co Inc.: San Diego, CA, USA, 2012; pp. 379–444, ISBN10 012220851X, ISBN13 9780122208515. [Google Scholar]
- Kockmann, N. Transport Phenomena in Micro Process Engineering; Springer: Berlin, Germany; Heidelberg, Germany; Leipzig, Germany, 2008; pp. 163–290. ISBN 978-3-540-74616-4. [Google Scholar]
- Miložič, N.; Lubej, M.; Novak, U.; Žnidaršič-Plazl, P.; Plazl, I. Evaluation of Diffusion Coefficient Determination using a Microfluidic Device. Chem. Biochem. Eng. Q. 2014, 28, 215–223. [Google Scholar] [CrossRef]
- Ugrina, M.; Vukojević Medvidović, N.; Daković, A. Characterization and environmental application of iron-modified zeolite from the Zlatokop deposit. Desalin. Water Treat. 2015, 53, 3557–3569. [Google Scholar] [CrossRef]
- Bohli, T.; Villaescusa, I.; Ouederni, A. Comparative Study of Bivalent Cationic Metals Adsorption Pb(II), Cd(II), Ni(II) and Cu(II) on Olive Stones Chemically Activated Carbon. J. Chem. Eng. Process Technol. 2013, 4, 1–7. [Google Scholar] [CrossRef]
- Fanou, D.; Yao, B.; Siaka, S.; Ado, G. Heavy metals removal in aqueous solution by two Delta-diketons. J. Appl. Sci. 2007, 7, 310–313. [Google Scholar] [CrossRef]
- Katsou, E.; Malamis, S.; Tzanoudaki, M.; Haralambous, K.J.; Loizidou, M. Regeneration of natural zeolite polluted by lead and zinc in wastewater treatment systems. J. Hazard. Mater. 2011, 189, 773–786. [Google Scholar] [CrossRef] [PubMed]
- Zamzow, M.J.; Eichbaum, B.R.; Sandgren, K.R.; Shanks, D.E. Removal of heavy metals and other cations from wastewater using zeolites. Sep. Sci. Technol. 1990, 25, 1555–1569. [Google Scholar] [CrossRef]
- Semmens, M.J.; Martin, W.P. The influence of pretreatment on the capacity and selectivity of clinoptilolite for metal ions. Water Res. 1988, 22, 537–542. [Google Scholar] [CrossRef]
- McCabe, W.L.; Smith, J.C.; Harriott, P. Unit Operations of Chemical Engineering, 5th ed.; McGraw-Hill International Editions: Singapore, 1993; pp. 647–736. ISBN 0-07-044844-2. [Google Scholar]
- Mantovaneli, I.C.C.; Ferretti, E.C.; Simoes, M.R.; Ferreira da Silva, C. The effect of temperature and flow rate on the clarification of the aqueous stevia-extract in a fixed bed column with zeolites. Braz. J. Chem. Eng. 2004, 21, 449–458. [Google Scholar] [CrossRef]
- Inglezakis, J.V. Ion exchange and adsorption fixed bed operations for wastewater treatment—Part I: Modeling fundamentals and hydraulics analysis. J. Eng. Stud. Res. 2010, 16, 29–41. [Google Scholar]
- Kraakman, N.J.R.; Rocha-Rios, J.; van Loosdrecht, M.C.M. Review of mass transfer aspects for biological gas treatment. Appl. Microbiol. Biotechnol. 2011, 91, 873–886. [Google Scholar] [CrossRef] [PubMed] [Green Version]
- Barros, M.A.S.D.; Zola, A.S.; Arroyo, P.A.; Sousa-Aguiar, E.F.; Tavares, C.R.G. Binary ion exchange of metal Ions in y and x zeolites. Braz. J. Chem. Eng. 2003, 20, 413–421. [Google Scholar] [CrossRef]
- Kragović, M.; Daković, A.; Marković, M.; Krstić, J.; Gatta, G.D.; Rotiroti, N. Characterization of lead sorption by the natural and Fe(III)-modified zeolite. Appl. Surf. Sci. 2013, 283, 764–774. [Google Scholar] [CrossRef]


| Concentration Ratio in Binary Solutions | VB (L) | tB (h) | VE (L) | tE (h) | Metal Ions | qB (mmol/g) | qE (mmol/g) | η (-) | ||
|---|---|---|---|---|---|---|---|---|---|---|
| Pb/Zn = 0.19 | 2.62 | 43.67 | 4.42 | 73.58 | Pb + Zn | 0.404 | 0.487 | 0.83 | 0.19 | 0.25 |
| Pb | 0.066 | 0.099 | ||||||||
| Zn | 0.338 | 0.388 | ||||||||
| Pb/Zn = 1.07 * | 2.72 | 45.25 | 4.39 | 73.08 | Pb + Zn | 0.430 | 0.508 | 0.85 | 1.07 | 2.48 |
| Pb | 0.222 | 0.362 | ||||||||
| Zn | 0.208 | 0.146 | ||||||||
| Pb/Zn = 2.15 | 2.91 | 48.50 | 5.12 | 85.25 | Pb + Zn | 0.460 | 0.564 | 0.82 | 2.15 | 13.4 |
| Pb | 0.314 | 0.525 | ||||||||
| Zn | 0.146 | 0.039 | ||||||||
| Cd/Zn = 0.14 | 2.68 | 44.58 | 4.02 | 67.00 | Cd + Zn | 0.432 | 0.519 | 0.83 | 0.14 | 0.17 |
| Cd | 0.053 | 0.074 | ||||||||
| Zn | 0.379 | 0.445 | ||||||||
| Cd/Zn = 1.07 | 2.67 | 44.50 | 4.40 | 73.33 | Cd + Zn | 0.437 | 0.547 | 0.80 | 1.07 | 1.27 |
| Cd | 0.226 | 0.306 | ||||||||
| Zn | 0.211 | 0.241 | ||||||||
| Cd/Zn = 1.93 | 2.65 | 44.17 | 3.91 | 65.08 | Cd + Zn | 0.395 | 0.496 | 0.79 | 1.95 | 2.14 |
| Cd | 0.261 | 0.338 | ||||||||
| Zn | 0.134 | 0.158 |
| Concentration Ratio in Binary Solutions | VR (L) | tR (h) | Metal Ions | nR (mmol) | αR (-) | |
|---|---|---|---|---|---|---|
| Pb/Zn = 0.19 | 0.59 | 9.92 | Pb + Zn | 4.101 | ||
| Pb | 1.016 | 0.33 | 1.43 | |||
| Zn | 3.085 | |||||
| Pb/Zn = 1.07 | 0.84 | 14.00 | Pb + Zn | 4.066 | ||
| Pb | 3.675 | 9.39 | 1.36 | |||
| Zn | 0.391 | |||||
| Pb/Zn = 2.15 | 0.72 | 12.00 | Pb + Zn | 3.791 | ||
| Pb | 3.661 | 28.16 | 1.14 | |||
| Zn | 0.130 | |||||
| Cd/Zn = 0.14 | 0.43 | 7.17 | Cd + Zn | 3.708 | ||
| Cd | 0.540 | 0.17 | 1.21 | |||
| Zn | 3.168 | |||||
| Cd/Zn = 1.07 | 0.49 | 8.17 | Cd + Zn | 3.880 | ||
| Cd | 2.182 | 1.29 | 1.20 | |||
| Zn | 1.698 | |||||
| Cd/Zn = 1.93 | 0.31 | 5.17 | Cd + Zn | 4.163 | ||
| Cd | 2.503 | 1.51 | 1.42 | |||
| Zn | 1.660 |
| Concentration Ratio in Binary Solutions | Metal Ions | τ - | N (-) | GW (kg/min m2) | Ka (kg/min m3) |
|---|---|---|---|---|---|
| Pb/Zn = 0.19 | Pb + Zn | 0.59 | 2.27 | 12.73 | 361 |
| Pb | /* | /* | |||
| Zn | 3.18 | 506 | |||
| Pb/Zn = 1.07 | Pb + Zn | 0.62 | 2.08 | 12.73 | 304 |
| Pb | 6.30 | 918 | |||
| Zn | 0.46 | 68 | |||
| Pb/Zn = 2.15 | Pb + Zn | 0.57 | 2.05 | 12.73 | 326 |
| Pb | 4.15 | 660 | |||
| Zn | 0.14 | 22 | |||
| Cd/Zn = 0.14 | Cd + Zn | 0.67 | 3.48 | 12.73 | 554 |
| Cd | /* | /* | |||
| Zn | 4.66 | 741 | |||
| Cd/Zn = 1.07 | Cd + Zn | 0.61 | 3.26 | 12.73 | 518 |
| Cd | 5.45 | 868 | |||
| Zn | 2.04 | 324 | |||
| Cd/Zn = 1.93 | Cd + Zn | 0.68 | 3.68 | 12.73 | 586 |
| Cd | 7.82 | 1244 | |||
| Zn | 0.34 | 55 |
© 2019 by the authors. Licensee MDPI, Basel, Switzerland. This article is an open access article distributed under the terms and conditions of the Creative Commons Attribution (CC BY) license (http://creativecommons.org/licenses/by/4.0/).
Share and Cite
Nuić, I.; Trgo, M.; Vukojević Medvidović, N.; Ugrina, M. A Mass Transfer Analysis of Competitive Binding of Pb, Cd, and Zn from Binary Systems onto a Fixed Zeolite Bed. Int. J. Environ. Res. Public Health 2019, 16, 426. https://doi.org/10.3390/ijerph16030426
Nuić I, Trgo M, Vukojević Medvidović N, Ugrina M. A Mass Transfer Analysis of Competitive Binding of Pb, Cd, and Zn from Binary Systems onto a Fixed Zeolite Bed. International Journal of Environmental Research and Public Health. 2019; 16(3):426. https://doi.org/10.3390/ijerph16030426
Chicago/Turabian StyleNuić, Ivona, Marina Trgo, Nediljka Vukojević Medvidović, and Marin Ugrina. 2019. "A Mass Transfer Analysis of Competitive Binding of Pb, Cd, and Zn from Binary Systems onto a Fixed Zeolite Bed" International Journal of Environmental Research and Public Health 16, no. 3: 426. https://doi.org/10.3390/ijerph16030426