Physiological Changes of Parachlorella Kessleri TY02 in Lipid Accumulation under Nitrogen Stress


Abstract
:1. Introduction
2. Materials and Methods
2.1. Algal Strain and Cultivation
2.2. Growth Conditions and Nitrogen Stress Treatment
2.3. Determination of Algal Growth
2.3.1. Absorbance
2.3.2. Dry Weight
2.4. Determination of Chlorophyll and Carotenoids
2.5. Determination of Chlorophyll Fluorescence
2.6. Determination of Neutral Lipid Content
2.7. Confocal Laser Scanning Microscopy
2.8. Determination of Total Lipid Content
2.9. Determination of Fatty Acid
2.10. Determination of Total Protein Content
2.11. Determination of Total Carbohydrate Content
2.12. Statistical Analysis
3. Results
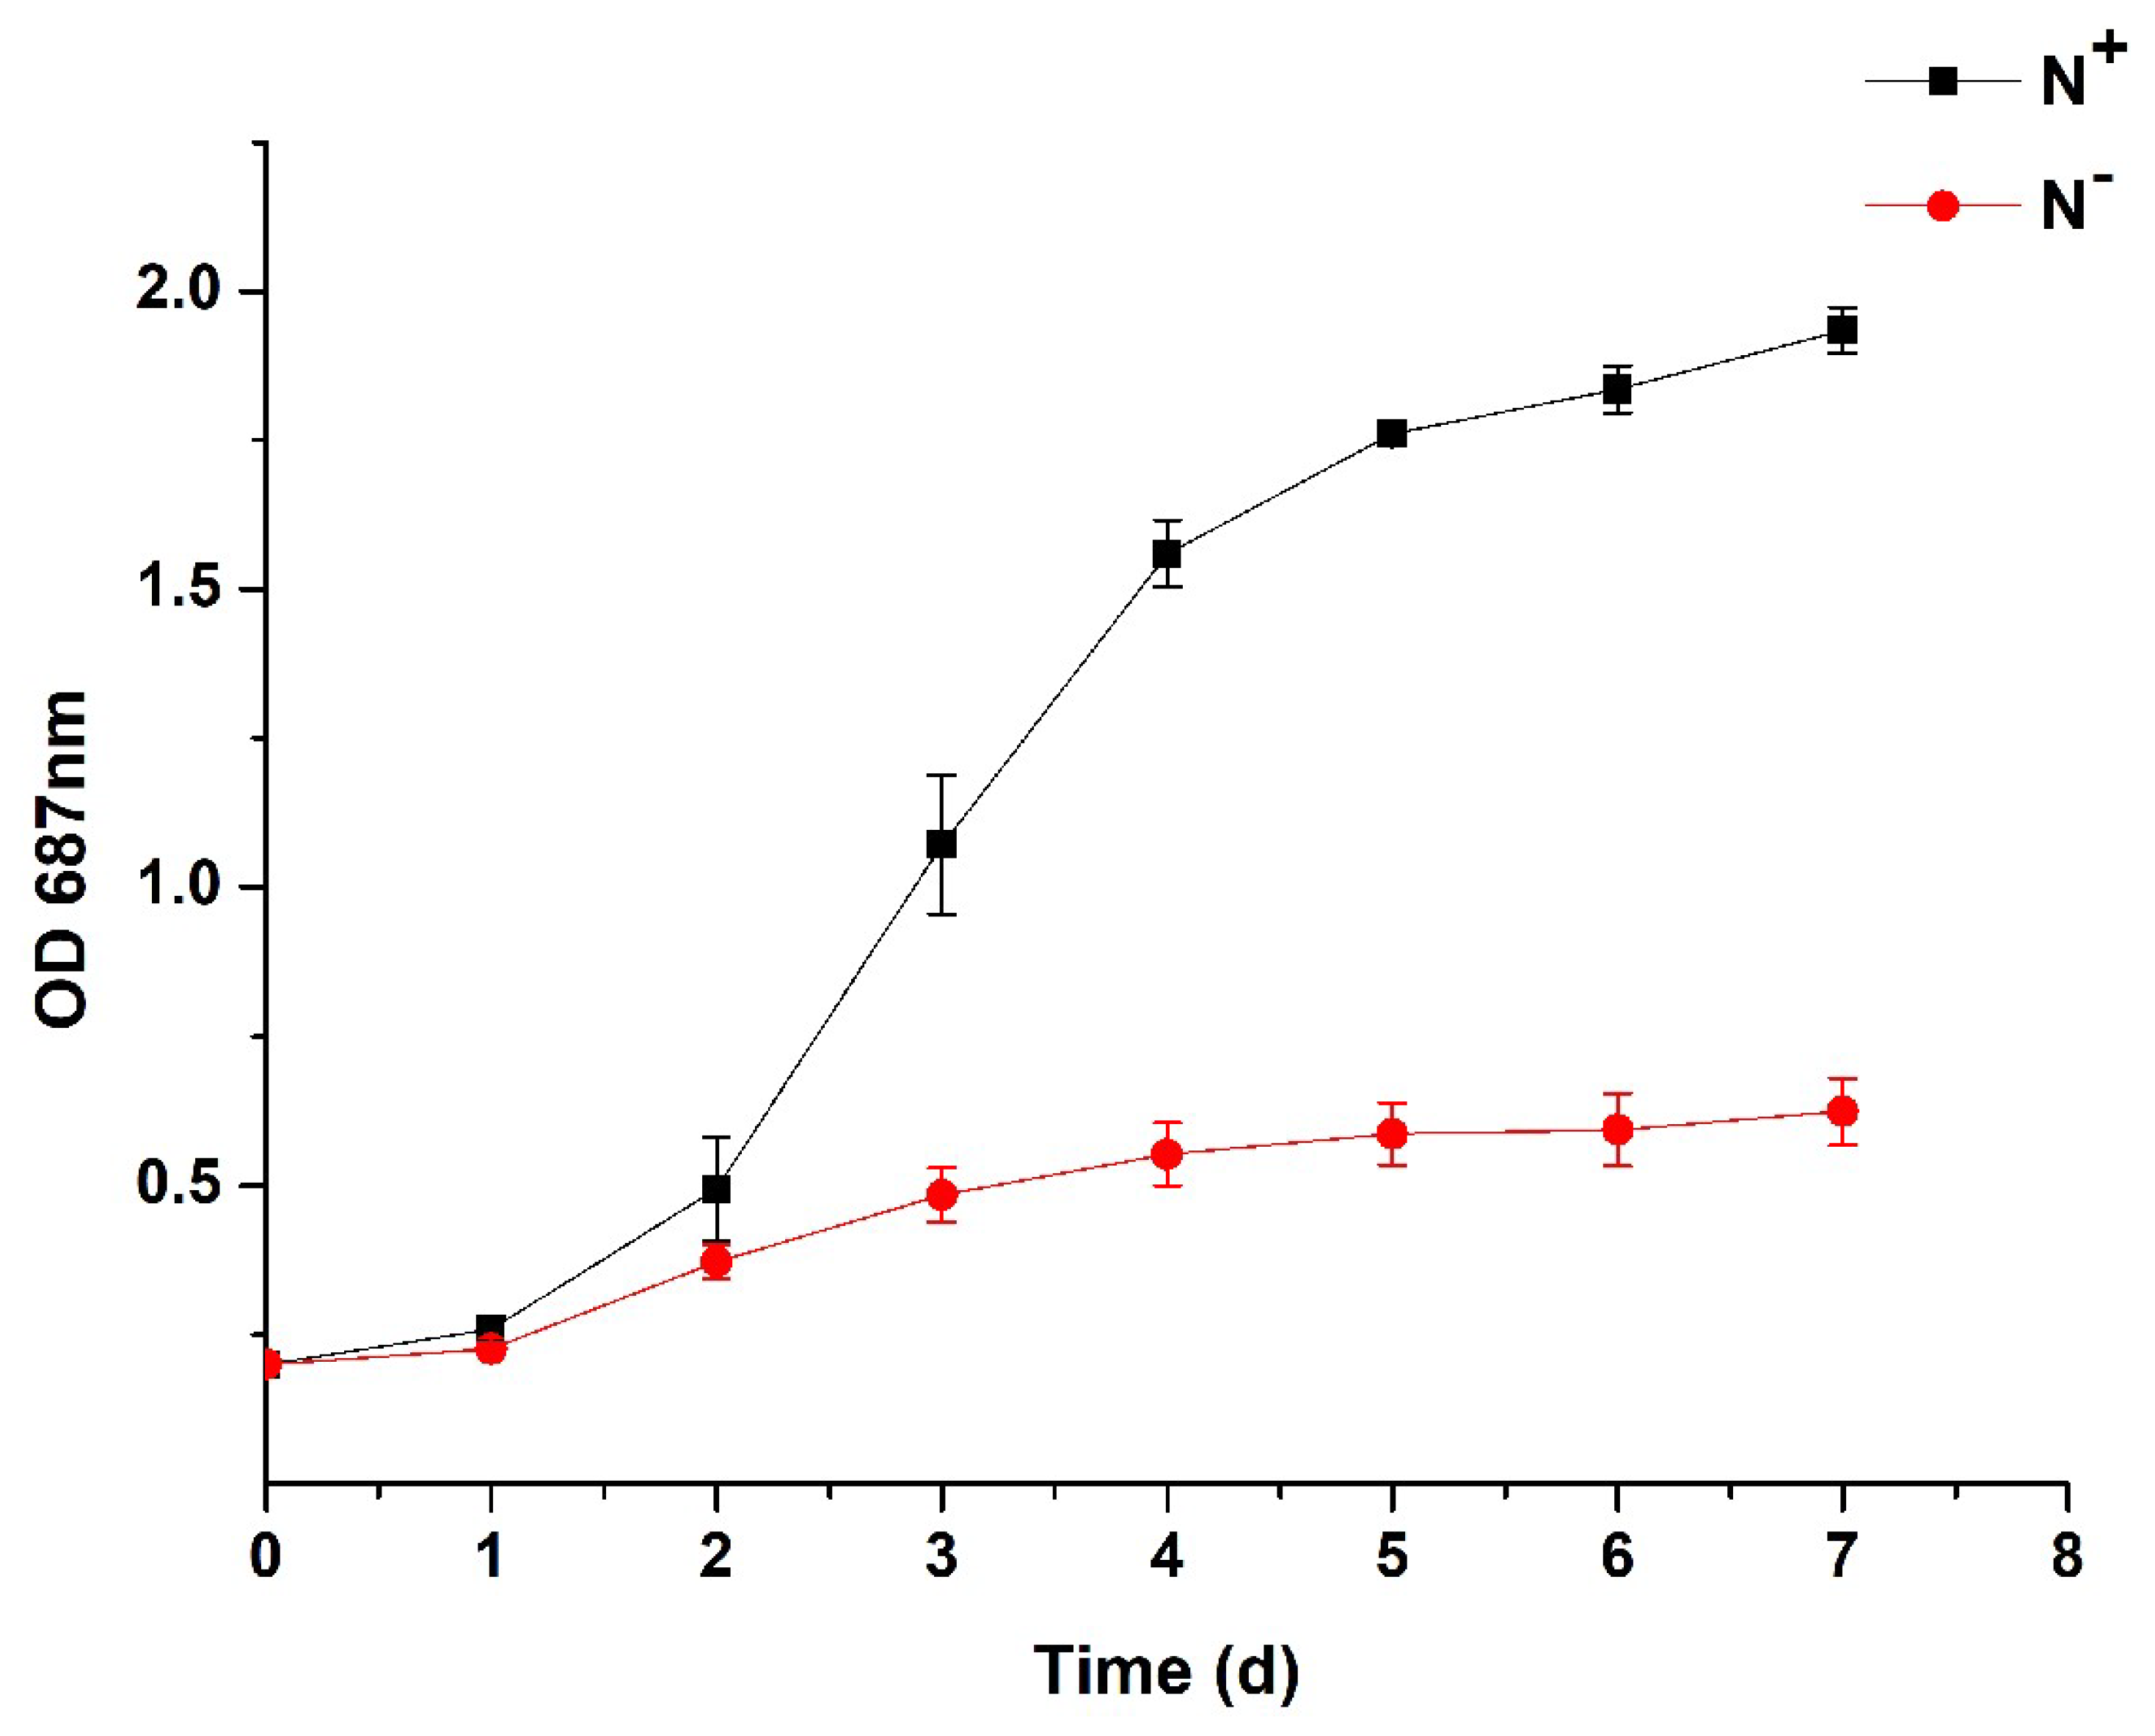
3.1. Algal Growth
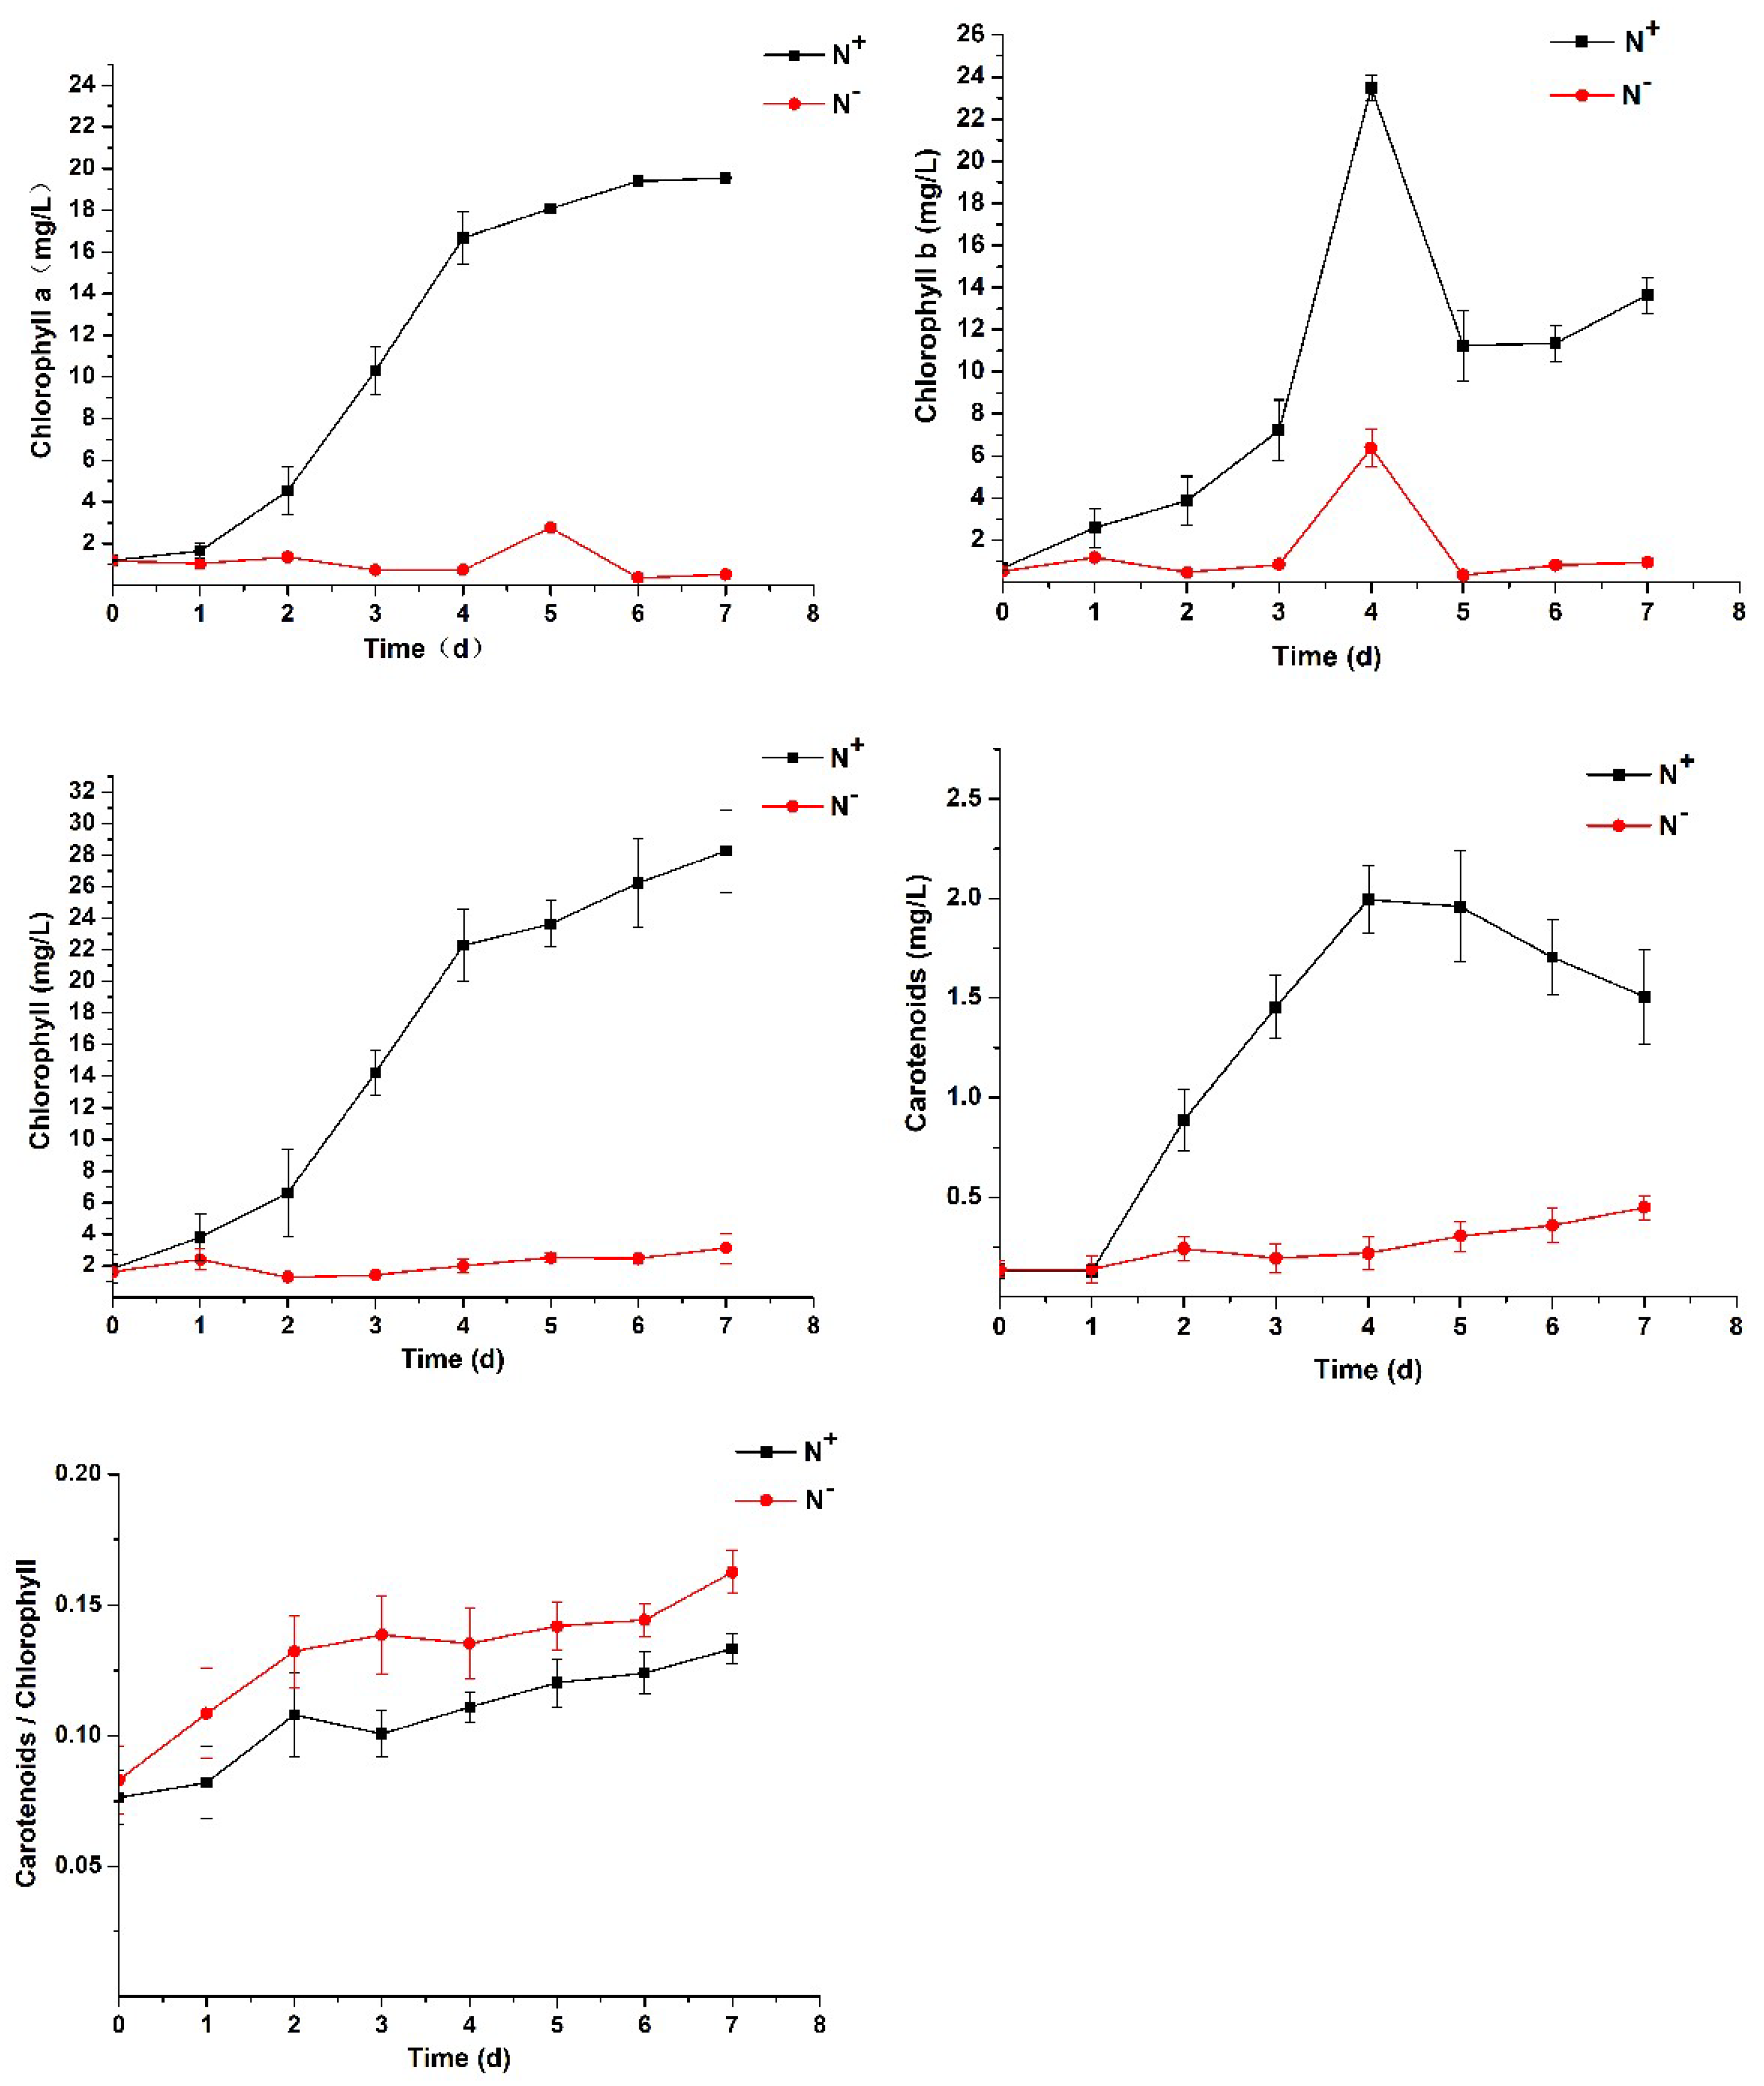
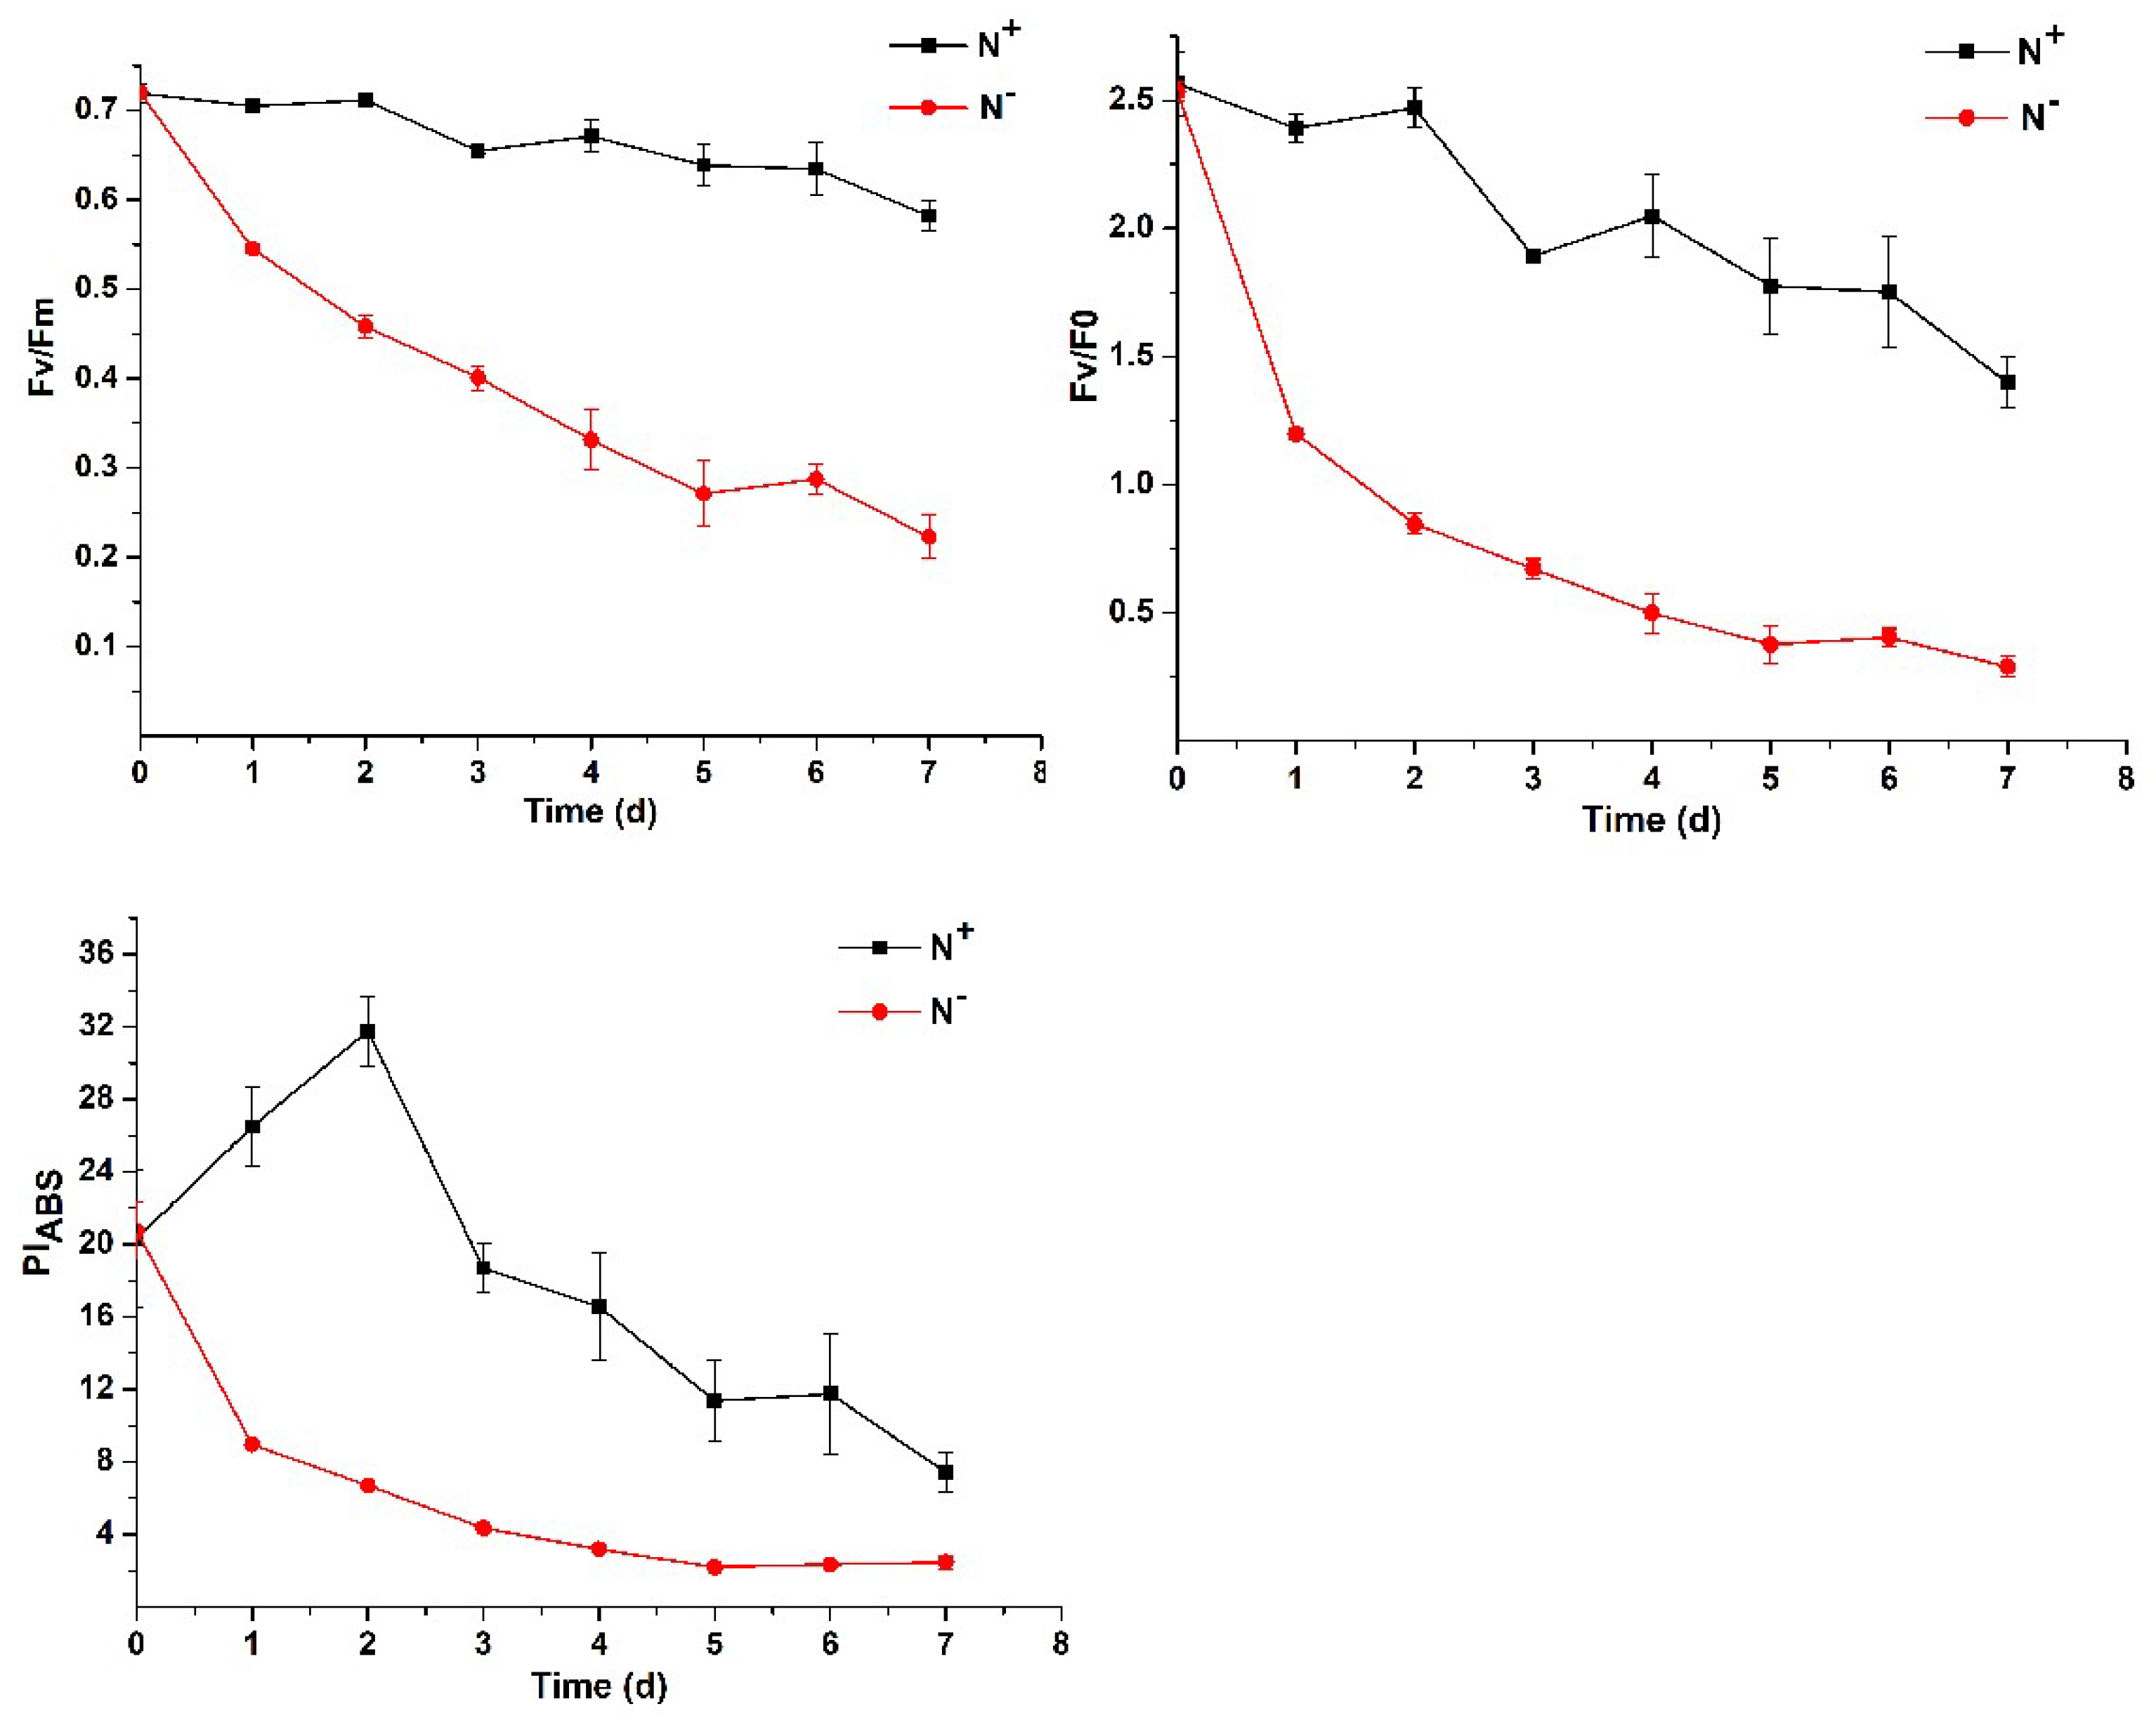
3.2. Contents of Chlorophyll and Carotenoids and Analysis of Chlorophyll Fluorescence
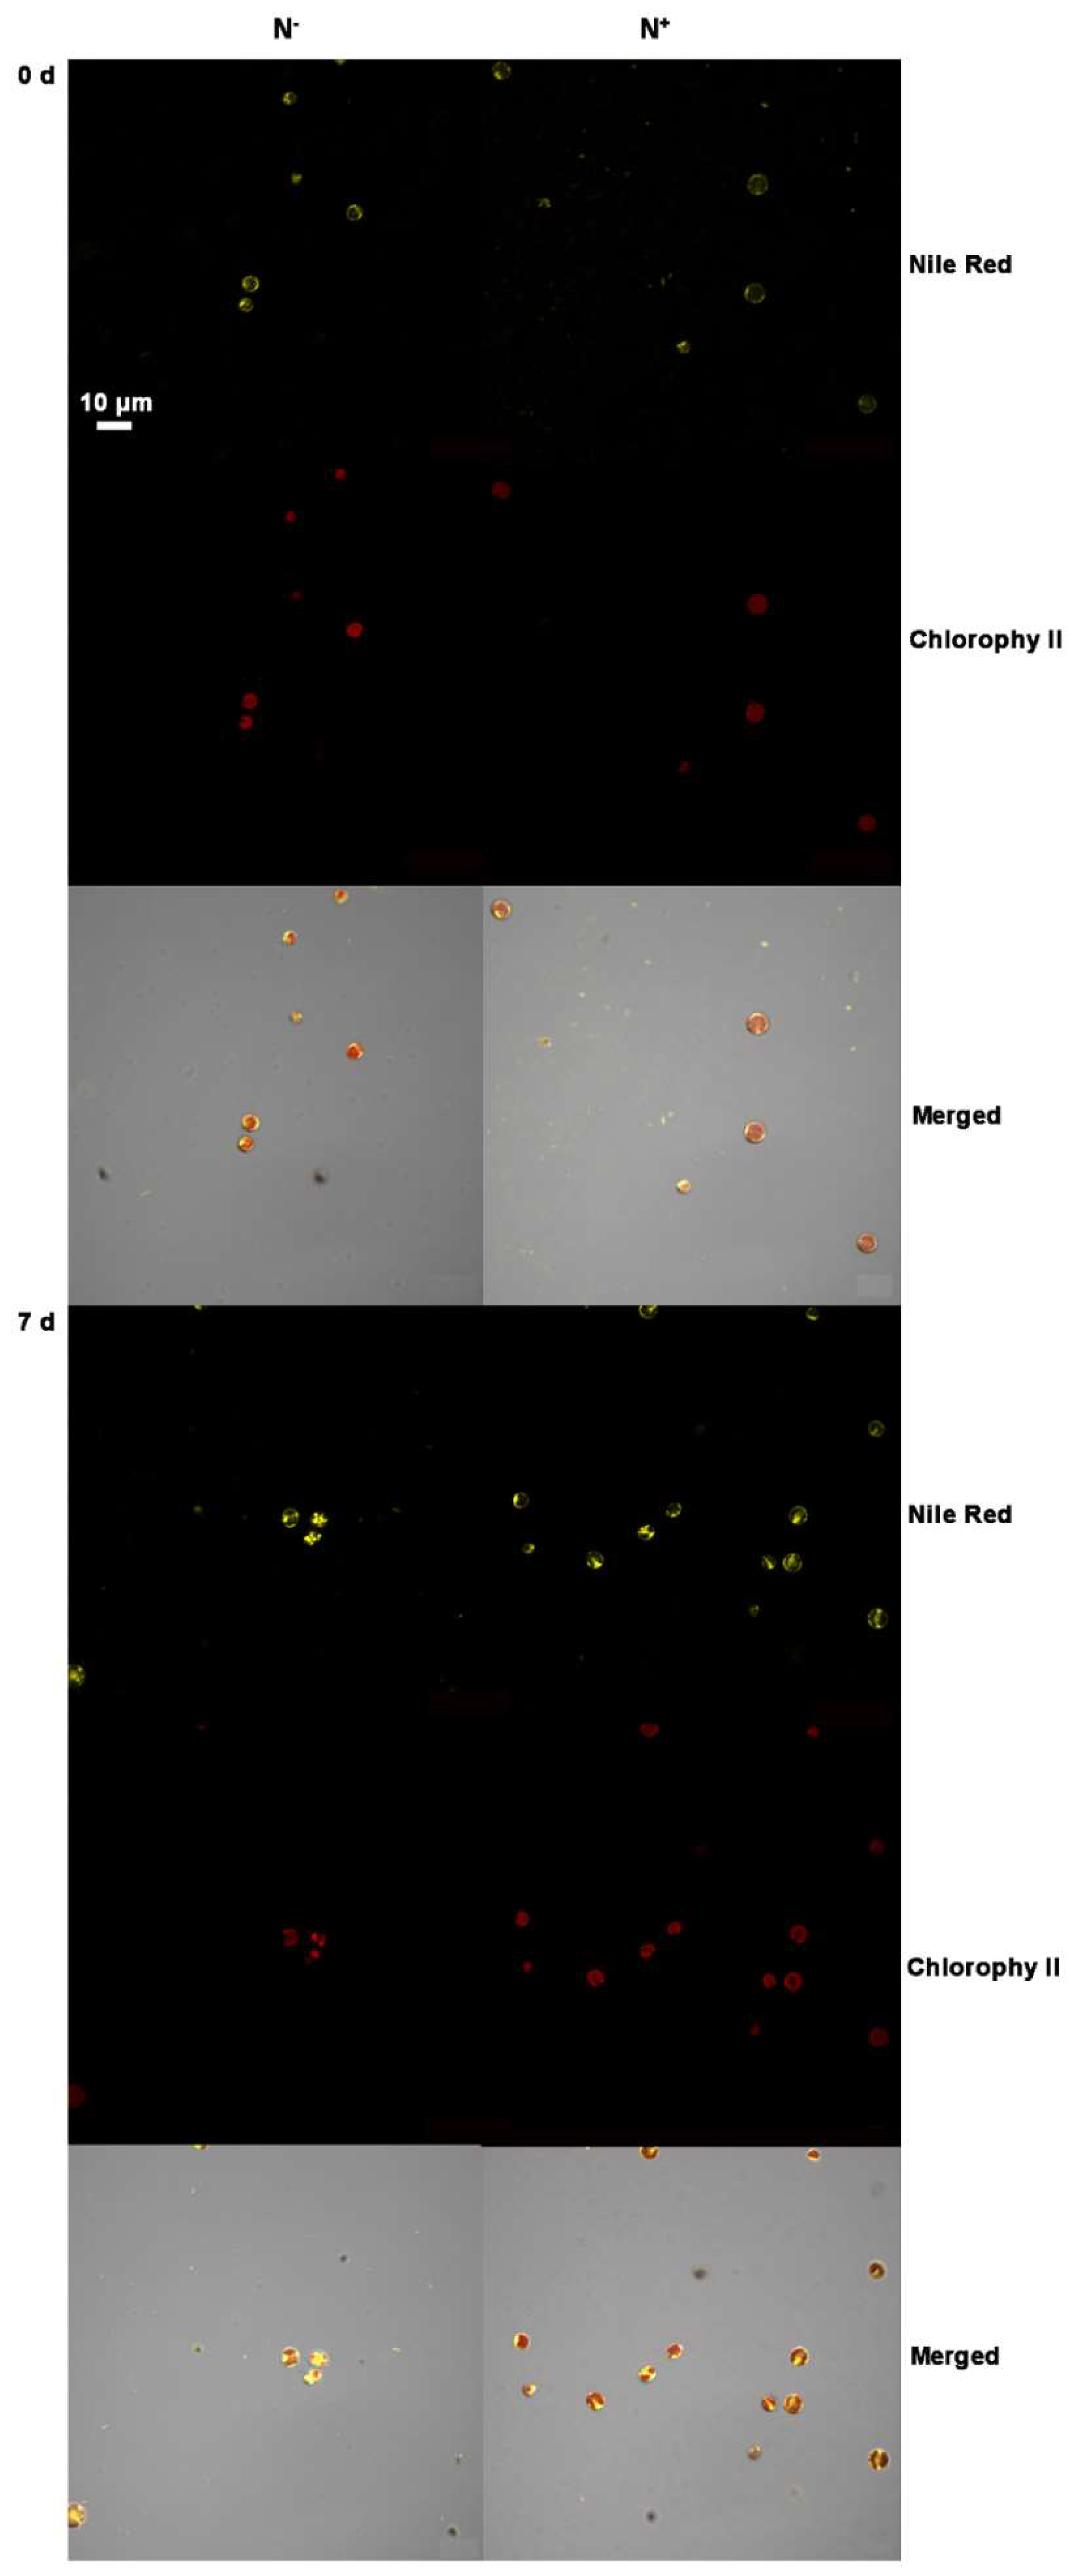
3.3. Analysis of Neutral Lipids Content
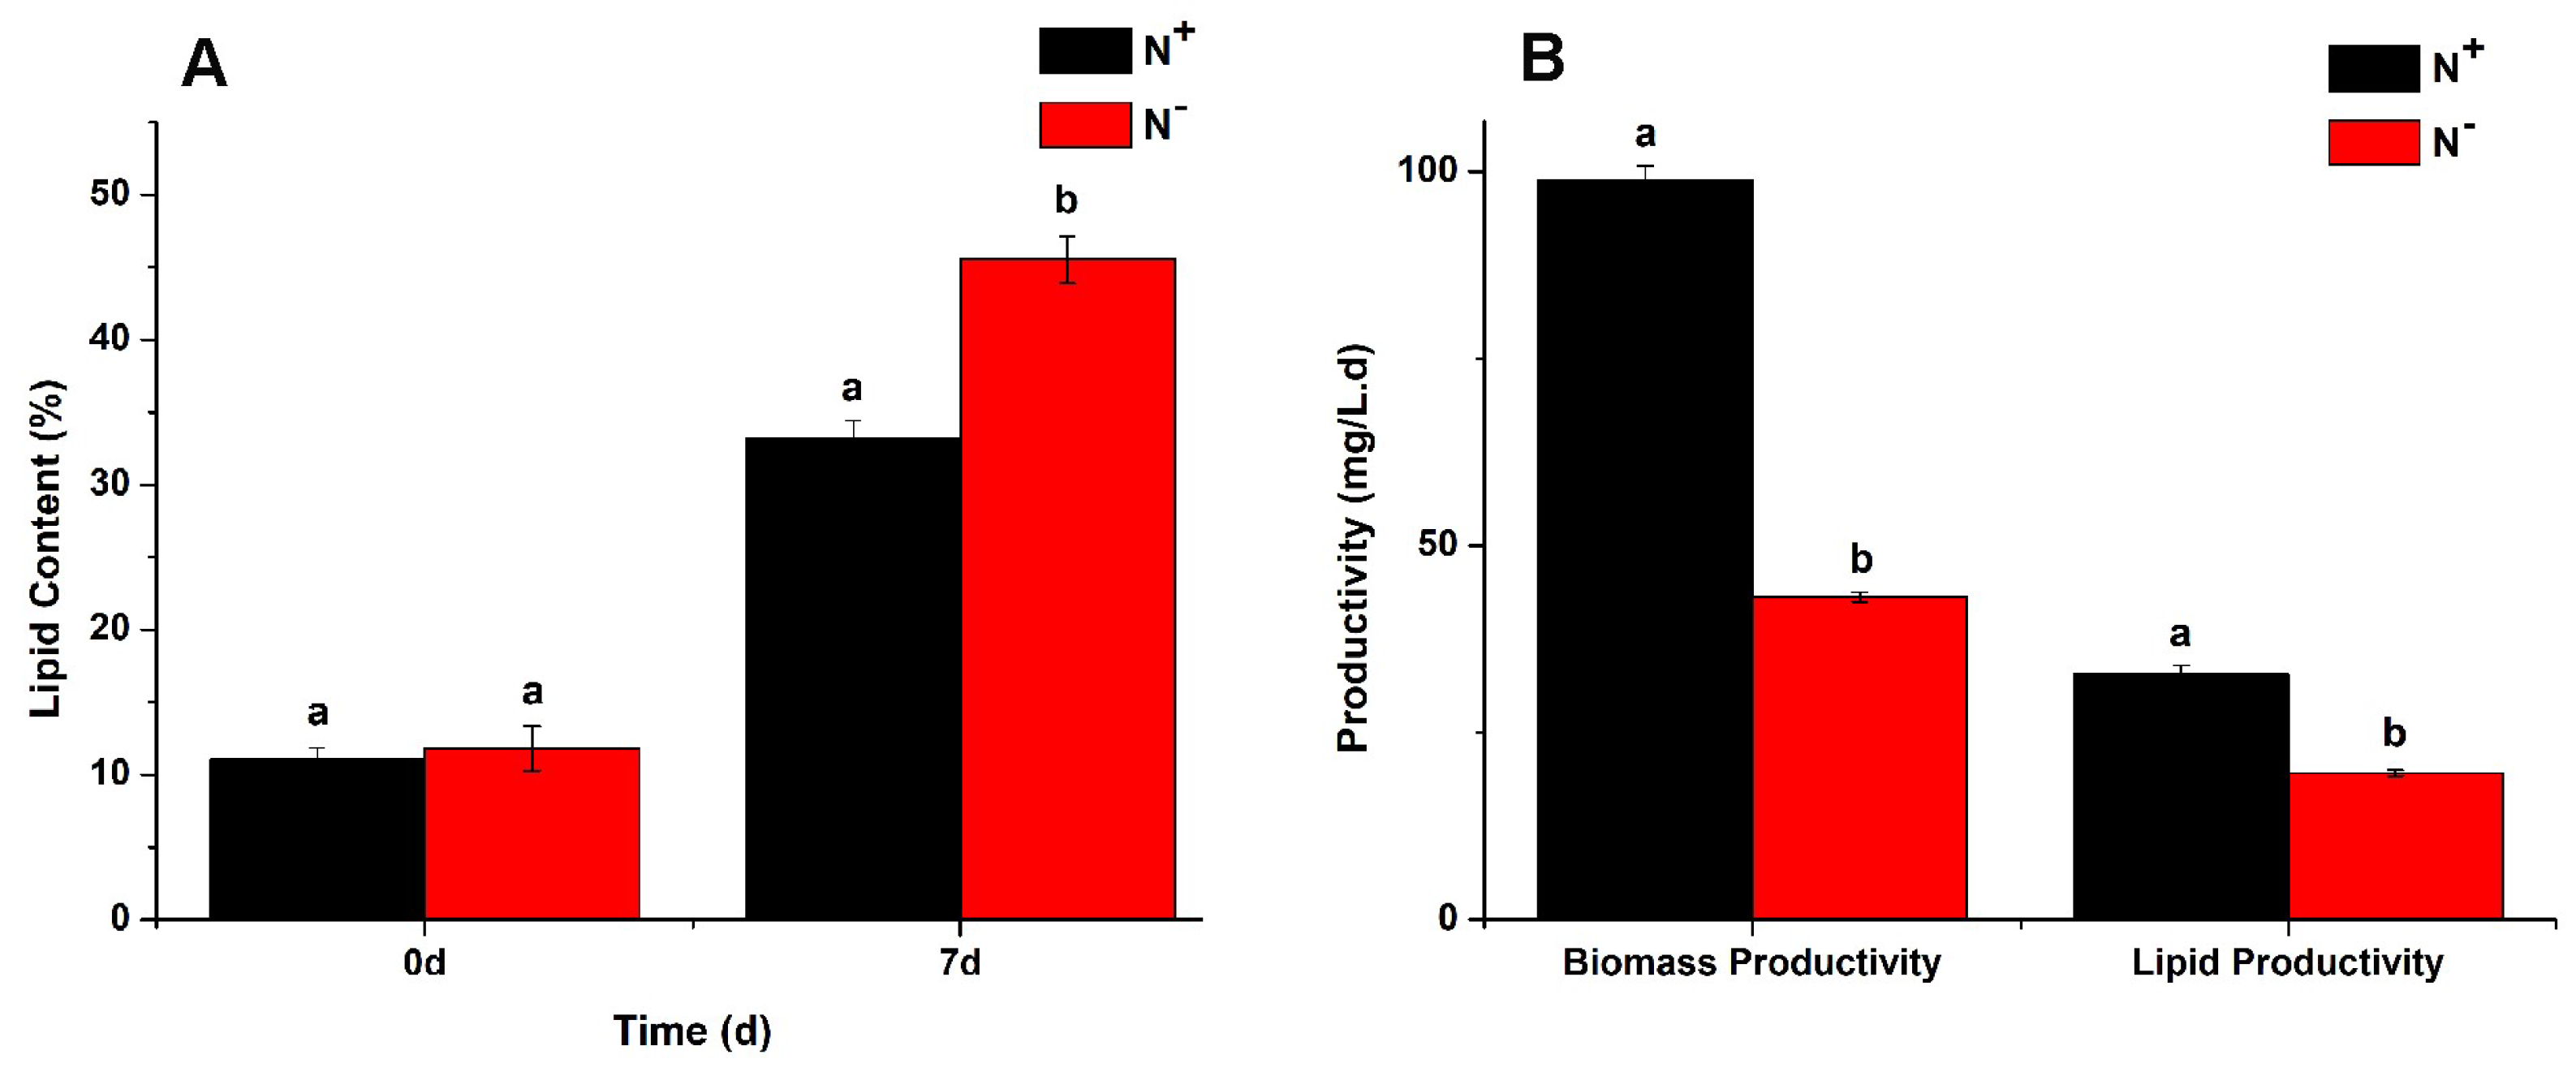
3.4. Contents of Total Lipids
3.5. Analysis of Fatty Acids
3.6. Total Protein Contents
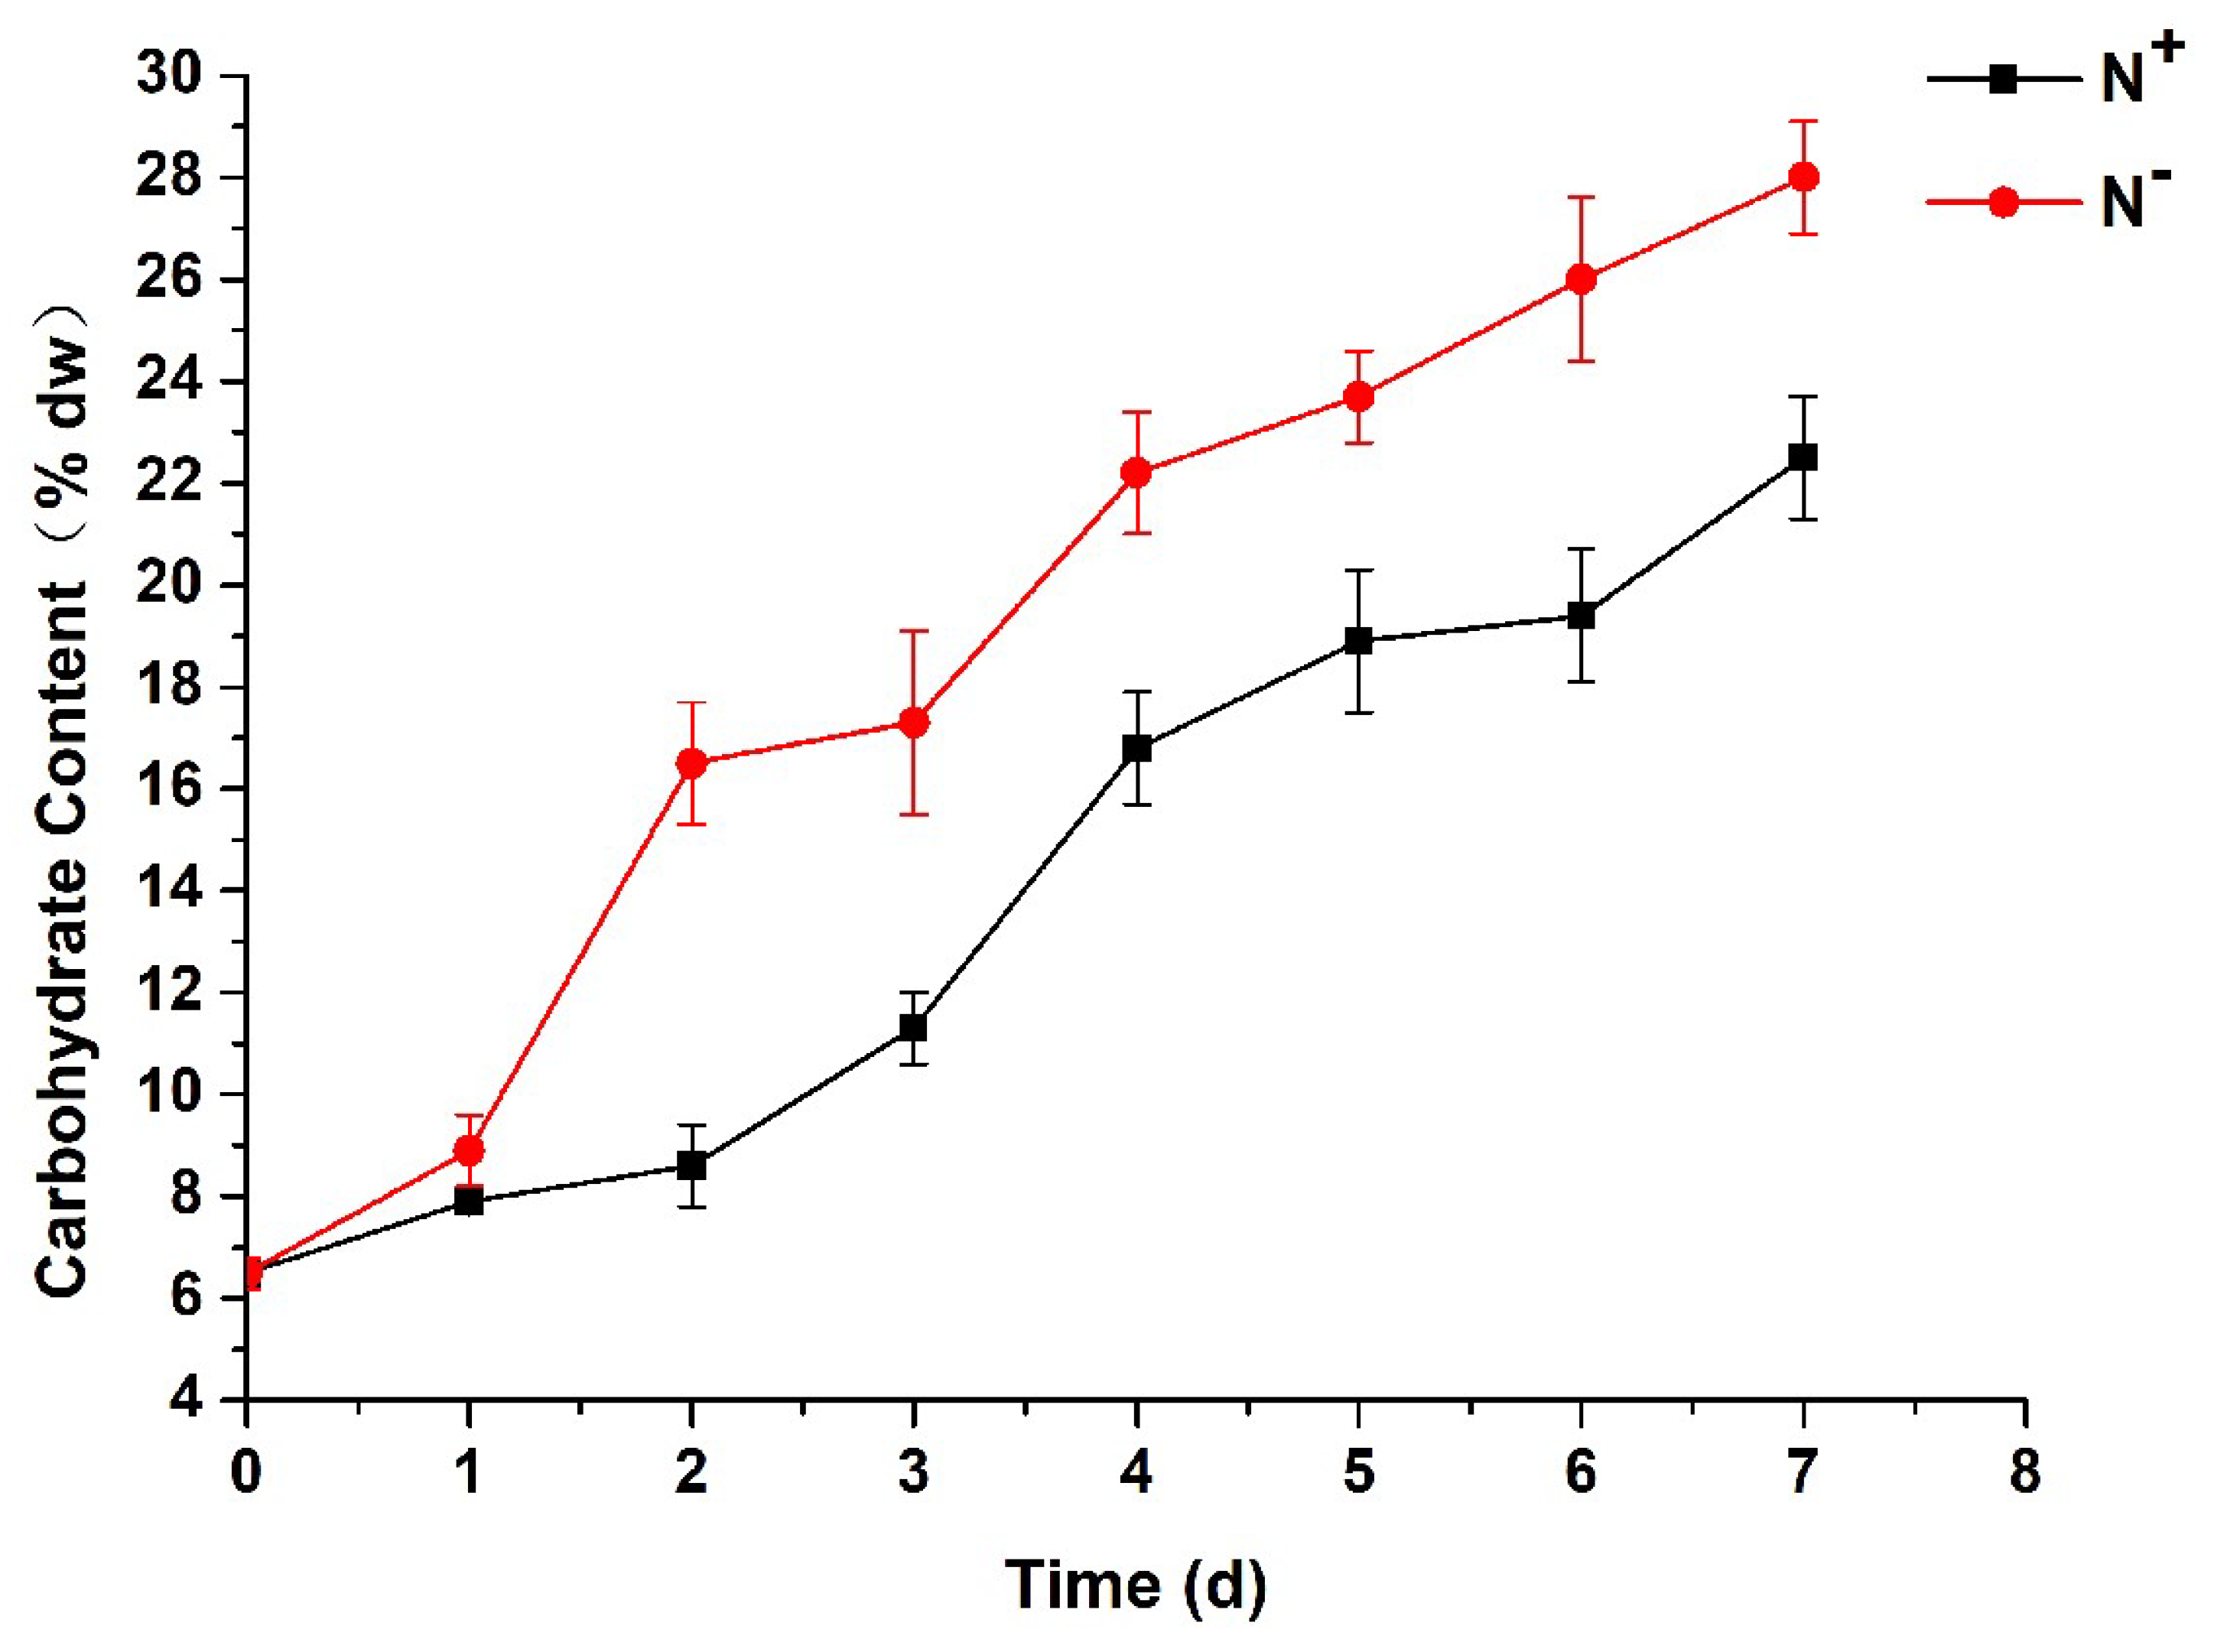
3.7. Contents of Total Carbohydrates
4. Discussion
5. Conclusions
Author Contributions
Funding
Acknowledgments
Conflicts of Interest
References
- Ma, Y.Q.; Gao, Z.; Wang, Q.H.; Liu, Y. Biodiesels from microbial oils: Opportunity and challenges. Bioresour. Technol. 2018, 263, 631–641. [Google Scholar] [CrossRef]
- Koller, M.; Muhr, A.; Braunegg, G. Microalgae as versatile cellular factories for valued products. Algal Res. 2014, 6, 52–63. [Google Scholar] [CrossRef]
- Nirupama, M.; Bagchi, S.K.; Shankha, K.; Akhilesh, K. Progress and challenges in microalgal biodiesel production. Front. Microbiol. 2016, 7, 1–11. [Google Scholar] [CrossRef]
- Dutta, S.; Neto, F.; Coelho, M.C. Microalgae biofuels: A comparative study on techno-economic analysis & life-cycle assessment. Algal Res. 2016, 20, 44–52. [Google Scholar] [CrossRef]
- Taparia, T.; Manjari, M.; Mehrotra, R.; Shukla, P.; Mehrotra, S. Developments and challenges in biodiesel production from microalgae: A review. Biotechnol. Appl. Biochem. 2016, 63, 715–726. [Google Scholar] [CrossRef] [PubMed]
- Rahman, M.A.; Aziz, M.A.; Ruhul, A.M.; Rashid, M. Biodiesel production process optimization from Spirulina maxima microalgae and performance investigation in a diesel engine. J. Mech. Sci. Technol. 2017, 31, 3025–3033. [Google Scholar] [CrossRef] [Green Version]
- Srivastava, G.; Goud, V.V. Salinity induced lipid production in microalgae and cluster analysis (ICCB 16-BR_047). Bioresour. Technol. 2017, 242, 244–252. [Google Scholar] [CrossRef] [PubMed]
- Han, F.; Pei, H.Y.; Hu, W.R.; Han, L.; Zhang, S.; Ma, G.X. Effect of high temperature stress on microalgae at the end of the logarithmic phase for the efficient production of lipid. Environ. Technol. 2016, 37, 2649–2657. [Google Scholar] [CrossRef]
- He, Q.N.; Yang, H.J.; Wu, L.; Hu, C.X. Effect of light intensity on physiological changes, carbon allocation and neutral lipid accumulation in oleaginous microalgae. Bioresour. Technol. 2015, 191, 219–228. [Google Scholar] [CrossRef] [Green Version]
- Satpati, G.G.; Gorain, P.C.; Pal, R. Efficacy of EDTA and phosphorous on biomass yield and total lipid accumulation in two green microalgae with special emphasis on neutral lipid detection by flow cytometry. Adv. Biol. 2016, 2016, 8712470. [Google Scholar] [CrossRef]
- Concas, A.; Steriti, A.; Pisu, M.; Cao, G. Comprehensive modeling and investigation of the effect of iron on the growth rate and lipid accumulation of Chlorella vulgaris cultured in batch photobioreactors. Bioresour. Technol. 2013, 153, 340–350. [Google Scholar] [CrossRef]
- Zhang, Y.M.; Chen, H.; He, C.L.; Wang, Q. Nitrogen starvation induced oxidative stress in an oil-producing green alga Chlorella sorokiniana C3. PLoS ONE 2013, 8, e69225. [Google Scholar] [CrossRef] [PubMed]
- Zhu, S.N.; Wang, Y.J.; Shang, C.H.; Wang, Z.M.; Xu, J.L.; Yuan, Z.H. Characterization of lipid and fatty acids composition of Chlorella zofingiensis in response to nitrogen starvation. J. Biosci. Bioeng. 2015, 120, 205–209. [Google Scholar] [CrossRef]
- Chinnasamy, S.; Bhatnagar, A.; Hunt, R.W.; Das, K.C. Microalgae cultivation in a wastewater dominated by carpet mill effluents for biofuel applications. Bioresour. Technol. 2010, 101, 3097–3105. [Google Scholar] [CrossRef]
- Huang, X.X.; Huang, Z.Z.; Wen, W.; Yan, J.Q. Effects of nitrogen supplementation of the culture medium on the growth, total lipid content and fatty acid profiles of three microalgae (Tetraselmis subcordiformis, Nannochloropsis oculata and Pavlova viridis). J. Appl. Physiol. 2013, 25, 129–137. [Google Scholar] [CrossRef]
- Jia, J.; Han, D.; Gerken, H.G.; Li, Y.; Sommerfeld, M.; Hu, Q.; Xu, J. Molecular mechanisms for photosynthetic carbon partitioning into storage neutral lipids in Nannochloropsis oceanica under nitrogen-depletion conditions. Algal Res. 2015, 7, 66–77. [Google Scholar] [CrossRef]
- Gao, Y.F.; Lv, J.P.; Feng, J.; Liu, Q.; Xie, S.L. Morphology, phylogeny and lipid components of an oil-rich microalgal strain. J. Appl. Bot. Food Qual. 2017, 90, 298–305. [Google Scholar] [CrossRef]
- Deng, X.D.; Fei, X.W.; Li, Y.J. The effects of nutritional restriction on neutral lipid accumulation in Chlamydomonas and Chlorella. Afr. J. Microbiol. Res. 2011, 5, 260–270. [Google Scholar] [CrossRef]
- Lv, J.P.; Guo, J.Y.; Feng, J.; Liu, Q.; Xie, S.L. Effect of sulfate ions on growth and pollutants removal of self-flocculating microalga Chlorococcum sp. GD in synthetic municipal wastewater. Bioresour. Technol. 2017, 234, 289–296. [Google Scholar] [CrossRef]
- Mera, R.; Torres, E.; Abalde, J. Effects of sodium sulfate on the freshwater microalga Chlamydomonas moewusii: Implications for the optimization of algal culture media. J. Phycol. 2016, 52, 75–88. [Google Scholar] [CrossRef] [PubMed]
- Markou, G.; Muylaert, K. Effect of light intensity on the degree of ammonia toxicity on PSII activity of Arthrospira platensis and Chlorella vulgaris. Bioresour. Technol. 2016, 216, 453–461. [Google Scholar] [CrossRef]
- Chen, W.; Zhang, C.; Song, L.; Sommerfeld, M.; Hua, Q. A high throughput Nile red method for quantitative measurement of neutral lipids in microalgae. J. Microbiol. Methods 2015, 77, 41–47. [Google Scholar] [CrossRef]
- Gardner, R.D.; Lohman, E.J.; Cooksey, K.E.; Gerlach, R.; Peyton, B.M. Cellular cycling, carbon utilization, and photosynthetic oxygen production during bicarbonate-induced triacylglycerol accumulation in a Scenedesmus sp. Energies 2013, 6, 6060–6076. [Google Scholar] [CrossRef]
- Lv, J.P.; Guo, J.; Feng, J.; Liu, Q.; Xie, S.L. A comparative study on flocculating ability and growth potential of two microalgae in simulated secondary effluent. Bioresour. Technol. 2016, 205, 111–117. [Google Scholar] [CrossRef]
- Elsayed, K.N.M.; Kolesnikova, T.A.; Noke, A.; Klock, G. Imaging the accumulated intracellular microalgal lipids as a response to temperature stress. 3 Biotech 2017, 7, 41–48. [Google Scholar] [CrossRef]
- Bohnenberger, J.E.; Crossetti, L.O. Influence of temperature and nutrient content on lipid production in freshwater microalgae cultures. Ann. Acad. Bras. CIienc. 2014, 86, 1239–1248. [Google Scholar] [CrossRef] [Green Version]
- Liu, J.; Huang, J.; Sun, Z.; Zhong, Y.; Jiang, Y.; Chen, F. Differential lipid and fatty acid profiles of photoautotrophic and heterotrophic Chlorella zofingiensis: Assessment of algal oils for biodiesel production. Bioresour. Technol. 2011, 102, 106–110. [Google Scholar] [CrossRef]
- Qiaoning, H.; Haijian, Y.; Chunxiang, H. Effects of temperature and its combination with high light intensity on lipid production of Monoraphidium dybowskii Y2 from semi-arid desert areas. Bioresour. Technol. 2018, 265, 407–414. [Google Scholar] [CrossRef]
- Prajapati, S.K.; Kaushik, P.; Malik, A.; Vijay, V.K. Phycoremediation and biogas potential of native algal isolates from soil and wastewater. Bioresour. Technol. 2013, 135, 232–238. [Google Scholar] [CrossRef]
- Dean, A.P.; Sigee, D.C.; Estrada, B.; Pittman, J.K. Using FTIR spectroscopy for rapid determination of lipid accumulation in response to nitrogen limitation in freshwater microalgae. Bioresour. Technol. 2010, 101, 4499–4507. [Google Scholar] [CrossRef]
- Chen, W.; Sommerfeld, M.; Hu, Q. Microwave-assisted Nile Red method for in vivo quantification of neutral lipids in microalgae. Bioresour. Technol. 2011, 102, 135–141. [Google Scholar] [CrossRef]
- Vello, V.; Phang, S.M.; Chu, W.L.; Majid, N.A.; Lim, P.E.; Loh, S.K. Lipid productivity and fatty acid composition-guided selection of Chlorella strains isolated from Malaysia for biodiesel production. J. Appl. Phycol. 2014, 26, 1399–1413. [Google Scholar] [CrossRef]
- Fuentes-Grconewald, C.; Garccbs, E.; Rossi, S.; Camp, J. Use of the dinoflagellate Karlodinium veneficum as a sustainable source of biodiesel production. J. Ind. Microbiol. Biotechnol. 2009, 36, 1215–1224. [Google Scholar] [CrossRef]
- Lei, A.; Chen, H.; Shen, G.; Hu, Z.; Chen, L.; Wang, J. Expression of fatty acid synthesis genes and fatty acid accumulation in Haematococcus pluvialis under different stressors. Biotechnol. Biofuels 2012, 5, 18–28. [Google Scholar] [CrossRef]
- Huerlimann, R.; Steinig, E.J.; Loxton, H.; Zenger, K.R.; Jerry, D.R.; Heimann, K. Effects of growth phase and nitrogen starvation on expression of fatty acid desaturases and fatty acid composition of Isochrysis aff. galbana (TISO). Gene 2014, 545, 36–44. [Google Scholar] [CrossRef]
- Song, P.P.; Jia, Y.; Li, Q. The impact of the lack of nitrogen to the Isochrysis galbanas on the growth, oil and protein. Technol. Mark. 2015, 22, 113–116. [Google Scholar] [CrossRef]
- Rios, L.F.; Klein, B.C.; Luz, L.F.J.; Filho, R.M.; Maciel, M.R.F. Nitrogen starvation for lipid accumulation in the microalga species Desmodesmus sp. Appl. Biochem. Biotechnol. 2015, 175, 469–476. [Google Scholar] [CrossRef]
- Pancha, I.; Chokshi, K.; George, B.; Ghosh, T.; Paliwal, C.; Maurya, R.; Mishra, S. Nitrogen stress triggered biochemical and morphological changes in the microalgae Scenedesmus sp. CCNM 1077. Bioresour.Technol. 2014, 156, 146–154. [Google Scholar] [CrossRef]
- Siaut, M.; Cuine, S.; Cagnon, C.; Fessler, B.; Nguyen, M.; Carrier, P.; Beyly, A.; Beisson, F.; Triantaphylides, C.; Li-Beisson, Y.H.; et al. Oil accumulation in the model green alga Chlamydomonas reinhardtii: Characterization, variability between common laboratory strains and relationship with starch reserves. BMC Biotechnol. 2011, 11, 7. [Google Scholar] [CrossRef]
- Zhu, S.N.; Huang, W.; Xu, J.; Wang, Z.M.; Xu, J.L.; Yuan, Z.H. Metabolic changes of starch and lipid triggered by nitrogen starvation in the microalga Chlorella zofingiensis. Bioresour. Technol. 2014, 152, 292–298. [Google Scholar] [CrossRef]
- Msanne, J.; Xu, D.; Konda, A.R.; Casas-Mollano, J.A.; Awada, T.; Cahoon, E.B.; Cerutti, H. Metabolic and gene expression changes triggered by nitrogen deprivation in the photoautotrophically grown microalgae Chlamydomonas reinhardtii and Coccomyxa sp. C-169. Phytochemistry 2012, 75, 50–59. [Google Scholar] [CrossRef] [PubMed]
- Zhang, T.Y.; Wu, Y.H.; Zhu, S.F.; Li, F.M.; Hu, H.Y. Isolation and heterotrophic cultivation of mixotrophic microalgae strains for domestic wastewater treatment and lipid production under dark condition. Bioresour. Technol. 2013, 149, 586–589. [Google Scholar] [CrossRef] [PubMed]


| Fatty Acids | Nitrogen-Rich (N+) | Nitrogen-Deficient (N−) |
|---|---|---|
| C16: 0 | 22.32 ± 0.38 | 26.81 ± 0.31 |
| C16: 1 | 2.35 ± 0.1 | 4.15 ± 0.12 |
| C16: 2 | 5.27 ± 0.08 | 2.1 ± 0.11 |
| C16: 3 | 8.81 ± 0.21 | 3.7 ± 0.13 |
| C18: 0 | 5.75 ± 0.12 | 6.32 ± 0.1 |
| C18: 1 | — | 4.05 ± 0.02 |
| C18: 2 | 13.9 ± 0.23 | 14.8 ± 0.41 |
| C18: 3 | 29.75 ± 0.29 | 30.2 ± 0.48 |
| C16 and C18 | 88.15 | 92.43 |
| Others | 11.85 | 7.57 |
| SFA (Saturated Fatty Acids) | 28.07 | 33.13 |
| MUFA (Monounsaturated Fatty Acids) | 2.35 | 8.2 |
| PUFA (Polyunsaturated Fatty Acids) | 57.73 | 50.8 |
© 2019 by the authors. Licensee MDPI, Basel, Switzerland. This article is an open access article distributed under the terms and conditions of the Creative Commons Attribution (CC BY) license (http://creativecommons.org/licenses/by/4.0/).
Share and Cite
Gao, Y.; Feng, J.; Lv, J.; Liu, Q.; Nan, F.; Liu, X.; Xie, S. Physiological Changes of Parachlorella Kessleri TY02 in Lipid Accumulation under Nitrogen Stress. Int. J. Environ. Res. Public Health 2019, 16, 1188. https://doi.org/10.3390/ijerph16071188
Gao Y, Feng J, Lv J, Liu Q, Nan F, Liu X, Xie S. Physiological Changes of Parachlorella Kessleri TY02 in Lipid Accumulation under Nitrogen Stress. International Journal of Environmental Research and Public Health. 2019; 16(7):1188. https://doi.org/10.3390/ijerph16071188
Chicago/Turabian StyleGao, Yifan, Jia Feng, Junping Lv, Qi Liu, Fangru Nan, Xudong Liu, and Shulian Xie. 2019. "Physiological Changes of Parachlorella Kessleri TY02 in Lipid Accumulation under Nitrogen Stress" International Journal of Environmental Research and Public Health 16, no. 7: 1188. https://doi.org/10.3390/ijerph16071188