
Fatigue and Recovery of Muscles for Pulling Tasks
by
 ,
,
Cannan Yi
1,
Huali Zuo
1,*,
Caijun Zhao
1,
Kai-Way Li
1,2,*,
Hong Hu
1,
Fan Tang
1 and
Tong Long
1 1
School of Safety and Management Engineering, Hunan Institute of Technology, Hengyang 421102, China
2
Department of Industrial Management, Chung Hua University, Hsinchu 30012, Taiwan
*
Authors to whom correspondence should be addressed.
Int. J. Environ. Res. Public Health 2022, 19(22), 15159; https://doi.org/10.3390/ijerph192215159
Submission received: 13 October 2022
/
Revised: 11 November 2022
/
Accepted: 14 November 2022
/
Published: 17 November 2022
(This article belongs to the Special Issue Human Factors and Ergonomics: Bridging the Gap between Research and Practice in Occupational Safety and Health)
Abstract
:Manual materials handling (MMH) contributes to musculoskeletal disorders (MSDs) in the workplace. The development and recovery of muscle fatigue are essential in work/rest arrangements for MMH tasks. A pulling experiment, including a muscle fatigue test and a muscle fatigue recovery test, was conducted. In the muscle fatigue test, the participant performed a pulling task on a treadmill with a walking velocity of 1 km/h until they could no longer do so. The load was either 30 or 45 kg. The maximum endurance time (MET) was recorded. The pull strength (PS) of the participant both before and after the pulling task was measured. The subjective ratings of muscle fatigue after the pulling task were recorded. In the muscle fatigue recovery test, the participant took a rest after performing the pulling task. The participants reported their subjective ratings of muscle fatigue on the CR-10 scale after taking a rest for a time period t, where t = 1, 2,…, 6 min. The PS of the participant was then measured again. It was found that the load significantly affected the MET for pulling tasks. The load was insignificant to the decrease of the PS, but was significant to the decrease rate (PS decrease per min) of the PS. The PS decrease rate for the 45 kg condition (30.8 ± 16.5 N/min) was significantly higher (p < 0.05) than that of the 30 kg condition (15.4 ± 5.5 N/min). The recovery time significantly affected the PS and CR-10. Two MET models were established to explore the development of muscle fatigue in pulling tasks. A PS model was constructed to describe the recovery of muscle force. A CR-10 model was proposed to show the subjective ratings of recovery. These models are beneficial for determining the work/rest allowance for pulling tasks.
1. Introduction
Manual materials handling (MMH) is common in the workplace and in daily life [1]. Nowadays, although mechanical equipment can substitute manual operations, many MMH activities, such as lifting, pushing, pulling, carrying, and holding, are still required in many industry sectors. MMH is generally physically demanding. Prolonged working time, overexertion, awkward posture, and excessive load cause muscle fatigue and could lead to musculoskeletal disorders (MSDs). MMH is the most common cause of occupational fatigue and low back injury [2]. In the USA, MMH contributes to over half a million cases of MSDs [3]. According to the Health and Safety Executive (HSE) statistics [4], there were approximately 470,000 workers who suffered MSDs in 2020 and 2021 in the UK. This accounts for 28% of all work-related illnesses.
Many lifting/lowering and carrying tasks have been replaced by pushing and pulling to reduce the physical requirements of workers [5,6,7,8]. The literature indicates that one-third or more of the employees in the United States need to push and pull at work [9,10,11]. Most material handling aids, such as carts and trolleys, may be pushed or pulled. However, some of the material handling aids can only be pulled. A pallet jack is one the example. Pulling involves efforts from body parts, including the upper limbs, trunk, and lower limbs. When pulling, the waist, back, and arms are the most fatigued body segments [8,10,12]. Frequent fatigue of these body parts could lead to MSDs [13,14]. The literature has shown that workers performing pulling tasks suffered a higher prevalence of shoulder and lower back pain [14,15].
Pulling tasks involving both static [16,17,18,19,20,21,22] and dynamic [13,23,24,25,26,27] postures have been reported. The difference between those two approaches was whether the participants needed to walk when they were pulling. Muscle fatigue may be defined as the reduction in the maximal capacity to generate force or power output [28]. The development of muscle fatigue for pulling tasks was generally assessed by measuring the pull force, electromyography (EMG) signal of muscle groups, joint stress, or maximum endurance time (MET). The MET models are often constructed to predict the maximum time an operator can persist at a worksite [19,20,21,27]. They provide a way to determine the work allowance for workers.
Breaks are required to allow recovery for MMH tasks. Recovery of muscle fatigue is the regain of muscle strength [29]. Exploring the relationship between the recovery level of muscle strength and the recovery time periods is essential for job designers. Muscle fatigue recovery is often assessed by measuring muscle strength over a recovery time period [30,31,32,33]. Muscle strength models have been reported established [30,31,32,33]. Those models are also helpful in determining rest allowance for workers.
Subjective ratings provide an easy assessment tool for muscle fatigue. The relationship between these ratings and objective muscle strength data has been reported [33,34,35,36]. Models based on subjective data were adopted to assess muscle fatigue [35,36,37] and muscle fatigue recovery [33]. These models provided estimations of muscle fatigue levels over a certain period.
In our previous study [27], a pulling task with a walking velocity of 1 and 2 km/h was conducted. We obtained the MET model to describe the maximum time a puller can persist. The levels of muscle fatigue recovery for pulling tasks under walking conditions, however, have not been explored. When conducting the muscle fatigue recovery test, an endurance experiment was usually adopted to induce muscle fatigue [30,31,33]. Therefore, we designed a muscle fatigue and a muscle fatigue recovery test for pulling tasks in this study. The aim of the current study was to explore the development of muscle fatigue and muscle fatigue recovery for pulling tasks. The development and recovery of muscle fatigue were quantified by measuring the pull strength (PS), MET, and CR-10 scores. MET predictive models were constructed to describe the development of muscle fatigue. Both a PS model and a CR-10 model were obtained to predict the recovery level of muscle fatigue.
2. Materials and Methods
2.1. Experiment
A pulling task was performed in the laboratory. The temperature was 20.0 (±1.4) °C, and the relative humidity was 64.5 (±15.7)%.
2.2. Participants
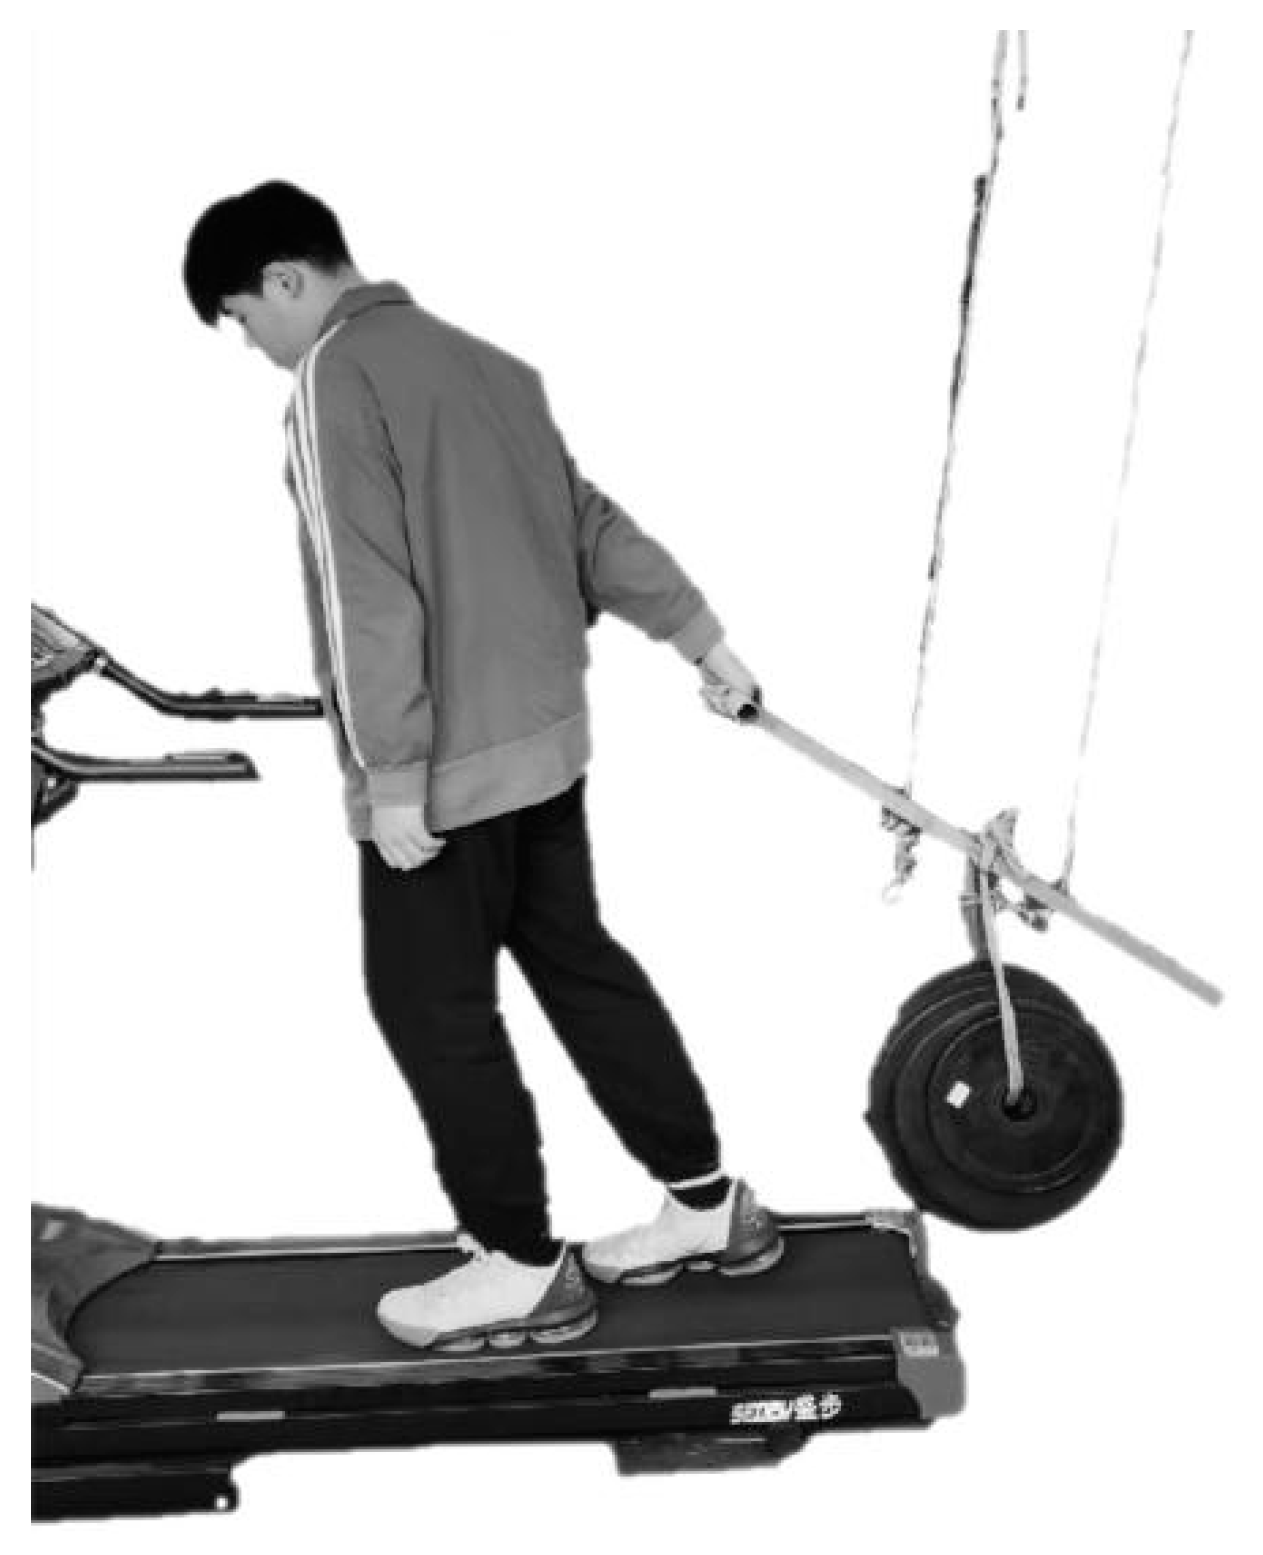
Forty male adults participated in the study. Their age, body mass, stature, and body mass index (BMI) were 19.1 (±1.1) years, 65.9 (±10.4) kg, 168.8 (±3.1) cm, and 23.1 (±3.4) kg/m2, respectively. They were right-handed and healthy without a history of MSDs within a year of the study. All of them had no experience using a real pallet truck. Upon arriving in the laboratory, the participants were informed about the purpose and procedure of the experiment. They read and signed informed consent. Then, they were asked to pull and walk on a treadmill (see Figure 1) until they were familiar with pulling and walking. When measuring their PS (see Figure 2), they were instructed to pull in the same way as was performed on the treadmill, except they were not walking.
2.3. Apparatus and Tools
A stick-handle unit was fabricated to mimic the stick and handle of a real pallet truck. This unit contains a T bar (1.5 kg) that is 81.5 cm in length and has a handle with a diameter of 3 cm. It was hung to the ceiling using two steel wires. The lower end of the stick was approximately 37 cm over a treadmill platform. A weight (cast iron), of 30 or 45 kg, was hung at the middle of the stick to generate a backswing force when the handle was being pulled (see Figure 1). The forces required to pull these loads and maintain the posture in Figure 1 were approximately 77.2 N and 106.6 N, respectively. The trials of the two weights were performed in two different sessions and these sessions were at least 24 h apart.
A force sensor (Lutron@ Inc., FG-5100, Taipei, Taiwan) was installed to measure the PS (see Figure 2). It was connected to a chain. The lower end of the chain was linked with a hook 37 cm above the ground on the wall. There was a handle (ø3 cm) on the other side of the chain. When the participant pulled the handle (see Figure 2), a digital display showed the peak force of the pulling. The reading was the PS. Participants reported their subjective ratings of muscle fatigue on the CR-10 scale [38] after the pull.
2.4. Experimental Design
Muscle fatigue was defined as a reduction in the ability to exert force in response to voluntary effort [39]. Reduction of muscle force [34,40], change of subjective ratings of muscle fatigue [41] before and after forceful exertion, and MET [20,42] for continuous forceful exertion have been used to assess muscle fatigue in the literature. This experiment included tests of muscle fatigue and muscle fatigue recovery by measuring the MET, PS, and CR-10 scores.
In the muscle fatigue test, the participant pulled and walked on a treadmill at a velocity of 1 km/h (see Figure 1) until he could not continue any longer. The walking speed was determined following the recommendations in the literature [6,43,44,45,46] and the results of our pilot trials. Both the MET and PS before and after the test were recorded. The PS before the test was the maximum voluntary contraction (MVC) and the PS after the pull was recorded as PS0. After the trial, a CR-10 rating [38] was recorded and was denoted as CR-100.
In the muscle fatigue recovery test, participants took a rest for 6 min, and their PS and CR-10 at the end of 1, 2, 3, 4, 5, and 6 min were measured. These PS and CR-10 measures were termed PSi and CR-10i, respectively, for i = 1, 2, …, and 6 min.
2.5. Procedures
Figure 3 shows the procedure of the experiment. In the preparatory phase, the participant performed a warmed-up exercise for 5 min to activate the muscles [47]. After a rest of 10 min, he performed the muscle fatigue test. In the muscle fatigue test, the participant completed the MVC measurement and then performed the pulling tasks. He pulled the handle with maximum effort for 4–6 s and the peak value of the pulling strength was denoted as PS. The PS was measured three times with an interval of 2 min between each measurement [48]. The maximum PS of these three was recorded as the MVC. After a rest of 2 min, the participant pulled and walked on a treadmill until he could not continue any longer. The time of his walking was his MET. The beginning of the muscle fatigue recovery test started at the end of the treadmill walking. This time was denoted as t0. The total recovery time was 6 min. At time ti (i = 0, 1, …, 6), the participant reported his CR-10i and his PSi was measured.
2.6. Data Processing
Descriptive statistics were conducted to show the MET, PS, and CR-10 under experiment conditions. Analyses of variance (ANOVA) were performed to determine the effects of load on the dependent variables. The Duncan post hoc tests were conducted for posterior comparisons. Correlation analysis was performed to show the relationship among measured parameters. Regression analyses were carried out to establish the MET, PS, and CR-10 prediction models. Microsoft® Excel (Microsoft, Redmond, Washington, DC, USA) was used for preliminary data processing. The SAS® 9.0 (SAS Institute Inc., Cary, NC, USA) was used for statistical analysis. A significance level of α = 0.05 was used.
3. Results
The ANOVA results showed that load significantly affected MET (F = 54.7, p < 0.0001), but was insignificant to PSi (i = 0, 1, …, 6) or CR-10i (i = 0, 1, …, 6) (p > 0.05). The mean MET of the 30 kg condition (14.0 ± 4.9 min) was significantly higher than that of the 45 kg condition (7.0 ± 3.5 min). The PS and CR-10 were shown in Table 1. Both the PS and CR-10 varied with recovery time (p < 0.0001). The Duncan results showed that PS0 was significantly smaller than others. PS1 was significant smaller than PS3, PS4, PS5, and PS6. PS2 was significantly smaller than PS4, PS5, and PS6. PS3 was significantly smaller than PS5 and PS6. PS4 was significantly smaller than PS6. The CR-10, on the other hand, became smaller as the recovery time increased. The PS and CR-10 were significantly correlated (r = −0.45, p < 0.0001).
3.1. Muscle Fatigue for Pulling Tasks
In the literature, the MET models were often established using the relative load fMVC (fMVC = forceful exertion/MVC) or %MVC (%MVC = fMVC × 100) as the independent variable [21,39,49,50]. In dynamic force exertion tasks, such as carrying and pulling tasks, the development of muscle fatigue was usually evaluated by walking velocity, fMVC, and BMI [27,45,50,51]. By summarizing the MET models for static and dynamic force exertion, it was found that the MET is inversely proportionate with the fMVC in a curvilinear pattern. A nonlinear curve can be found when plotting the MET–fMVC relation. Observing the relationship between the MET and fMVC in this experiment (see Figure 4), it was found that the MET was significantly negatively correlated with fMVC (r = −0.62, p < 0.0001). Hagberg [50] found that there was no significant difference in the endurance time in static and slow dynamic elbow flexion. We hypothesized that the MET models based on static force exertion were suitable for slow walking tasks. In the current study, the participants pulled and walked with a velocity of 1 km/h. This walking velocity was slower than those in the literature [43,44]. We assumed that walking at a low velocity and pulling was a slow dynamic task and attempted to construct the MET muscle fatigue model for pulling tasks. The participants were split into two groups: participants No. 1–20 were in group A and participants No. 21–40 in were group B. Data in group A were used to construct models, while data in group B were used for model validation.
3.1.1. Models According to Static Force Exertion
A summary of existing static MET models revealed [21,39,49,50] that exponential and power functions have been adopted to fit the MET–fMVC relation. Similar to those MET models in the literature [21,39,49,50], the MET for pulling tasks may be fitted using these two mathematic functions:
In Equations (1) and (2), both k and c are constant values. By logarithmic transformation of Equations (1) and (2), Equations (3) and (4) were obtained, respectively.
LN(MET) = LN(k) + c × fMVC
LN(MET) = LN(k) + c × LN(fMVC)
By simple intercept-free linear regression, we obtained:
The model with the highest R2 (0.97) was selected. This model was rewritten as Equation (7).
To determine the prediction error of the prediction models, the mean absolute deviation (MAD) was usually used in the literature [20,33,34,52]. The MAD was calculated using Equation (8):
By substituting data groups A and B into the MET Equation (7), the MADs were 3.28 (±2.99) min and 3.22 (±2.88) min, respectively, for these groups (see Table 2).
3.1.2. Models of Dynamic Force Exertion
BMI is in kg/m2. By substituting data groups A and B into Equation (9), the MADs were 3.57 (±3.08) min and 3.70 (±3.74) min, respectively, for these groups (see Table 2).
3.1.3. Model Comparison
Yi et al. [19] proposed MET models of exponential function and power function for static pulling tasks. They found that Manenica’s body pull model [53] could better fit the MET–fMVC relation for static pulling tasks. We substituted our group B data into those three models. The MADs were much larger than those in the current study (see Table 2). We plotted those five models, including two models constructed by Yi et al. [19], a body pull model by Manenica [53], and the MET Equations (7) and (9) in the current study, and measured the MET in Figure 4. When plotting the MET Equation (9), the BMI was the mean of the 40 participants (23.1 kg/m2). We found that the MET in the current study was smaller than that of static pulling tasks. This was in contrast to that in the literature [54]. In a static working posture, fast-twitch fibers are mostly used and this type of muscle fiber has a low resistance to fatigue [54]. Static force exertion tasks may result in much faster muscle fatigue accumulation. In dynamic working, slow-twitch fibers are mainly used and these types of muscle fibers have a high resistance to fatigue [54]. Meanwhile, blood circulation during dynamic motions is better than in a static working posture [54]. Therefore, dynamic force exertion tasks may result in much slower muscle fatigue accumulation. However, the MET in the current study was smaller than that of the static pulling tasks. This may be attributed to the following reasons. In the current study, the participants grabbed the handle and pulled and walked on a treadmill. The only difference between the static pulling task in the literature [16,17,18,19,20,21,22] and our study was that the participants in our study needed to walk. The participants might need more effort to pull and walk than those in the static pulling tasks.
As shown in Table 2, the MET Equation (7) has lower MADs than Equation (9). When the fMVC is between 0.1 and 0.3, the curves of these two equations largely overlap (see Figure 4). When the fMVC is larger than 0.3, Equation (9) has a lower MET. The fMVC in the current study was between 0.09–0.27, which is less than 0.3. Therefore, further discussion is needed to select the best equation.
In the literature [33,39,55], intraclass correlation efficients (ICC) and Pearson correlation coefficients (r) were usually calculated to describe the similarity and the relationship between the two data sets, respectively. We compared the measured and predicted MET for Equations (7) and (9) (see Figure 5) by calculating the ICC and r. These two statistics for Equation (7) were 0.50 (p < 0.0001) and 0.62 (p < 0.0001), respectively. The ICC and r for Equation (9) were 0.42 (p < 0.0001) and 0.47 (p < 0.0001), respectively. The MET Equation (7) has higher similarity and correlation. Therefore, the MET Equation (7) was more appropriate than Equation (9) in our pulling tasks.
3.2. Muscle Fatigue Recovery for Pulling Tasks
In Table 2, we found that PSi (i = 0, 1, …, and 6) increased with the time period. We constructed a muscle fatigue recovery model for pulling tasks based on the model proposed by Ma [30]:
PS (N) is a pull force at time t. PS0 (N) is the pull force at time 0 min. RR is the muscle fatigue recovery rate and min−1. t is time in min.
By logarithmic transformation of Equation (10), we have:
If, , then, Equation (11) can be written as: y = RR × t.
By substituting data group A into y = RR × t and performing the simple intercept-free linear regression, we have:
y = 0.17t (R2 = 0.80, p < 0.0001, F = 1134.67)
That is, RR = 0.17. Therefore, the muscle fatigue recovery model for pulling tasks was:
By substituting data groups A and B into Equation (13), we calculated the MADs. The MADs were 19.61 (±19.62) N and 20.23 (±17.71) N, respectively, for these groups. Both the ICC and r for the measured and predicted PS were 0.94 (p < 0.0001) (see Figure 6).
4. Discussion
The development and recovery of muscle fatigue for pulling tasks were studied in this paper. In the muscle fatigue test, an endurance experiment was conducted according to those experiments in the literature [30,31,33]. The muscle fatigue induction, that is, the decline of MVC, was 33.77 (±8.73)% MVC, which was between the 30 to 50% range reported in the literature [30,32,33,56].
4.1. Muscle Fatigue
In the muscle fatigue test, the PS decreases were (200.42 ± 64.59) N and (182.19 ± 62.70) N for 30 kg and 45 kg conditions, respectively. The PS decrease rate (PS decrease/MET) for the two load conditions was significantly different (p < 0.0001). The PS decrease rate for the 45 kg condition (30.83 ± 16.49) N/min was significantly higher (p < 0.05) than that of the 30 kg condition (15.35 ± 5.45) N/min. The load of the 45 kg condition was 1.38 times (106.6 N/77.2 N) greater than that of the 30 kg condition, while the PS decrease rate of the former was 2.01 times (30.83 N/min/15.35 N/min) greater than that of the latter. In Tang’s research [27], the load of the 40 kg condition was 1.2 times (122.99/102.9) greater than that of the 30 kg condition, while the PS decrease rate of the former was 1.53 times (27.44/17.93) greater than that of the latter. In these two experiments, both the PS decrease rates were faster than the load increase rates. Therefore, when the load increase is large, a longer rest time needs to be arranged.
As shown in Figure 4, the MET had a rapid decrease in the fMVC range of 0.1–0.2. This was consistent with these MET models in the static force exertion tasks [21,39,49,50] and those MET models in the dynamic forceful tasks [27,45,50,51]. When fitting the data in the current study, Equation (7) has a lower MAD and better similarity and correlation (see Figure 5 and Table 2). The MADs of Equation (7), 3.28 (±2.99) min for data group A and 3.22 (±2.88) min for data group B, were larger than those in the literature [27,33]. Those MADs, however, were lower than that in the backpacking tasks [45]. By comparing the MADs in the literature (see Table 3), we found that low METs has lower MADs [27,33], and a higher MET has a larger MAD [45]. The higher the MET, the higher the MAD is. When the participants performed the pulling tasks in the current study, they were required to keep their eyes forward and not allowed to chat or listen to music. Instead of being physically exhausted, the participants might have given up pulling because of boredom [45] when they walked with a load on the treadmill at a certain speed for a long time. This may be the reason for the MADs larger than 3 min in the current study.
The fMVC in the current study was between 0.09 and 0.27, while the fMVC in Tang et al. [27] was between 0.31 and 0.51. The fMVC values are outside each other’s range. We tried to reconstruct the MET model using the data from the current study and that of Tang et al. [27]. For this new data set, the fMVC was between 0.07 and 0.51. Two new MET equations can be obtained:
The MADs for Equations (14) and (15) were (3.05 ± 2.76) min and (3.38 ± 3.26) min. The ICC and r values of Equations (14) and (15) were 0.62 (p < 0.0001) and 0.67 (p < 0.0001) and 0.43 (p < 0.0001) and 0.54 (p < 0.0001), respectively. As shown in Figure 7, Equation (14) fitted the new data better. By comparing Equations (7) and (14), we found the difference in the parameter was 0.008. Both equations were acceptable. In our pulling tasks, the MET models, according to static force exertion, better fit the data. Thus, the MET models in static pulling tasks [33] and dynamic pulling tasks in the current study have the same function. This verified our hypothesis that pulling tasks with a low walking velocity were a slow dynamic task. These results were similar to that of Hagberg [50]. This may be attributed to the static contractions of the upper body in static and dynamic pulling tasks. It has been reported that the predominance of sustained static muscular contractions in the muscles of the upper body is likely to be a source of fatigue and injury [57]. Bennett et al. [6] found that only the upper body muscles were considered for possible fatigue as they were involved in static contraction when they conducted forward pushing, forward unilateral pulling, and backward bilateral pulling tasks. Their forward unilateral pulling was similar to our pulling task in the current study.
4.2. Muscle Fatigue Recovery
The PS at times 0, 1, …, and 6 min were 72.7%, 75.9%, 78.7%, 81.6%, 84.16%, and 87.5% of the MVC. The increase in PS showed the recovery of muscle fatigue. After a rest time of 6 min, the PS recovered to 87.5% MVC. According to the 95% MVC recovery line recommended in the literature [48,58], the participants fully recovered after a rest time of 11.3 min. A rest time of about 12 min can be adopted to assign pulling tasks in the workplace to avoid muscle fatigue and reduce the risk of MSDs.
Based on Equation (13), we obtained the recovery of muscle force. Muscle force decrease (MVC-muscle force) has been used to quantify the progress of muscle fatigue in the literature [42,48,58]. Perceived force exertion and subjective assessment models have also been adopted to evaluate the forceful exertion level [59,60,61] or muscle fatigue level [35,36,37]. Following the literature [35,36,42,48,58], we defined the normalization of pull strength decrease (NPSD) using the following equation:
NPSD was significantly positively correlated with CR-10 (r = 0.63, p < 0.0001). The following equation was established to show the relationship between CR-10 and NPSD:
Substituting Equations (13) and (16) into Equation (17), we obtained the following equation:
The MAD of the predicted and measured CR-10 was (1.27 ± 0.92). As shown in Figure 8, the ICC and r were 0.71 (p < 0.0001) and 0.72 (p < 0.0001), respectively. This CR-10 assessment model was acceptable. It allows predictions of CR-10 using t, PS0, and MVC.
4.3. Limitations
There are limitations to this study. Firstly, the pulling tasks were conducted on a treadmill and our participants walked at 1 km/h under our loading conditions, not any faster. In real pulling tasks, the operator may walk slower or faster depending on the load. The muscle fatigue and recovery models of the pulling and walking tests under different walking speeds will be interesting topics in the future. Secondly, all participants were young male adults. Older workers may have larger endurance time and female workers may have lower pull force. Our results, therefore, could be applied only to young male workers. Finally, only the MET, PS, and CR-10 were analyzed in this study. Heart rate and EMG are also the appropriate physiological parameters for indicating physiological strain for pulling and walking tasks. Incorporating these physiological parameters into the MET and CR-10 models will also be interesting topics in the future.
5. Conclusions
A muscle fatigue test and a muscle fatigue recovery test were conducted to explore the development and recovery of muscle fatigue for pulling tasks. In the muscle fatigue test, the operator pulled and walked on a treadmill with a velocity of 1 km/h and with loads of 30 or 45 kg. In the muscle fatigue recovery test, the operator had a rest and then measured their PS at the recovery time of 0, 1, 2, …, and 6 min. Load significantly affected the development of muscle fatigue for pulling tasks. The recovery time significantly affected the recovery of muscle fatigue for pulling tasks. Power function MET models were established to describe the development of muscle fatigue. A PS model and a CR-10 model were both constructed to assess the recovery of muscle fatigue. Those models may be used to determine the work/rest allowance for pulling tasks under conditions similar to this study.
Author Contributions
Conceptualization, C.Y., H.Z. and K.-W.L.; methodology, C.Y., F.T., H.Z. and K.-W.L.; data curation, C.Y., H.Z. and T.L.; writing—original draft preparation, C.Y. and H.H.; writing—review and editing, C.Y., K.-W.L., H.H. and C.Z.; project administration, C.Y. and H.Z.; funding acquisition, C.Y., H.Z. and F.T. All authors have read and agreed to the published version of the manuscript.
Funding
This research was funded by the Natural Science Foundation of Hunan Province, grant number 2020JJ4263; the National Natural Science Foundation of China, grant number 71801089; the Educational Department of Hunan Province, China, grant Number 20C0570; the National Innovation and Entrepreneurship Training Program for College Students, grant number 202211528008; and the Provincial Discipline (Platform) Open Project, Hunan Institute of Technology, grant number KFB20016.
Institutional Review Board Statement
This study was conducted according to the guidelines of the Declaration of Helsinki, and approved by a local ethic committee of the Hunan Institute of Technology (protocol code HNIT-SEE-2021-3, 8 June 2021).
Informed Consent Statement
Informed consent was obtained from all subjects involved in the study. Written informed consent has been obtained from the patient(s) to publish this paper.
Data Availability Statement
Data are available upon request.
Conflicts of Interest
The authors declare no conflict of interest.
References
- Marras, W.S. Occupational low back disorder causation and control. Ergonomics 2000, 43, 880–902. [Google Scholar] [CrossRef] [PubMed]
- Government of Canada, Canadian Centre for Occupational Health and Safety. MMH Introduction: OSH Answers. Available online: https://www.ccohs.ca/oshanswers/ergonomics/mmh/mmhintro.html (accessed on 15 September 2022).
- National Institute for Occupational Safety and Health. Ergonomic Guidelines for Manual Material Handling. Available online: https://www.cdc.gov/niosh/docs/2007-131/pdfs/2007-131.pdf (accessed on 12 September 2022).
- HSE Work-Related Musculoskeletal Disorders Statistics in Great Britain. 2021. Available online: https://www.hse.gov.uk/statistics/causdis/msd.pdf (accessed on 11 September 2022).
- Ciriello, V.M.; McGorry, R.W.; Martin, S.E. Maximum acceptable horizontal and vertical forces of dynamic pushing on high and low coefficient of friction floors. Int. J. Ind. Ergon. 2001, 27, 1–8. [Google Scholar] [CrossRef]
- Bennett, A.I.; Todd, A.I.; Desai, S.D. Pushing and pulling, technique and load effects: An electromyographical study. Work-J. Prev. Assess. Rehabil. 2011, 38, 291–299. [Google Scholar] [CrossRef] [PubMed]
- Resnick, M.L.; Chaffin, D.B. An ergonomic evaluation of handle height and load in maximal and submaximal cart pushing. Appl. Ergon. 1995, 26, 173–178. [Google Scholar] [CrossRef]
- Das, B.; Black, N.L. Isometric pull and push strengths of paraplegics in the workspace: 1. Strength measurement profiles. Int. J. Occup. Saf. Ergon. 2000, 6, 47–65. [Google Scholar] [CrossRef]
- Bureau of Labor Statistics Census of Fatal Occupational Injuries. Available online: https://www.bls.gov/opub/hom/cfoi/pdf/cfoi.pdf. (accessed on 29 September 2022).
- Kumar, S. Upper body push-pull strength of normal young adults in sagittal plane at three heights. Int. J. Ind. Ergon. 1995, 15, 427–436. [Google Scholar] [CrossRef]
- Baril-Gingras, G.; Lortie, M. The handling of objects other than boxes: Univariate analysis of handling techniques in a large transport company. Ergonomics 1995, 38, 905–925. [Google Scholar] [CrossRef]
- Hoozemans, M.J.M.; Kuijer, P.P.F.M.; Kingma, I.; van Dieën, J.H.; de Vries, W.H.K.; van der Woude, L.H.V.; Veeger, D.J.H.E.J.; van der Beek, A.J.; Frings-Dresen, M.H.W. Mechanical loading of the low back and shoulders during pushing and pulling activities. Ergonomics 2004, 47, 1–18. [Google Scholar] [CrossRef]
- Harris-Adamson, C.; Lin, J.-H. Effect of handle design on pallet jack operations. Hum. Factors Ergon. Soc. 2013, 21, 15–21. [Google Scholar] [CrossRef]
- Hoozemans, M.J.M.; van der Beek, A.J.; Fringsdresen, M.H.W.; Van Dijk, F.J.H.; Van Der Woude, L.H.V. Pushing and pulling in relation to musculoskeletal disorders: A review of risk factors. Ergonomics 1998, 41, 757–781. [Google Scholar] [CrossRef]
- Hoozemans, M.J.M.; Knelange, E.B.; Frings-Dresen, M.H.W.; Veeger, H.E.J.; Kuijer, P.P.F.M. Are pushing and pulling work-related risk factors for upper extremity symptoms? A systematic review of observational studies. Occup. Environ. Med. 2014, 71, 788–795. [Google Scholar] [CrossRef] [PubMed] [Green Version]
- Rohmert, W.; Wangenheim, M.; Mainzer, J.; Zipp, P.; Lesser, W. A study stressing the need for a static postural force model for work analysis. Ergonomics 1986, 29, 1235–1249. [Google Scholar] [CrossRef] [PubMed]
- Lin, J.-H.; McGorry, R.W.; Maynard, W. One-handed standing pull strength in different postures: Normative data. Appl. Ergon. 2013, 44, 603–608. [Google Scholar] [CrossRef] [PubMed]
- Yi, C.; Tang, F.; Li, K.W. Muscular strength decrease and maximum endurance time assessment for a simulated truck pulling task. J. Ind. Prod. Eng. 2017, 34, 486–493. [Google Scholar] [CrossRef]
- Yi, C.; Tang, F.; Peng, L.; Li, K.W.; Ma, L.; Hu, H. Modeling of maximum endurance time for static pulling tasks. Work- J. Prev. Assess. Rehabil. 2018, 60, 455–463. [Google Scholar] [CrossRef]
- Yi, C.; Li, K.W.; Tang, F.; Zuo, H.; Ma, L.; Hu, H. Pulling strength, muscular fatigue, and prediction of maximum endurance time for simulated pulling tasks. PLoS ONE 2018, 13, e0207283. [Google Scholar] [CrossRef]
- Li, K.W.; Yi, C.; Liu, M. Maximum endurance time modeling for push and pull tasks considering gender and handle height. Hum. Factors Ergon. Manuf. Serv. Ind. 2021, 31, 3–12. [Google Scholar] [CrossRef]
- Yi, C.; Tang, F.; Li, K.; Hu, H.; Zuo, H.; Zhao, C. Effects of pause design on the decline in pulling effort and the evaluation of perceived effort in pulling tasks. Appl. Sci. 2021, 11, 12022. [Google Scholar] [CrossRef]
- Ohnishi, A.; Takanokura, M.; Sugama, A. Evaluation of interhandle distance during pushing and pulling of a four-caster cart for upper limb exertion. Saf. Health Work 2016, 7, 237–243. [Google Scholar] [CrossRef] [Green Version]
- Al-Eisawi, K.W.; Kerk, C.J.; Congleton, J.J.; Amendola, A.A.; Jenkins, O.C.; Gaines, W.G. The effect of handle height and cart load on the initial hand forces in cart pushing and pulling. Ergonomics 1999, 42, 1099–1113. [Google Scholar] [CrossRef]
- Kao, H.C.; Lin, C.J.; Lee, Y.H.; Chen, S.H. The effects of direction of exertion, path, and load placement in nursing cart pushing and pulling tasks: An electromyographical study. PLoS ONE 2015, 10, e0140792. [Google Scholar] [CrossRef] [PubMed]
- Calé-Benzoor, M.; Dickstein, R.; Arnon, M.; Ayalon, M. Dynamic push–pull characteristics at three hand-reach envelopes: Applications for the workplace. Appl. Ergon. 2016, 52, 216–221. [Google Scholar] [CrossRef] [PubMed]
- Tang, F.; Yi, C.; Li, K.W.; Zuo, H.; Yin, L.; Li, W. Modeling effect of walking speed and load on muscular fatigue for dynamic tension work. China Saf. Sci. J. 2021, 31, 191–196. [Google Scholar]
- Vøllestad, N.K. Measurement of human muscle fatigue. J. Neurosci. Methods 1997, 74, 219–227. [Google Scholar] [CrossRef]
- Rohmert, W. Problems in determining rest allowances: Part 1: Use of modern methods to evaluate stress and strain in static muscular work. Appl. Ergon. 1973, 4, 91–95. [Google Scholar] [CrossRef]
- Ma, L.; Zhang, W.; Wu, S.; Zhang, Z. A new simple local muscle recovery model and its theoretical and experimental validation. Int. J. Occup. Saf. Ergon. 2015, 21, 86–93. [Google Scholar] [CrossRef]
- Duong, B.; Low, M.; Moseley, A.M.; Lee, R.Y.W.; Herbert, R.D. Time course of stress relaxation and recovery in human ankles. Clin. Biomech. 2001, 16, 601–607. [Google Scholar] [CrossRef]
- Fulco, C.S.; Rock, P.B.; Muza, S.R.; Lammi, E.; Cymerman, A.; Butterfield, G.; Moore, L.G.; Braun, B.; Lewis, S.F. Slower fatigue and faster recovery of the adductor pollicis muscle in women matched for strength with men. Acta Physiol. Scand. 1999, 167, 233–239. [Google Scholar] [CrossRef]
- Yi, C.; Tang, F.; Li, K.; Hu, H.; Zuo, H.; Zhao, C. Modeling and validation of fatigue and recovery of muscles for manual demolition tasks. Int. J. Environ. Res. Public Health 2022, 19, 930. [Google Scholar] [CrossRef]
- Li, K.W.; Chiu, W. Isometric arm strength and subjective rating of upper limb fatigue in two-handed carrying tasks. PLoS ONE 2015, 10, e0119550. [Google Scholar] [CrossRef]
- Hu, H.; Yi, C.; Li, K.W.; Tang, F.; Zuo, H.; Pi, K. Study on models for evaluating muscular fatigue of upper extremity for pulling task. China Saf. Sci. J. 2018, 28, 61–67. [Google Scholar]
- Hu, H.; Yi, C.; Li, K.W.; Tang, F.; Zuo, H.; Chen, C. Evaluation model of muscular fatigue for force exertion task. China Saf. Sci. J. 2018, 28, 79–85. [Google Scholar]
- Zhou, Q.; Chen, Y.; Ma, C.; Zheng, X. Evaluation model for muscle fatigue of upper limb based on sEMG analysis. Sci. China Life Sci. 2011, 41, 608–614. [Google Scholar]
- Borg, G. Psychophysical scaling with applications in physical work and the perception of exertion. Scand. J. Work. Environ. Health 1990, 16, 55–58. [Google Scholar] [CrossRef]
- Ma, L.; Chablat, D.; Bennis, F.; Zhang, W.; Hu, B.; Guillaume, F. A novel approach for determining fatigue resistances of different muscle groups in static cases. Int. J. Ind. Ergon. 2011, 41, 10–18. [Google Scholar] [CrossRef] [Green Version]
- Li, K.W.; Wang, C.W.; Yu, R. Modeling of predictive muscular strength for sustained one-handed carrying task. Work 2015, 52, 911–919. [Google Scholar] [CrossRef]
- Spielholz, P. Calibrating Borg scale ratings of hand force exertion. Appl. Ergon. 2006, 37, 615–618. [Google Scholar] [CrossRef]
- Erik Mathiassen, S.; Åhsberg, E. Prediction of shoulder flexion endurance from personal factors. Int. J. Ind. Ergon. 1999, 24, 315–329. [Google Scholar] [CrossRef]
- Bao, Z.; Ma, P.; Tong, J.; Wang, C. Research on the velocity characteristics of human walking. Res. Explor. Lab. 2006, 19, 43–46. [Google Scholar]
- Liu, K.; Su, P.; Zhao, W. Stochastic U-line balancing with operators’ walking time considered. Ind. Eng. J. 2012, 15, 124–130. [Google Scholar] [CrossRef]
- Li, K.W.; Chu, J.C.; Chen, C.C. Strength decrease, perceived physical exertion and endurance time for backpacking tasks. Int. J. Environ. Res. Public Health 2019, 16, 1296. [Google Scholar] [CrossRef] [PubMed] [Green Version]
- Tang, Z. Video Measurement Technology of Human Walking Parameters. Master’s Thesis, Southeast University, Nanjing, China, 2021. [Google Scholar]
- POPSUGAR Fitness 40 Minute Full Body Workout|Beginner Strength Training|Class FitSugar. Available online: https://www.youtube.com/watch?v=istOU9nxhm8 (accessed on 17 December 2021).
- Liu, B.; Ma, L.; Chen, C.; Zhang, Z. Experimental validation of a subject-specific maximum endurance time model. Ergonomics 2018, 61, 806–817. [Google Scholar] [CrossRef] [PubMed]
- El Ahrache, K.; Imbeau, D.; Farbos, B. Percentile values for determining maximum endurance times for static muscular work. Int. J. Ind. Ergon. 2006, 36, 99–108. [Google Scholar] [CrossRef]
- Hagberg, M. Muscular endurance and surface electromyogram in isometric and dynamic exercise. J. Appl. Physiol. 1981, 51, 1–7. [Google Scholar] [CrossRef]
- Li, K.W.; Peng, L.; Yi, C. Modeling of maximum endurance time for one-handed carrying tasks. Hum. Factors Ergon. Manuf. Serv. Ind. 2019, 29, 319–326. [Google Scholar] [CrossRef]
- Sato, H.; Ohashi, J.; Iwanaga, K.; Yoshitake, R.; Shimada, K. Endurance time and fatigue in static contractions. J. Hum. Ergol. 1984, 13, 147–154. [Google Scholar]
- Manenica, I. A technique for postural load assessment. In The Ergonomics of Working Postures; Taylor & Francis: London, UK, 1986; pp. 270–277. [Google Scholar]
- Ma, R.; Chablat, D.; Bennis, F.; Ma, L. Human muscle fatigue model in dynamic motions. In Proceedings of the Latest Advances in Robot Kinematics; Springer: Innsbruck, Austria, 2012; pp. 349–356. [Google Scholar]
- Ma, L.; Chablat, D.; Bennis, F.; Zhang, W. A new simple dynamic muscle fatigue model and its validation. Int. J. Ind. Ergon. 2009, 39, 211–220. [Google Scholar] [CrossRef] [Green Version]
- Zhang, F.; Zhou, A. Study on the Effect of Different Muscle Fatigue Recovery Methods on Muscle Stiffness Recovery; Atlantic Press: Paris, France, 2017; pp. 497–500. [Google Scholar]
- Jonsson, B. The static load component in muscle work. Eur. J. Appl. Physiol. 1988, 57, 305–310. [Google Scholar] [CrossRef]
- Liu, B.; Ma, L.; Zhang, W.; Zhang, Z. Subject-specific hand grip fatigability indicator determined using parameter identification technique. Hum. Factors Ergon. Manuf. Serv. Ind. 2019, 29, 86–94. [Google Scholar] [CrossRef] [Green Version]
- Wiktorin, C.; Selin, K.; Ekenvall, L.; Kilbom, Å.; Alfredsson, L. Evaluation of perceived and self-reported manual forces exerted in occupational materials handling. Appl. Ergon. 1996, 27, 231–239. [Google Scholar] [CrossRef]
- Gamberale, F. Perception of effort in manual materials handling. Scand. J. Work. Environ. Health 1990, 16 (Suppl. S1), 59–66. [Google Scholar] [CrossRef] [PubMed] [Green Version]
- Li, K.W.; Yu, R.; Zhang, W. Perception of hand force in power grip for females. Hum. Factors Ergon. Manuf. Serv. Ind. 2013, 23, 77–84. [Google Scholar] [CrossRef]
Figure 1.
Pulling task on a treadmill.

Figure 2.
PS measurement.
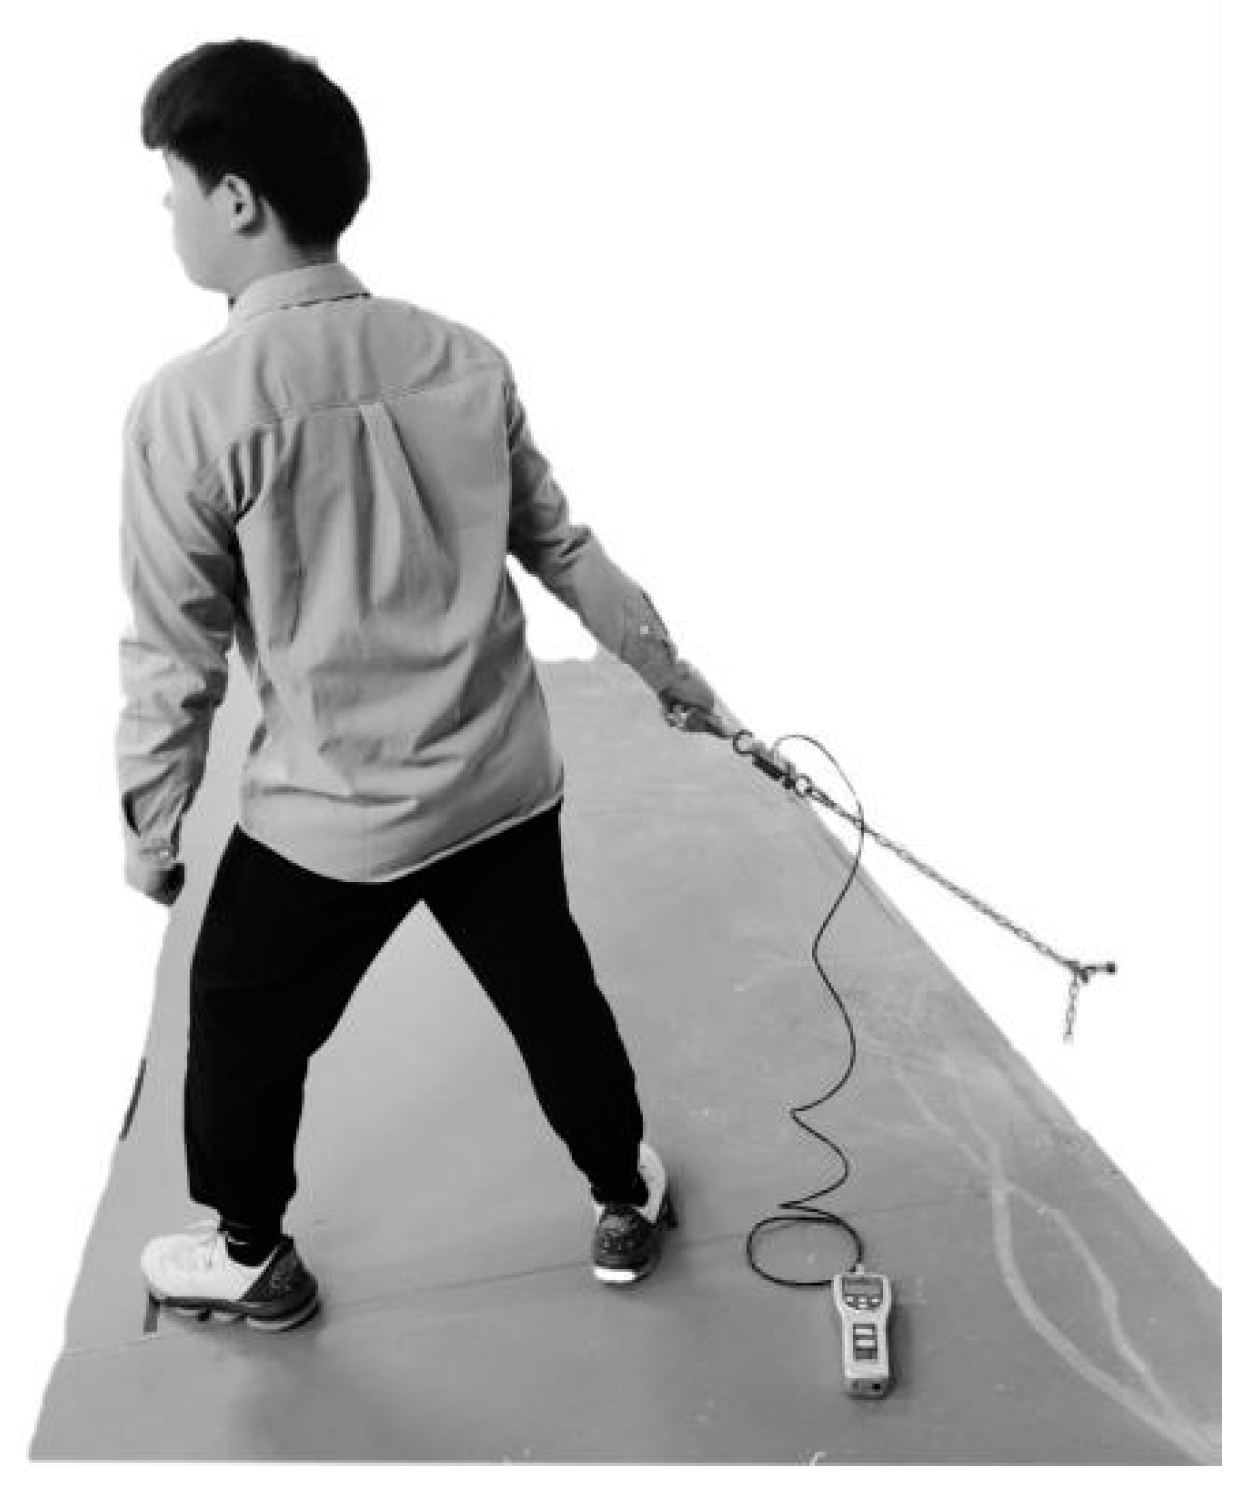
Figure 3.
Experiment procedure.
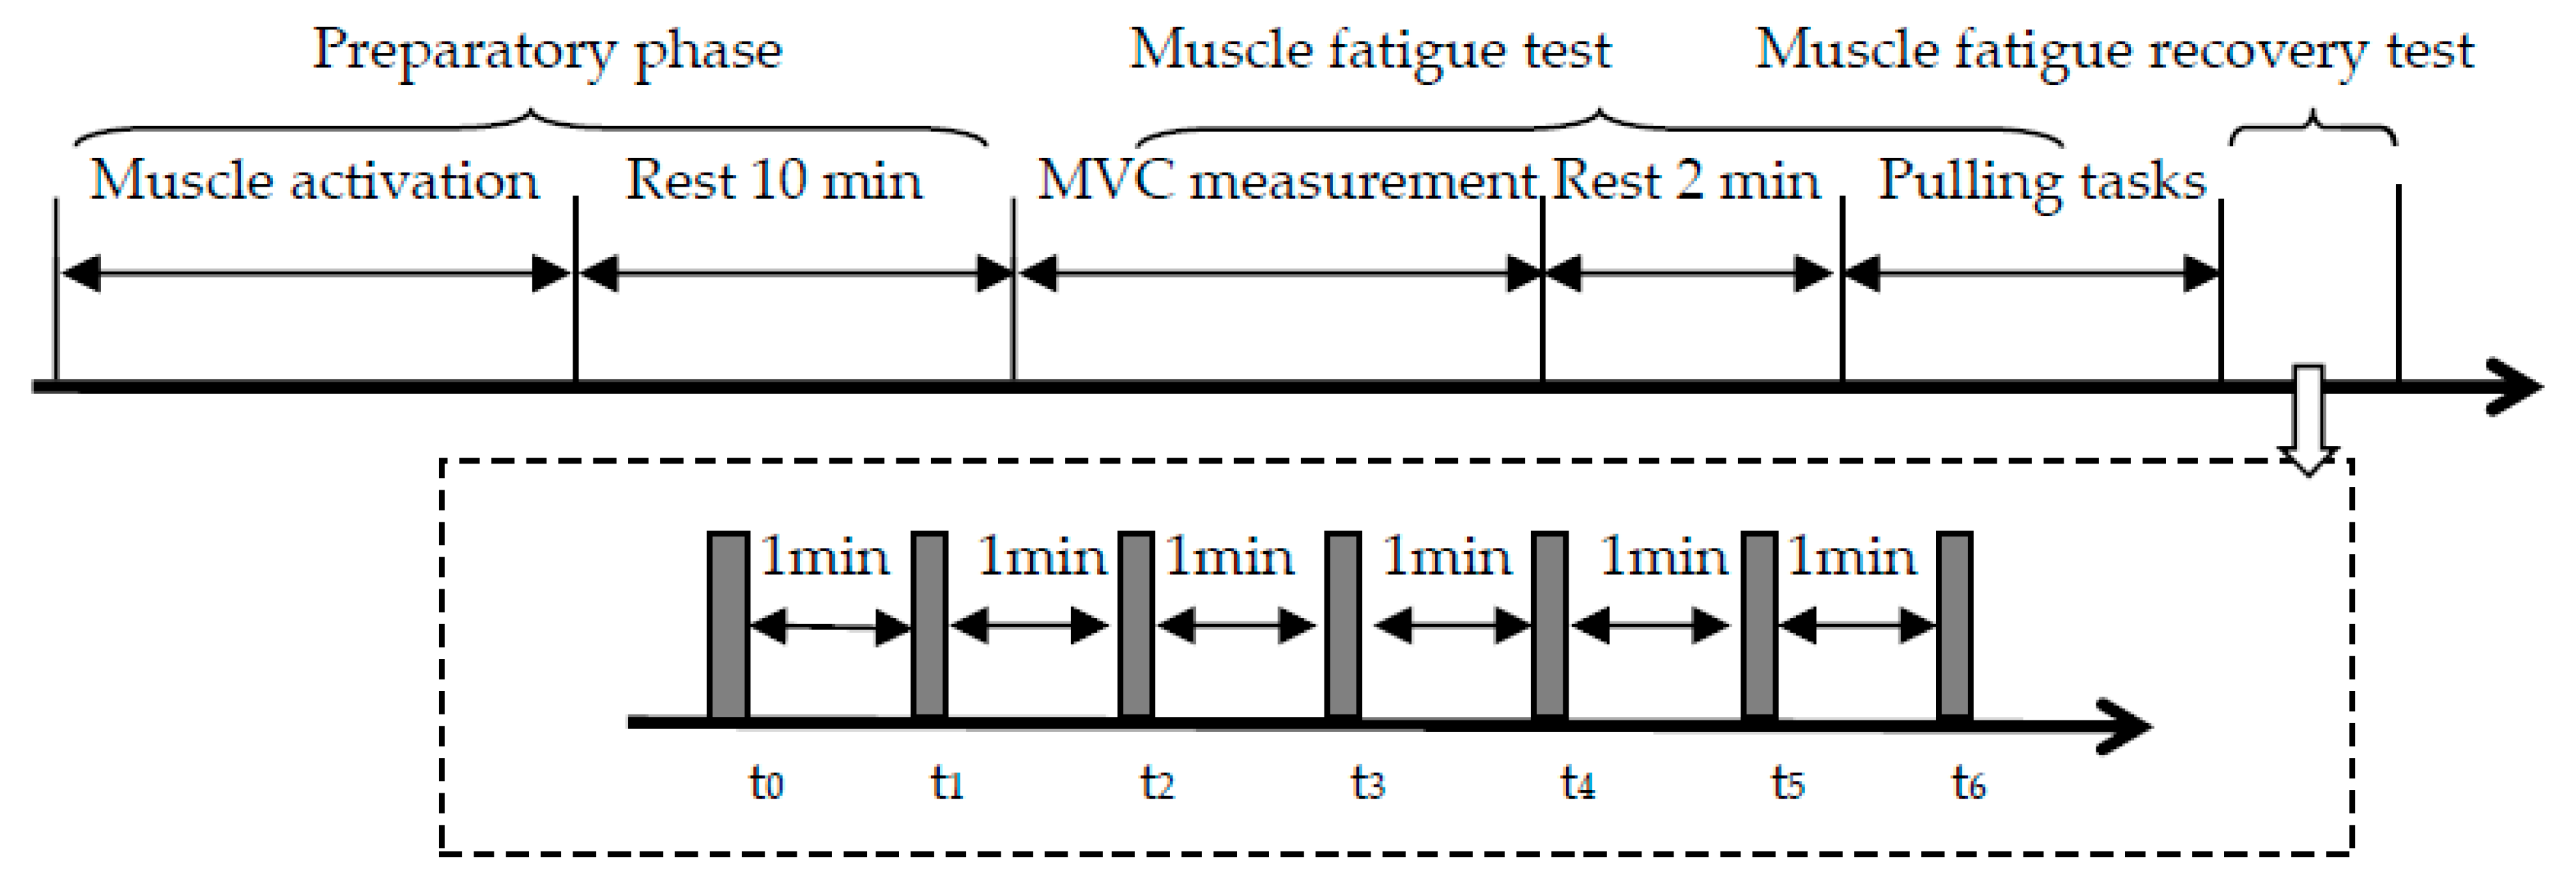
Figure 4.
MET predictive models of muscle fatigue. Yi model-exp: MET model of the exponential function in Yi et al.; Yi model-po: MET model of the power function in Yi et al.; fMVC = forceful exertion/MVC.
Figure 4.
MET predictive models of muscle fatigue. Yi model-exp: MET model of the exponential function in Yi et al.; Yi model-po: MET model of the power function in Yi et al.; fMVC = forceful exertion/MVC.
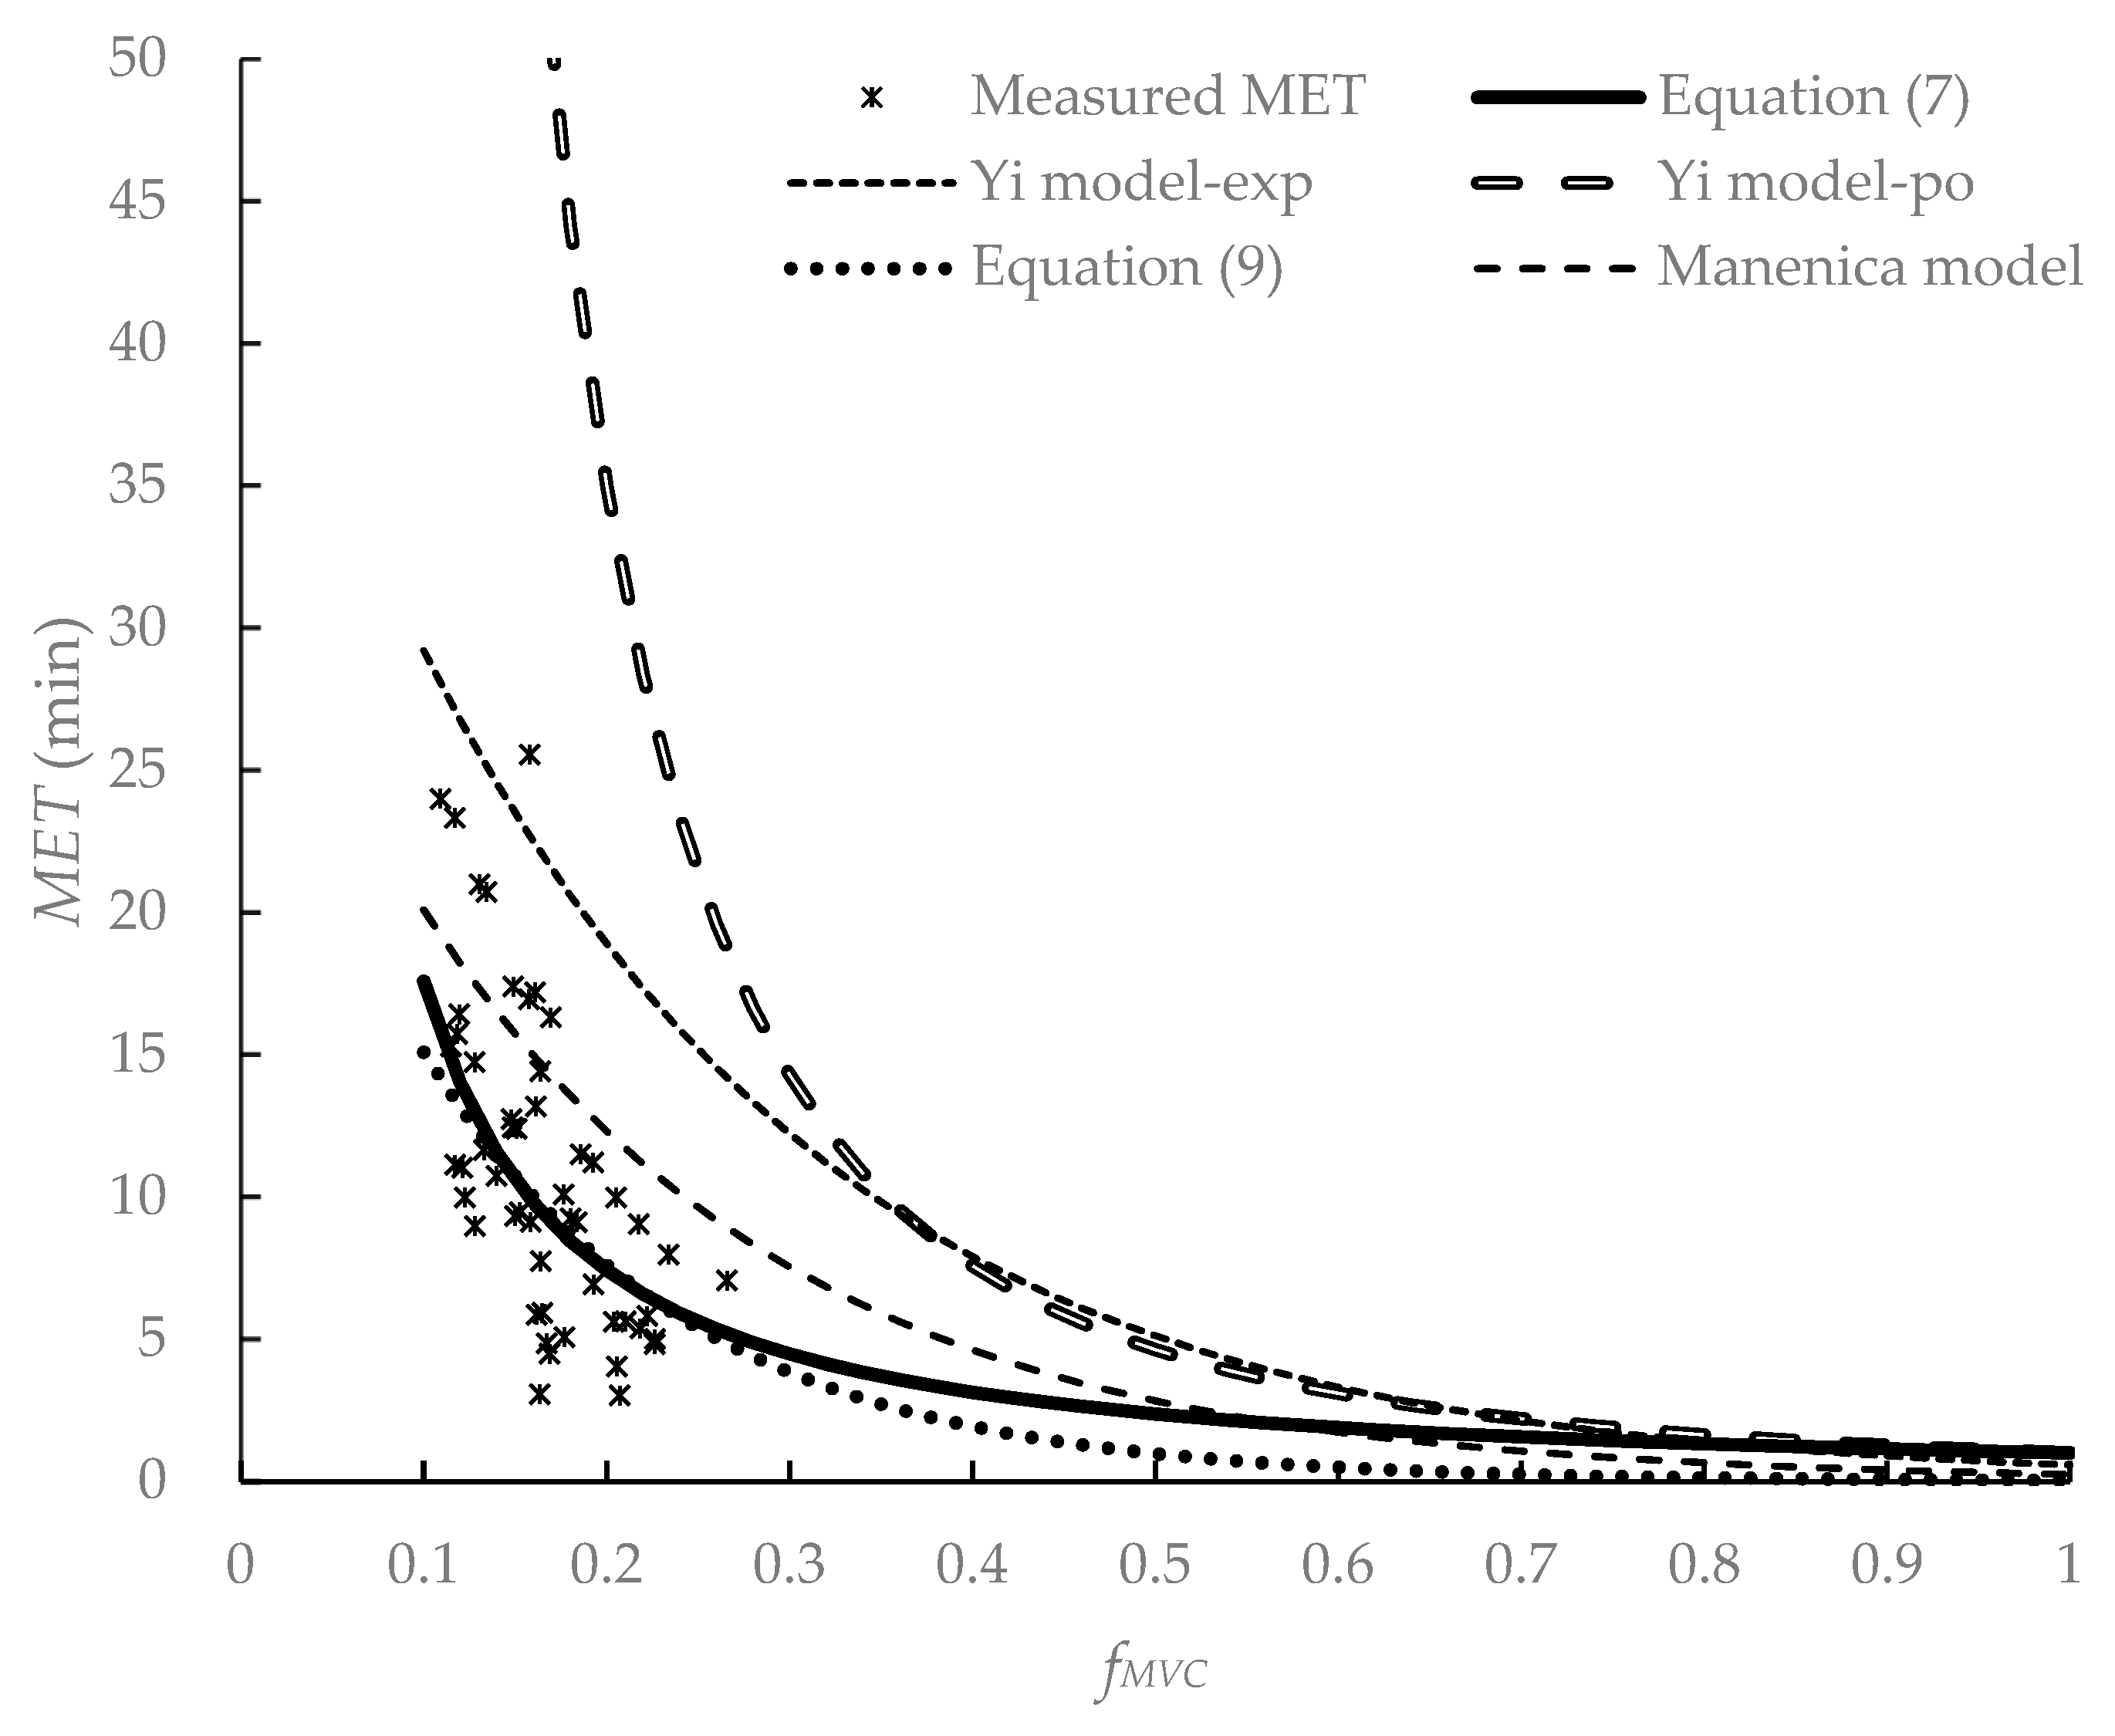
Figure 5.
Comparison of measured and predicted MET. (a) Equation (7), (b) Equation (9).
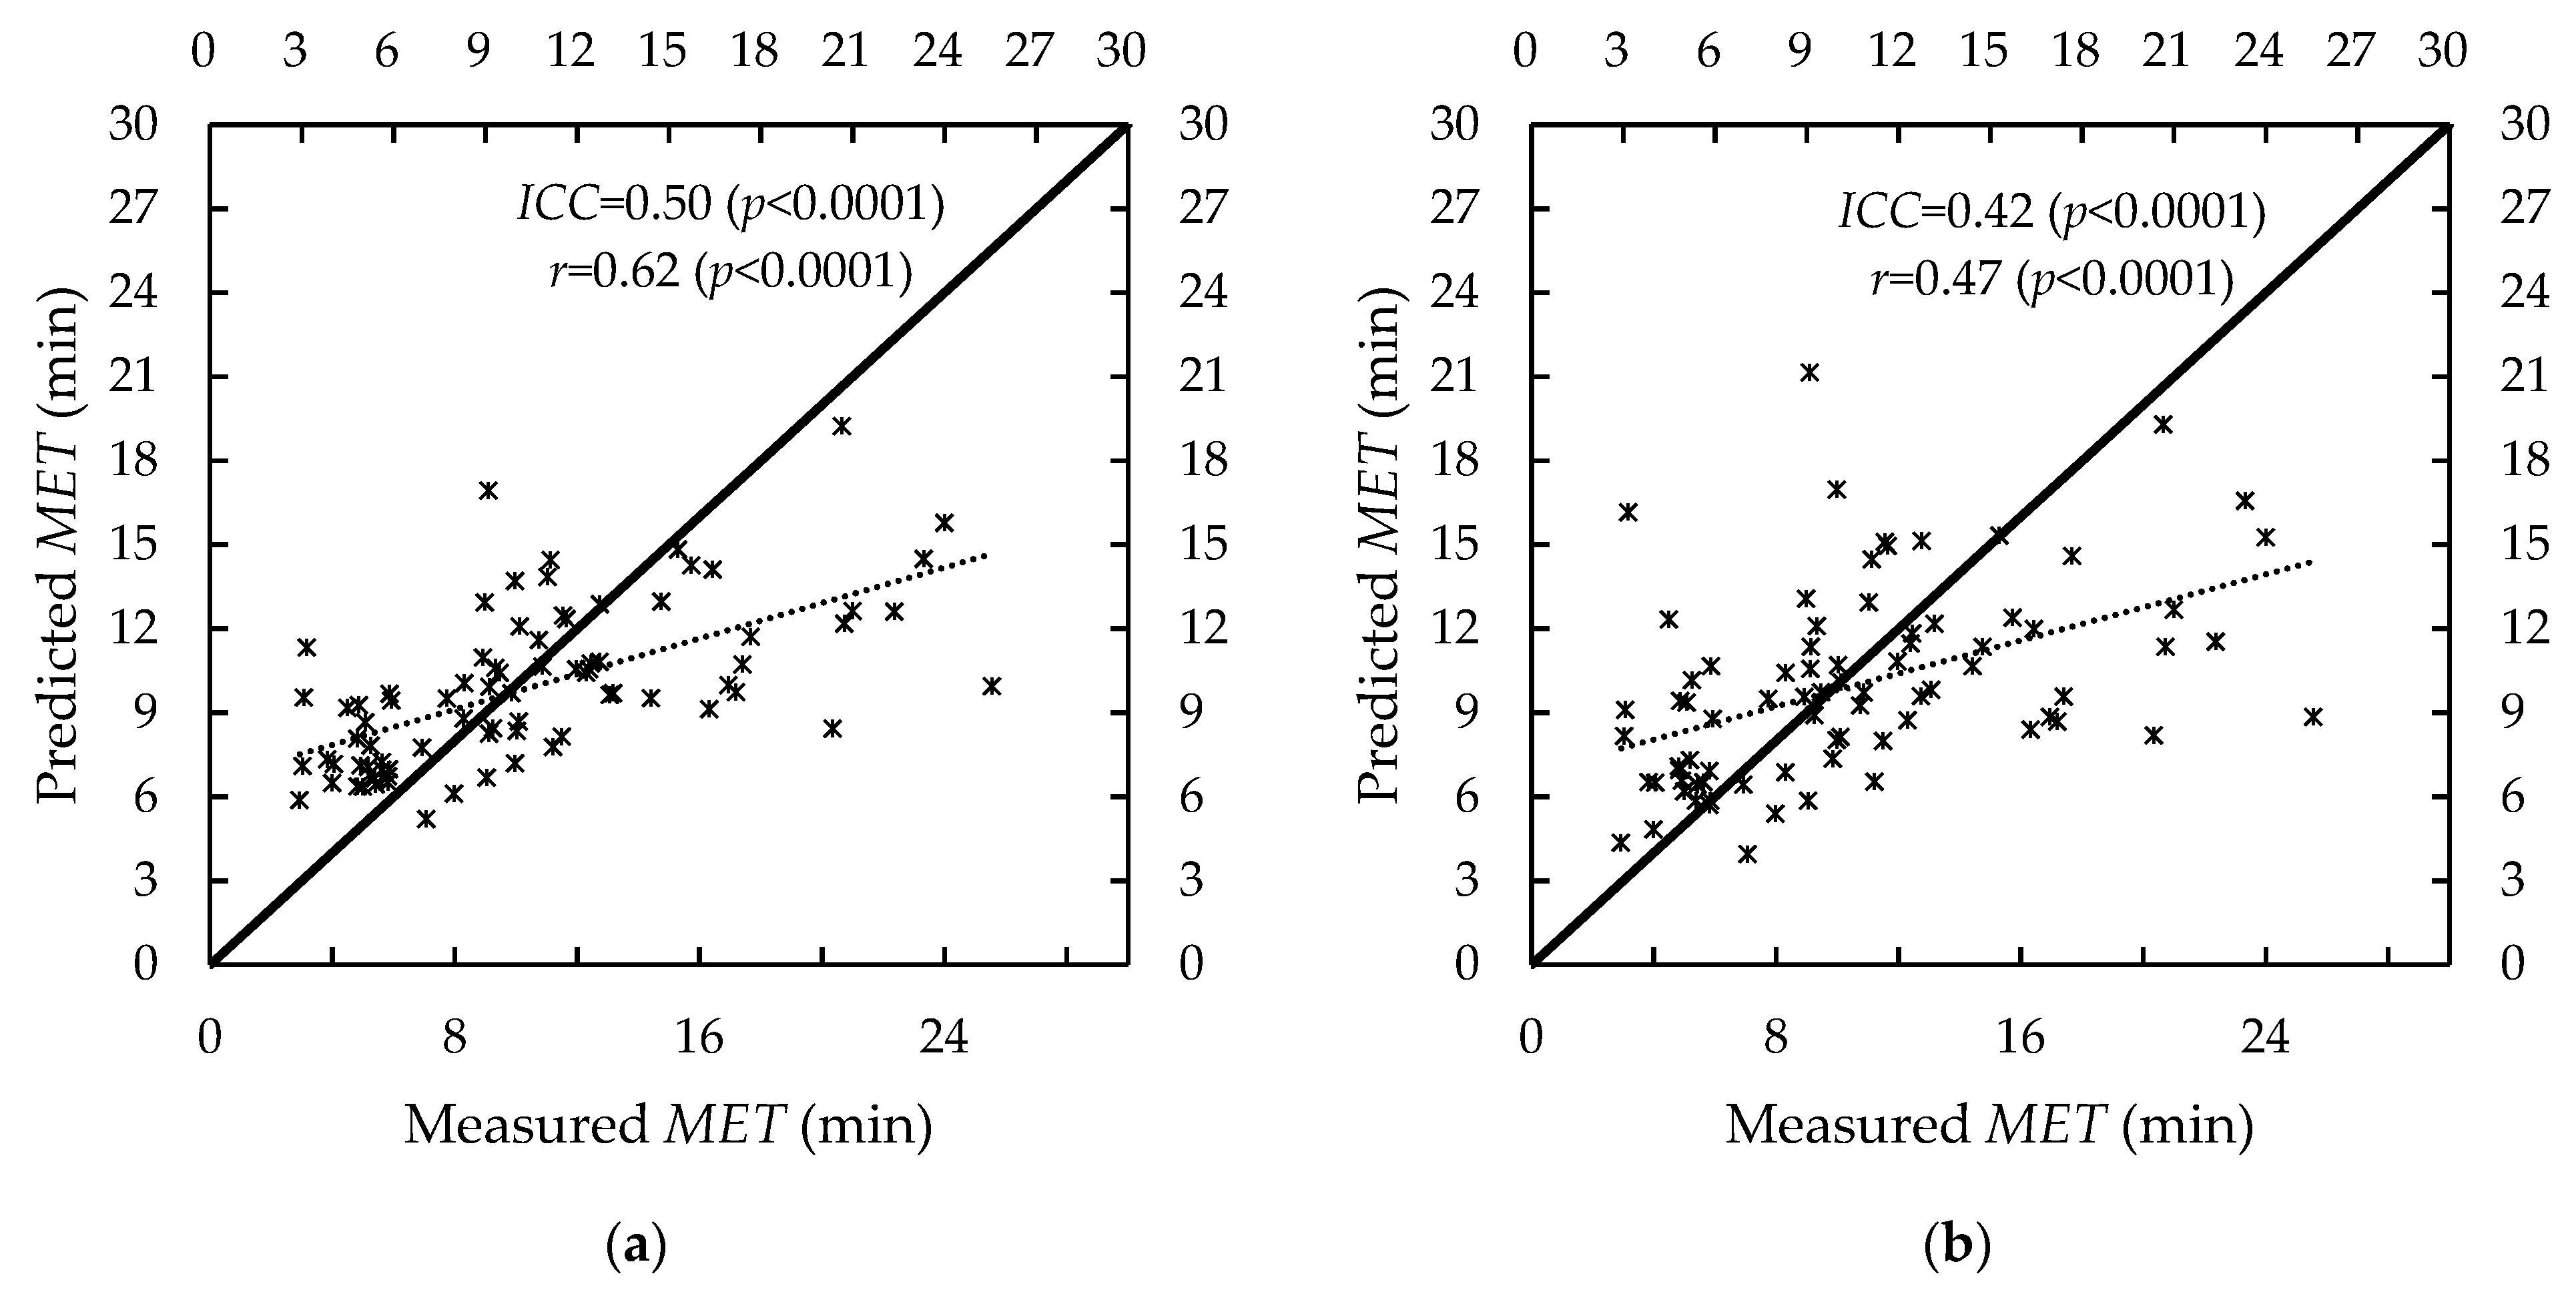
Figure 6.
Measured and predicted PS showing PS recovery.
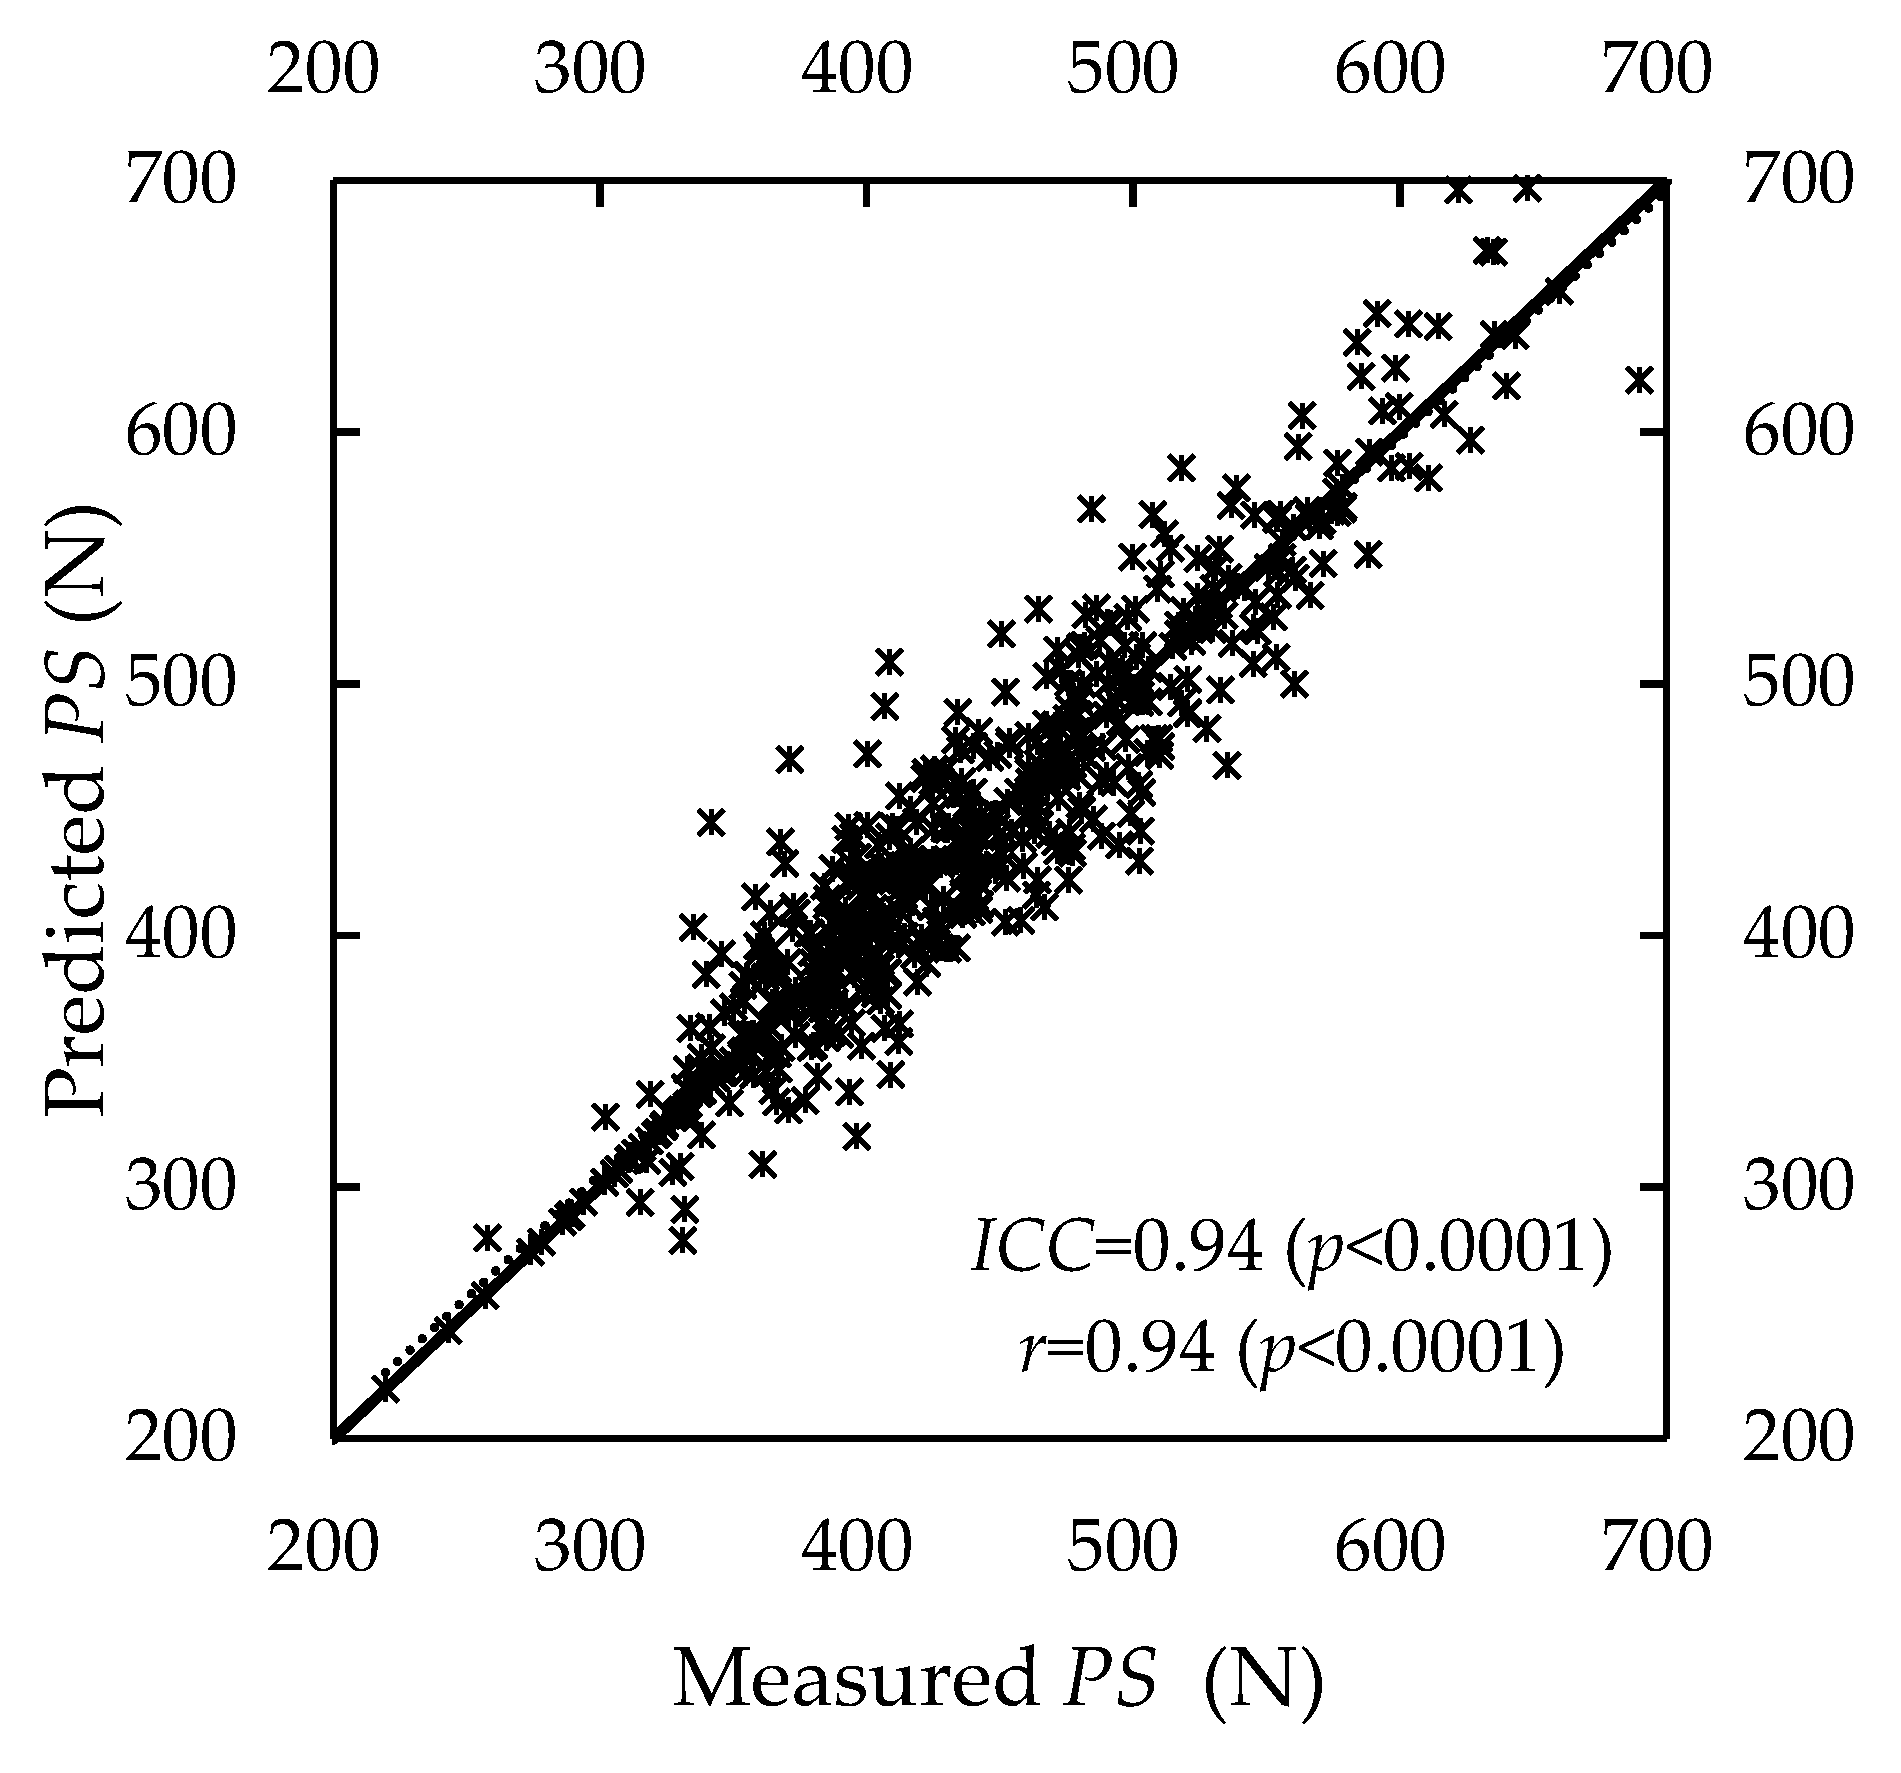
Figure 7.
MET models for new data set. fMVC = forceful exertion/MVC.
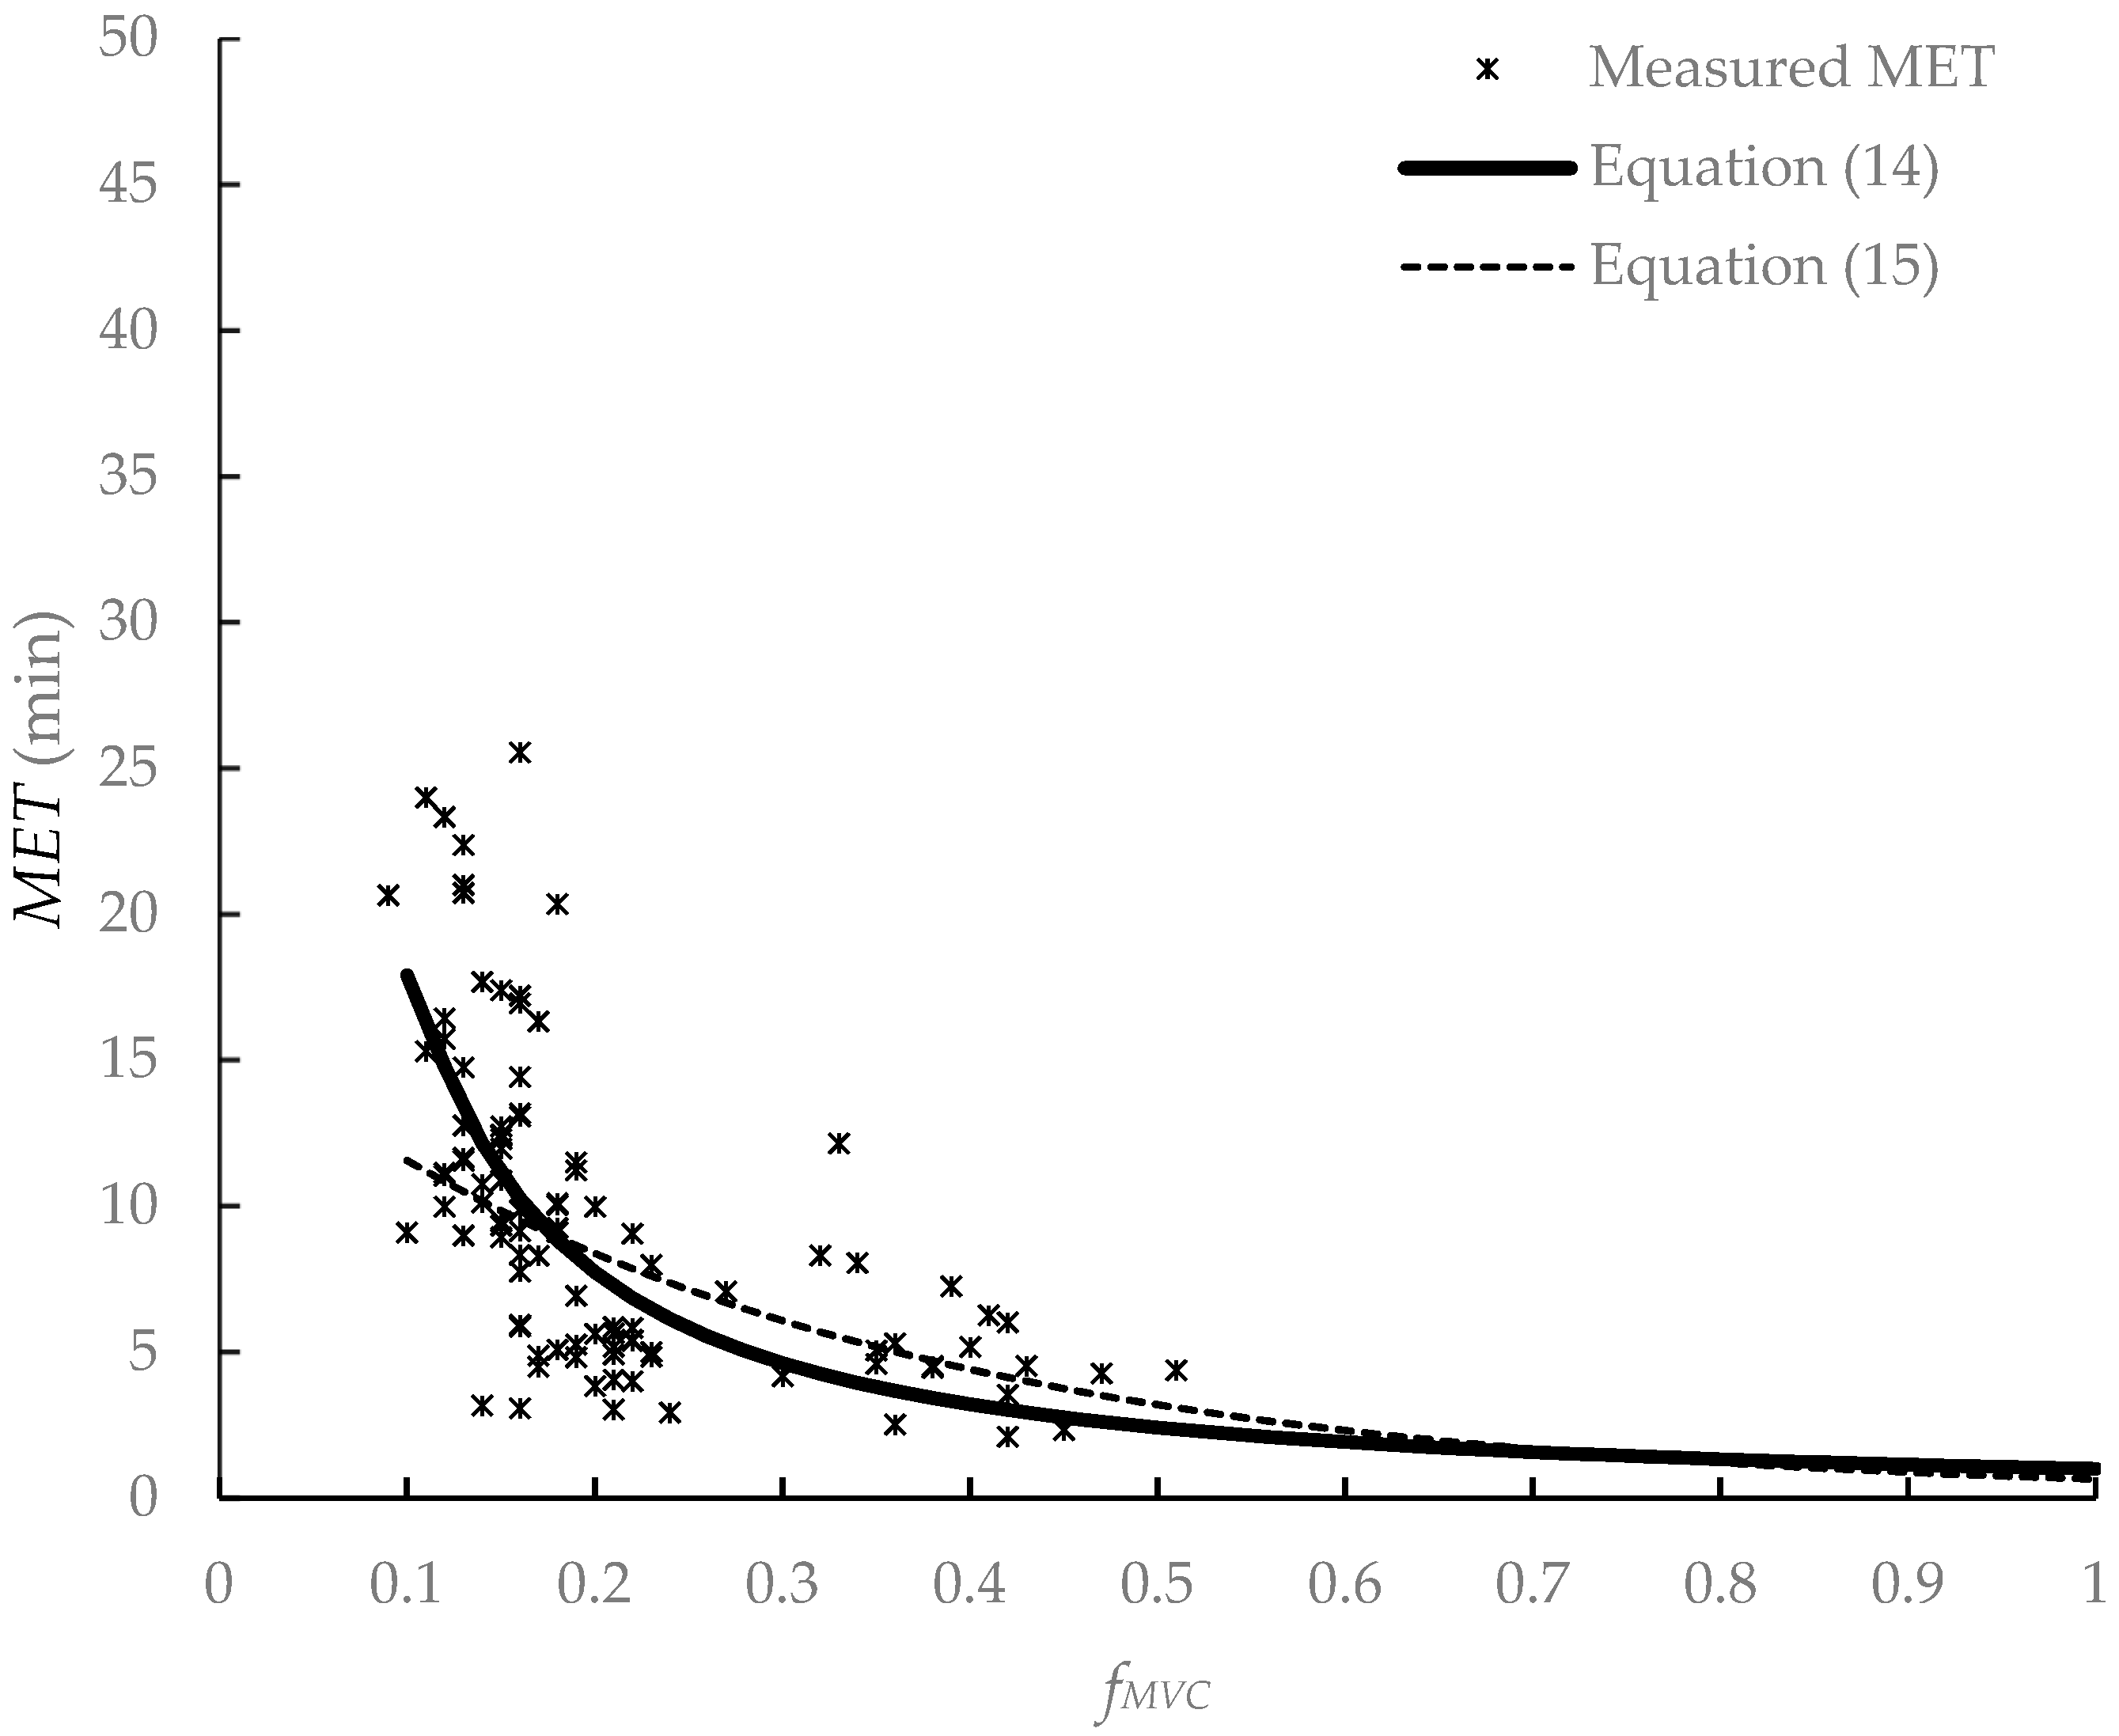
Figure 8.
Comparison of predicted and measured CR-10 using Equation (18).


Table 1.
PS and CR-10 value at recovery time for pulling tasks.
| t (min) | PS (N) | CR-10 |
|---|---|---|
| 0 | 370.3 ± 69.2 A | 7.9 ± 0.9 a |
| 1 | 408.3 ± 68.7 B | 6.1 ± 1.2 b |
| 2 | 426.2 ± 66.4 BC | 5.0 ± 1.2 c |
| 3 | 442.1 ± 68.6 CD | 4.2 ± 1.4 d |
| 4 | 458.0 ± 73.1 DE | 3.5 ± 1.4 e |
| 5 | 472.1 ± 73.0 EF | 3.1 ± 1.4 f |
| 6 | 491.4 ± 74.3 F | 2.7 ± 1.2 g |
Note: The superscript letters indicate that the values of PS and CR-10 are significantly different between different t, respectively, at α = 0.05.
Table 2.
MAD values of the predictive models.
| Models | MAD (min) | ||
|---|---|---|---|
| Body pull model [53] | Manenica | 5.47 (±2.70) | |
| Dynamic pull model [27] | Tang et al. | 4.82 (±3.42) | |
| Static pull model [19] | Exponential model | 11.67 (±4.22) | |
| Power model | 50.52 (±32.07) | ||
| Current study | Equation (7) | Group A data | 3.28 (±2.99) |
| Group B data | 3.22 (±2.88) | ||
| Equation (9) | Group A data | 3.57 (±3.08) | |
| Group B data | 3.70 (±3.74) | ||
Publisher’s Note: MDPI stays neutral with regard to jurisdictional claims in published maps and institutional affiliations. |
© 2022 by the authors. Licensee MDPI, Basel, Switzerland. This article is an open access article distributed under the terms and conditions of the Creative Commons Attribution (CC BY) license (https://creativecommons.org/licenses/by/4.0/).
Share and Cite
MDPI and ACS Style
Yi, C.; Zuo, H.; Zhao, C.; Li, K.-W.; Hu, H.; Tang, F.; Long, T. Fatigue and Recovery of Muscles for Pulling Tasks. Int. J. Environ. Res. Public Health 2022, 19, 15159. https://doi.org/10.3390/ijerph192215159
AMA Style
Yi C, Zuo H, Zhao C, Li K-W, Hu H, Tang F, Long T. Fatigue and Recovery of Muscles for Pulling Tasks. International Journal of Environmental Research and Public Health. 2022; 19(22):15159. https://doi.org/10.3390/ijerph192215159
Chicago/Turabian StyleYi, Cannan, Huali Zuo, Caijun Zhao, Kai-Way Li, Hong Hu, Fan Tang, and Tong Long. 2022. "Fatigue and Recovery of Muscles for Pulling Tasks" International Journal of Environmental Research and Public Health 19, no. 22: 15159. https://doi.org/10.3390/ijerph192215159
Note that from the first issue of 2016, this journal uses article numbers instead of page numbers. See further details here.