1. Introduction
Chronic obstructive airways disease (COPD), cardiovascular disease (CVD) and cerebrovascular disease (CBD) incidence is increasing in South Africa, as in many developing countries [
1]. The short-term effects of particles with a 50% cut-off at an aerodynamic diameter of 2.5 μm or less (PM
2.5), PM
10, carbon monoxide (CO), nitrogen dioxide (NO
2), ozone (O
3), sulfur dioxide (SO
2) on respiratory disease (RD), CVD and CBD mortality and morbidity were summarized in a meta-analysis [
2]. The majority of the case-crossover or time series epidemiological studies included in the meta-analysis were conducted in North America and Western Europe, with more from Asia and South America since 2004.
There remains a need for similar studies and long-term cohort studies in cities of developing countries, as levels and composition of air pollution are different from North America and Western Europe due to different sources [
3]. Differences in the vulnerability of the population, building characteristics, time-activity patterns and proximity to air pollution sources may also modify the effects of exposure. A better understanding is also needed of how air pollution from indoor sources contributes to levels of outdoor air pollution and how indoor exposure to air pollution from indoor sources influences risk estimates for outdoor air pollution.
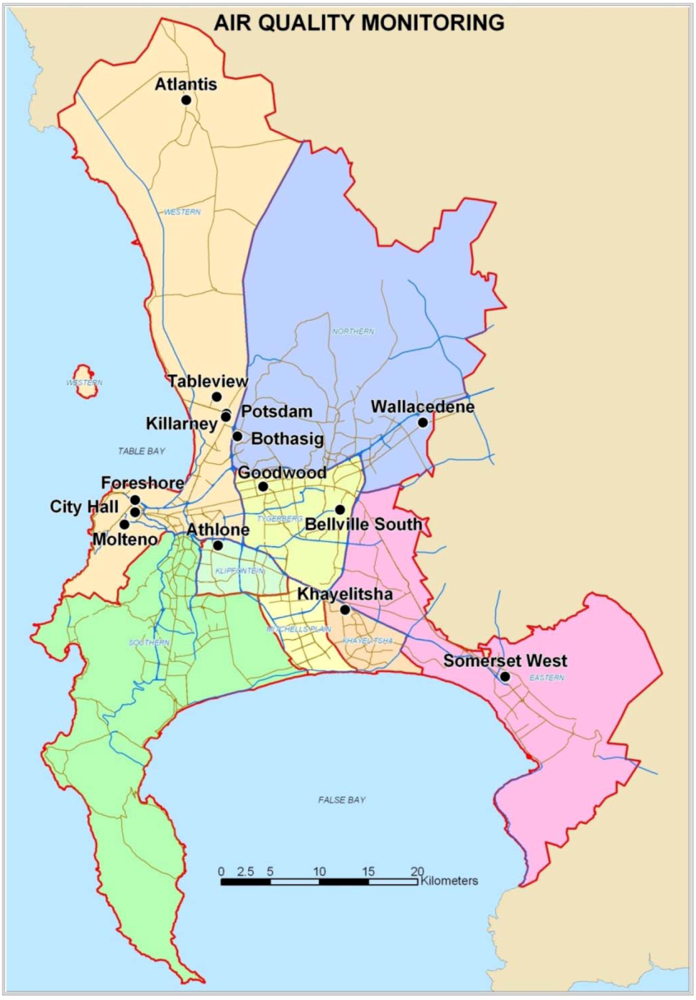
Exposure to outdoor air pollutants is essentially beyond the control of individuals and requires action by public authorities at the national, regional and even international levels. Outdoor air quality remains a key issue in Cape Town [
4]. The main sources of PM
10 are diesel vehicles, wood and coal burning for household heating and cooking fuel, dust from construction activities and unpaved roads, as well as wind-blown dust. The main sources of NO
2 and SO
2 are diesel vehicles and coal burning for household fuel, as there are few large industries in the city [
4].
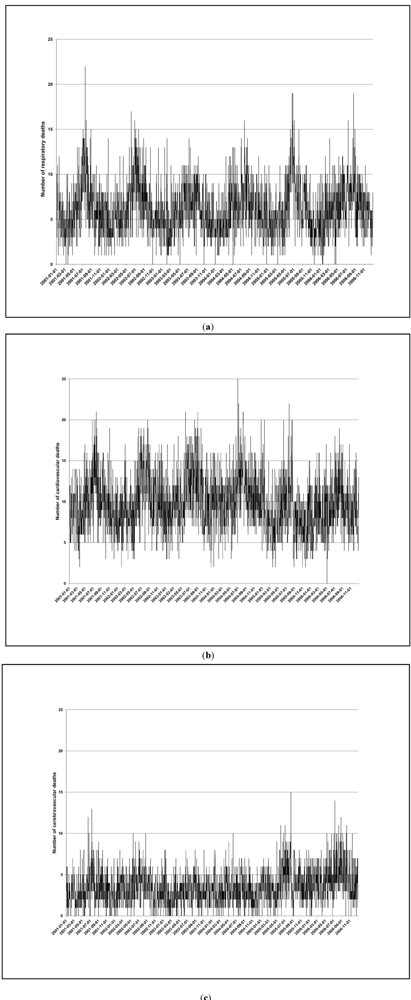
The objective of this study was to investigate if there is a significant association between the 24-h average ambient PM10, SO2 and NO2 levels and daily RD, CVD and CBD mortality in Cape Town, South Africa during 2001–2006.
4. Discussion and Conclusions
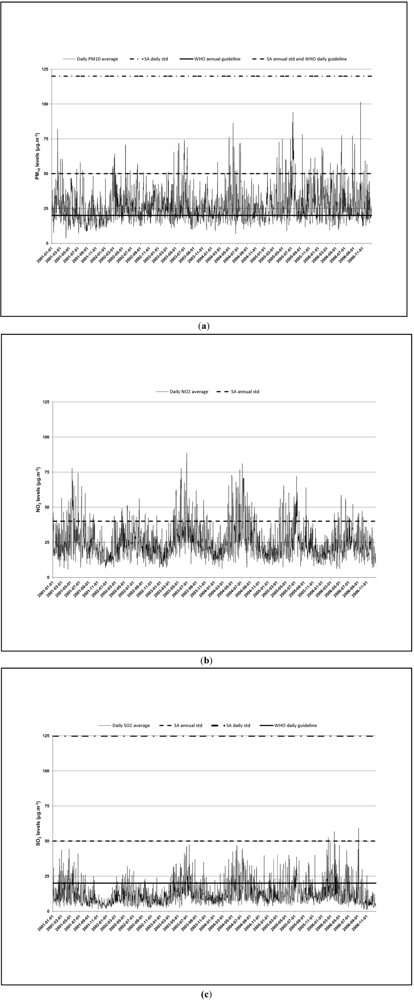
Daily PM
10, NO
2 and SO
2 levels in Cape Town City Centre, Goodwood and Tableview are comparable or even lower than to those in North America and Western Europe, and much lower than levels observed in South America, Asia and North Africa [
3].
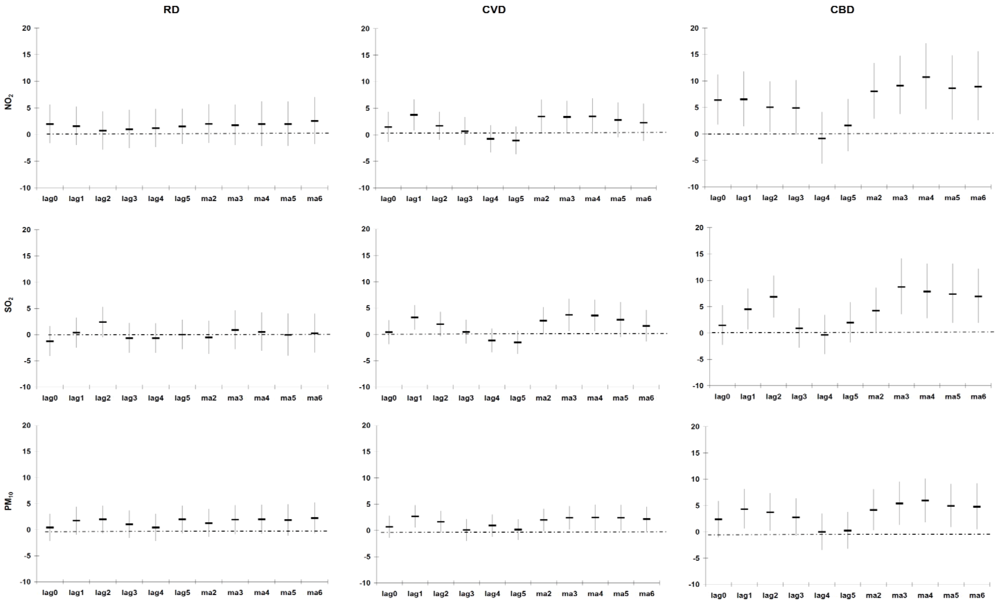
Our estimate of association (excess mortality risk) between PM
10, and RD, CVD and CBD mortality of 1.1% (−1.1%; 3.3%), 1.7% (−0.1%; 3.5%) and 3.2% (0.3%; 6.2%) following a 10 µg/m
3 increase (entire year data), respectively, is higher than those observed in a meta-analysis conducted on studies from North America, South America, Europe, the Eastern Mediterranean, South East Asia and the Western Pacific [
2]. The meta-analysis reported excess mortality risks of 1.0% (0.5%; 1.4%), 0.6% (0.2%; 1.1%) and 0.4% (0.0%; 0.8%) for RD, CVD and CBD mortality following a 10 µg/m
3 increase in PM
10, respectively. However, heterogeneity in the effect estimates was observed in the different individual and multiple city studies.
Our estimate of association between NO
2 and RD mortality of 1.7% (−1.3%; 4.7%), following a 10 µg/m
3 increase (entire year data) is the same as that of the meta-analysis 1.7% (1.3%; 2.1%) [
2]. Our estimate of association between NO
2, and CVD and CBD mortality of 2.6% (0.2%; 5.0%) and 6.6% (2.4%; 11.0%) following a 10 µg/m
3 increase (entire year data), respectively, is higher than those observed in the meta-analysis: 0.7% (0.5%; 0.8%) and 0.8% (0.2%; 1.4%), respectively [
2]. As for PM
10, heterogeneity in the effect estimates was observed in the different individual and multiple city studies.
Our estimate of association between SO
2, and RD, CVD and CBD mortality of −0.7% (−4.5%; 3.3%), 3.3% (0.1%; 6.5%) and 5.3% (0.0%; 10.9%) following a 10 µg/m
3 increase (entire year data), respectively, is in general higher than those observed in the meta-analysis [
2]. The meta-analyses reported excess mortality risks of 0.3% (0.0%; 0.6%), 2.0% (0.6%; 3.5%) and 2.1% (0.7%; 3.6%) for RD, CVD and CBD mortality following a 10 µg/m
3 increase in SO
2, respectively [
2]. As for NO
2 and PM
10, heterogeneity in the effect estimates was observed in the different individual and multiple city studies.
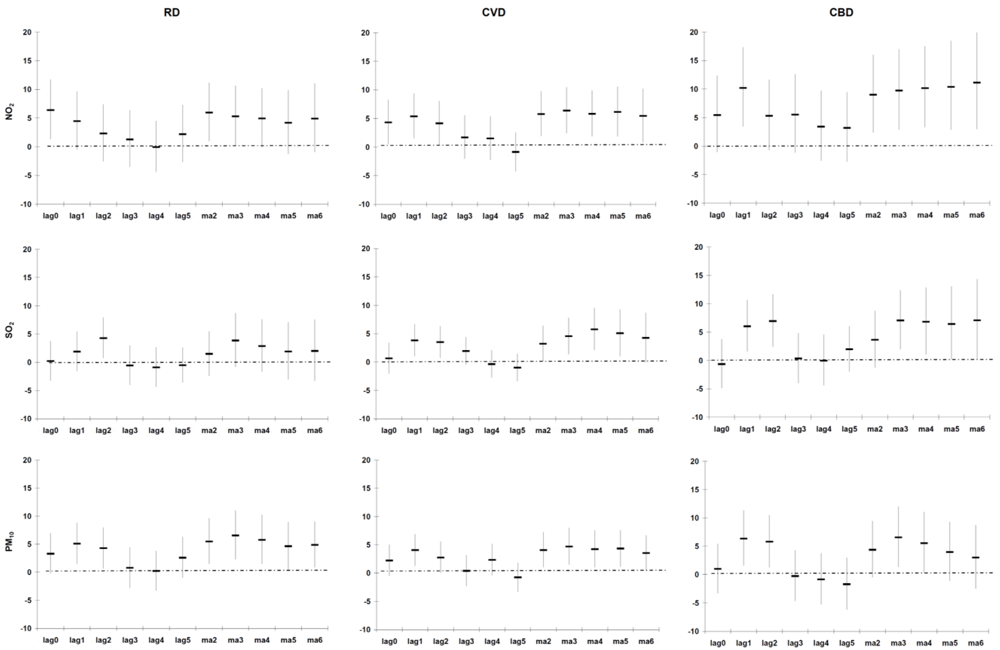
Two multicity studies in the USA investigated whether warm and cold seasonal differences exist in the association between PM
10 and natural all-cause mortality and one multicity study investigated this for SO
2, and RD and CVD mortality in Europe [
2]. No seasonal differences were observed between PM
10 and all-cause natural mortality, but slightly stronger SO
2 effects on RD and CVD mortality in the warmer months. A study by Goldberg
et al. found higher PM
2.5, NO
2 and SO
2 effects on natural all-cause mortality amongst ³65 year olds with diabetes in the warm season in Montreal, Canada, compared to the entire year [
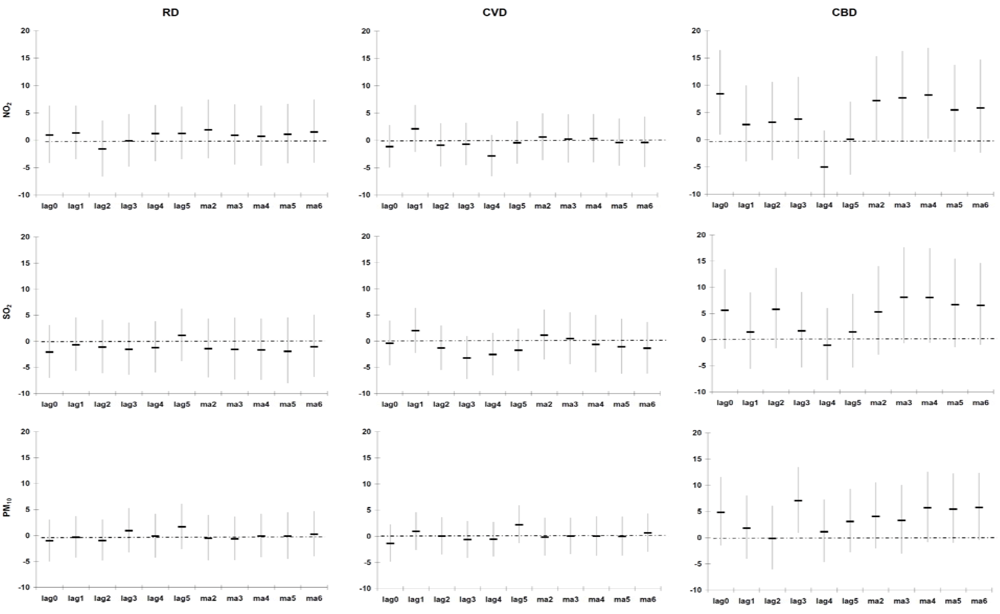
16]. A study in Belgium also reported stronger association between PM
10 and natural all-cause mortality during spring and summer, compared to autumn and winter [
17]. Another study observed significant increases in PM
10 effect estimates on natural all-cause mortality in Bangkok, Thailand and Wuham, China in the warm season, but decreases in Hong Kong, China and to a lesser extent in Wuham, China [
18]. Seasonal differences in air pollution effect estimates may have substantial implications for the setting of air pollution health standards.
Speculations about the mechanisms underlying the much stronger association between mortality and air pollution exposure during warmer periods, even though the levels reach may be higher in winter, may be due to the difference in the component-specific toxicity of air pollution across the temperature range. A study that exposed isolated macrophages of rats to ambient PM
10 collected during winter, spring and summer (in Amsterdam, Lodz, Oslo and Rome) showed that samples collected in summer were more potent at inducing inflammatory cytokines (interleukin 6 and tumor necrosis factor a) [
19]. The higher effects during the warmer months may also be due to more time spent outdoors or because of a closer similarity between indoor and outdoor air pollution. Lower background mortality in the warmer months, thus resulting in a larger pool of susceptible people, may also explain the higher relative effects observed in these months [
20]. However, currently it is not clear whether air pollutants are effect modifiers and/or confounders of the temperature-mortality relationship [
13].
Anderson
et al. postulated reasons for the heterogeneity in air pollutant effects estimates in different studies, which include variations in exposure measurement error, toxicity of the pollution, different ages and vulnerability of the population, differences in the way the exposure and outcome series had been assembled, statistical approaches selected, specification of meteorological variables, approaches to control time-varying confounders and publication bias [
2]. Anderson
et al. also acknowledged that the relative contributions of these factors were (and still are) poorly understood [
2].
Issues affecting the vulnerability of the population in Cape Town are numerous. South Africa has the highest
per capita annual risk of TB disease of comparably sized countries globally, and its communities have extremely high TB transmission rates. The rates of TB infection of children and adolescents are now similar to those reported 100 years ago in Europe long before chemotherapy became available [
21]. This means many people already have compromised respiratory systems. Use of polluting indoor fuel has been linked to increase in the incidence of respiratory infections, including pneumonia, tuberculosis and COPD, low birth weight, cataracts, cardiovascular events and all-cause mortality both in adults and children, which adds to the vulnerability of the population [
22].
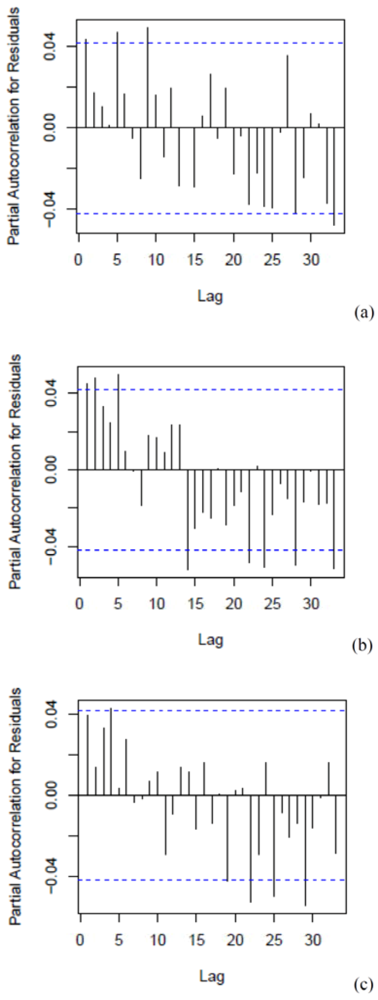
Advantages of our study include accurate air pollution and meteorological data. Our study results from the case-crossover models were confirmed in time series models and our lag structure with main effects on cause-specific mortality occurring within 2 days is compatible with other studies [
2].
A review of the quality of cause of death data from 115 WHO member countries, published in 2005, categorized South Africa as having low quality cause of death data based on a combination of a more than 20% of deaths being ill-defined deaths and less than 70% of deaths being registered [
23]. The completeness of death registration for adults in Cape Town during the period 2001–2006 was estimated to be 96%, with the exception of 2005 where the completeness was 84%, about 55% for children 0–4 years, and about 70% for infants [
8]. A report by Bradshaw
et al. concluded that South Africa now fits into the category of countries with medium rather than poor quality [
24]. Many European countries are in the medium quality category. Thus health outcome misclassification is possible, but it is unlikely to be related to air pollution. Our confidence in the accuracy of the mortality data is supported by the clear seasonal trends.
A limitation of all case-crossover and time series epidemiological studies is the assumption that the ambient air pollution and meteorological variables measured at a few sites are the same across the entire city, which might have resulted in a measurement error. This exposure misclassification is non-differential and should bias the effect estimates towards the null [
25]. In general we observed stronger associations with those living within 10 km from the three monitoring sites.
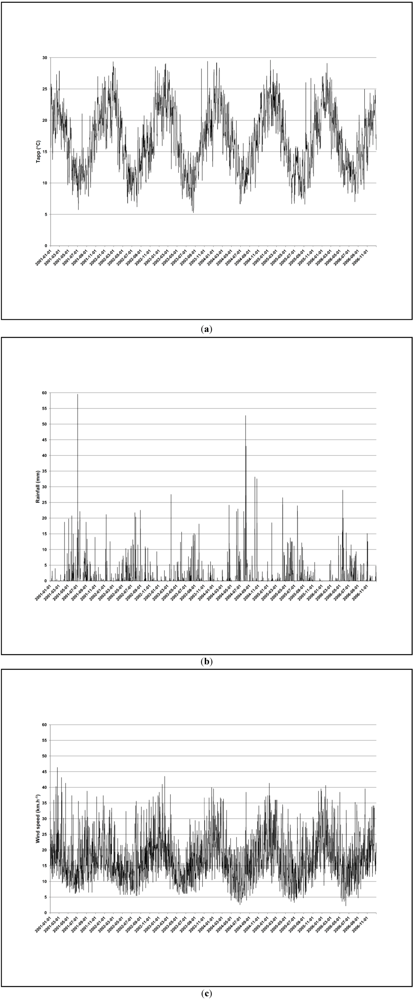
Another limitation is that the meteorological data were collected at the airport, which is 25 km from the city center. This may influence how well the meteorological variables are correlated with the pollutants, and eventually affect the robustness of the study results.
Other limitations are that ozone data were not sufficiently available from the Goodwood site (≥70% of 1-hour values missing in 2001–2006) and that the chemical composition of PM
10 was not available. Ozone is a potentially important confounder, especially in the warm period when levels are higher [
2].
Much has been learned from epidemiological studies regarding the adverse health effects of outdoor air pollution in the past 25 years. Nonetheless, important research gaps remain that are critical to public policy, such as identifying the most toxic constituents of the pollutant mix and sources contributing to it, pinpointing social conditions, genetic factors and pre-existing diseases that increase vulnerability, teasing out the how much long-term exposure, especially during childhood, affect the development of chronic, life-threatening disease [
26]. The answers to these questions may well be different in Africa than in the developed world, where to date the vast majority of epidemiological studies have been conducted. The current uncertainty regarding the shape and the slope of the air pollution concentration–response function for long-term exposure and RD, CVD and CBD mortality is also important for Africa, where levels may exceed those observed in the USA and Europe.
Norman
et al. estimated that 3.7% of CVD mortality in South Africa is attributed to outdoor PM
2.5 [
27]. The PM
2.5 response function of the American Cancer Society (ACS) cohort study was applied in this estimation [
28]. Long-term exposure in cohort studies indicate stronger associations with health outcomes than short-term case-crossover or time series epidemiological studies [
3]. Cohort studies in South Africa might thus also indicate stronger effects than that of the ACS study. This will mean that the attributable fraction due to outdoor air pollution may be much higher in South Africa than estimated by Norman
et al. [
27].
In conclusion, this study is very relevant in stressing the importance of improving air quality in South Africa. The RD, CVD and CBD mortality risks associated with ambient air pollution exposure is in general much higher in Cape Town than those reported in studies from the USA and Europe. Whether our results are due to statistical chance or consistent over time can only be revealed by continuation of monitoring of the associations over time in the future.


