Artificial Intelligence Applied to a First Screening of Naevoid Melanoma: A New Use of Fast Random Forest Algorithm in Dermatopathology

 ,
,  ,
,  , ,
, ,  , ,
, ,  ,
, 
 and
and
Abstract
:1. Introduction
2. Materials and Methods
2.1. Data Acquisition
2.2. Algorithm
- -
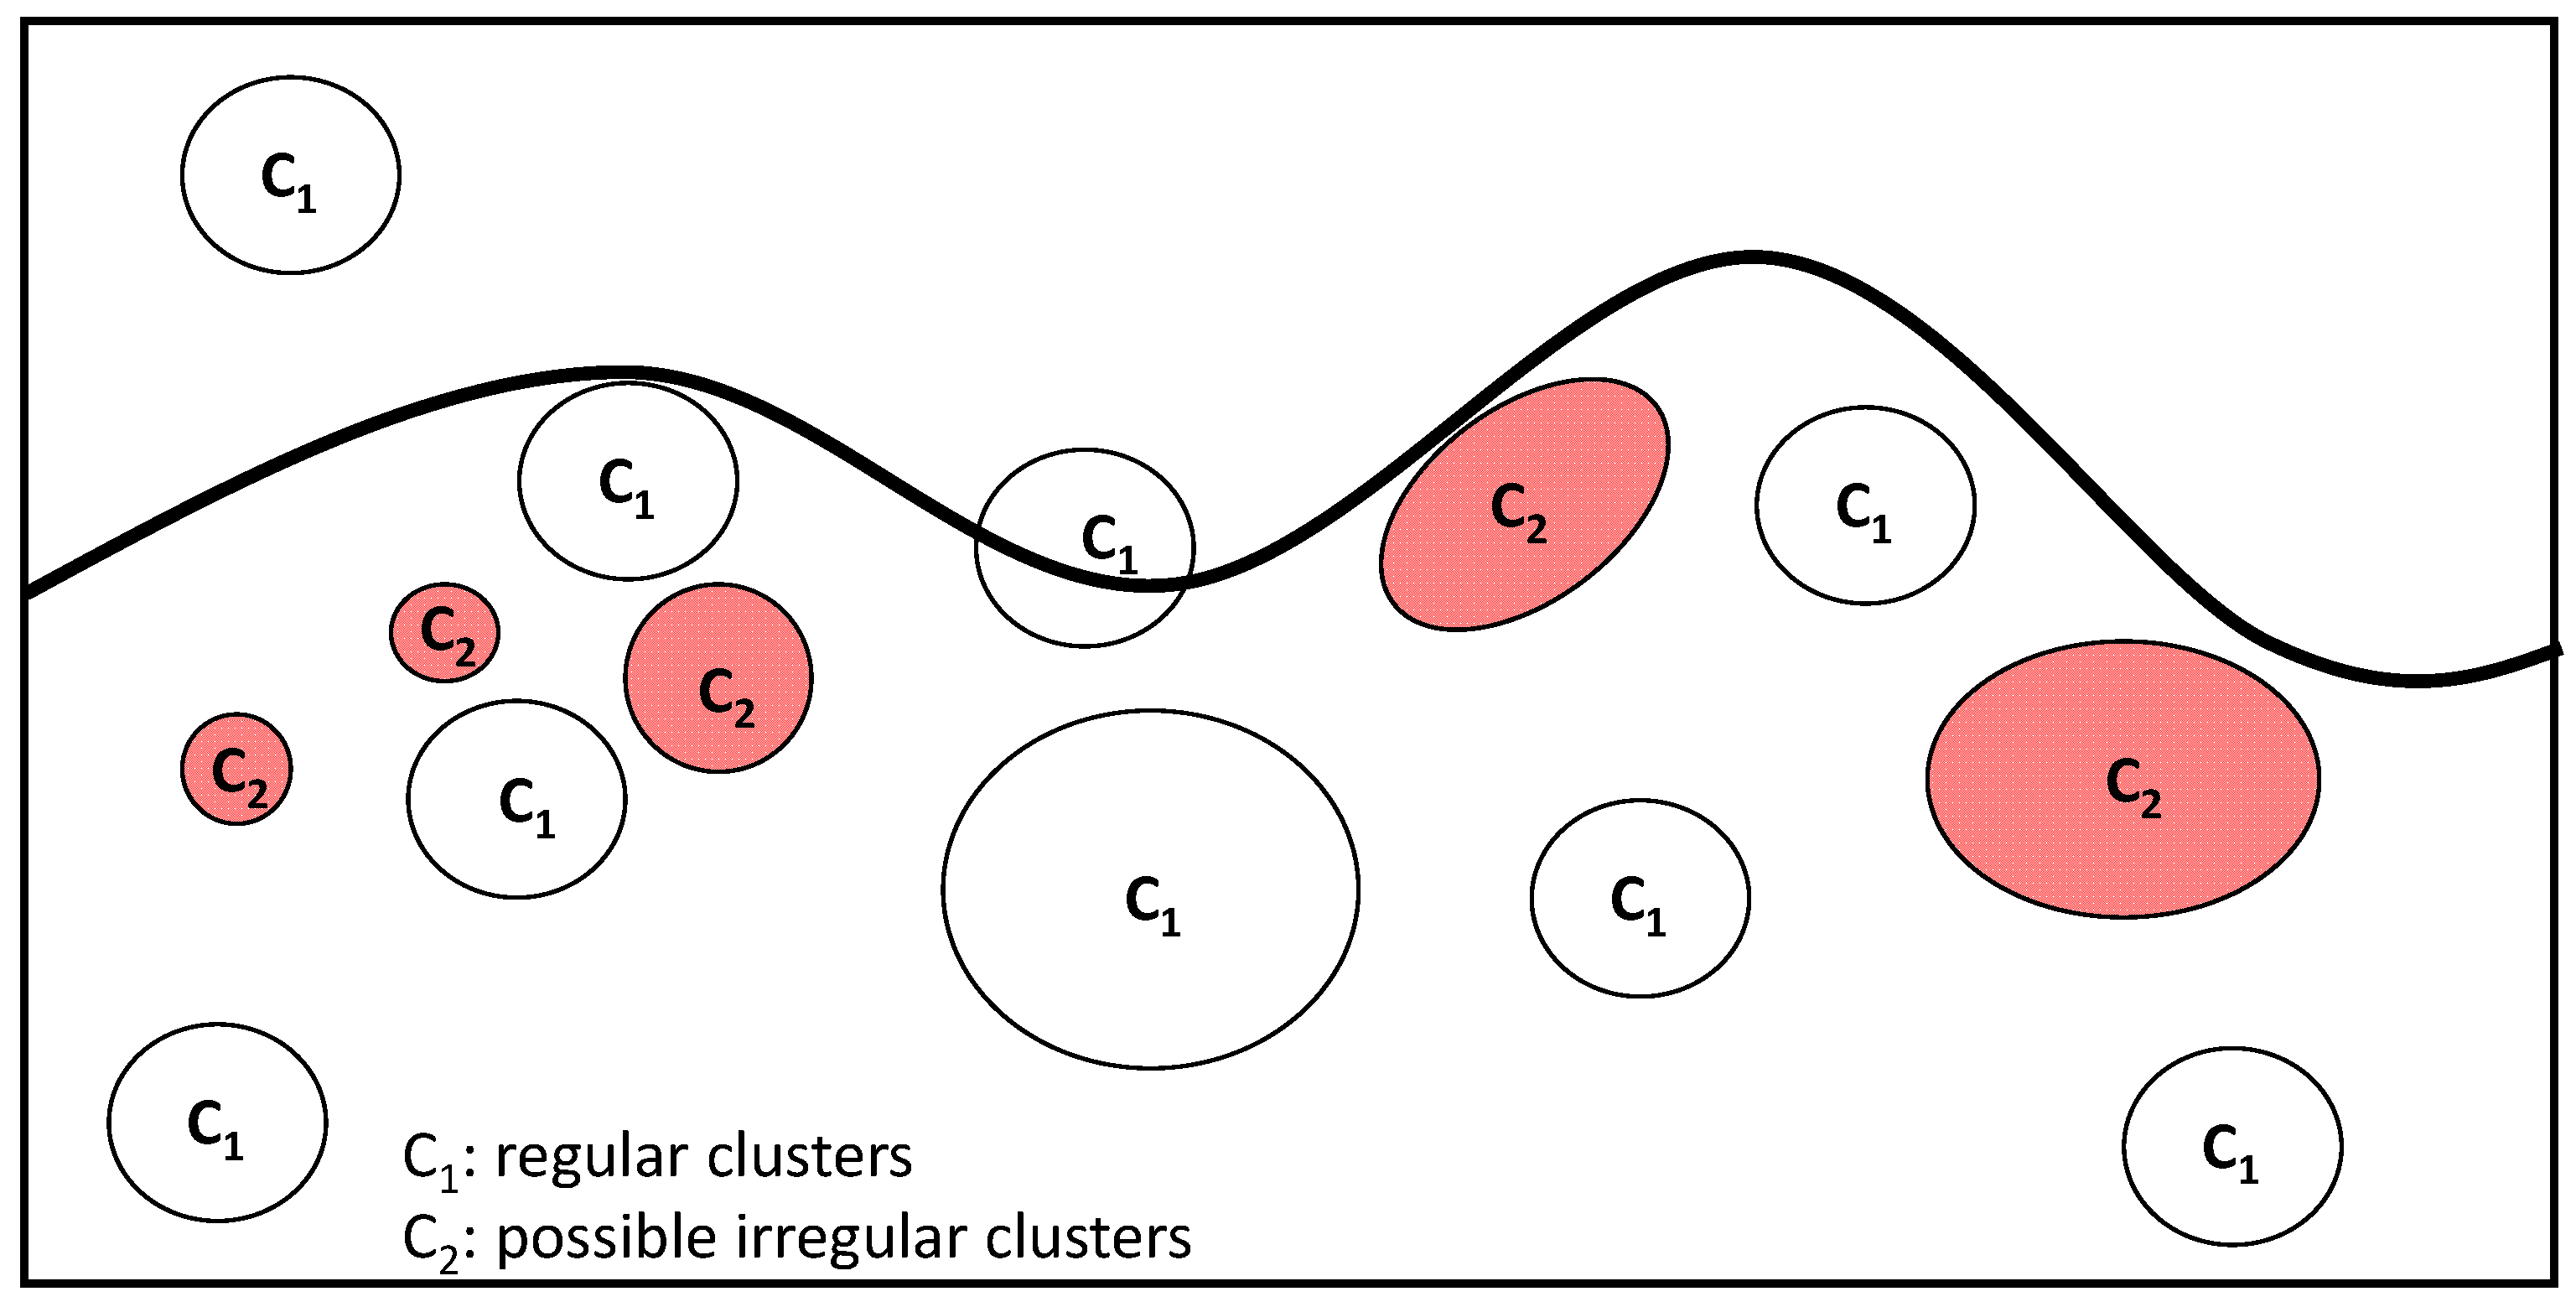
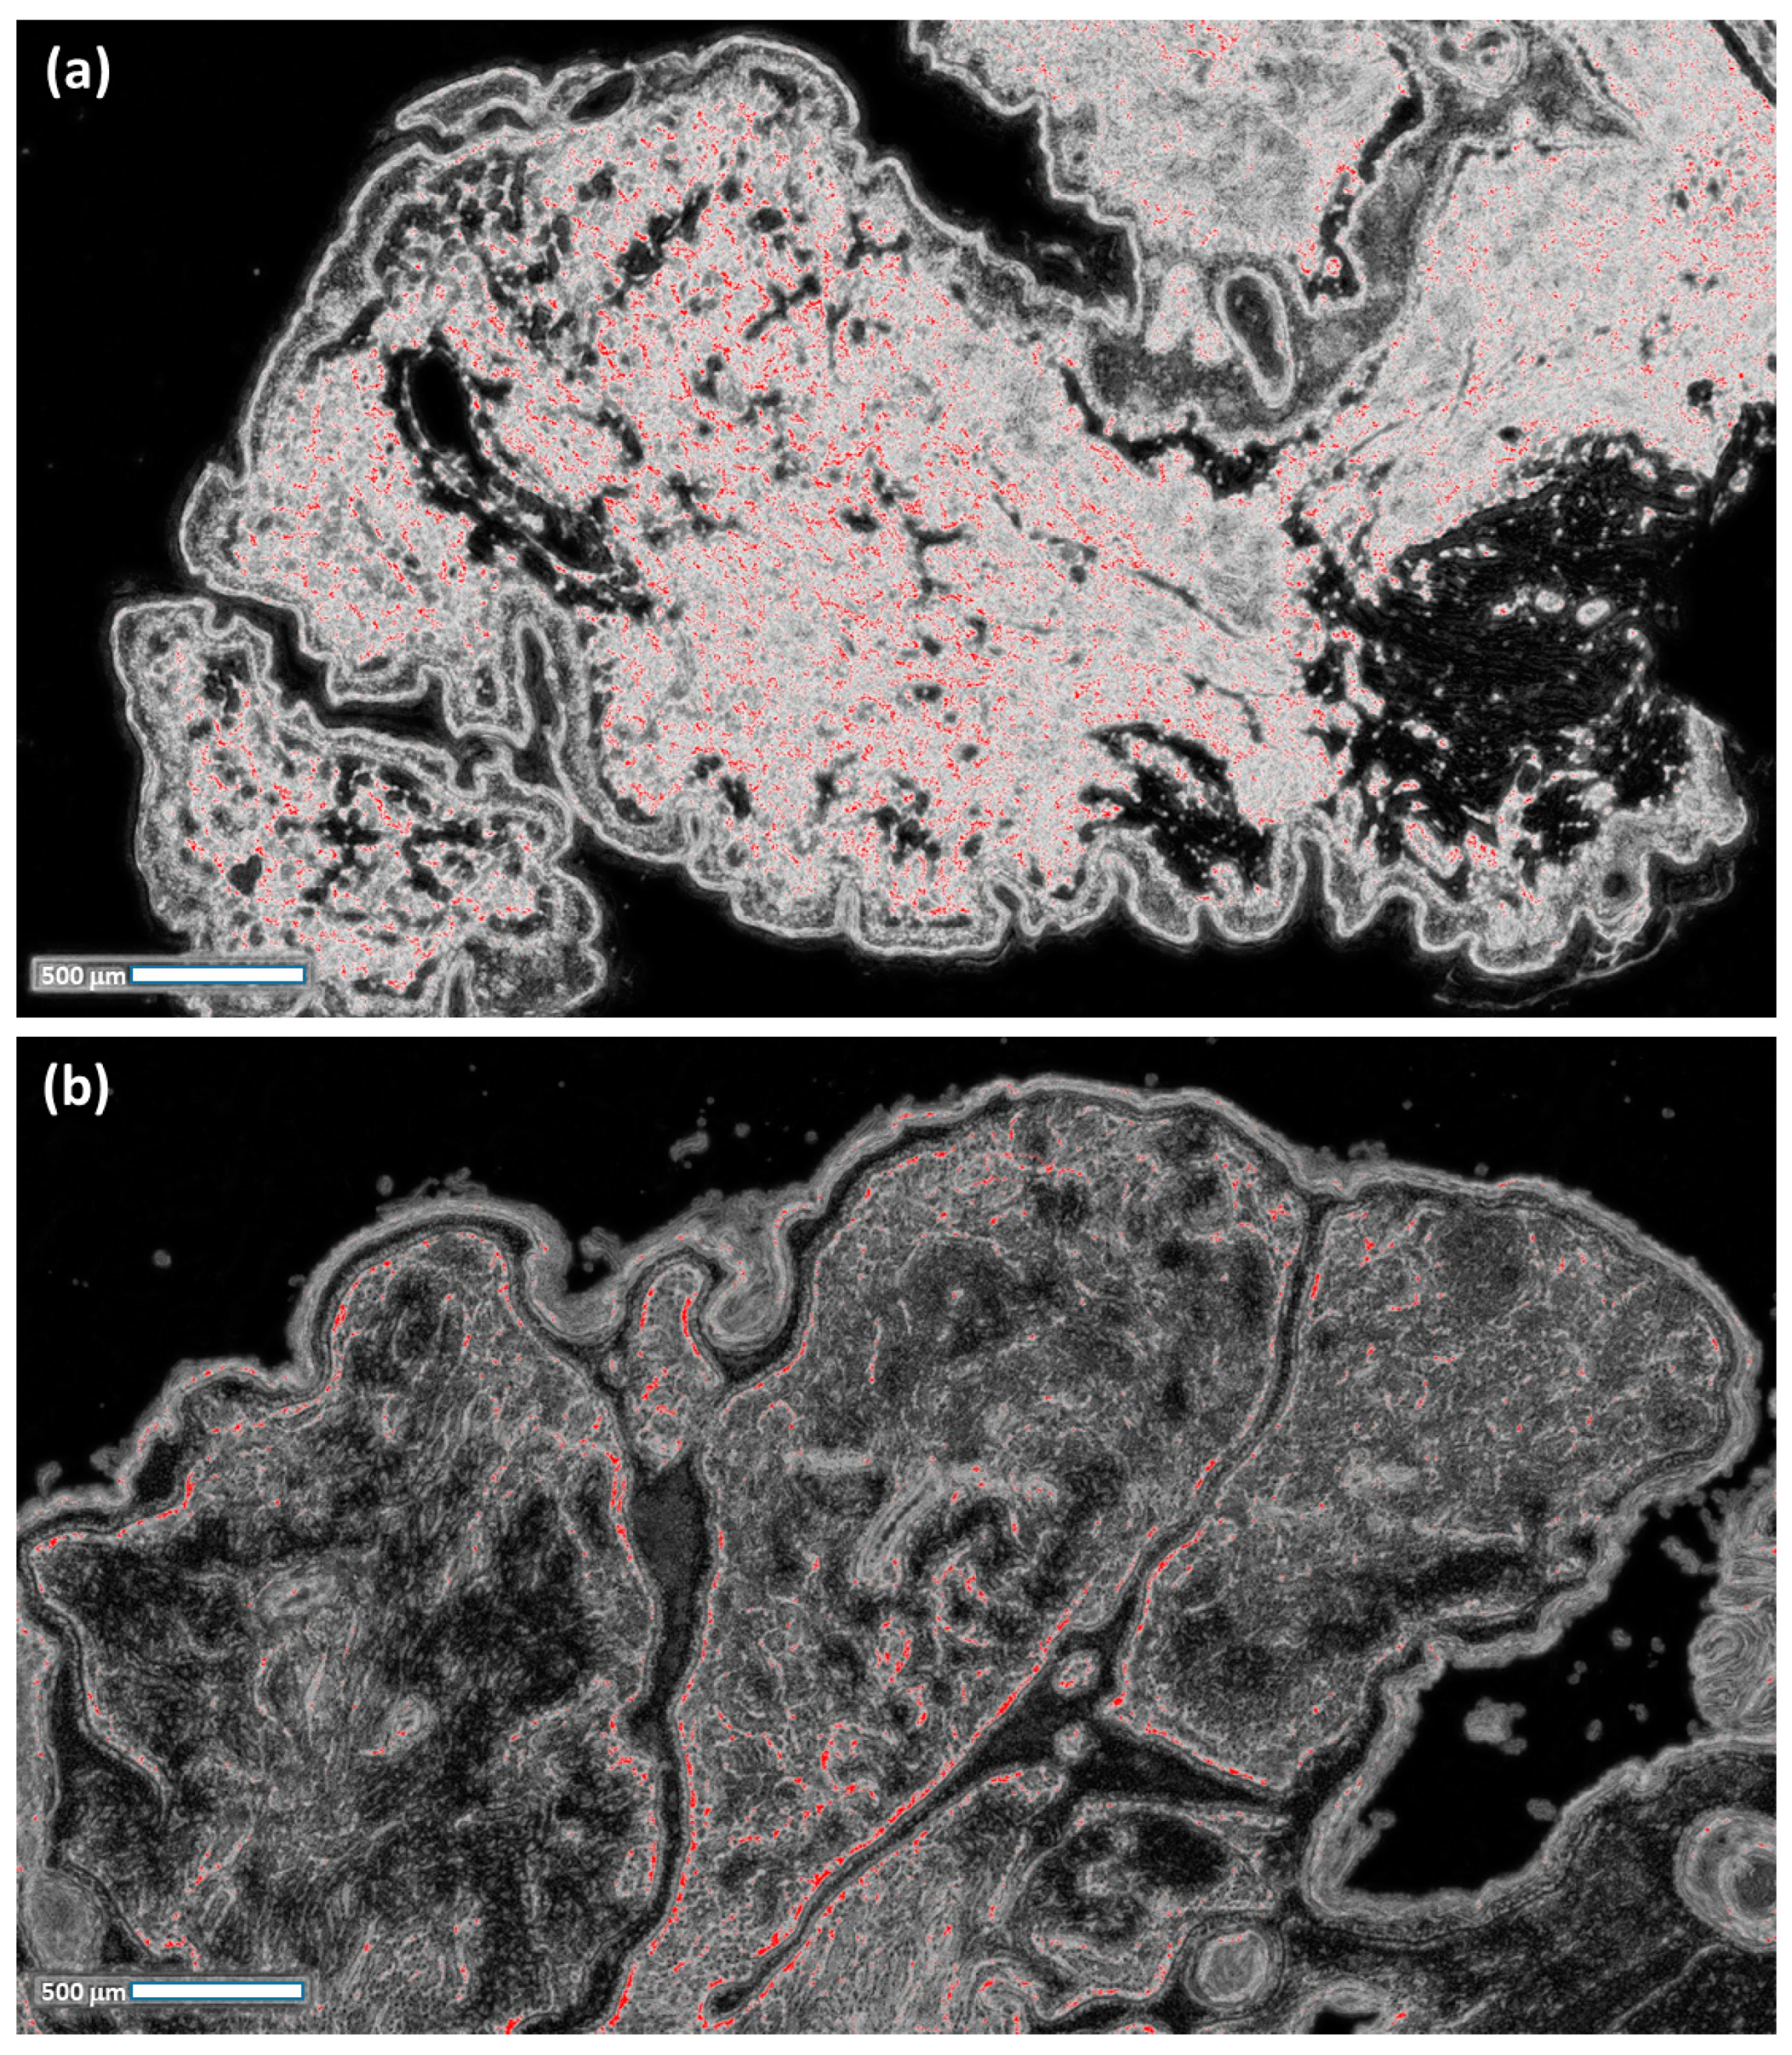
- The probabilistic images of both the classes C1 and C2 are extracted;
- -
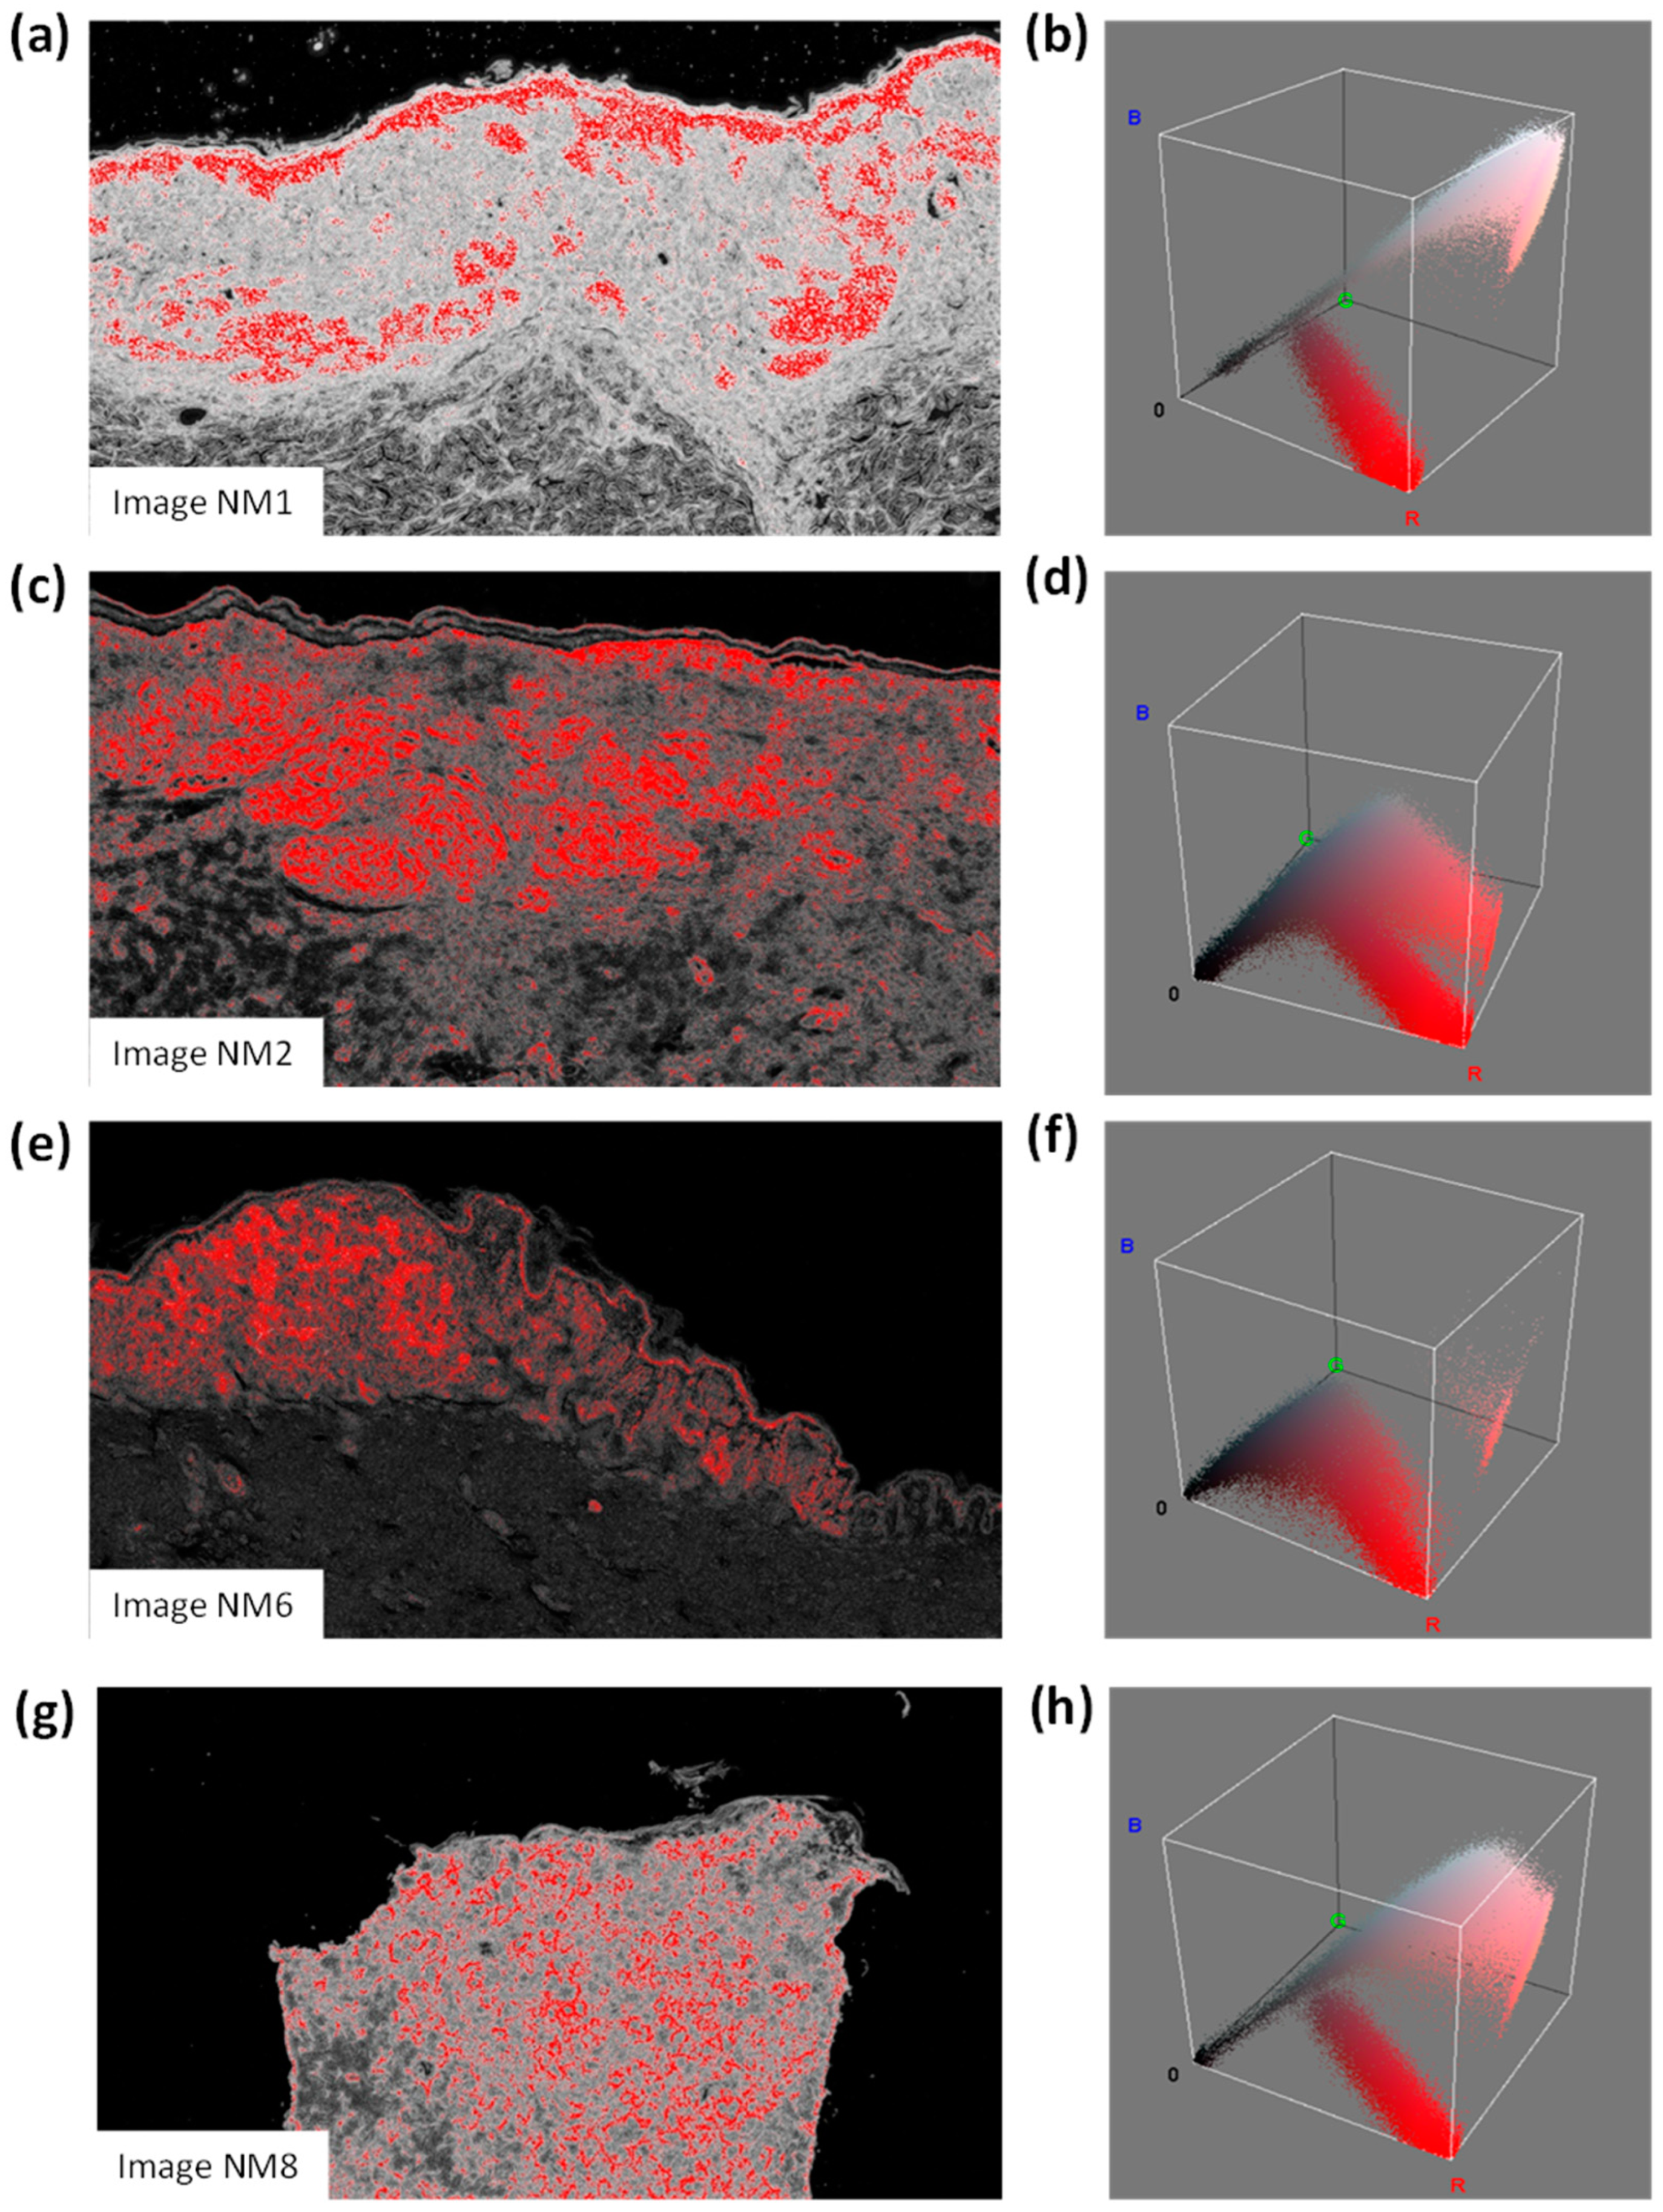
- For each probabilistic C2 image, a filter enhancing the pixels with the highest values in red is applied by considering a red threshold of about 0.38 and a dark background;
- -
- The RGB distributions of the filtered images, counting only the red pixels (which have higher probabilities of classifying NM), are plotted.
- For each image, the number of pixels constituting the scale bar line (each image indicates a scale bar of 500 microns) is counted;
- The length and the height of each image are estimated in microns;
- The total area of each image is estimated in pixels2;
- The total area of each image is estimated in microns2;
- The red pixels of the processed images (indicating a high probability of NM) are counted;
- The equivalent area of the red pixels is estimated and expressed in microns2;
- The same area of the red pixels is expressed in mm2;
- The percentage value (the ratio between the total image area in mm2 and the equivalent area of the red pixels in mm2) is expressed.
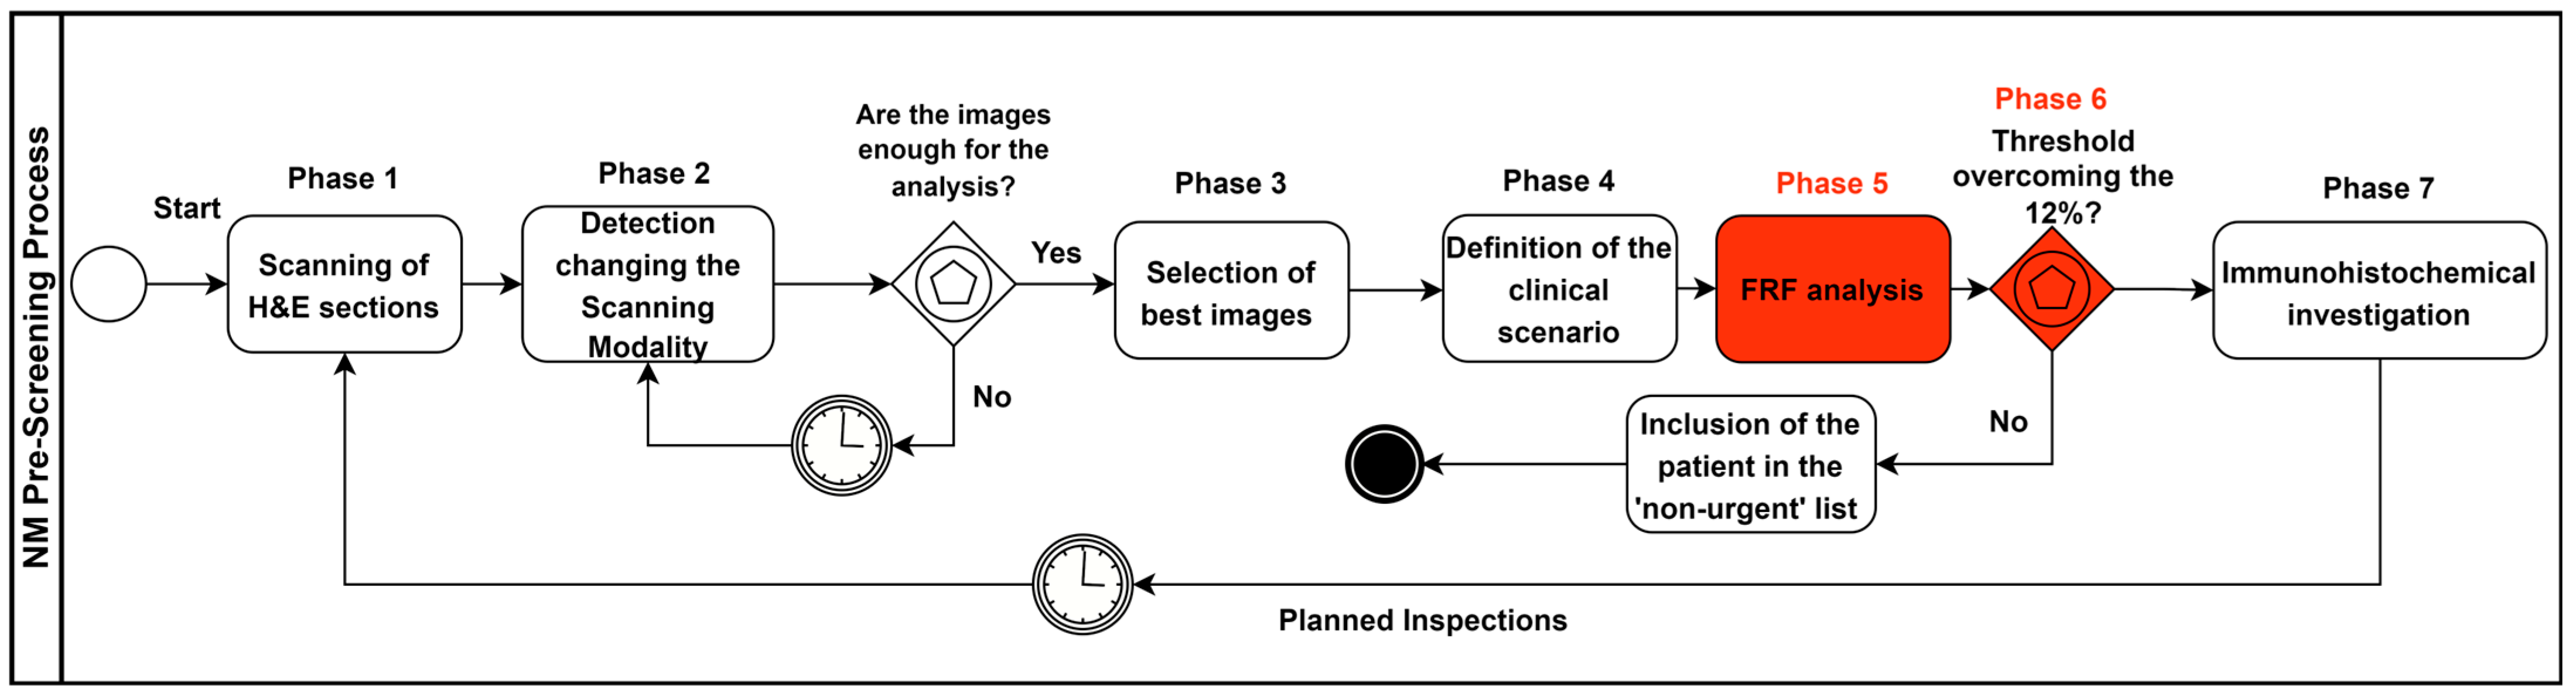
2.3. Pre-Screening Clinical Process Modelling
- Sections stained in haematoxylin and eosin (H&E) are digitally acquired by a scanner;
- Different scanning modalities are tested to determine the best screening approach for monitoring different areas (for example, scanning in 20× and 40× mode (15 mm × 15 mm), 0.46 μm/pixel (20×) 0.23 μm/pixel resolution (40×); 20×: 1 mm scale bar; 40×: 500 micron scale bar);
- The most significant slide from a single patient containing more diagnostic features (more significant images) is chosen;
- Supervising the lesion and analysing the main characteristics to define the main clinical scenario, using the 2×–4× analysis as a “first look” to evaluate the more general characteristics of the lesion;
- Conducting an FRF analysis of the selected digital slides (pre-screening);
- Carrying out an FRF threshold check (image post-processing): if the 12% threshold is exceeded, the “suspected” case is looked at first and then the remaining cases are analysed (patient priority in the analysis approach); the threshold value can be changed in the function of the image filtering threshold and by assessing the real evolution of the NM in the future;
- Once the suspected case of NM has been analysed, immunohistochemical investigations are carried out for Melan-A, HMB-45, p16 and PRAME.
3. Results
4. Discussion
- The total image area (mm2): this indicator provides a reference for the related percentage of the anomalous clusters of the dimension of a specific area according to the image scale (this percentage will increase for a wider image);
- The number of red pixels: the possibly anomalous pixels contained in the image, which represent a primary quantification of the ”risk distribution”;
- Equivalent area (mm2): the red pixels are merged to estimate an equivalent area which is useful in defining the final percentage value via losing the information associated with the spatial distribution;
- Equivalent area (%): the final indicator defining the threshold of risk for the pre-screening analysis; the threshold could change after changing the FRF algorithm parameters (a change in the parameters could increase or decrease the number of red pixels, thus changing the threshold value, which is set to 12 % according to the clinical point of view).
5. Conclusions
Author Contributions
Funding
Institutional Review Board Statement
Informed Consent Statement
Data Availability Statement
Acknowledgments
Conflicts of Interest
Appendix A

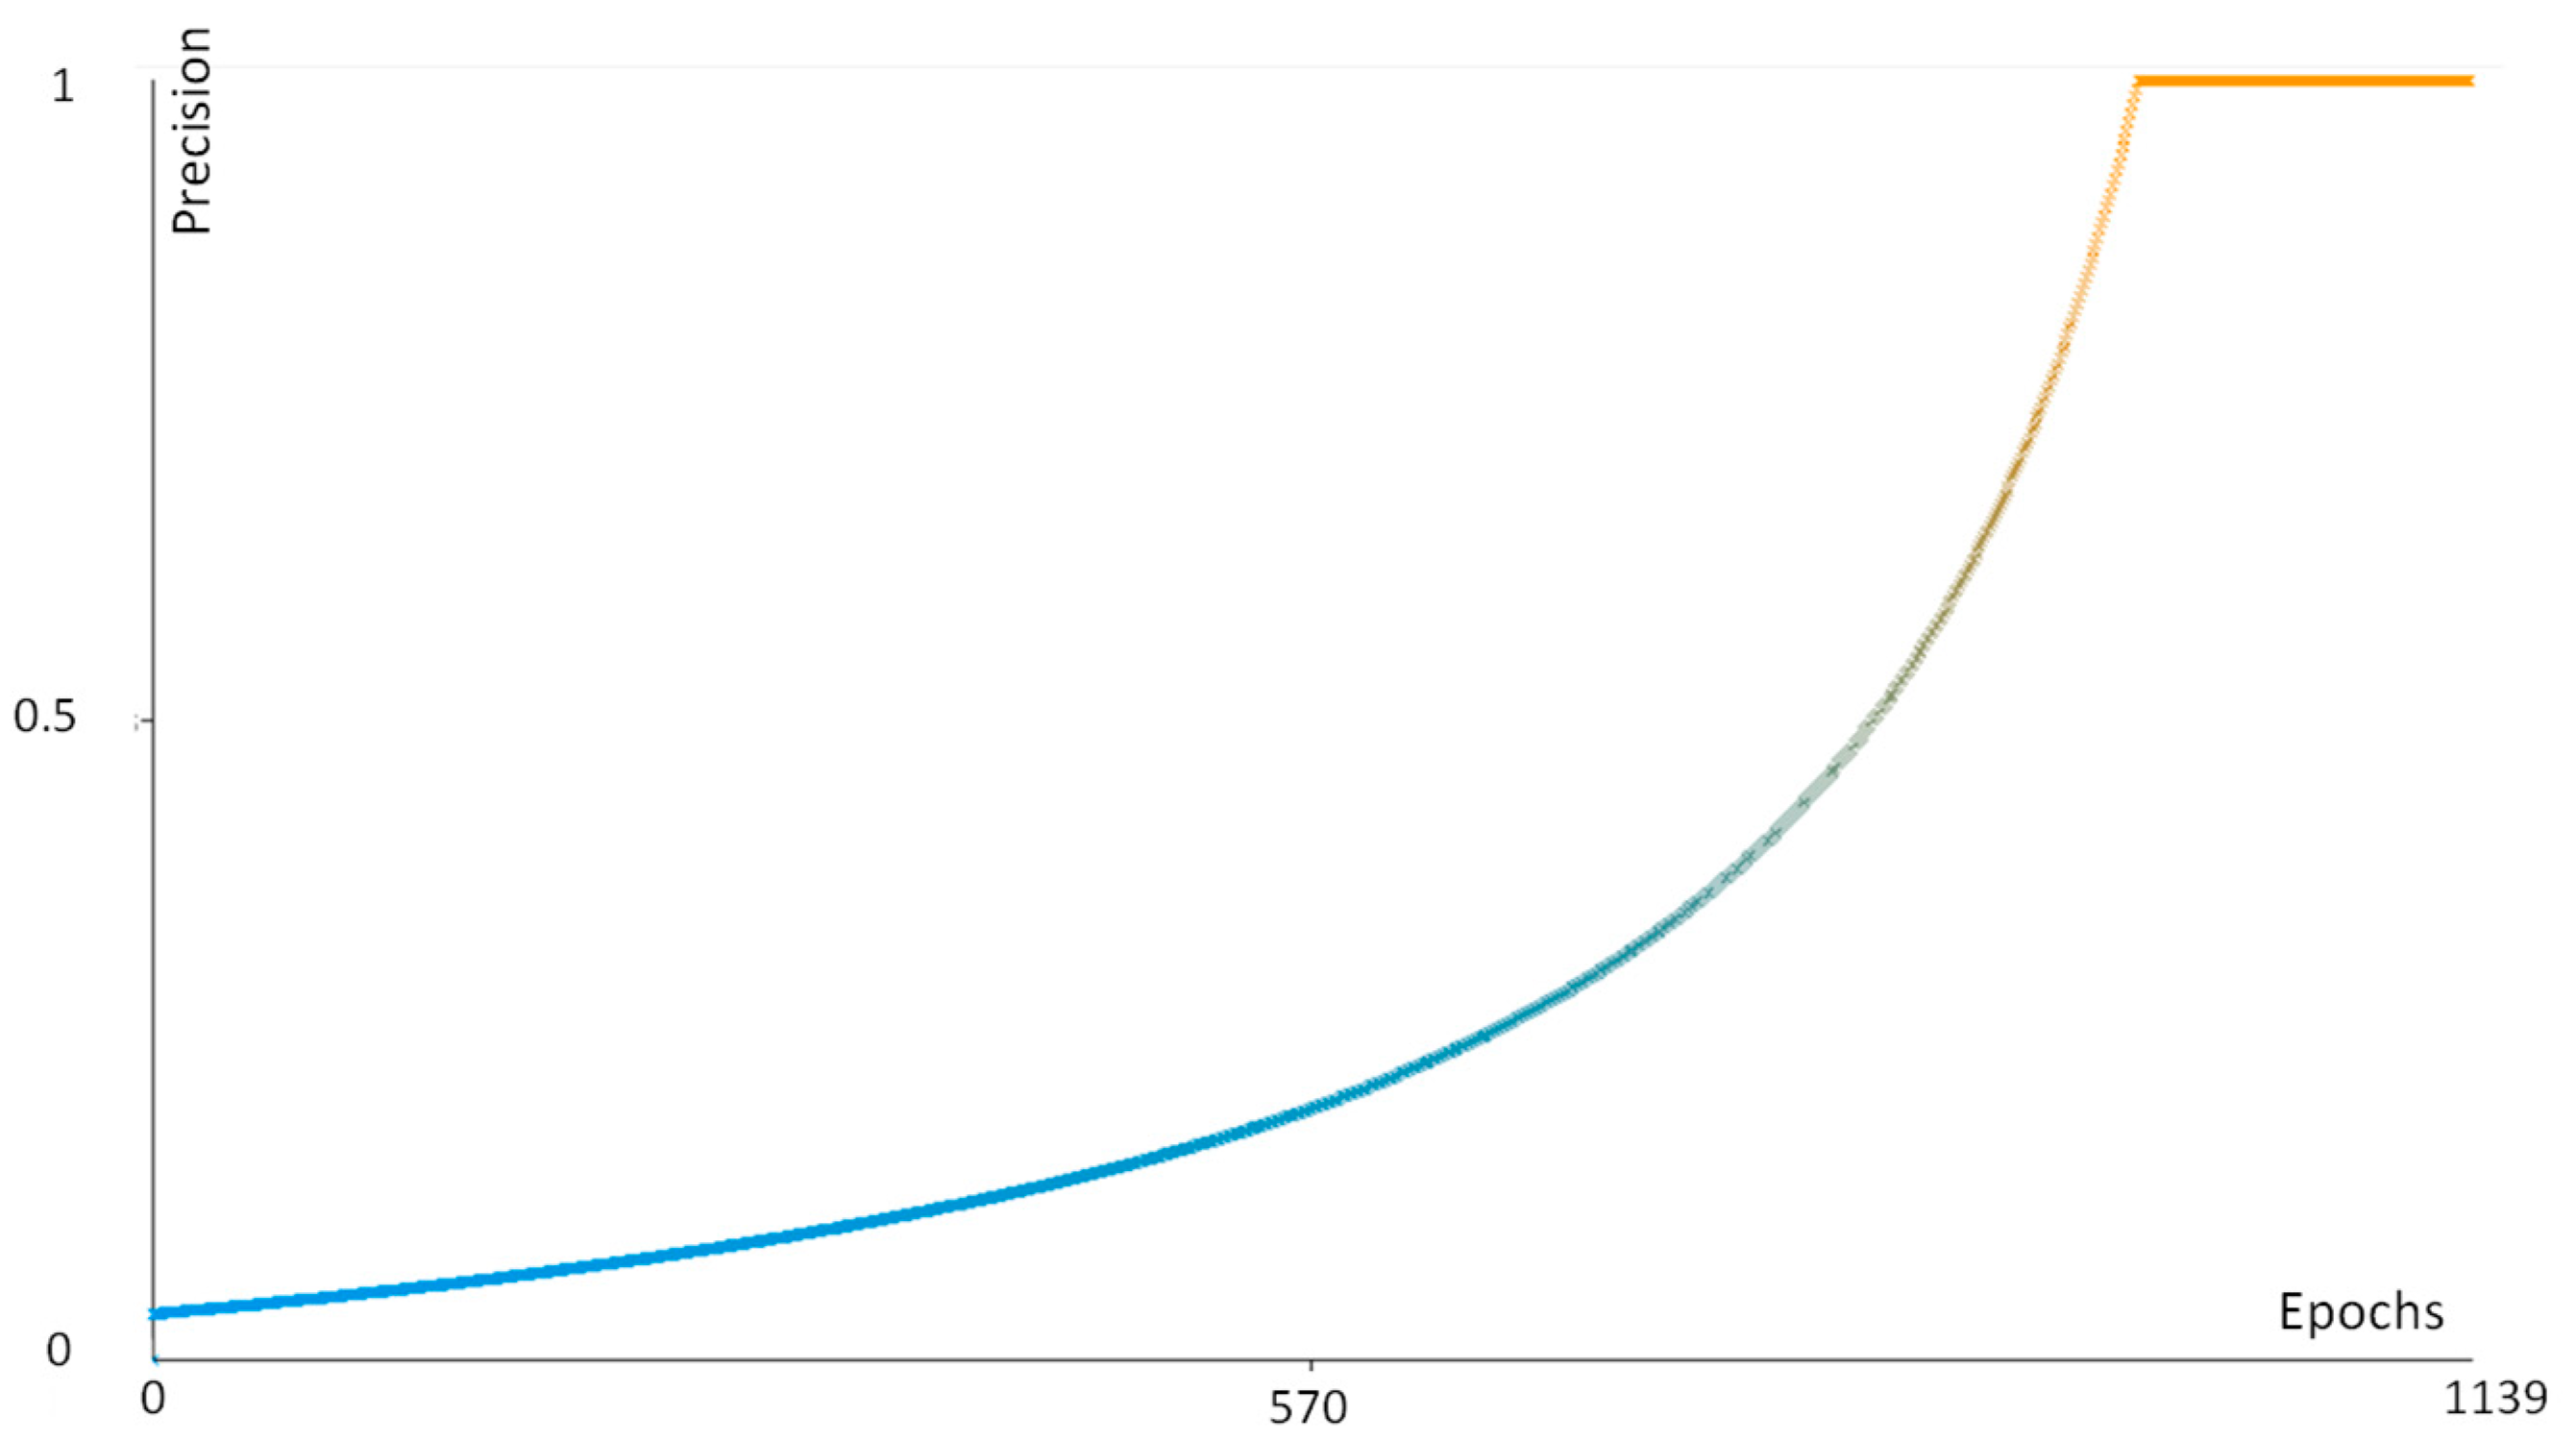
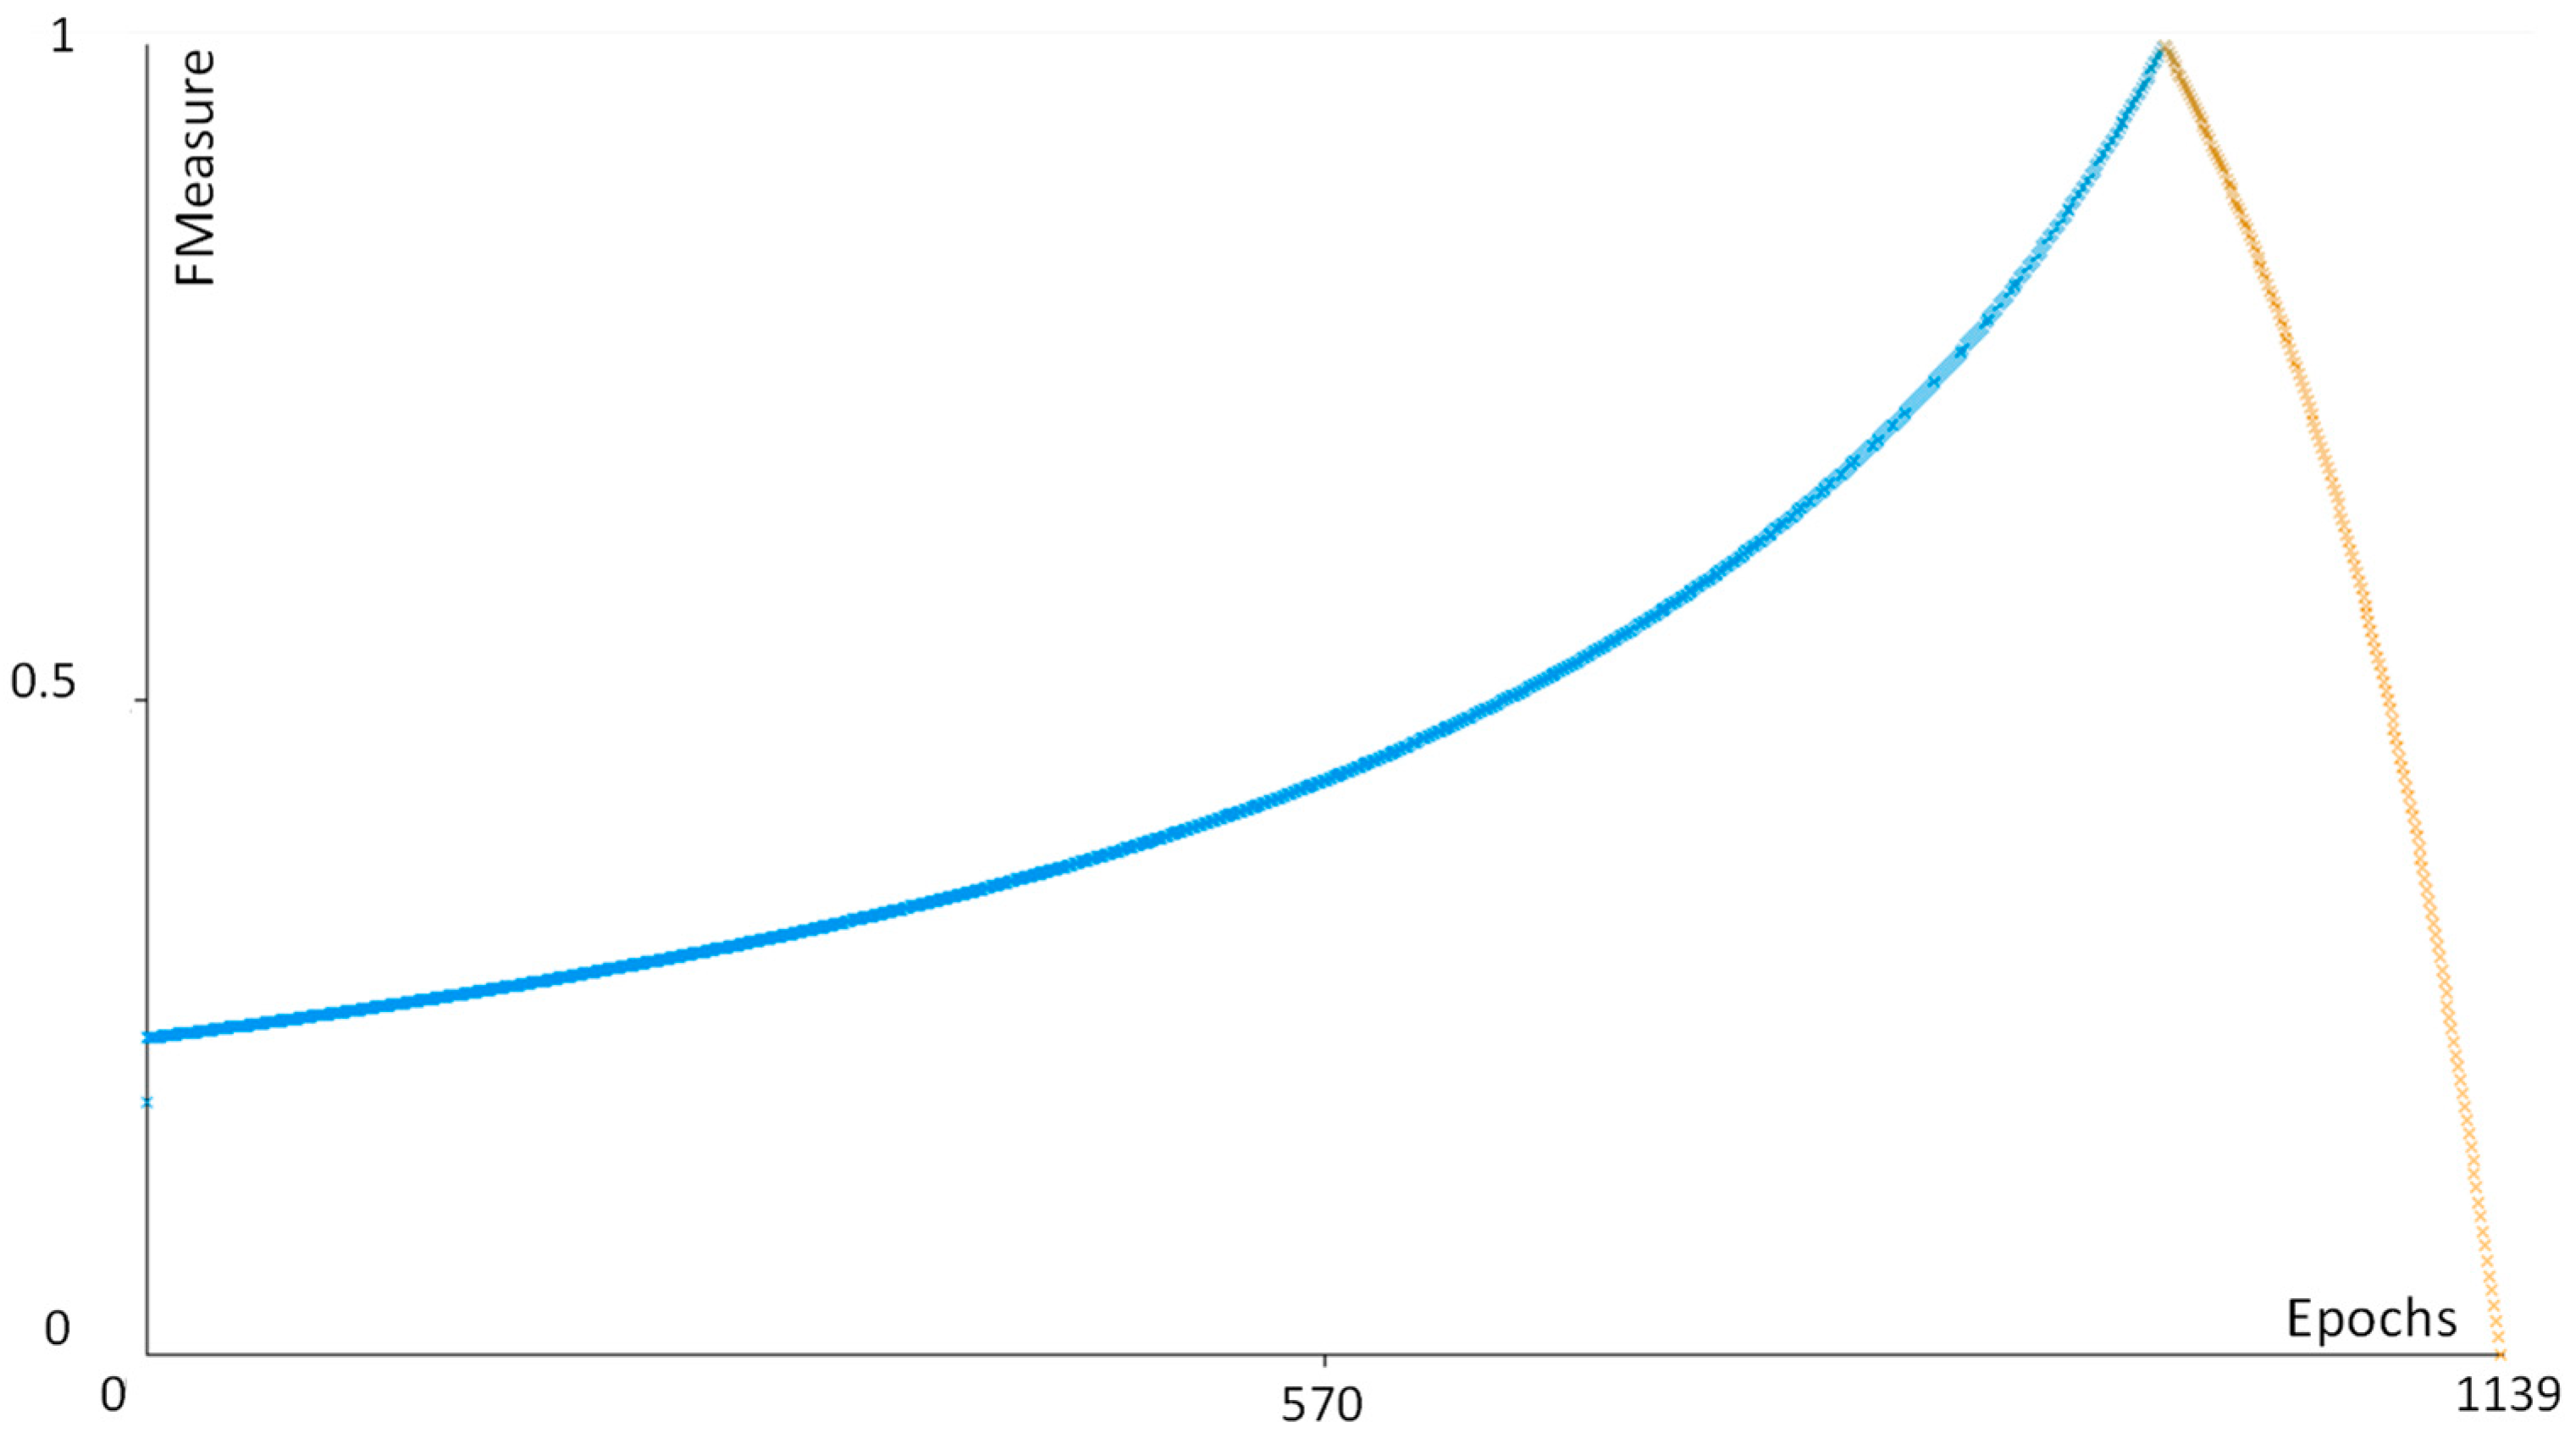
| Performance Parameter | Function |
|---|---|
| Precision | TP/(TP + FN) |
| Recall | TP/(TP + FP) |
| FMeasure | 2TP/(2TP + FP + FN) |

References
- Cazzato, G.; Colagrande, A.; Cimmino, A.; Demarco, A.; Lospalluti, L.; Arezzo, F.; Resta, L.; Ingravallo, G. The Great Mime: Three Cases of Melanoma with Carcinoid-Like and Paraganglioma-Like Pattern with Emphasis on Differential Diagnosis. Dermatopathology 2021, 8, 130–134. [Google Scholar] [CrossRef] [PubMed]
- Saliba, E.; Bhawan, J. Aberrant Expression of Immunohistochemical Markers in Malignant Melanoma: A Review. Dermatopathology 2021, 8, 359–370. [Google Scholar] [CrossRef] [PubMed]
- Diwan, A.H.; Lazar, A.J. Nevoid melanoma. Clin. Lab. Med. 2011, 31, 243–253. [Google Scholar] [CrossRef] [PubMed]
- Levene, A. On the histological diagnosis and prognosis of malignant melanoma. J. Clin. Pathol. 1980, 33, 101–124. [Google Scholar] [CrossRef]
- Schmoeckel, C.; Castro, C.E.; Braun-Falco, O. Nevoid malignant melanoma. Arch. Dermatol. Res. 1985, 277, 362–369. [Google Scholar] [CrossRef]
- Blessing, K.; Evans, A.T.; Al-Nafussi, A. Verrucous nevoid and keratotic malignant melanoma: A clinicopathological study of 20 cases. Histopathology 1995, 23, 453–458. [Google Scholar] [CrossRef] [PubMed]
- Zembowicz, A.; McCusker, M.; Chiarelli, C.; Dei Tos, A.P.; Granter, S.R.; Calonje, E.; McKee, P.H. Morphological analysis of nevoid melanoma: A study of 20 cases with a review of the literature. Am. J. Dermatopathol. 2001, 23, 167–175. [Google Scholar] [CrossRef]
- Diwan, A.H.; Lazar, A.J. Nevoid Melanoma. Surg. Pathol. Clin. 2009, 2, 521–533. [Google Scholar] [CrossRef] [PubMed]
- Cook, M.G.; Massi, D.; Blokx, W.A.M.; Van den Oord, J.; Koljenović, S.; De Giorgi, V.; Kissin, E.; Grant, M.; Mandal, A.; Gremel, G.; et al. New insights into naevoid melanomas: A clinicopathological reassessment. Histopathology 2017, 71, 943–950. [Google Scholar] [CrossRef] [Green Version]
- Nayarisseri, A.; Khandelwal, R.; Tanwar, P.; Madhavi, M.; Sharma, D.; Thakur, G.; Speck-Planche, A.; Singh, S.K. Artificial Intelligence, Big Data and Machine Learning Approaches in Precision Medicine & Drug Discovery. Curr. Drug. Targets 2021, 22, 631–655. [Google Scholar] [CrossRef]
- Cazzato, G.; Colagrande, A.; Cimmino, A.; Arezzo, F.; Loizzi, V.; Caporusso, C.; Marangio, M.; Foti, C.; Romita, P.; Lospalluti, L.; et al. Artificial Intelligence in Dermatopathology: New Insights and Perspectives. Dermatopathology 2021, 8, 418–425. [Google Scholar] [CrossRef]
- Harrison, J.H.; Gilbertson, J.R.; Hanna, M.G.; Olson, N.H.; Seheult, J.N.; Sorace, J.M.; Stram, M.N. Introduction to Artificial Intelligence and Machine Learning for Pathology. Arch. Pathol. Lab. Med. 2021, 145, 1228–1254. [Google Scholar] [CrossRef]
- Cazzato, G.; Massaro, A.; Colagrande, A.; Lettini, T.; Cicco, S.; Parente, P.; Nacchiero, E.; Lospalluti, L.; Cascardi, E.; Giudice, G.; et al. Dermatopathology of Malignant Melanoma in the Era of Artificial Intelligence: A Single Institutional Experience. Diagnostics. 2022, 12, 1972. [Google Scholar] [CrossRef]
- Alessandro, M. Detection of Anomalies in Images by Machine Learning Fast Random Forest—FRF-Algorithm; Zenodo: Geneva, Switzerland, 2022. [Google Scholar]
- Massaro, A. Image Vision Advances. In Electronics in Advanced Research Industries; Wiley: Hoboken, NJ, USA, 2021; pp. 301–340. [Google Scholar] [CrossRef]
- Massaro, A. Information Technology Infrastructures Supporting Industry 5.0 Facilities. In Electronics in Advanced Research Industries; Wiley: Hoboken, NJ, USA, 2021; pp. 51–101. [Google Scholar] [CrossRef]
- Massaro, A. Advanced Electronic and Optoelectronic Sensors, Applications, Modelling and Industry 5.0 Perspectives. Appl. Sci. 2023, 13, 4582. [Google Scholar] [CrossRef]
- Rosa, A.; Massaro, A.; McDermott, O. Process Mining Applied to Lean Management Model Improving Decision Making in Healthcare Organizations. In Proceedings of the 18th International Forum on Knowledge Asset Dynamics, Matera, Italy, 7–9 June 2023; pp. 222–231, ISBN 978-88-96687-16-1. [Google Scholar]
- Massaro, A. Creation of The Image Training Model in Supervised Fast Random Forest–FRF–Algorithm; Zenodo: Geneva, Switzerland, 2023. [Google Scholar] [CrossRef]
- Patterson, J.W. Weedon’s Skin Pathology, 5th ed.; Elsevier: Amsterdam, The Netherlands, 2019. [Google Scholar]
- Kossard, S.; Wilkinson, B. Small cell (naevoid) melanoma: A clinicopathologic study of 131 cases. Australas. J. Dermatol. 1997, 38 (Suppl. 1), S54–S58. [Google Scholar] [CrossRef]
- Wells, A.; Patel, S.; Lee, J.B.; Motaparthi, K. Artificial intelligence in dermatopathology: Diagnosis, education, and research. J. Cutan. Pathol. 2021, 48, 1061–1068. [Google Scholar] [CrossRef]
- Chen, S.B.; Novoa, R.A. Artificial intelligence for dermatopathology: Current trends and the road ahead. Semin. Diagn. Pathol. 2022, 39, 298–304. [Google Scholar] [CrossRef]
- Polesie, S.; McKee, P.H.; Gardner, J.M.; Gillstedt, M.; Siarov, J.; Neittaanmäki, N.; Paoli, J. Attitudes Toward Artificial Intelligence Within Dermatopathology: An International Online Survey. Front. Med. 2020, 7, 591952. [Google Scholar] [CrossRef]
- Ibraheim, M.K.; Gupta, R.; Gardner, J.M.; Elsensohn, A. Artificial Intelligence in Dermatopathology: An Analysis of Its Practical Application. Dermatopathology 2023, 10, 93–94. [Google Scholar] [CrossRef]
| Architectural Criteria | Cytological Criteria |
|---|---|
| Verrucous/warty lesion Dome-shaped lesion | Small, epithelioid, monomorphous cells |
| Asymmetry Poor circumscription | Round/oval nuclei; small, eosinophilic nucleoli |
| Possible junctional component | Lack of maturation |
| Nested growth pattern | Mitoses (in deep) |
| Variation in nest sizes | Pleomorphism |
| Number of Patient | Gender | Age | Topography | Breslow Thickness (mm) | Immunohistochemical Investigations |
|---|---|---|---|---|---|
| 1 | M | 74 | Back | 0.6 | Melan-A +−-/HMB-45- |
| 2 | M | 56 | Left shoulder | 1.3 | Melan-A +−-/HMB-45- |
| 3 | M | 62 | Left leg | 2 | Melan-A +−-/HMB-45- |
| 4 5 | M F | 83 47 | Right chest Left leg | 1.0 3.0 | Melan-A +−-/HMB-45- Melan-A +−-/HMB-45- |
| 6 | M | 43 | Back | 0.8 | Melan-A -/HMB-45- |
| 7 | F | 46 | Back | 5 | Melan-A +−-/HMB-45- |
| 8 | M | 60 | Right axilla | 0.7 | Melan-A +−-/HMB-45- |
| 9 | F | 48 | Left flank | 1.1 | Melan-A-/HMB-45- |
| 10 | F | 83 | Left tibia | 0.8 | Melan-A ++-/HMB-45- |
| 11 | M | 49 | Back | 0.7 | Not reported |
| 12 | M | 39 | Abdomen | 0.8 | Not performed |
| 13 | M | 43 | Left arm | 1.0 | Melan-A +−-/HMB-45 +-- |
| 14 | M | 44 | Not reported | 1.2 | Not reported |
| 15 | M | 66 | Right scapula | 0.8 | Melan-A +−-/HMB-45- |
| 16 | F | 51 | Back | 0.7 | Not reported |
| 17 | F | 81 | Back | 0.9 | Melan-A ++-/HMB-45- |
| 18 | F | 91 | Left arm | 1.1 | Not reported |
| Classification | Approach Followed in [13] | Approach Followed in This Work |
|---|---|---|
| Number of classes defined in the same image | >2 | 2 (C1: regular clusters; C2: possible irregular clusters) |
| Identification of sure clusters with specified characteristics | Yes | No (the attention is focused on “possible” and uncertain clusters identifying the risk of naevoid melanoma) |
| Number of images adopted in the entire classification | 125 (images with melanoma) | 18 (pre-screening images) |
| Hyperparameter | Value |
|---|---|
| Filter types | Gaussian blur; Hessian; membrane projections; Sobel; difference of Gaussian |
| Membrane thickness | 1 |
| Membrane patch size | 19 |
| Minimum sigma | 1 |
| Maximum sigma | 16 |
| Total number of classes | 2 |
| Image (1920 × 1088 Pixels) | Total Image Area (mm2) | Number of Red Pixels | Equivalent Area (mm2) (Probable NM) |
|---|---|---|---|
| NM1 | 6.66122449 | 166,689 | 0.531533801 |
| NM2 | 13.056 | 110,438 | 0.6902375 |
| NM6 | 3.985226336 | 140,468 | 0.267978694 |
| NM8 | 3.398583923 | 105,898 | 0.172288239 |
Disclaimer/Publisher’s Note: The statements, opinions and data contained in all publications are solely those of the individual author(s) and contributor(s) and not of MDPI and/or the editor(s). MDPI and/or the editor(s) disclaim responsibility for any injury to people or property resulting from any ideas, methods, instructions or products referred to in the content. |
© 2023 by the authors. Licensee MDPI, Basel, Switzerland. This article is an open access article distributed under the terms and conditions of the Creative Commons Attribution (CC BY) license (https://creativecommons.org/licenses/by/4.0/).
Share and Cite
Cazzato, G.; Massaro, A.; Colagrande, A.; Trilli, I.; Ingravallo, G.; Casatta, N.; Lupo, C.; Ronchi, A.; Franco, R.; Maiorano, E.; et al. Artificial Intelligence Applied to a First Screening of Naevoid Melanoma: A New Use of Fast Random Forest Algorithm in Dermatopathology. Curr. Oncol. 2023, 30, 6066-6078. https://doi.org/10.3390/curroncol30070452
Cazzato G, Massaro A, Colagrande A, Trilli I, Ingravallo G, Casatta N, Lupo C, Ronchi A, Franco R, Maiorano E, et al. Artificial Intelligence Applied to a First Screening of Naevoid Melanoma: A New Use of Fast Random Forest Algorithm in Dermatopathology. Current Oncology. 2023; 30(7):6066-6078. https://doi.org/10.3390/curroncol30070452
Chicago/Turabian StyleCazzato, Gerardo, Alessandro Massaro, Anna Colagrande, Irma Trilli, Giuseppe Ingravallo, Nadia Casatta, Carmelo Lupo, Andrea Ronchi, Renato Franco, Eugenio Maiorano, and et al. 2023. "Artificial Intelligence Applied to a First Screening of Naevoid Melanoma: A New Use of Fast Random Forest Algorithm in Dermatopathology" Current Oncology 30, no. 7: 6066-6078. https://doi.org/10.3390/curroncol30070452