Financial Market Integration: Evidence from Cross-Listed French Firms

École Supérieur de Commerce Amiens, 18, Place Saint Michel, 80038 Amiens, France
J. Risk Financial Manag. 2017, 10(4), 18; https://doi.org/10.3390/jrfm10040018
Submission received: 21 August 2017
/
Revised: 27 September 2017
/
Accepted: 8 October 2017
/
Published: 12 October 2017
(This article belongs to the Section Financial Markets)
Abstract
:Using high frequency data we investigate the behavior of the intraday volatility and the volume of eight cross-listed French firms. There is a two hour “overlap” period during which French firms are traded in Paris and their related American Depositary Receipts (ADRs) are traded in New York. Using concurrent 15-min returns, this article examines the extent of market integration—defined as prices in both markets reflecting the same fundamental information—involving these firms. Our results suggest that these markets are not perfectly integrated. A significant rise in volatility and volume is observed during the two hour “overlap” period. This suggests the existence of informed trading. An error correction model (ECM) is then used to examine changes in prices of French firms in Paris and New York. These temporary changes appear to converge over time.
1. Introduction
The last several decades have witnessed a dramatic increase in the globalization of investment. Some reasons for this increase include the promise of higher rates of return and the opportunity to diversify risk internationally. Moreover, considerable progress has been made in integrating and deepening financial markets during the first decade of the 21st century. Empirical papers investigating stock market integration have analyzed the degree of integration from various angles.1 One aspect of the literature investigates equity market integration using high frequency data (see e.g., (Hasbrouck 1995; Werner and Kleidon 1996; Melvin and Lowengrub 2002; Hupperets and Menkveld 2002)). These authors tested the hypothesis that the listing of a firm on a foreign exchange should have no effect on the price of the firm where the markets are perfectly integrated. In fact, the mechanism of adjustment should equalize the prices paid for the same firm on different exchanges. In other words, the same set of risky cash flows should be assigned the same value irrespective of the location of the trade. If not, then arbitrageurs should stand ready to close any “market gap” that exists between the prices on two different exchanges of a given firm.
In order to test this hypothesis, these studies are based on intraday observations described by patterns2 where price volatility on a single exchange is high within an hour or so after its opening, then falls during part of the trading day, and then slowly and gradually rises up until the closing bell. This price action can be seen in Figure 1.
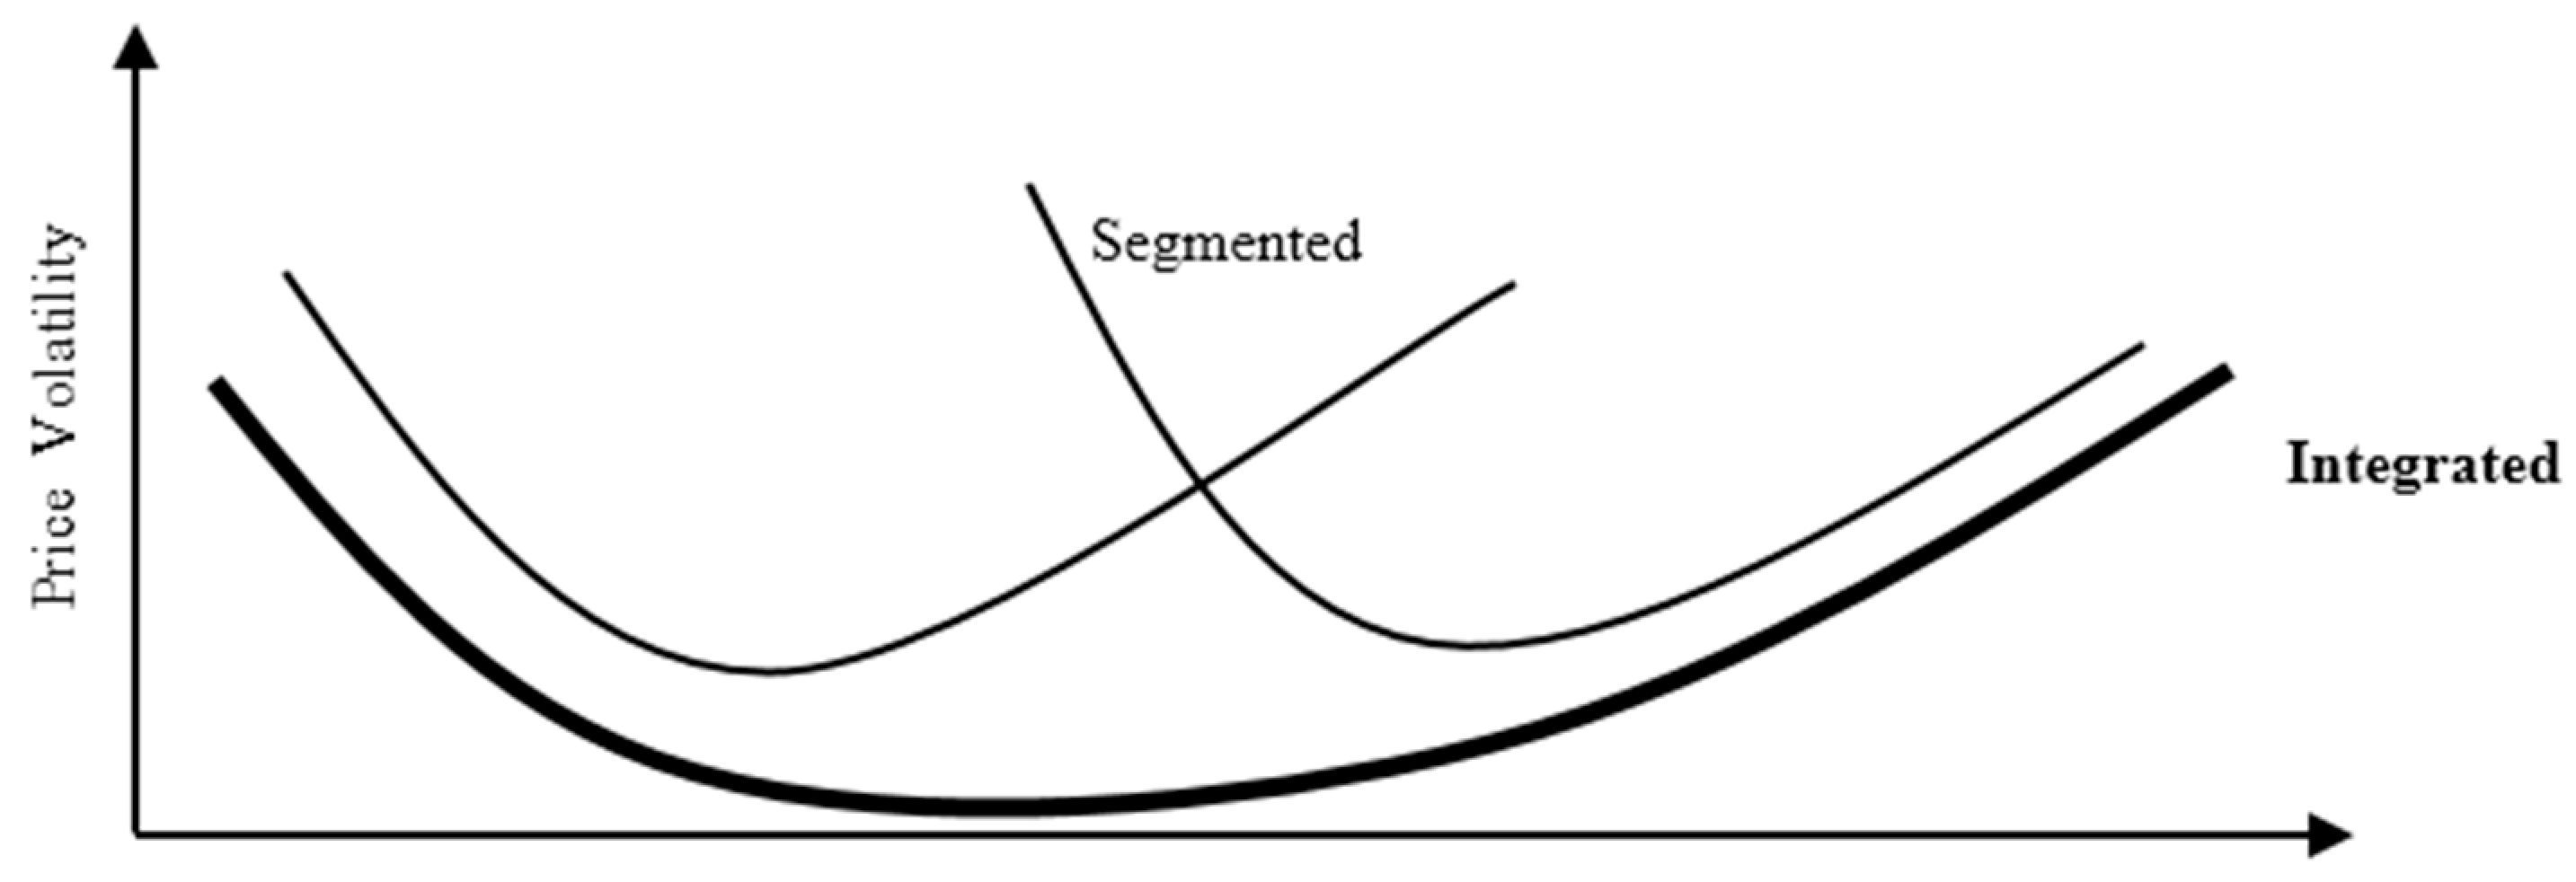
By analyzing the intraday patterns of UK stocks cross-listed on the US market. (Werner and Kleidon 1996) concluded that these markets are segmented (non-integrated). Inspired by this idea, (Melvin and Lowengrub 2002) examined the evidence of the effect of ADRs3 on German home market stock volatility and volume over the trading day. This study concluded that “the data is consistent with an integrated global trading environment rather than two segmented markets”. Thus, where two markets are perfectly integrated, the intraday pattern of volatility and volume on both combined markets should resemble the U-shape documented for single market (see Figure 2). (Hupperets and Menkveld 2002) examined Dutch firms cross-listed in the US market. Their findings suggest that price discovery depends on the origin of information. Accordingly, the adjustment rate is substantially higher for a foreign market (US) in an earlier time zone that is responding to the domestic market (Dutch) in a later time zone.
In this article, we assess the degree of market integration for eight widely-held and actively traded French companies whose stocks trade on EURONEXT4 and are cross-listed as American Depositary Receipts (ADRs) on the New York Stock Exchange (NYSE). We analyze the intraday trading patterns of these stocks and ADRs by using a data set during a period known for relative market stability. For the purposes of this article, we use the period from 3 January through 30 December of the year 2005. Using high frequency data allows us to analyze the volatility and volume of stocks and ADRs gradually over time for simultaneously quoted assets. This article makes the following contribution to the literature. To our knowledge, this is the first study of intraday trading in more than one market involving French cross-listed firms. The findings of this article expand upon previous studies in this area.
This article proceeds as follows: Section 2 presents the data; Section 3 describes the methodology for analyzing intraday volatility and volume on both the EURONEXT and NYSE markets; Section 4 introduces the Flexible Fourier Form (FFF) model to estimate intraday trading patterns; Section 5 examines the results of this methodology; Section 6 tests the hypothesis of market integration by focusing on price discovery during the overlap time and by reporting empirical results; Section 7 sets forth some implications for future research; and, Section 8 consists of concluding remarks.
2. Data
For our data, we use price and volume quotes for eight widely-held and actively traded French firms cross-listed on both the EURONEXT and New York stock exchanges. These quotes are taken at 15-min intervals during the 2-h window of each trading day in which such cross-listed trading occurs. We examine one year of intraday data5 from 3 January 2005 through 30 December 2005. The eight French companies6 we used for our data are sometimes described as blue chips7. They are diverse in terms of both industry and market capitalization, and consist of Air France KLM (AF), France Telecom (FTE), Alcatel (ALC), AXA, Sanofi (SAN), Veolia (VEO), Thomson (TMS), and Rhodia (RHD). For these stocks, continuously compounded returns are calculated as where and represent the price and the return, respectively, for firm i at day t and time n. Summary statistics for the eight French firms are presented in Table 1.
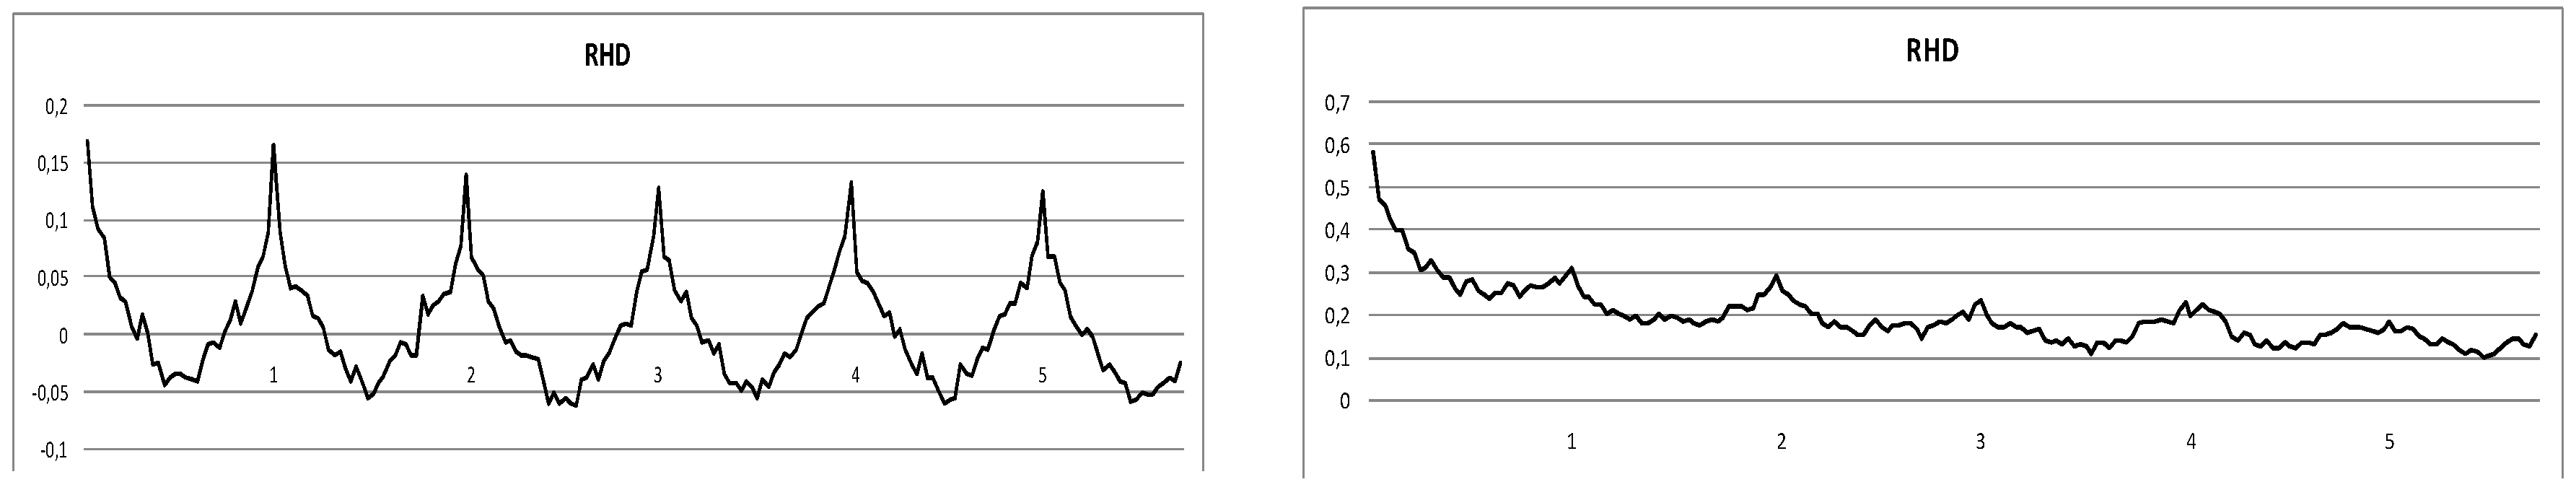
For all of the firms, taken together, the 15-min mean return is nearly zero. However, the minimum and maximum returns during this one year period are sizeable. The minimum return during the period studied for each firm is greater than its respective standard deviation. For example, AXA experienced a minimum return of −2.81%; while it had a standard deviation of 0.20%. This suggests that a series of price “spikes” (up or down) occurred during this period.8 Whether measured by the number of shares traded or by the mean of the shares traded, EURONEXT is a more active market than the NYSE. The positive autocorrelation of absolute returns indicates the presence of volatility clustering9, which is consistent with Figure 3. Indeed, for the firm AXA, we can observe the structure of the volatility and volume as shown by its coefficient of the autocorrelation of the absolute returns. Moreover, the literature has observed volatility at the beginning and end of each trading session. This is sometimes referred to as a “U-shaped” trading pattern.
3. Methodology
In order to test the hypothesis of integration between the two markets, we first estimate statistically price volatility using data points at each 15 min trading interval on the EURONEXT stock market. If the EURONEXT and NYSE are perfectly integrated, all of the information should be incorporated through trading on the EURONEXT. Accordingly, we apply the Flexible Fourier Form to estimate intraday volatility each firm. After studying intraday trading behavior, we then focus solely on the 2-h time window during which trading on both exchanges occur (see Figure 4).
Using the Error Correction Model (ECM), we test the convergence of prices between the opening of the US market and the closing of the EURONEXT market. We then test the null hypothesis of market integration by evaluating the series of price differences that occur during the 2-h overlap period. In other words, we test to determine whether, during the overlap period, the market prices for a given French firm are co-integrated. Logically, the spread of prices of a French firm quoted simultaneously on both exchanges between the hours of 3:30 and 5:30 pm (Paris time) should help us to understand price volatility behavior and whether these two markets are integrated. If so, then we would expect that eventually the spread between the prices of the same French firm should be stationary.
4. Flexible Fourier Form
The intraday pattern for volatility is estimated using the Flexible Fourier Form (FFF) proposed by (Gallant 1981). In addition, (Andersen and Bollerslev 1997) advocated the use of this methodology. It has the advantage of being both practical and robust. The intraday volatility pattern in the EUROTEXT market is determined by using data points at 15 min intervals for purposes of modeling absolute returns. Following (Andersen et al. 2000), the following decomposition of the intraday returns is considered:
where N refers to the number of interval per day, captures the overall volatility level on day t, denotes the periodic intraday volatility component, and .
The specificity10 of high frequency data led us to consider .
Then we obtain:
is then defined as:
We replaced with an estimate of daily realized volatility resulted in .
The approach consist then in modeling via a parametric function .
Where represents a non-biased error term (see (Andersen and Bollerslev 1997)) and is the Flexible Fourier form (FFF) as:
where represent the trigonometric coefficients of Fourier equation.
P indicates the order of the expansion (i.e., the number of sinusoids necessary to reproduce the profile of the modeled variable11). (N + 1)/2 and [(N + 1) (N + 2)]/6 are terms of normalization. Open Fr, Open US, and Close Fr, are dummy variables, which take into account the effect of the opening of the French and US market, respectively, at 9:05 am and 3:30 pm and the closing of the French market at 5:30 pm.
The deseasonalized and standardized intraday returns were then obtained, respectively, by:
The same methodology was adopted for estimating intraday volume with is the number of shares traded each 15 min.
Once the intraday seasonal volatility and volume patterns were determined, a fit of the estimated seasonal component was made. The Table 2 represents the statistics results of the FFF estimation.
5. Estimation of U-Shape Curve
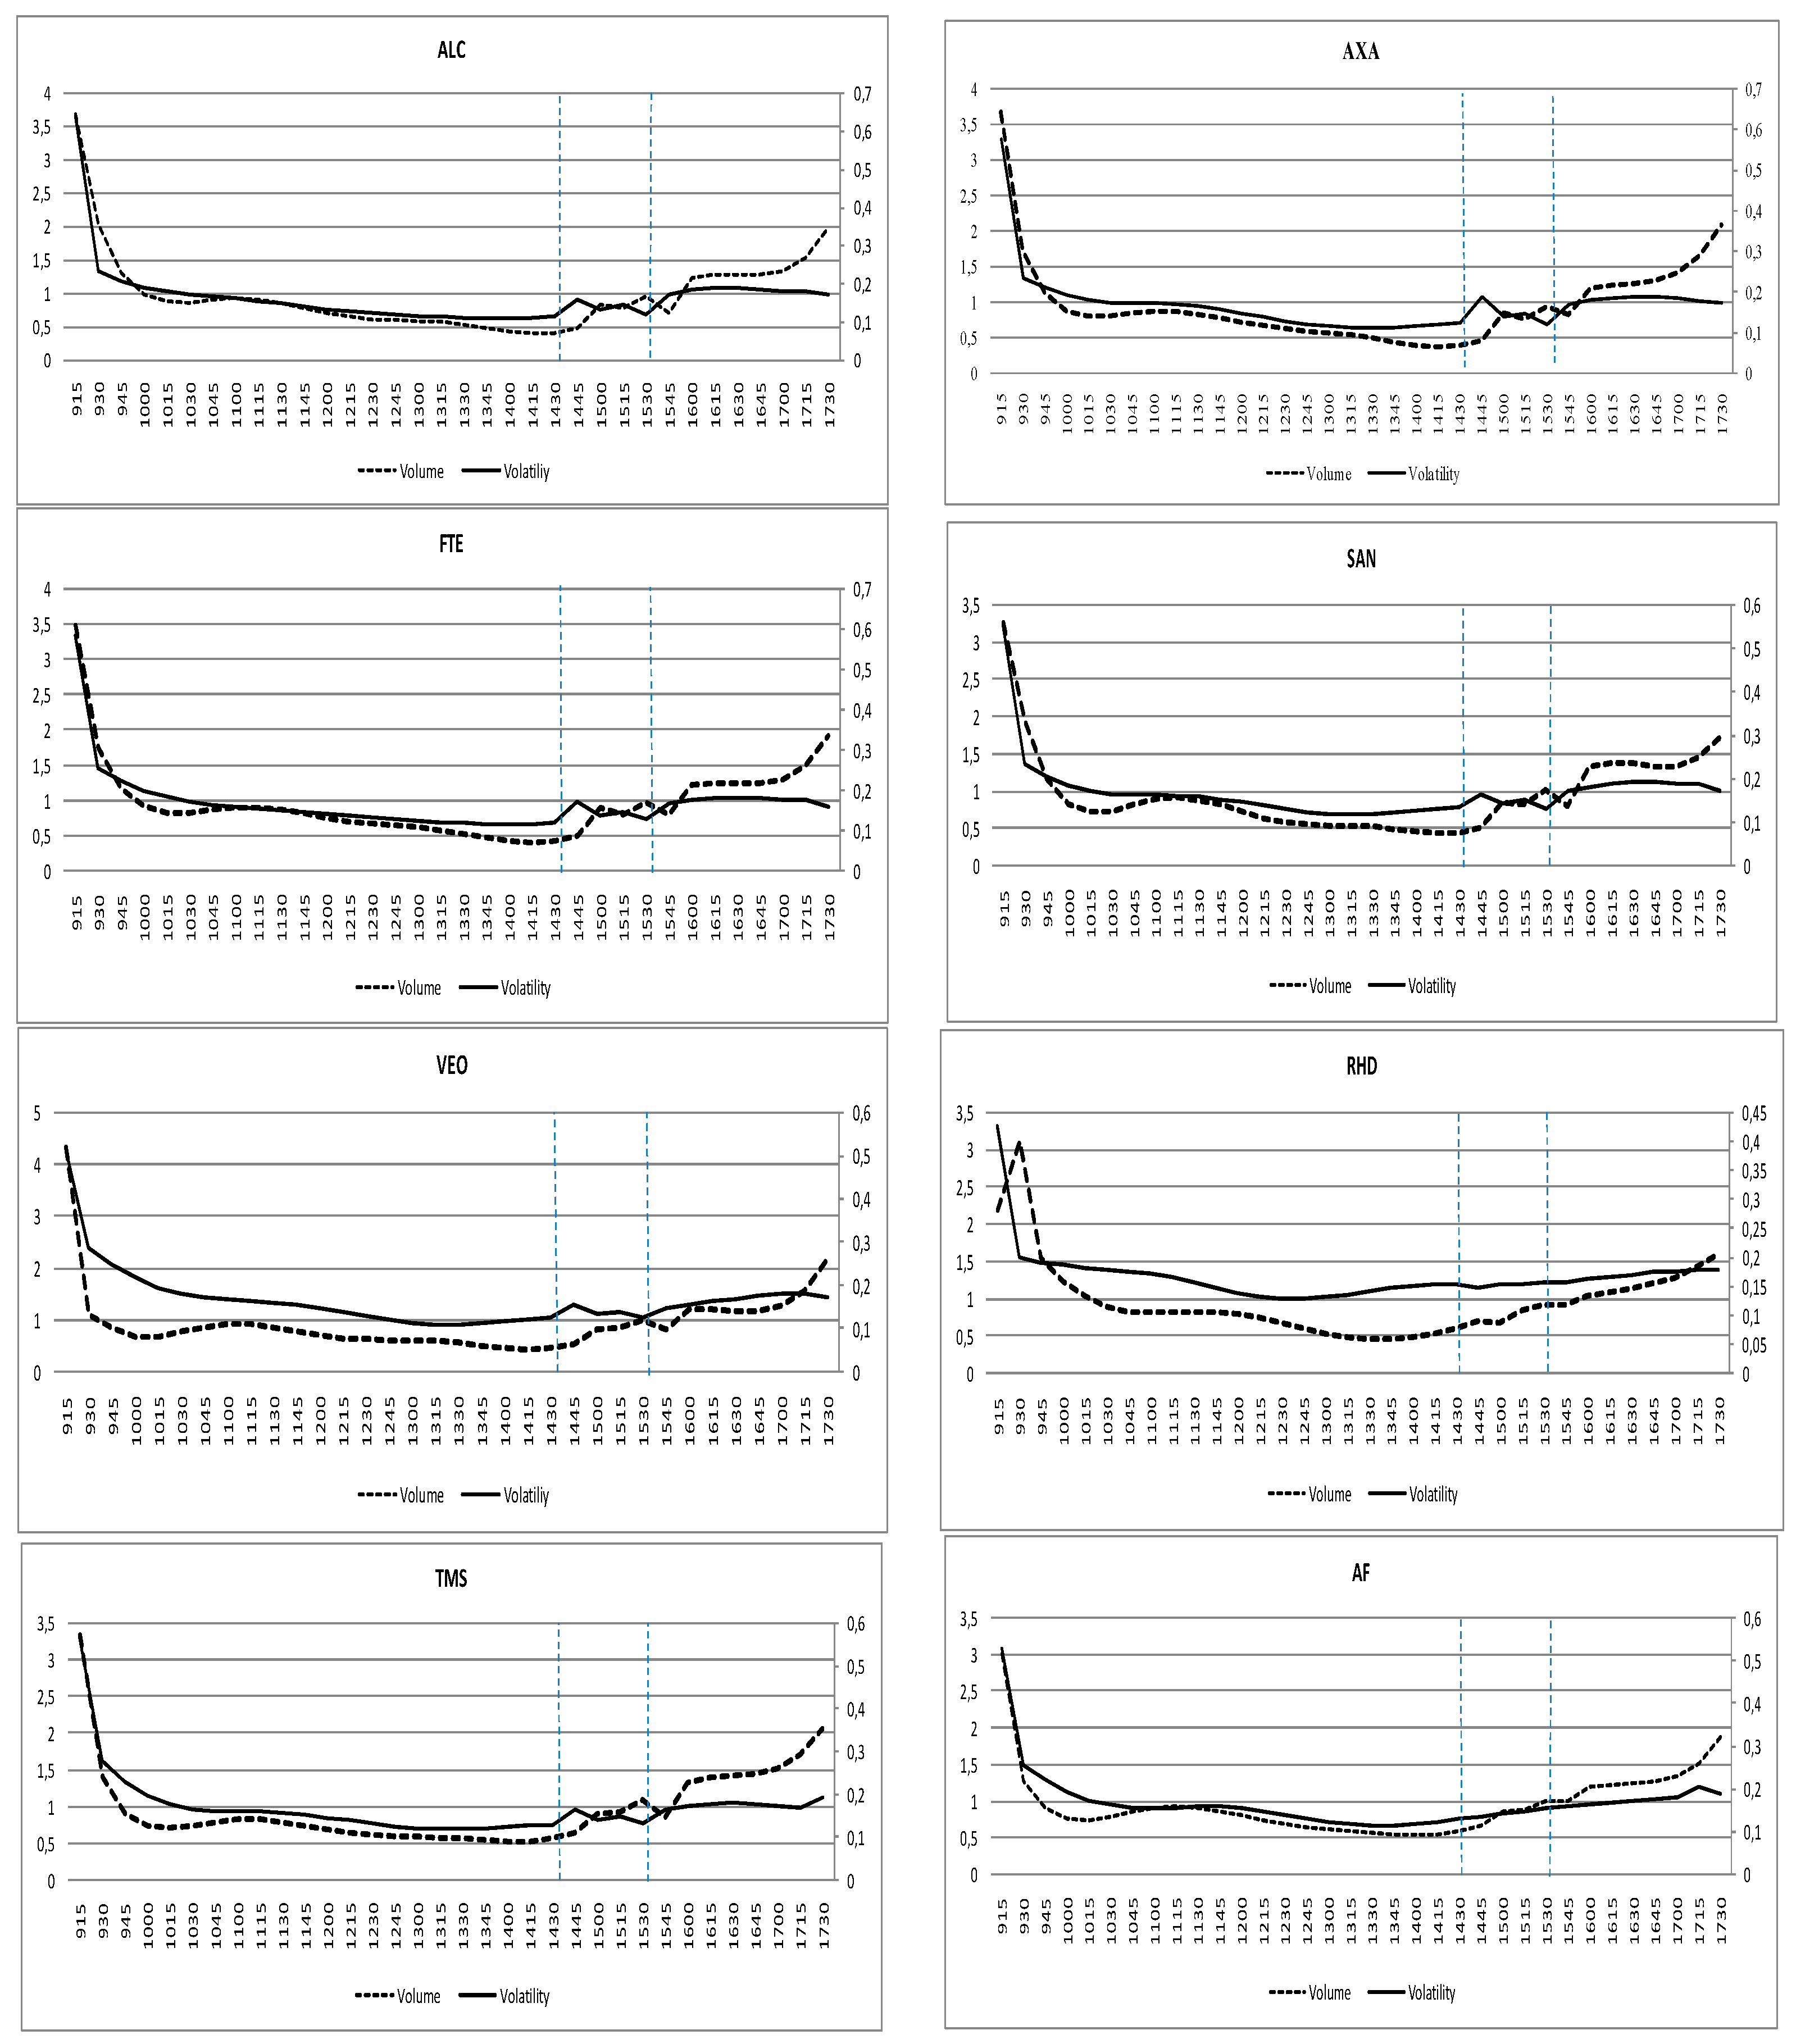
There is a “jump” () at 3:30 pm Central European time (CET) for both volatility and volume corresponding to the NYSE open. We observe an increase in volume accompanied by a brief decrease in volatility at 3:30 pm. The volatility increases gradually from around 3:45 pm (CET) until the close of the EURONEXT market for the majority of the eight French firms studied. However, for Air France and Rhodia, this observation is less pronounced.
We next look at whether the way in which the NYSE opens with respect to a given French firm provides information about that firm. Indeed, it is possible that non-systematic or private information may be revealed through the start of trading at the NYSE in the individual cross-listed French stocks. If we assume that perfect market integration exists, then the opening of the NYSE should be incorporated through trading in a given French firm on the EURONEXT market. However, the empirical evidence for French cross-listed firms rejects the hypothesis of perfect market integration as discussed by (Hupperets and Menkveld 2002), as shown in Figure 5. Increased volatility and volume during the 2-h overlap time period do not appear to be consistent with the stylized U-shape pattern for a single market.
6. Convergence of Prices during the 2-HR Overlap Period
We investigate whether the price adjustment process is verified during the two-hour simultaneous listing of inter-listed shares. It is expected that the price difference between the same cross listed assets be eliminated through the arbitration process. The difference between the prices of the inter-listed asset should be stationary, in which case the prices of the same asset in the two markets will converge rapidly. Econometrically, we investigate whether the price difference is stationary. Therefore, focusing on the 2-HR overlap period we study whether the price series in the two markets are co-integrated.12 Before applying the Error Correction Model, we analyzed our data using additional measures to test for cross-correlations. If the markets are frictionless and functioning efficiently, then any changes in the log of both the EURONEXT price and the NYSE price should be expected to be contemporaneously correlated. As shown in Table 3, the contemporaneous returns indicate strong positive correlations ranging from 0.6 to 0.9 at zero decay. This is a first evidence of the integration of the two markets. Indeed, prices seem to reflect simultaneously the same information, which implies a strong integration of the two markets. Moreover, cross-correlation after a delay (15 min) is clearly more significant for the delayed French market than the US market. This means that ADRs are more sensitive to fluctuations in shares quoted on their home markets. After more than 15 min, cross-correlation is rarely significant, which leads us to suppose that the price formation process probably adjusts within laps of time after the opening of the New York market. This seems to coincide with the peak observed around 3:45 pm when analyzing the intraday structure of the volatility of inter-listed stocks on the NYSE market. Our first findings suggests that the two markets are integrated in that price discovery reflects the same underlying information during the 2-h overlap period.
The validity of the model depends on the validity of two hypotheses. First, the series should be integrated of order one and, if this is true, both series should be cointegrated. Dickey-Fuller test statistics show that both of these assumptions are valid for all eight French firms. This test concludes that the two log-price series contain a unit root, while the returns are stationary. The return series are integrated of the order one I (1). In order to examine whether a long-term relationship exists between the EURONEXT and NYSE series, we test for cointegration. The residuals from the cointegrating regression can be considered stationary and the series are cointegrated C (1, 1). In the next stage, we use the Engle Granger 2-step approach.
The overall model is:
With:
The results in Table 4 indicate that the error correction term (ECT) is significant in all models. It should be noted, though, that the ECT is sometimes significant for the EURONEXT equation only, sometimes for the NYSE equation only, and sometimes for both. For Air France, is significantly positive for the NYSE. This implies that, for the French firms studied, the NYSE adjusts to price differences with the EURONEXT market. For Veolia, Sanofi and Thomson both the EURONEXT market and the NYSE adjust for price differences. For the rest of the French firms studied, the error correction mechanism—in which the mean () is significantly negative—reflects the EURONEXT market adjusting to price differences with the NYSE. In addition, the variable is positive and highly significant for the NYSE. This suggests that the prices of the French firms listed on the EURONEXT market lead the prices of their cross-listed shares on the NYSE market. Stated alternatively, lagged changes in the prices of French firms on the EURONEXT market lead to subsequent changes in the prices of ADRs on the NYSE. On the other hand, is significantly positive for only two EURONEXT stocks. Hence, markets are integrated, since differences in prices are temporary.
7. Implications for Future Research
Our research focuses on a period of relative calm in the EURONEXT market. An implication for future research involves examining one or more periods of relative market instability. It is possible that, during a period of relative market instability, the reversion to the mean of price differences is nonlinear in nature and can be represented by an ESTAR model that is consistent with transaction costs. Another implication for future research involves the imposition13 in 2013 of a 0.2% tax on the purchase of stocks and ADRs of certain French firms. This 0.2% tax should have a significant effect on the trading volumes and prices of the eight cross-listed French firms contained in our study given that most of the other countries in Europe have so far declined to follow France’s lead on this issue.
8. Conclusions
Using data on cross-listed stocks allows testing for financial integration between stock markets without having to make a joint hypothesis on the equilibrium stock return model. We investigate the financial integration between the Euronext stock market and the NYSE by using trading data on cross-listed French firms. Focusing on the 2-h “overlap” between the Euronext Paris and the NYSE, we study the dynamics of price differences between the two markets for eight French blue chip firms during the year 2005. First, the result showed that the average price difference does not increase notably, but its volatility and volume increase during the overlap time, which is not consistent with the stylized U-shape pattern for a single market as demonstrated in the literature. Second, the price difference in these two markets is stationary and the speed of mean reversion varies according the stock. Roughly the result conformed to the law of one price reasonably. We suppose that arbitrage opportunities appeared to exist when stock-broking houses trade for their own accounts, obviously with no transaction costs.
Conflicts of Interest
The author declares no conflict of interest.
References
- Anat, R. Admati, and Paul Pfleiderer. 1988. A Theory of Intraday Trading Patterns. The Review of Financial Studies 1: 3–40. [Google Scholar]
- Andersen, Torben G., and Tim Bollerslev. 1997. Intraday periodicity and volatility persistence in financial markets. Journal of Empirical Finance 4: 115–58. [Google Scholar] [CrossRef]
- Andersen, Torben G., Tim Bollerslev, and Jun Cai. 2000. Intraday and Interday Volatility in Japanese stock market. Journal of International Financial Market Institution and Money 10: 107–30. [Google Scholar] [CrossRef]
- Arouri, M. H. 2005. Intégration Financière et, Diversification internationale des Portefeuilles. Économie et Prévision 168: 115–32. [Google Scholar] [CrossRef]
- Baele, Lieven, and Koen Inghelbrecht. 2010. Time-varying integration, interdependence and contagion. Journal of International Money and Finance 29: 791–818. [Google Scholar] [CrossRef]
- Bollerslev, Tim, Jun Cai, and Frank M. Song. 2000. Intraday periodicity, long memory volatility and macroeconomic annoucement effects in the US Treasury bond market. Journal of Empirical Finance 7: 37–55. [Google Scholar] [CrossRef]
- Doidge, Craig, G. Andrew Karolyi, and René M. Stulz. 2004. Why are foreign firms listed in the US worth more? Journal of Financial Economics 71: 205–38. [Google Scholar] [CrossRef]
- Foerster, Stephen R., and G. Andrew Karolyi. 1998. Multimarket Trading and Liquidity: A Transaction Data Analysis of Canada-US Interlistings. Journal of International Financial Markets Institutions and Money 8: 393–412. [Google Scholar] [CrossRef]
- Froot, Kenneth A., and Emil M. Dabora. 1999. How are stock prices affected by the location of trade? Journal of Financial Economics 53: 189–216. [Google Scholar] [CrossRef]
- Gallant, A. Ronald. 1981. On the Bias in Flexible Functional Forms and an Essentially Unbiased Form. Journal of Econometrics 15: 211–45. [Google Scholar] [CrossRef]
- Goodhart, Charles A. E., and Maureen O’Hara. 1997. High Frequency Data in Financial Markets: Issues and Applications. Journal of Empirical Finance 4: 73–114. [Google Scholar] [CrossRef]
- Hasbrouck, Joel. 1995. One Security, Many Markets: Determining the Contributions to Price Discovery. Journal of Finance 4: 1175–99. [Google Scholar] [CrossRef]
- Hupperets, Erik C. J., and Albert J. Menkveld. 2002. Intraday Analysis of market integration: Dutch Blue Chips traded in Amsterdam and New York. Journal of Financial Markets 5: 57–82. [Google Scholar] [CrossRef]
- Madhavan, Ananth. 2000. Market Microstructure: A Survey. Journal of Financial Markets 3: 205–58. [Google Scholar] [CrossRef]
- Lowengrub, Paul, and Michael Melvin. 2002. Before and after international cross listing: An intraday examination of volume and volatility. International Financial Market Institutions and Money 12: 139–55. [Google Scholar] [CrossRef]
- Taylor, Stephen J., and Xinzhong Xu. 1997. The Incremental Volatility Information in one Million Foreign Exchange Quotations. Journal of Empirical Finance 4: 317–40. [Google Scholar] [CrossRef]
- Teiletche, Jérôme. 1998. La dynamique à très haute fréquence de l’indice CAC40. Finance 19: 197–220. [Google Scholar]
- Werner, Ingrid M., and Allan W. Kleidon. 1996. UK and US trading of British cross-listed stocks: An intraday analysis of market integration. The Review of Financial Studies 9: 619–64. [Google Scholar] [CrossRef]
| 1 | See (Arouri 2005) or (Baele and Inghelbrecht 2010) for a survey of the literature. |
| 2 | This intraday behavior aroused the interest in the development of theoretical models to understand the origin of these stylized facts. See (Anat and Pfleiderer 1988; Goodhart and O’Hara 1997; Foerster and Karolyi 1998; Bollerslev et al. 2000). |
| 3 | ADR (American Depositary Receipts) are negotiable instruments issued by a US bank and representing the shares that it has acquired in a foreign company listed on a non-US market. There are three levels of ADR, depending on information disclosure requirements of the American regulator (Securities and Exchange Commission), with level 3 corresponding to full listing. |
| 4 | The Paris Bourse became part of EURONEXT on 22 September 2000. |
| 5 | The data were obtained from Tick data, New York Stock Exchange (NYSE). |
| 6 | For various reasons, not all of the cross-listed French firms are included in our study (for example, where the ADR of a given firm is not widely-traded). |
| 7 | These are companies that have a solid record of stable earnings and a reputation for high quality management. The large caps suggest that the perceived management style of the firm has probably an impact on the US market (see Froot and Dabora 1999; Doidge and Stulz 2004). |
| 8 | Standard deviation looks higher for ADR in all cases. Clearly, we can observe that ADRs of a given country gives an information advantage on the ADRs’ underlying stocks that can be bought or sold quicker than otherwise. |
| 9 | We retain the absolute return as the measure of volatility. The autocorrelation of the absolute return is higher than squared return; therefore, there is more structure and information to study (see (Taylor and Xu 1986)). |
| 10 | Following the major part of the studies on data of high frequency, we shall assume that intraday return have mean zero and are uncorrelated. It is assumed that the variance and covariance of squared returns exist and are finite. However, we choose the absolute return as a proxy of volatility. For deep highlight see (Taylor and Xu 1986; Teiletche 1998; Madhavan 2000). |
| 11 | With the choice P = 3, the combination of trigonometric functions and polynomial terms are likely to result in better approximation properties when estimating regularly recurring cycles. |
| 12 | In order to facilitate comparison of prices, prices in euro are converted into dollars using the daily EUR/USD rate for the whole of 2005. Indeed the volatility of the exchange rate is more less pronounced than returns. |
| 13 | It’s about The French Financial Transaction Tax (FTT) on the purchase of certain French equities. It’s issued by a French headquartered company with a market capitalization in excess of 1 billion euros as at 1 January of the tax year. ADRs tax started on 1 January 2013. |
Figure 1.
Stylized intraday pattern for a firm’s stock on a single exchange.
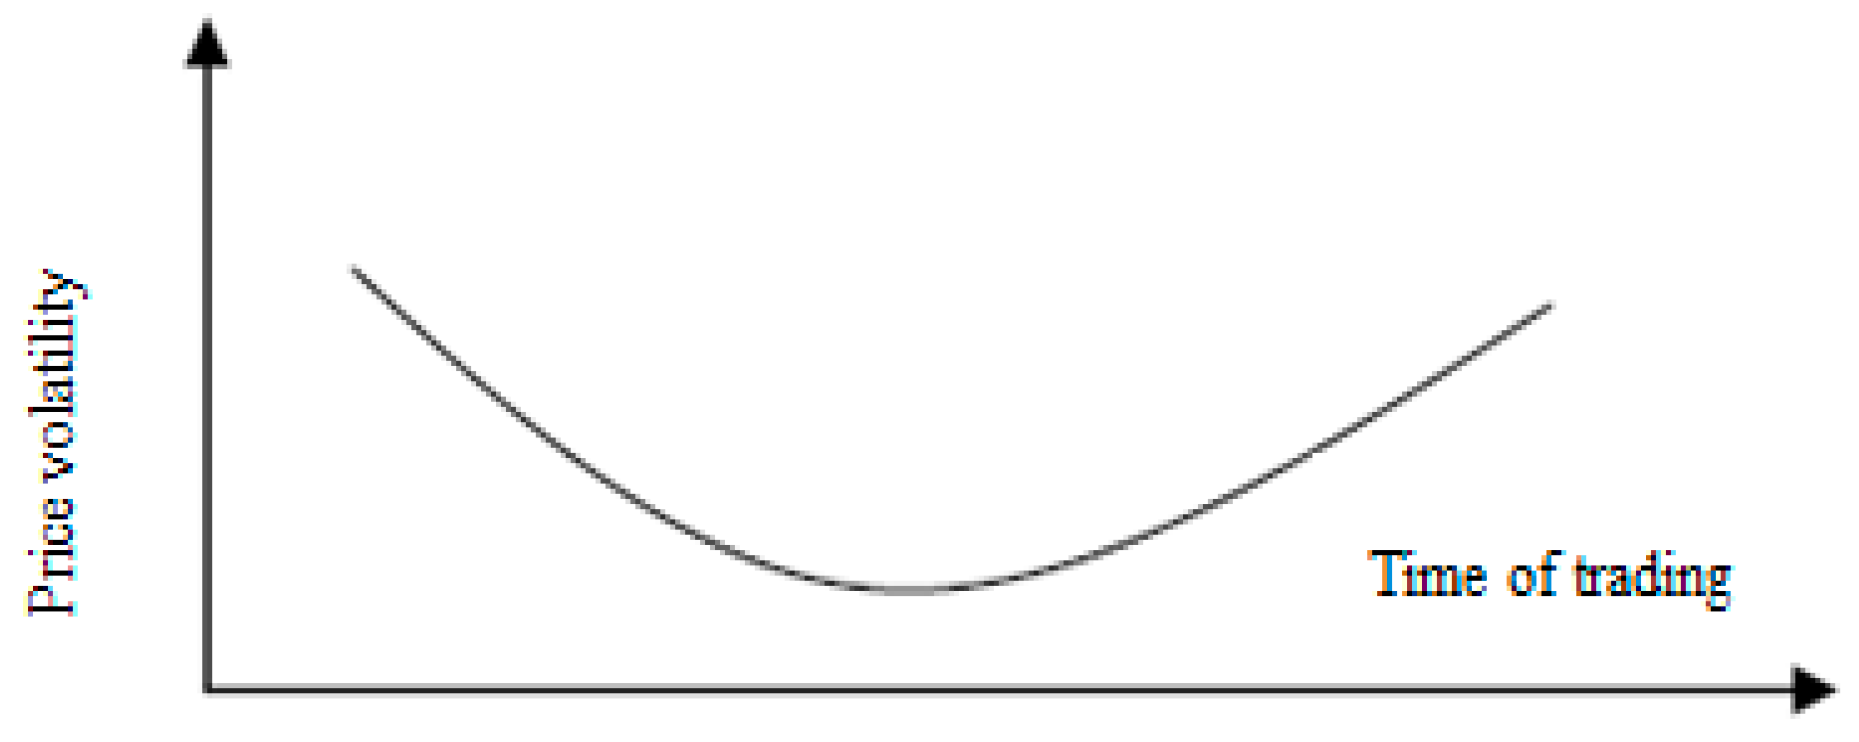
Figure 2.
Stylized intraday pattern for cross-listed stock. Note: The thick black line traces out the elongated U-shape that is the predicted intraday pattern for volatility and trading volume as presented by (Werner and Kleidon 1996).
Figure 2.
Stylized intraday pattern for cross-listed stock. Note: The thick black line traces out the elongated U-shape that is the predicted intraday pattern for volatility and trading volume as presented by (Werner and Kleidon 1996).

Figure 3.
Autocorrelation of actual absolute returns and volume from 3–7 January 2005. Note: The first 200 autocorrelations (almost five days) are represented for the absolute return and the volume on the French market. The x-axis represents the coefficient of autocorrelation. The y-axis represents the days.
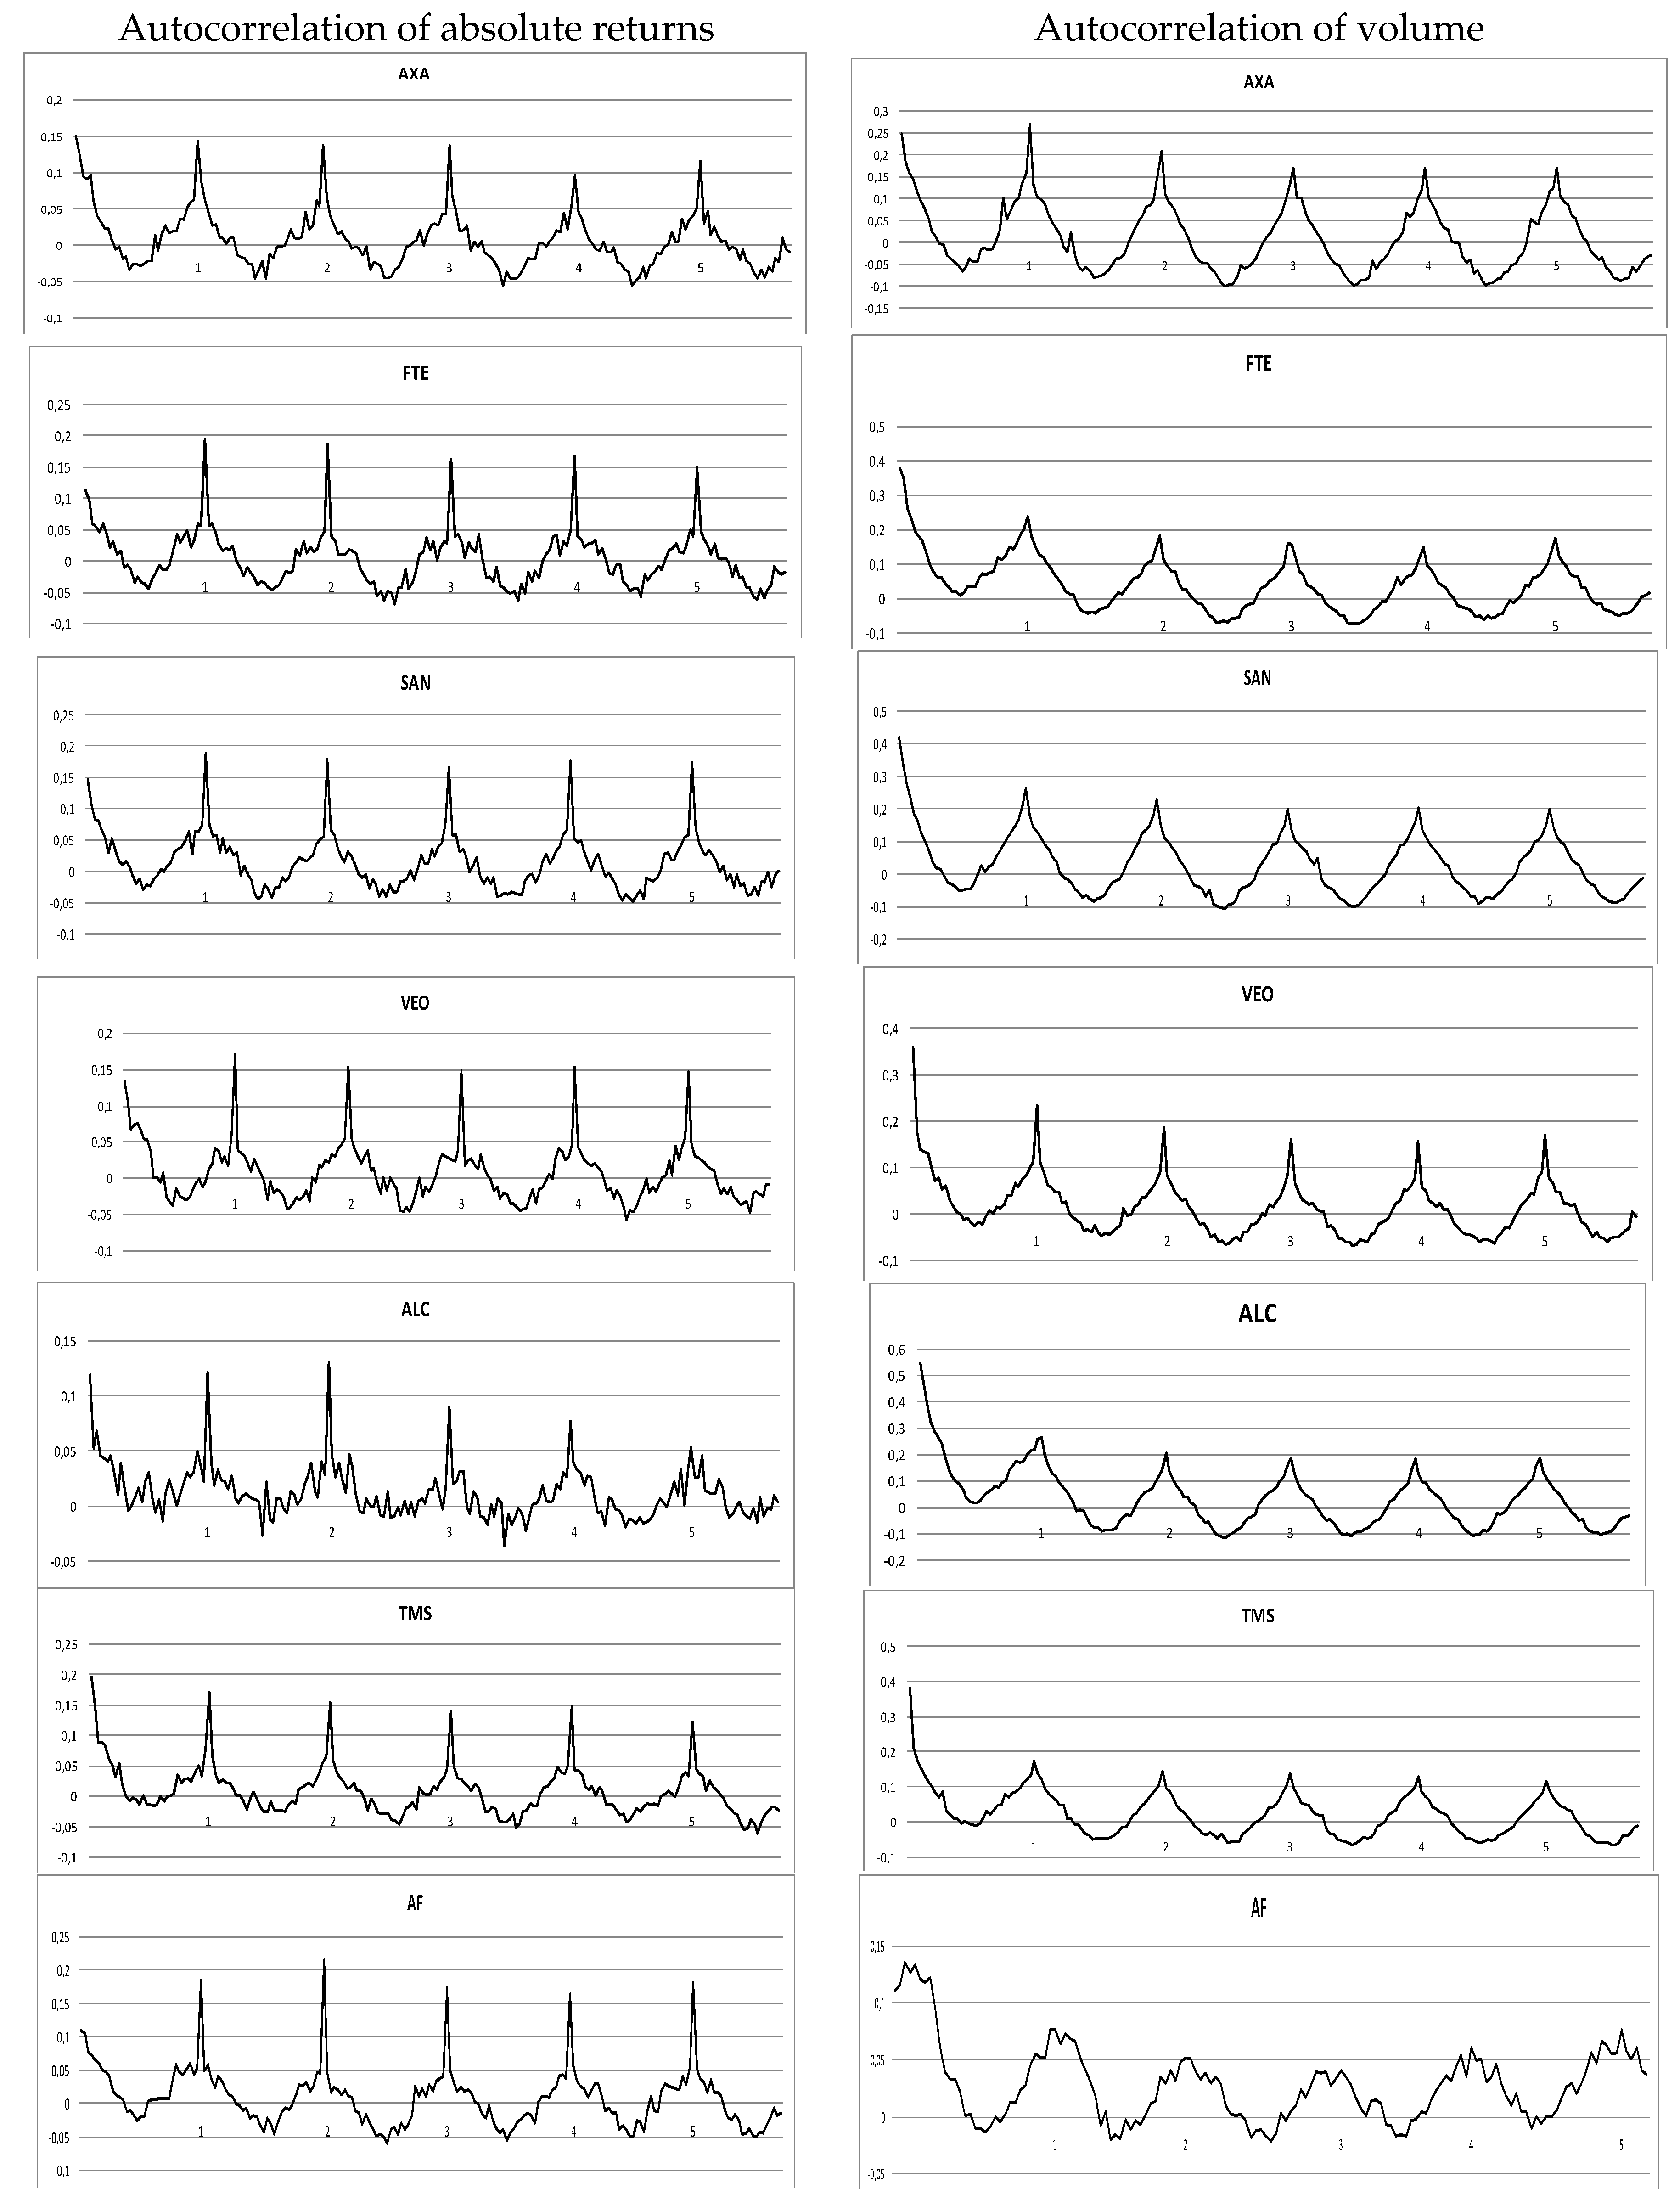

Figure 4.
Timeline.
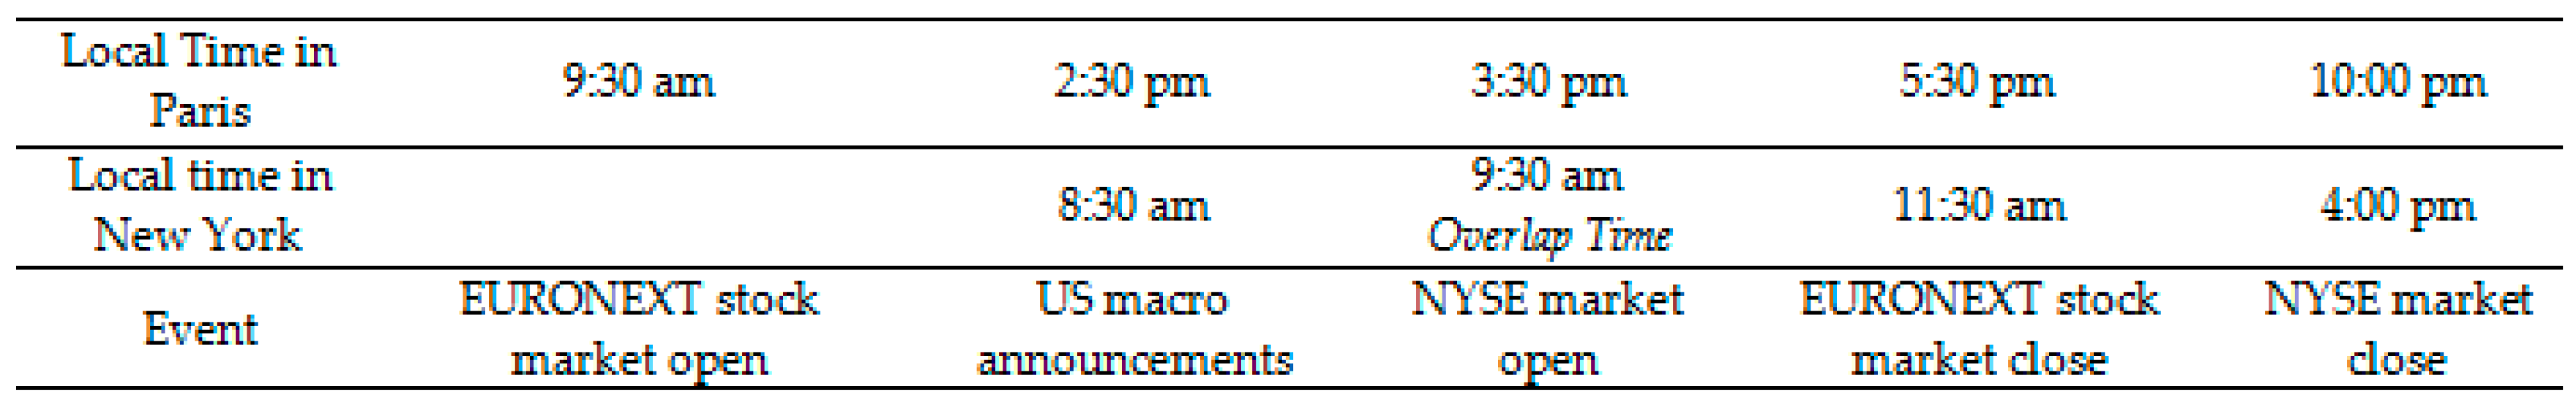
Figure 5.
U-shape intraday returns and volume after the FFF deseasonalization and standardization. Note: The structure of the curve does not describe a U-shaped curve on the two combined markets but rather a curve in the form W. This leads us to reject the hypothesis that if two markets are perfectly integrated then the structure of the curve intraday curve of volume and volatility on the combined French and US markets should exhibit a U-shaped intra-day curve. The rejection of this assumption implies that both markets are segmented.

Table 1.
Summary statistic.
| Mean | Std. Dev | Minimum | Maximum | AC abs a Return | Nb of Obs. | Nb of Shares | ||
|---|---|---|---|---|---|---|---|---|
| PARIS | AF | 0.0028 | 0.22 | −2.58 | 4.55 | 0.151 | 8986 | 38,924 |
| NY | AF ADR | 0.0055 | 0.47 | −3.82 | 4.90 | 0.059 | 6540 | 11,200 |
| PARIS | FTE | −0.0016 | 0.21 | −3.95 | 3.93 | 0.106 | 8963 | 288,608 |
| NY | FTE ADR | −0.0045 | 0.29 | −4.33 | 1.99 | 0.028 | 6540 | 5689 |
| PARIS | VEO | 0.0041 | 0.20 | −1.88 | 1.83 | 0.174 | 8987 | 43,916 |
| NY | VEO ADR | 0.005 | 0.33 | −3.56 | 2.39 | 0.112 | 6540 | 827 |
| PARIS | RHD | 0.0005 | 0.63 | −1.79 | 11.78 | 0.077 | 8948 | 27,497 |
| NY | RHD ADR | −0.0049 | 1.03 | −1.75 | 7.67 | 0.117 | 6540 | 2060 |
| PARIS | AXA | 0.0044 | 0.20 | −2.81 | 2.77 | 0.098 | 8986 | 203,737 |
| NY | AXA ADR | 0.004 | 0.26 | −2.71 | 1.98 | 0:015 | 6540 | 11,912 |
| PARIS | TMS | −0.001 | 0.24 | −3.32 | 5.45 | 0.104 | 8986 | 59,102 |
| NY | TMS ADR | −0.0045 | 0.35 | −2.90 | 3.89 | 0.050 | 6540 | 2696 |
| PARIS | SAN | 0.0025 | 0.21 | −2.46 | 4.13 | 0.104 | 8986 | 115,074 |
| NY | SAN ADR | 0.0014 | 0.24 | −3.05 | 3.54 | 0.071 | 6540 | 36,555 |
| PARIS | ALC | −0.0037 | 0.29 | −7.97 | 5.09 | 0.106 | 8987 | 315,642 |
| NY | ALC ADR | −0.0011 | 0.38 | −9.77 | 9.05 | 0.065 | 6540 | 38,980 |
a Autocorrelation of absolute return Lag 1.
Table 2.
The Flexible Fourier Form (FFF) trigonometric variables estimation.
| C | ||||||||||
|---|---|---|---|---|---|---|---|---|---|---|
| Paris | AXA | 0.331 * | −0.368 ** | 0.108 * | −0.011 | −0.012 | 0.001 | −0.034 * | −0.022 * | −0.008 * |
| NY | AXA ADR | 5.362 * | −13.77 ** | 5.09 ** | −2.30 * | −0.588 * | −0.192 * | 0.066 | −0.12 * | 0.015 |
| Paris | ALC | 0.380 * | −0.525 * | 0.166 * | −0.04 | −0.016 | −0.007 | −0.037 * | −0.021 | −0.006 |
| NY | ALC ADR | 6.28 * | −16.01 ** | 5.816 ** | −2.682 * | −0.676 * | −0.239 * | −0.079 | −0.148 * | 0.003 |
| Paris | RDIA | 0.228 * | −0.150 * | 0.047 | 0 | −0.004 | 0 | −0.01 | 0.003 | −0.007 |
| NY | RDIA ADR | 3.671 * | −7.530 ** | 2.622 ** | −0.966 * | −0.237 * | 0.012 | −0.242 * | −0.140 * | −0.025 |
| Paris | TMS | 0.501 * | −0.765 * | 0.234 * | −0.078 | −0.016 | 0 | −0.067 * | −0.031 * | −0.010 * |
| NY | TMS ADR | 4.118 * | −10.41 ** | 3.945 ** | −1.752 | −0.490 * | −0.163 * | 0.057 * | −0.080 * | 0.012 |
| Paris | VEO | 0.387 * | −0.471 * | 0.136 * | −0.018 | −0.003 | 0.008 | −0.041 | −0.018 * | −0.005 |
| NY | VEO ADR | 5.974 * | −16.255 ** | 6.112 ** | −2.969 * | −0.772 * | −0.260 * | 0.243 * | −0.012 * | 0.057 * |
| Paris | FTE | 0.416 * | −0.588 * | 0.183 * | −0.051 | −0.013 | −0.004 | −0.043 * | −0.023 * | −0.004 |
| NY | FTE ADR | 5.528 * | −13.962 ** | 5.112 ** | −2.357 * | −0.617 * | −0.199 * | −0.007 | −0.135 * | 0.023 |
| Paris | AF | 0.400 * | −0.557 * | 0.174 * | −0.049 | −0.010 | 0.005 | −0.038 * | −0.021 * | −0.002 |
| NY | AF ADR | 3.94 * | −9.69 ** | 3.639 ** | −1.652 * | −0.480 * | −0.131 * | 0.088 * | −0.069 * | −0.003 |
| Paris | SAN | 0.315 * | −0.328 * | 0.096 * | −0.008 | −0.007 | 0.002 | −0.038 * | −0.021 * | −0.008 * |
| NY | SAN ADR | 6.260 * | −15.65 *** | 5.628 ** | −2.629 * | −0.707 * | −0.244 * | −0.233 * | −0.231 * | −0.054 * |
| Estimation of Dummy Variables | ||||||||||
| υ0 | υ1 | υ2 | ||||||||
| Paris | AXA | 0.306 ** | 0.004 | −0.036 ** | ||||||
| NY | AXA ADR | 0.145 ** | 1.114 ** | 0.26 ** | ||||||
| Paris | ALC | 0.370 ** | 0.024 ** | −0.039 * | ||||||
| NY | ALC ADR | 0.200 ** | 1.045 ** | 0.430 ** | ||||||
| Paris | RDIA | 0.213 * | 0.01 | 0.003 | ||||||
| NY | RDIA ADR | 1.14 * | 0.408 * | −0.049 | ||||||
| Paris | TMS | 0.229 * | 0.026 * | −0.023 * | ||||||
| NY | TMS ADR | 0.190 * | 0.855 ** | 0.136 ** | ||||||
| Paris | VEO | 0.186 * | −0.007 | −0.018 | ||||||
| NY | VEO ADR | 0.149 * | 1.463 ** | 0.143 * | ||||||
| Paris | FTE | 0.287 ** | −0.02 | −0.028 | ||||||
| NY | FTE ADR | 0.110 * | 0.938 ** | 0.253 ** | ||||||
| Paris | AF | 0.229 ** | 0.028 | 0.000 | ||||||
| NY | AF ADR | 0.115 * | 0.091 * | 0.043 | ||||||
| Paris | SAN | 0.288 ** | 0.07 | −0.029 | ||||||
| NY | SAN ADR | 0.165 * | 0.377 ** | 0.062 * | ||||||
*** Asterisks denote significance at a 99% level of confidence; ** denote significance at a 95%; * denote significance at a 90%.
Table 3.
Cross-correlations during 2-h overlap period.
| Cross Correlations | AXA | ALC | RDIA | TMS | VEO | FTE | AF | SAN |
|---|---|---|---|---|---|---|---|---|
| 0 Lags | 0.874 ** | 0.948 ** | 0.611 ** | 0.879 ** | 0.835 ** | 0.891 ** | 0.698 * | 0.872 * |
| EURONEXT Lagged | ||||||||
| 15 min | 0.022 * | 0.023 * | 0.056 * | 0.018 * | 0.066 * | 0.017 | 0.011 | 0.018 |
| 30 min | −0.023 | −0.021 | 0.013 | −0.014 | −0.007 | −0.028 | 0.021 | −0.009 |
| NYSE Lagged | ||||||||
| 15 min | 0.017 | 0.001 | 0.015 * | −0.005 | 0.026 | 0.002 | 0.021 | 0.057 |
| 30 min | −0.029 | −0.022 | −0.017 | −0.014 | 0.015 | −0.021 | −0.018 | 0.024 |
**Asterisks denote significance at a 95%; * denote significance at a 90%.
Table 4.
Vector Error Correction Results.
| ECT | γ1 | γ2 | β1 | β2 | R2 | ||
|---|---|---|---|---|---|---|---|
| Paris | AXA | −0.114 ** | 0.036 | −0.019 | −0.025 | −0.022 | 0.013 |
| NY | AXA ADR | 0.006 | 0.109 ** | −0.017 | −0.098 * | −0.012 | 0.004 |
| Paris | ALC | −0.203 ** | 0.038 | 0.082 | −0.042 | −0.109 | 0.008 |
| NY | ALC ADR | 0.003 | 0.145 ** | 0.051 | −0.130 ** | −0.073 | 0.003 |
| Paris | RHD | −0.019 * | −0.081 * | −0.055 | 0.058 * | 0.017 | 0.011 |
| NY | RDIA ADR | 0.002 | 0.220 ** | 0.117 * | −0.207 ** | −0.109 * | 0.019 |
| Paris | TMS | −0.019 * | −0.081 * | −0.055 | 0.058 * | 0.017 | 0.011 |
| NY | TMS ADR | 0.117 ** | 0.120 ** | −0.047 | −0.127 ** | 0.039 | 0.014 |
| Paris | VEO | −0.132 ** | −0.015 | −0.006 | 0.028 | 0.011 | 0.014 |
| NY | VEO ADR | 0.053 * | 0.148 ** | −0.051 | −0.107 * | 0.062 | 0.013 |
| Paris | FTE | −0.194 ** | 0.032 | 0.046 | −0.044 | −0.078 | 0.022 |
| NY | FTE ADR | 0.035 | 0.117 ** | −0.019 | −0.114 ** | −0.005 | 0.003 |
| Paris | AF | −0.022 | −0.048 | 0.038 | 0.065 | −0.026 | 0.006 |
| NY | AF ADR | 0.049 * | −0.080 | 0.002 | 0.038 | −0.054 | 0.008 |
| Paris | SAN | −0.108 ** | −0.015 | 0.048 | 0.024 | −0.025 | 0.007 |
| NY | SAN ADR | 0.059 * | 0.019 | 0.013 | −0.004 | 0.007 | 0.003 |
** Asterisks denote denote significance at a 95%; * denote significance at a 90%.
© 2017 by the author. Licensee MDPI, Basel, Switzerland. This article is an open access article distributed under the terms and conditions of the Creative Commons Attribution (CC BY) license (http://creativecommons.org/licenses/by/4.0/).
Share and Cite
MDPI and ACS Style
Mehanaoui, M. Financial Market Integration: Evidence from Cross-Listed French Firms. J. Risk Financial Manag. 2017, 10, 18. https://doi.org/10.3390/jrfm10040018
AMA Style
Mehanaoui M. Financial Market Integration: Evidence from Cross-Listed French Firms. Journal of Risk and Financial Management. 2017; 10(4):18. https://doi.org/10.3390/jrfm10040018
Chicago/Turabian StyleMehanaoui, Mohamed. 2017. "Financial Market Integration: Evidence from Cross-Listed French Firms" Journal of Risk and Financial Management 10, no. 4: 18. https://doi.org/10.3390/jrfm10040018