Influence of Venture Capital and Knowledge Transfer on Innovation Performance in the Big Data Environment


1
School of Economy and Management, Changsha University of Science & Technology, Changsha 410114, China
2
College of Business Administration, University of Nebraska at Omaha, Omaha, NE 68182, USA
3
College of Business, University of Central Arkansas, Conway, AR 72035, USA
*
Authors to whom correspondence should be addressed.
J. Risk Financial Manag. 2019, 12(4), 188; https://doi.org/10.3390/jrfm12040188
Submission received: 30 October 2019
/
Revised: 2 December 2019
/
Accepted: 9 December 2019
/
Published: 12 December 2019
(This article belongs to the Special Issue Venture Capital and Private Equity)
Abstract
:Technological innovation requires large investments. Venture capital (VC) is a prominent financial source for innovative start-ups. A venture capitalist will inevitably transfer knowledge to facilitate the innovation of a firm while monitoring and advising its portfolio companies. Only when a firm has its own valuable new knowledge and high growth potential would venture capitalists select it. At the same time, big data knowledge, such as customer demands and user preferences, is also important for the new product development of a firm in the big data environment. Therefore, private knowledge transferred from venture capitalists, new knowledge developed independently by a firm itself, and big data knowledge are the three main types of knowledge for venture-backed firms in the big data environment. To find the influences of VC and knowledge transfer on the innovative performance of venture-backed firms, a model of maximizing the present value of the expected profit of new product innovation performance of a venture-backed firm in the big data environment is presented. The model can help venture capitalists to determine the scale of investment and the optimal exit time and predict the internal rate of return (IRR). This model can also help innovative start-ups to illustrate the value and prospects of a project to attract investment in their business prospectus.
1. Introduction
Technological innovation requires large investments. Venture capital (VC) has been recognized as a prominent financial source for innovative start-ups (Dessi and Yin 2015; Rymkul et al. 2015). VC is a form of specialized financial intermediation that finances firms with the goal of realizing a capital gain by bringing them public or having them acquired within a few years (Dessi and Yin 2015). A venture capitalist will inevitably transfer knowledge to facilitate innovation of a firm while monitoring and advising its portfolio companies (Bottazzi et al. 2008; Bottazzi et al. 2009; Sahlman and Gorman 1989; Lerner 1995). This type of knowledge transferred from venture capitalists can help venture-backed firms acquire important information, such as related to technological innovation, thus improving their technological innovation ability (Dessi and Yin 2015). These investors are therefore in a very favorable position to act as private knowledge providers of some venture-backed firms.
While previous literature has pointed out that knowledge transferred from venture capitalists is important for innovation performance of venture-backed firms (González-Uribe 2014; Pahnke et al. 2014; Da Rin and Penas 2015), we know very little about the relationship between VC and the new product innovation performance in knowledge transfer. Scholars usually use patent productions to measure innovation performance of venture-backed firms. However, venture capitalists also transfer valuable private non-patented knowledge by means of information transmission to entrepreneurs or industry experts (Pahnke et al. 2014; Helmers et al. 2017). Thus, the innovation performance includes not only patented knowledge but also non-patented knowledge. In fact, VC has proven to be beneficial to innovation and product market performance of venture-backed firms (Jain 2001; Rosenbusch et al. 2013; Smolarski and Kut 2011). This result also holds in knowledge transfer—firms that engage in knowledge transfer can obtain a higher percentage of their sales from innovative products (Cassiman and Veugelers 2006; Engelen et al. 2014; Da Rin and Penas 2015; Yang et al. 2015; Wadhwa et al. 2016; Wu et al. 2019a). This paper aims to research the role of venture capitalists as private knowledge providers (including patent knowledge and non-patented knowledge) in knowledge transfer and the mechanism through which venture capitalists affect new product innovation performance of venture-backed firms.
We based our analysis in the context of the big data environment. Recent studies show that big data knowledge, such as customer demands and user preferences, has become important for new product innovation of firms in the big data environment (McGuire et al. 2012; Horst and Duboff 2015; Koman and Kundrikova 2016; Wu et al. 2018, 2019a, 2019b; Wu and Li 2019). At the same time, the dynamic and interactive nature of knowledge transfer forces venture capitalists to be selective of firms when making investment decisions. Only when a firm has its own valuable knowledge and high growth potential, would venture capitalists select it (Weber and Weber 2007). As a result, big data knowledge, private knowledge transferred from venture capitalists, and new knowledge developed independently by a venture-backed firm itself, are the three main types of knowledge that firms need for innovation in the big data environment.
Prior studies have provided evidence of a causal effect of VC and knowledge transfer on patent production at the industry level (Kortum and Lerner 1998; Hall et al. 2005; Mollica and Zingales 2007; Popov and Rosenboom 2009; Hirukawa and Ueda 2011). It has been proven that it is difficult to fully demonstrate the innovation performance of VC-backed firms, because innovation performance is not only related to patent knowledge, but also non-patent knowledge (Pahnke et al. 2014; Helmers et al. 2017). Although some scholars have considered the impact of non-patent knowledge from venture capitalists on the innovation performance of VC-backed firms, they have not considered the influence of customer demands and user preferences on new product innovation in the big data environment. In our study, we develop a theoretical model to study the influences of VC and knowledge transfer in the big data environment, and to predict the innovative performance of venture-backed firms by using the method of maximizing the present value of the expected profit of new product innovation performance of a venture-backed firm in the big data environment. This model not only considers the influence of VC and private knowledge from venture capitalists on the innovation performance of venture-backed firms, but also takes into account the benefits brought by big data knowledge. The model can help VC investors to determine the scale of investment and the optimal exit time, and predict the internal rate of return. This model can also help innovative start-ups better illustrate the value and prospects of a project to attract investment in their business prospectus.
The rest of the paper proceeds as follows. In Section 2, the conceptual model and hypotheses for evaluating the innovation performance of venture-backed firms are introduced. A decision-making model of knowledge transfer and VC in the big data environment is presented in Section 3. Simulation experiments and the control strategy are described in Section 4. Conclusions are drawn in Section 5.
2. Conceptual Model and Model Hypotheses
2.1. Conceptual Model for VC and Knowledge Transfer of a Firm
Venture capitalists face two types of risks when selecting the proper exit time. One risk is that the exit time of VC is too early to fully absorb the innovative efficiency of venture-backed firms and suffer from the loss of efficiency; the other risk is the opportunity cost caused by the failure to invest in more efficient, innovative firms because the exit time of VC is too late. Therefore, venture capitalists always need to decide the optimal exit time. The optimal exit time refers to the time when a venture capitalist can obtain a maximum capital gain by bringing venture-backed firms public or having them acquired. From the perspective of a venture-backed firm, it refers to finding the time of maximum innovation performance after the entrance of VC and knowledge transfer. This paper uses the modeling method of maximizing the present value of the expected profit of a venture-backed firm in the big data environment.
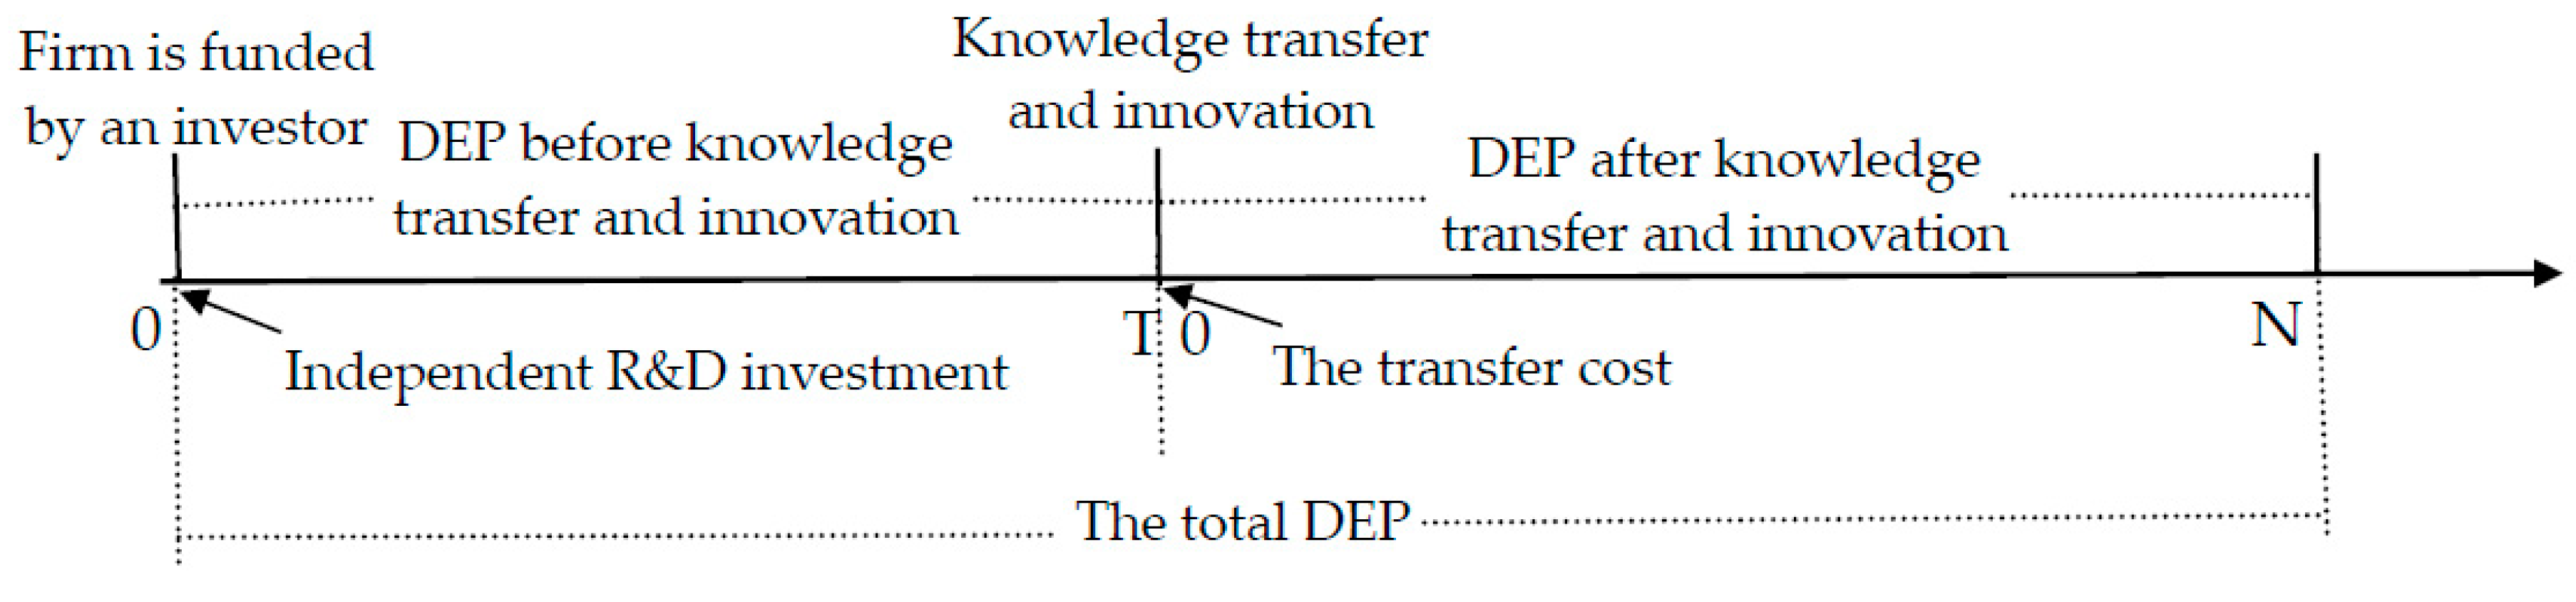
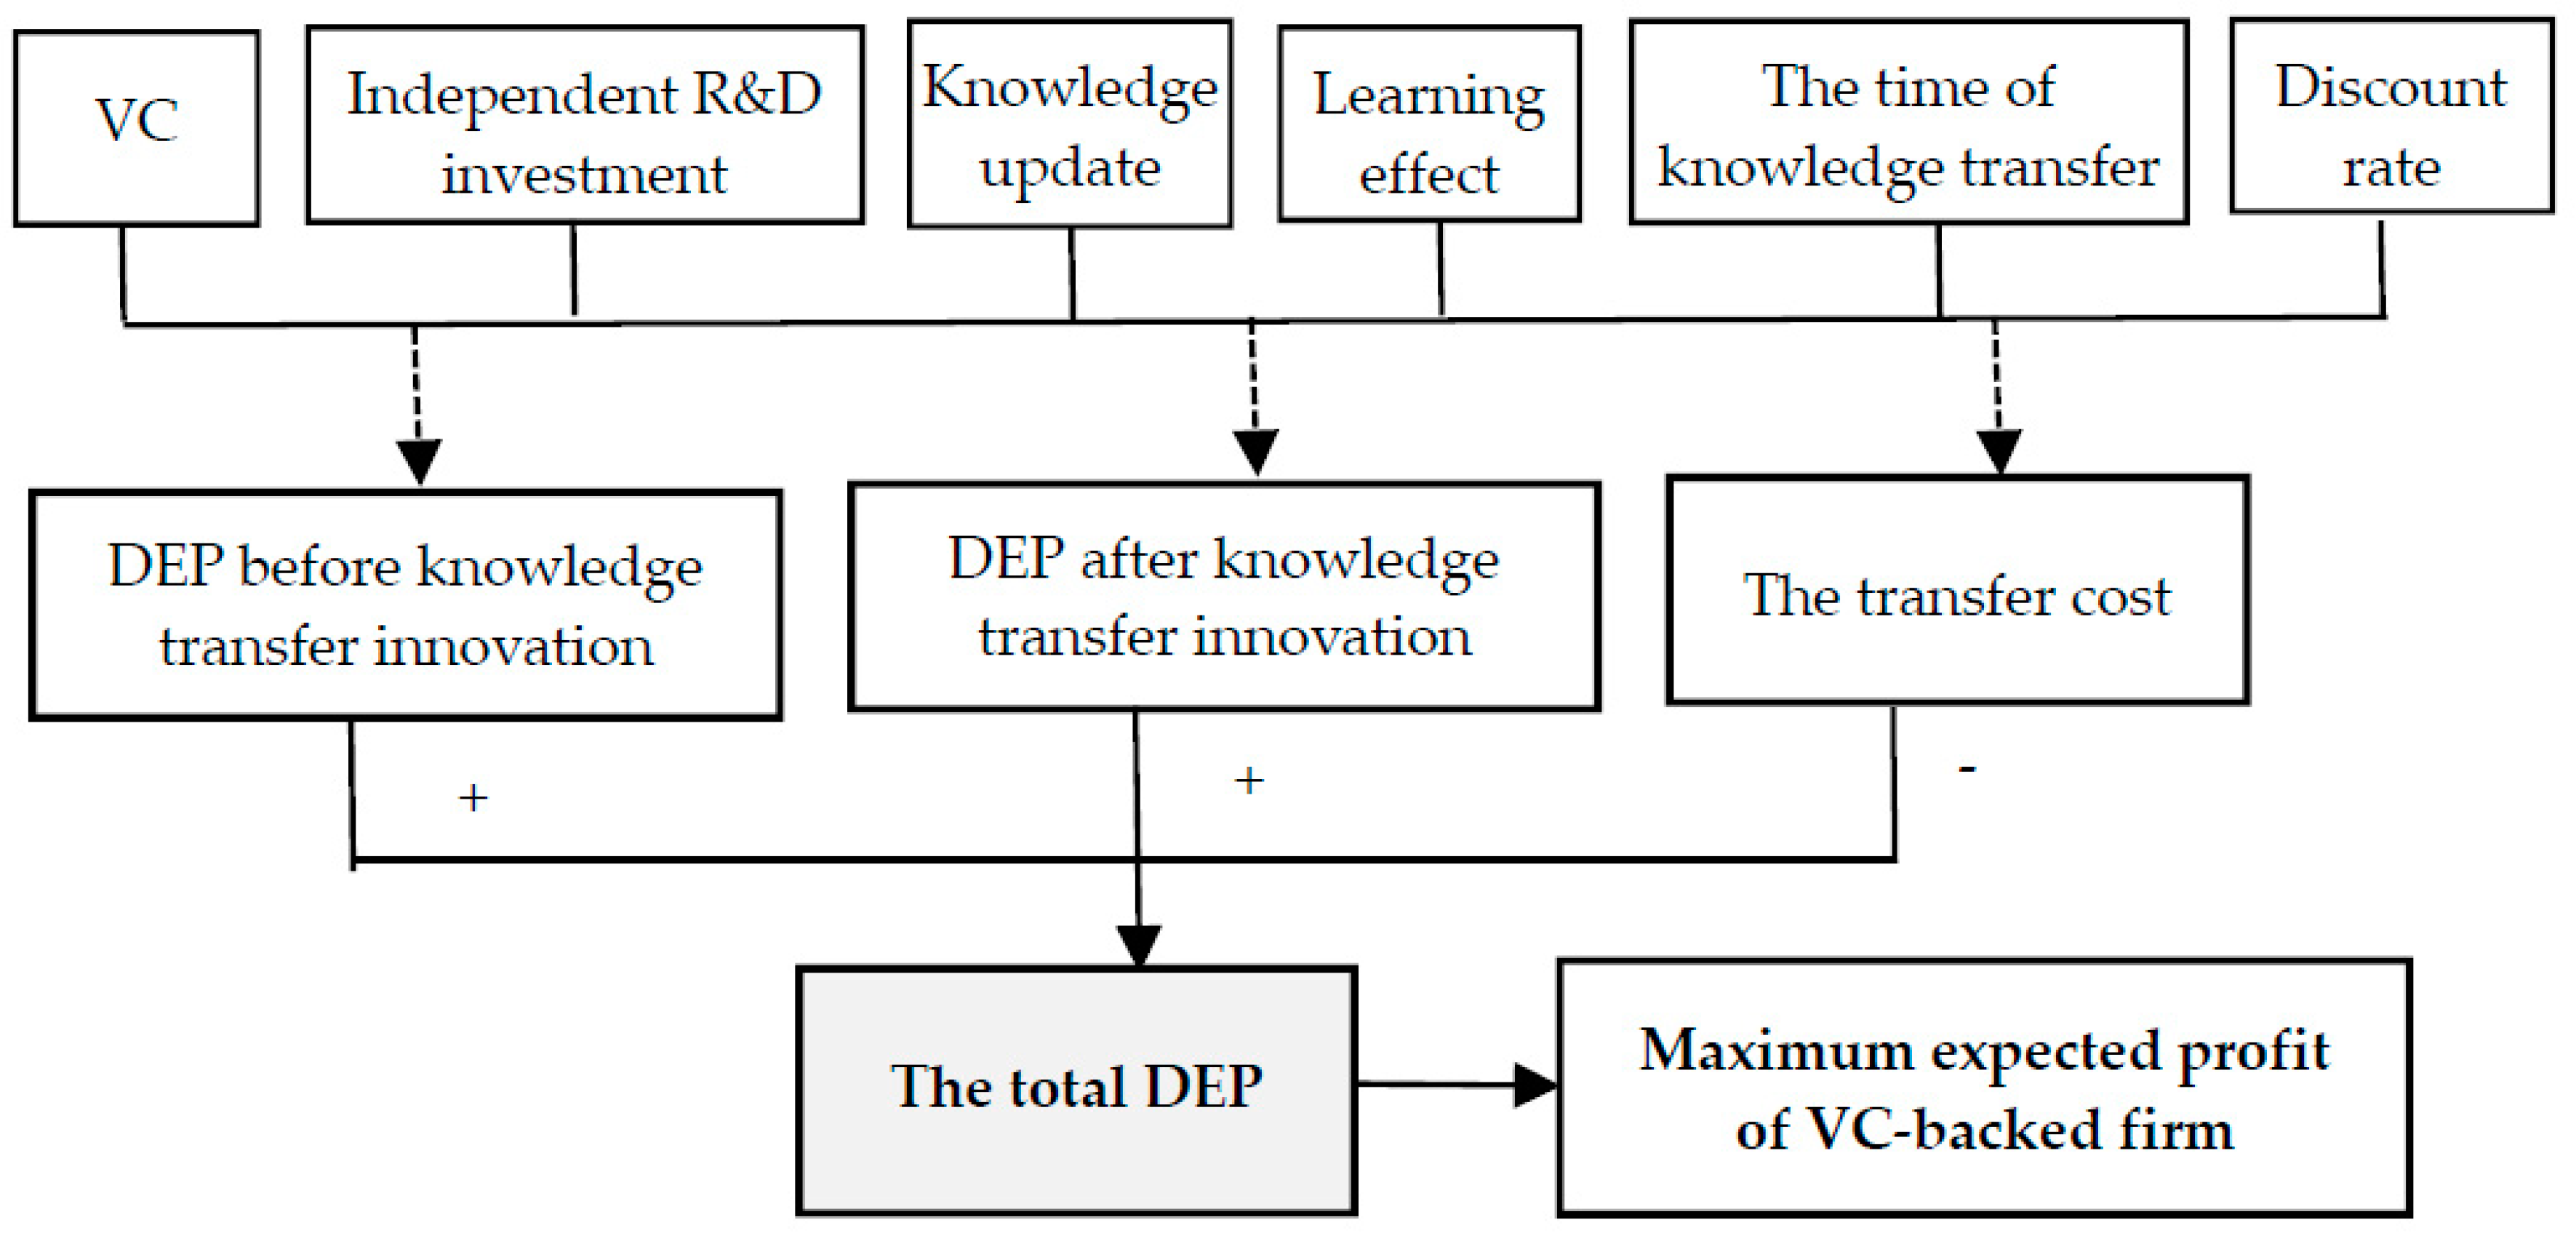
Figure 1 shows the timeline and modeling idea. At the beginning time point, a firm is funded by a venture capitalist, then the new product innovation is realized by utilizing funds and new knowledge from outside and inside. We assume the new knowledge includes: private knowledge transferred from the venture capitalist, big data knowledge from a big data knowledge provider, and new knowledge of independent research and development (R&D) by this venture-backed firm itself. The total discounted expected profits (DEP) of the venture-backed firm can be calculated by the DEP before knowledge transfer and product innovation, the transfer costs, and the DEP after knowledge transfer. The capital of these three parts are affected by initial investment, learning effect, knowledge absorptive capacity, the time of knowledge transfer, discount rate, etc. The framework of the method of maximizing the present value of the expected profit of a venture-backed firm in the big data environment is as shown in Figure 2.
2.2. Model Hypotheses
Definition 1.
is a VC-backed firm,is an VC investor of, is a big data knowledge provider.needs transfer knowledge fromand. will givea contractible investment (money) with valuable knowledge.
Based on previous research (Wu et al. 2018), we give the following hypothesis.
Hypothesis 1.
will update its product with new knowledge transferred at time period. The new knowledge includes private knowledge transferred from, big data knowledge transferred from, and the innovative knowledge ofitself. The investment of VC is, and internal rate of return (IRR) of is expected to be .
Hypothesis 2.
The total market volume of the new product is, the price of the product is, and the marginal cost at the beginning of the first period is. Knowledge absorption capacity ofis. The market share ofin the starting period is. The market share of the product increases at a rate ofin the firstperiods and decreases at a rate ofin the other periods. The discount rate is.
Hypothesis 3.
The weight of knowledge transferred fromin the new product is, the weight of big data knowledge is, and the weight of independent innovation knowledge ofis.
Hypothesis 4.
The market share of the new product ofwill increase at a total growth rate of in the first periods after the entrance of VC and knowledge transfer at time period . is the growth rate of the market share of the new product of in the first periods immediately after only transfers knowledge from VC investor at time period . is the growth rate of the market share of in the first periods immediately after only transfers big data knowledge from at time period . is the growth rate of the market share of in the first periods immediately after only updates its product by using its independent new knowledge in the starting period .
Hypothesis 5.
The update rate of total new knowledge at the starting point is. The update rate of knowledge transferred fromis, the update rate of big data knowledge is, and the update rate of independent innovation knowledge ofis.
Hypothesis 6.
The cost of knowledge transfer and independent knowledge renewalis formed by the fixed costand the variable cost. The fixed cost of knowledge transferred fromis, the fixed cost of big data knowledge is, and the fixed R&D investment in the starting period is. Here, the cost ofincludes the initial investment of VC and‘s own funds. All the fixed costs are constants.
Hypothesis 7.
is the discount expected profits (DEP) ofbefore new product innovation,is the DEP ofreceived after the entrance of VC and knowledge transfer at time period, andis the cost of knowledge transfer and independent knowledge renewal. The total DEP ofis denoted asand we shall have.
Hypothesis 8.
The life cycle of the product is, andis renumbered after the entrance of VC and knowledge transfer.
3. Decision Model of VC and Knowledge Transfer in the Big Data Environment
3.1. DEP before Knowledge Transfer and New Product Innovation
Because there is no new knowledge at this stage, produces a product using prior knowledge. The DEP before knowledge transfer and innovation is calculated by sales revenue minus production costs and independent R&D investment as shown in Equation (1). The detailed calculation method of expected profits can be referred to in the research of Wu et al. (2019b).
Because VC is a gradual investment within about five years (Da Rin and Penas 2015), initial investment of VC at the starting point can be supposed to be . From Hypothesis 6, independent R&D investment includes initial investment of VC and its own funds of at the starting point . Then, independent R&D investment can be replaced by . Equation (1) can be transformed into Equation (2).
3.2. Cost of Knowledge Transfer and Innovation
From Hypotheses 3 and 6, the cost of knowledge transfer and independent innovation knowledge renewal is formed by the fixed cost and the variable cost . The fixed transfer cost can be calculated by the weight and the fixed cost of each type of knowledge. Then, the fixed cost can be calculated by Equation (3).
According to the modeling method, the weight of each type of knowledge is calculated by the profit contribution rate of each type of knowledge. Thus, can also be seen as the weight of the update rate of each type of knowledge. The update rate of total new knowledge can be obtained by Equation (4).
The variable cost is related to knowledge absorption capacity of and knowledge distance between original knowledge and new knowledge. Suppose is the coefficient of variable cost and a constant; the variable cost can be computed by Equation (5).
After discounting the fixed cost and the variable cost to the starting point, the total knowledge renewal cost can be expressed as Equation (6).
3.3. DEP after Knowledge Transfer and New Product Innovation
Suppose that are also the weights of the growth rates of the market shares of each type of knowledge. From Hypothesis 4, the total growth rate of market share can be calculated by Equation (7).
If transfers new knowledge at time period , when , the market share of in time period is . When , the market share of is . After the period of time , new knowledge begins to work on the market share of . From Hypotheses 2 and 4, the market share of will increase at a rate of in the periods immediately after time period , and it will then decay at a rate of . Hence, the market share of in period can be denoted as Equation (8).
To calculate the knowledge distance of original knowledge and new knowledge more easily, the update rate of total new knowledge is set at the starting point in Hypothesis 5. Considering the time cumulative effect, the total new knowledge at time period has been updated by , which can make the marginal cost of at time period reduce to . The knowledge absorption capacity of is . Then, the marginal cost of at time period will become . By replacing with Equation (3), the marginal cost at time period of can be calculated by Equation (9).
The total production cost in time period after the entrance of VC and knowledge transfer is . From Hypothesis 1, the investment of starts at time period , and IRR is expected to be . Then, the investment is expected to bring a benefit of value to at time period after the entrance of VC. By subtracting the total production cost and the expected benefit of VC from the sales revenue and discounting the profits in time period to the starting point by multiplying , the DEP after the entrance of VC and knowledge transfer is as shown in Equation (10).
Substitute in Equation (10) by using Equation (8); the DEP after the entrance of VC and knowledge transfer can be expressed as Equation (11).
3.4. Total DEP of a Venture-Backed Firm
According to the method of maximizing the present value of the expected profit of the new product of a venture-backed firm, the optimal time of the exit of VC and knowledge transfer is to find the maximum of the total DEP of for the given parameters. Therefore, the decision-making model of the entrance of VC and knowledge transfer can be expressed as Equation (12).
4. Simulation Experiments
4.1. Model Solution and Parameter Setting
is a piecewise continuous differential function of . Therefore, we can find the maximum of in a closed interval , which is the maximum profits in the life cycle of the product. Then, the optimal time of the entrance of VC and knowledge transfer can be obtained.
According to a previous research model of knowledge transfer in a big data environment, some parameters are set at the same values as follows. The total product sales ; the price of per unit product ; the marginal cost at the beginning period ; total market volume of increases in the first period; the natural attenuation rate of market volume ; the market share of in the starting period ; the knowledge absorption capacity ; the discount rate is 10% and ; the variable cost coefficient ; the fixed transfer cost of the big data knowledge ; the update rate of private knowledge of venture capitalist ; and the update rate of big data knowledge (Farzin et al. 1998; Xu and Zhang 2001; Doraszelski 2004; Huang et al. 2004; Dai and Xu 2007; Wu et al. 2018).
The above parameters are in the context of a technological innovation network. In a different environment, the parameters should be adjusted accordingly. According to the survey data of the market share of high-tech enterprises by DisplaySearch, the market share of some small firms is less than 0.5%, while the market share of some large firms is over 38.3%. The average market share of the household appliance market in China was 8.54% from January 2000 to March 2002 (Huang et al. 2004). Therefore, the market share is set at the average market level of 8%. The assumption of knowledge absorptive capacity and knowledge update rate in the network is based on the previous research conclusion of Dai and Xu (2007). In particular, the type of knowledge in this paper is the synthesis of several types of similar knowledge, and the update rates of these types of similar knowledge are different. Conservatively, the reduction of marginal cost caused by that type of knowledge is assumed to be 12%, so the knowledge update rate is set as 88%. According to the neutral risk supposition of Xu and Zhang (2001), the discount rate is set at 10%, and . Therefore, the above parameters are reasonable.
Because the context of knowledge transfer has changed, new values need to be assigned to these new parameters. The values of these new parameters are obtained by adjusting and fitting the existing parameters in the computer program. In the big data environment, the product life cycle becomes shorter and the pace of product renewal accelerates (Wu et al. 2019a), and VC firms need to exit portfolio companies within about five years from the investment to generate returns for institutional investors (Da Rin and Penas 2015). Therefore, we suppose the life cycle of the product , and the total market volume of increases in the first period after the entrance of VC and knowledge transfer. Suppose the total investment of VC . The own funds of in independent R&D investment . The reason is that the fund of VC is not fully invested in the first stage, but by installments. VC firms usually exit portfolio companies within about five years, so a VC firm is assumed to be paid in 5 years (Da Rin and Penas 2015). Then, the average annual VC investment is 300. The average annual VC plus the independent R&D investment , and the total R&D investment in the first stage is 500, which is consistent with the previous research assumption (Wu et al. 2019b). The fixed cost includes a cost of patented knowledge and non-patented knowledge of (e.g., information transmission, opportunity cost of time, effort, or lower expected returns on its investment in other portfolio firms) (González-Uribe 2014; Pahnke et al. 2014), so let . Let the growth rate of the market share of in the first after only transfers knowledge from the venture capitalist ; the growth rate of the market share of in the first periods immediately after only transfers the big data knowledge . Let the update rate of independent innovation knowledge . Innovative start-ups often produce products with valuable new knowledge, so the independent innovation knowledge is important for a new product. Let , and , which means that the proportion of knowledge transferred from the venture capitalist is 20%, the proportion of knowledge transferred from the big data knowledge provider is 20%, and the proportion of independent innovation knowledge is 60%.
4.2. Simulation Experiment
4.2.1. Simulation with IRR
IRR has been used for years by economists to estimate the profitability (or potential profitability) of projects, and its definition is rooted in procedures of discounted cash flow (Mellichamp 2017). The calculation of IRR from Douglas (1988) exhibits IRR = 22.1%, so we use IRR in this paper.
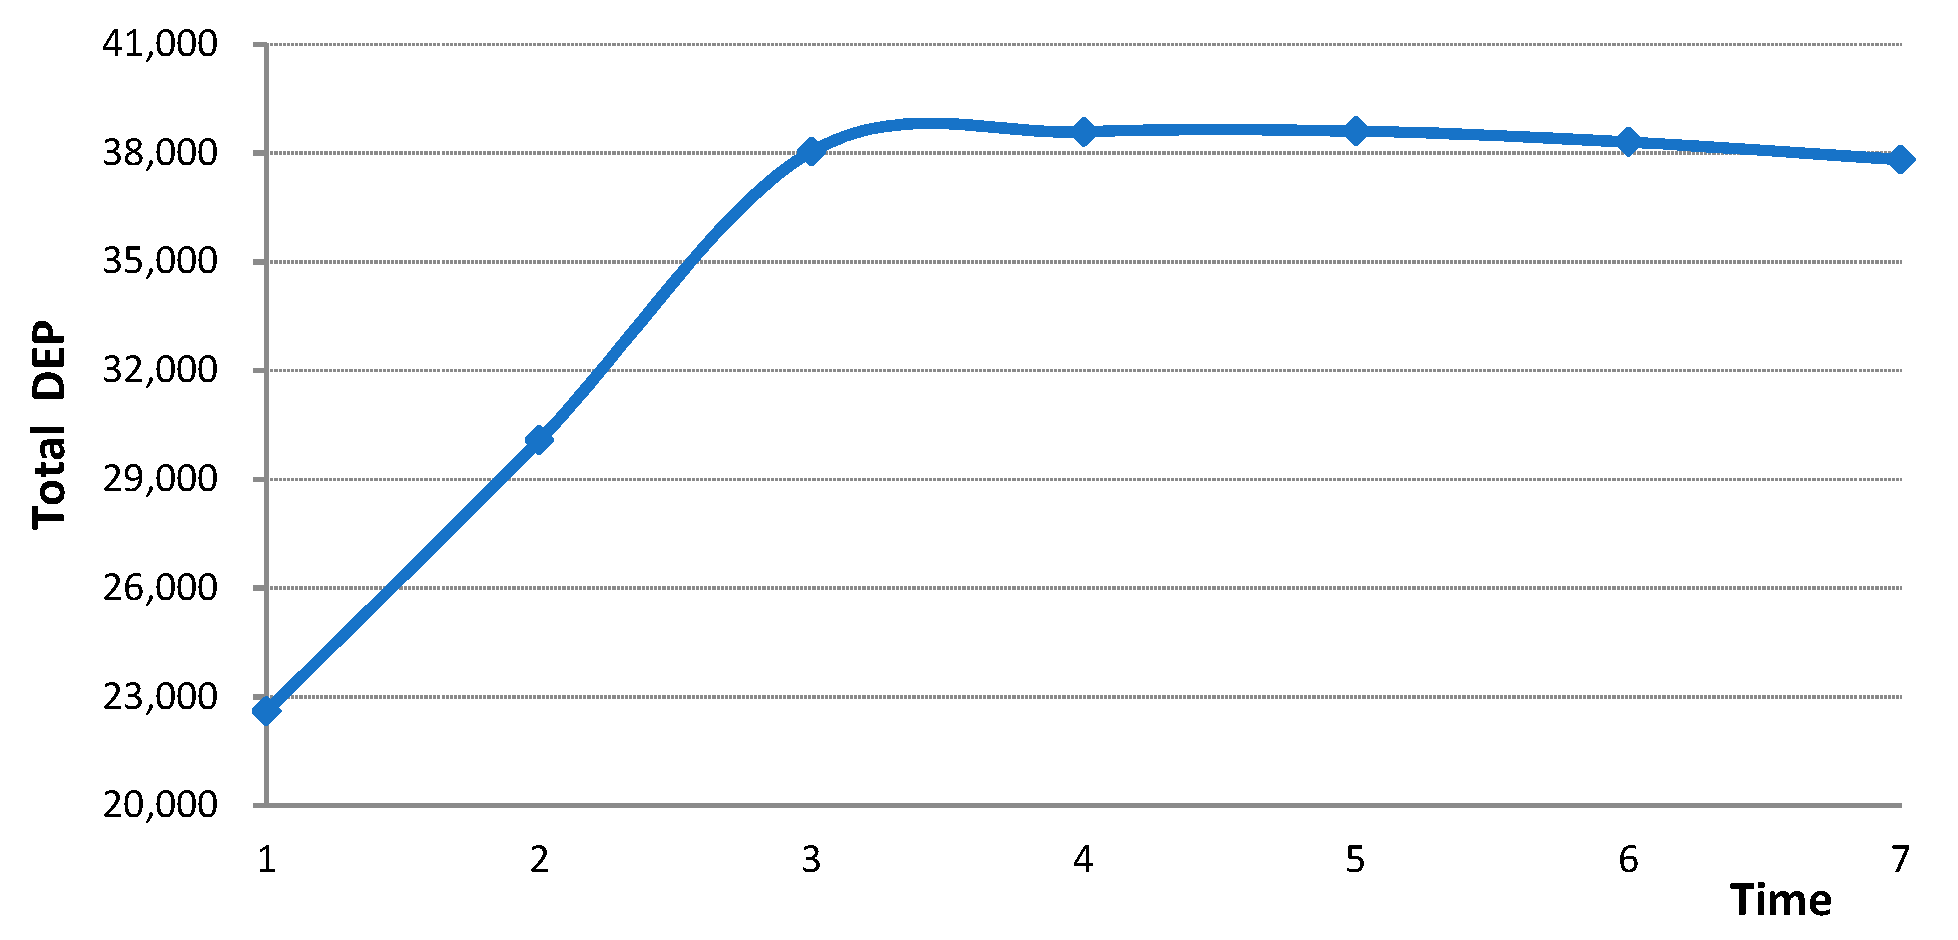
Venture capitalists always select firms with high growth potential and bring them to success (Da Rin and Penas 2015). At the same time, most venture capitalists ask for a profit share of 20% if an investment is profitable, so let the growth rate of the market share of in the first periods before knowledge transfer and new product innovation , and let the growth rate of the market share of in the first periods immediately after only updates its new product by using independent innovation knowledge in the starting period . Figure 3 shows changes of the total DEP of . The total DEP reaches its maximum at , which means that the innovation performance of brought by VC and knowledge transfer is the most beneficial at the fifth year. This can also explain why venture capitalists exit portfolio companies and realize a capital gain within about five years by bringing venture-backed firms public or having it acquired (Da Rin and Penas 2015). The experimental results are consistent with the actual economic situation, and the model is valid.
4.2.2. Simulation with the Scale of Investment
Adjust the total investment of from 1500 to 2000, and then from 2000 to 2500, which means increases the scale of its investment. It can be seen from Figure 4 that the total DEP of becomes smaller and the time of the total DEP reaching its maximum remains the same. This result shows that increasing the scale of VC within a certain level of technical knowledge cannot help a venture-backed firm to improve its innovation performance, but can increase the burden of cost. From the perspective of venture capitalists, the optimal exit time of VC remains unchanged. Therefore, the scale of VC has little effect on the exit time of VC.
4.2.3. Simulation with
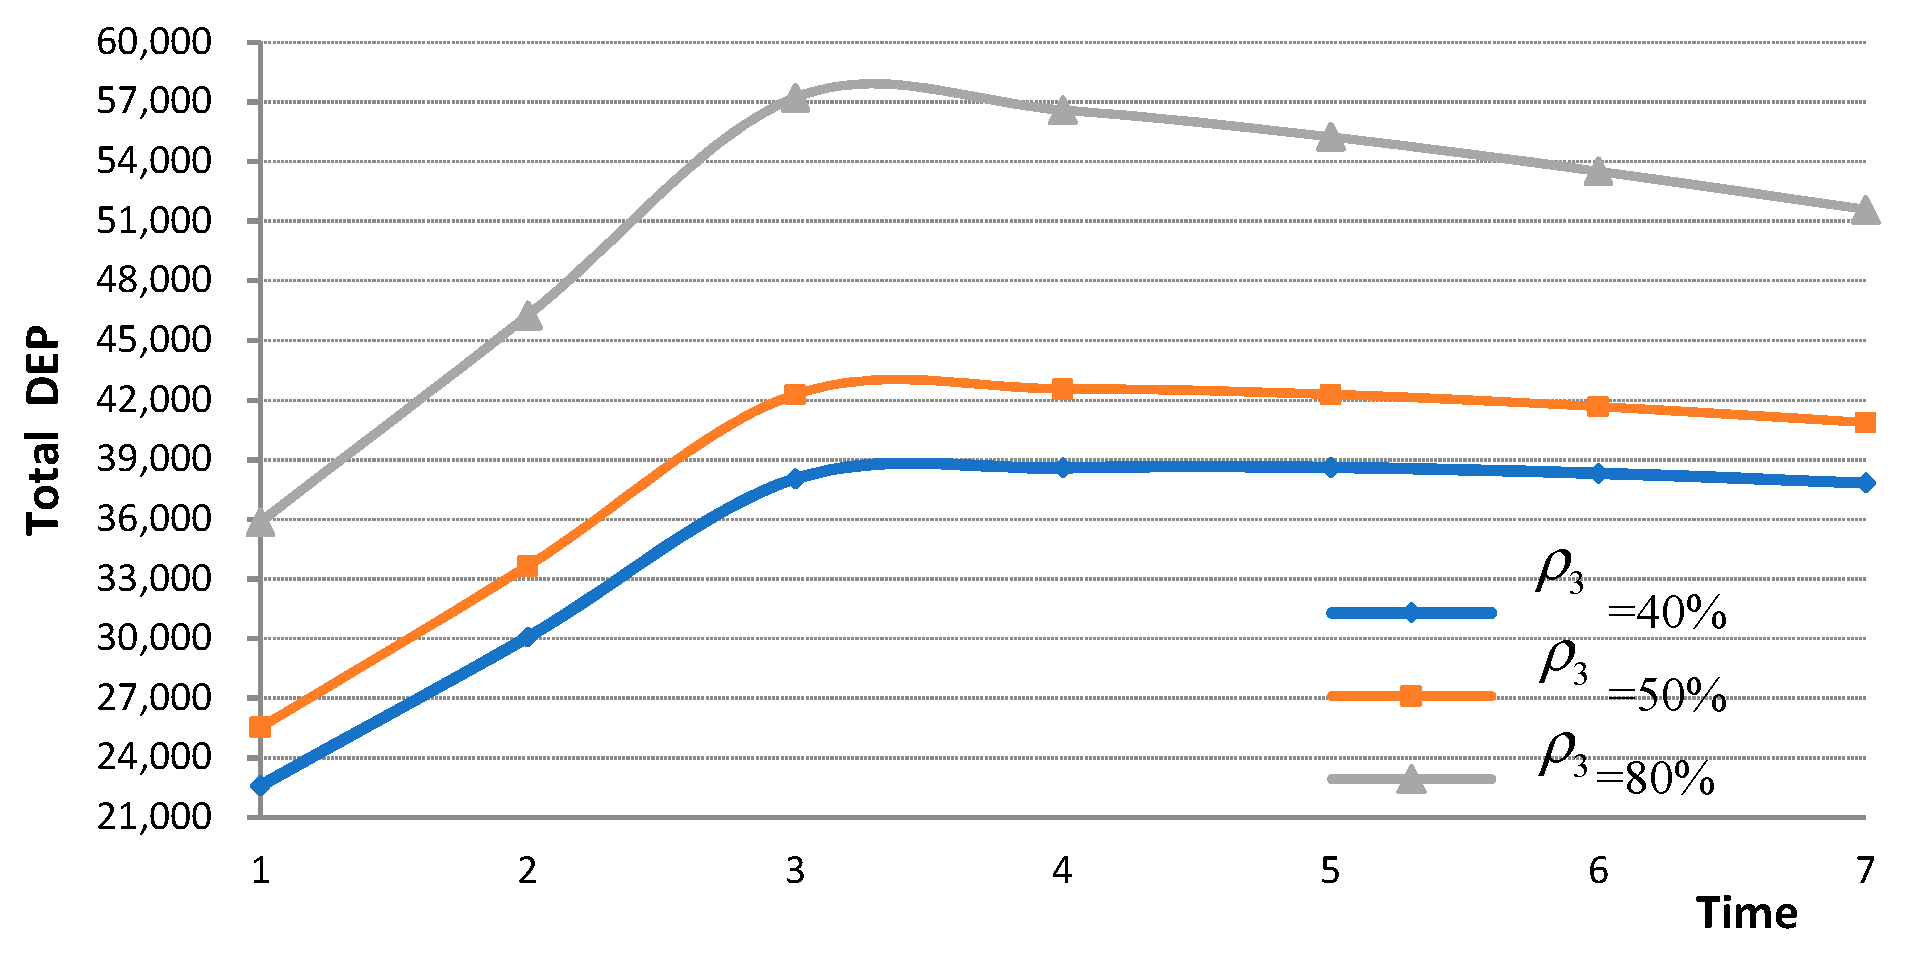
Although most venture capitalists require a profit of about 20% from a project, the important issue is not whether a project will make a profit, but prospectively whether it will make enough money in early years to return the capital invested. The reason is that not every investment returns all the capital invested, some even do not return any portion of it (Mellichamp 2017). Thus, let (the growth rate of the market share of in the first periods immediately after only updates its product by using its independent new knowledge in the starting period) change from 40% to 50%. We can see that the total DEP becomes larger and the time of the total DEP reaches its maximum changes from to in Figure 5. The time of maximum innovation performance brought by VC and knowledge transfer becomes earlier, and a venture capitalist can realize its capital gain from VC earlier. Then, if we change from 50% to 80%, the time of the total DEP reaching its maximum changes from to in Figure 5. It can be concluded that if the independent innovation knowledge of a firm is expected to bring a high growth rate of market share in the future, a venture capitalist will obtain its capital gain earlier. This model can help venture capitalists to determine the payback period of their VC. This model can also help innovative start-ups to predict the performance of new product development performance, and to illustrate the value and prospects of a project to attract investment in their business prospectus.
4.2.4. Simulation with
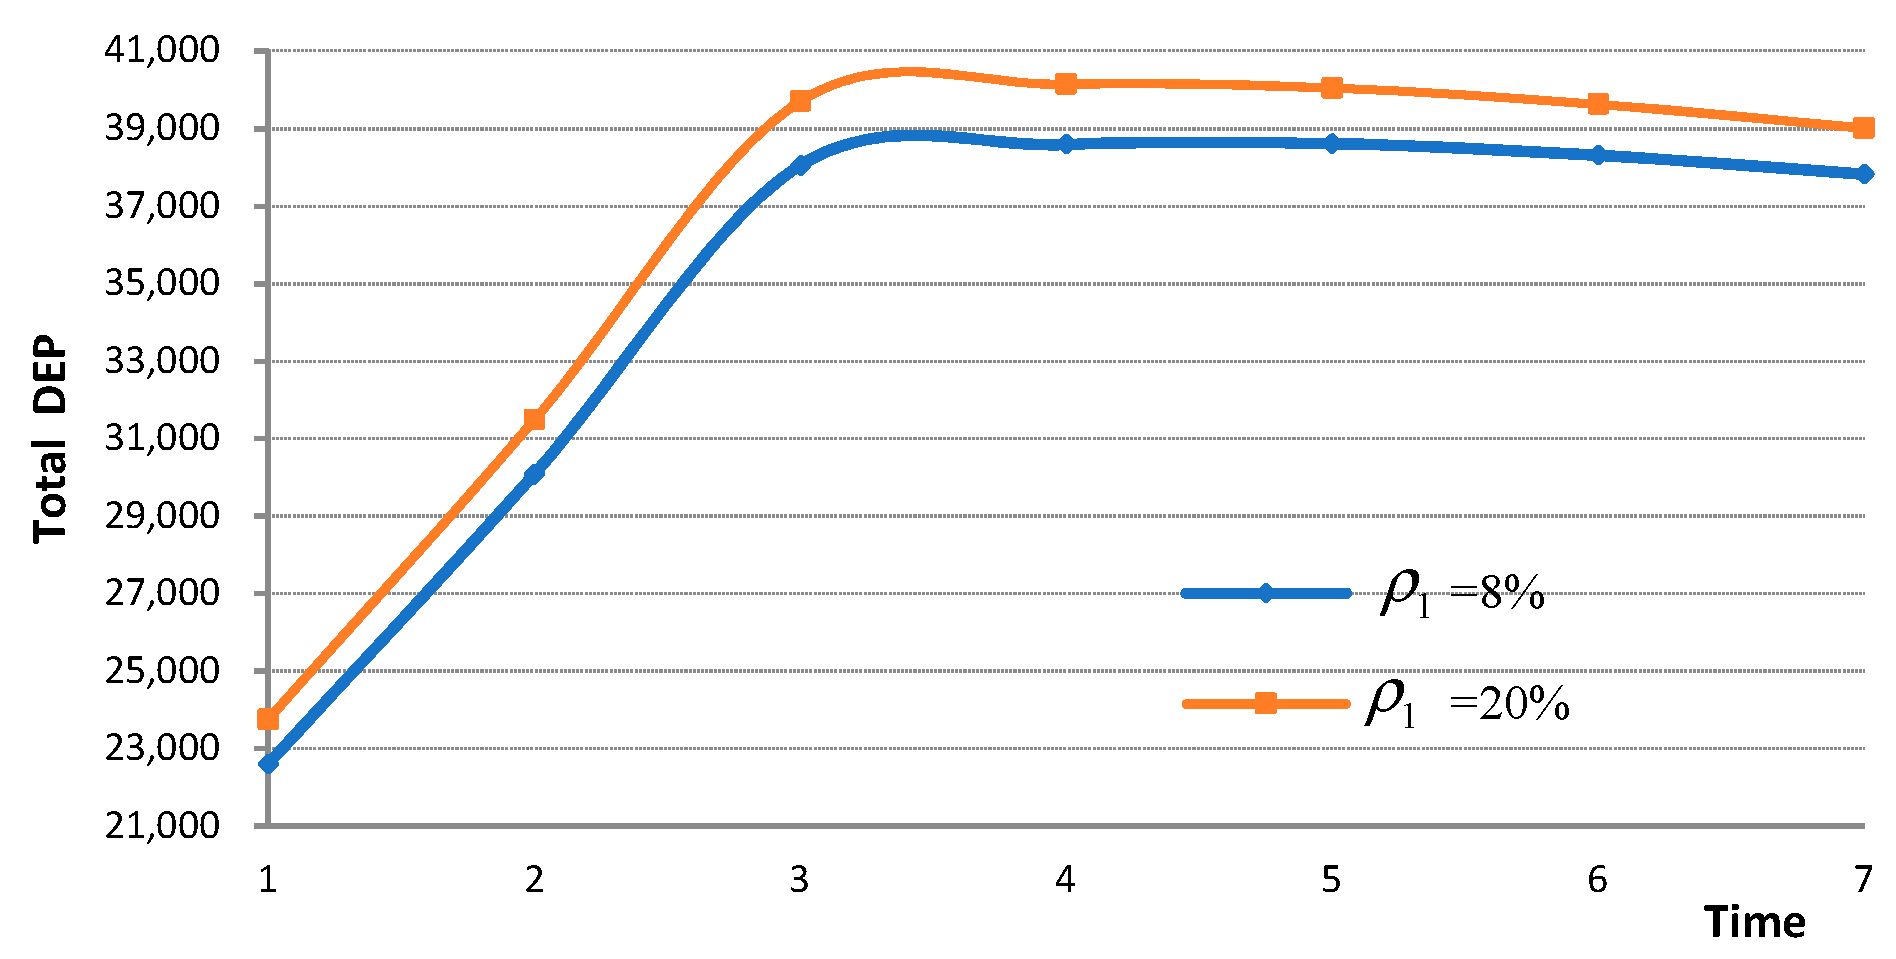
Let (the growth rate of the market share of new product of in the first periods immediately after only transfers knowledge from the VC investor at time period ) change from 8% to 20%, the total DEP of will increase, and the optimal exit time of VC changes from to in Figure 6. It means that if the private knowledge of venture capitalists is expected to bring a high growth rate of the market share of their invested firms, potential venture-backed firms will adopt VC and the private knowledge of venture capitalists earlier. The reason is that venture capitalists have abundant information resources in related industries that can help venture-backed firms obtain important information related to technological innovation. Thus, the technological innovation ability of these firms can be improved, and new product innovation will be realized earlier.
4.2.5. Simulation with the Weight of Each Type of Knowledge
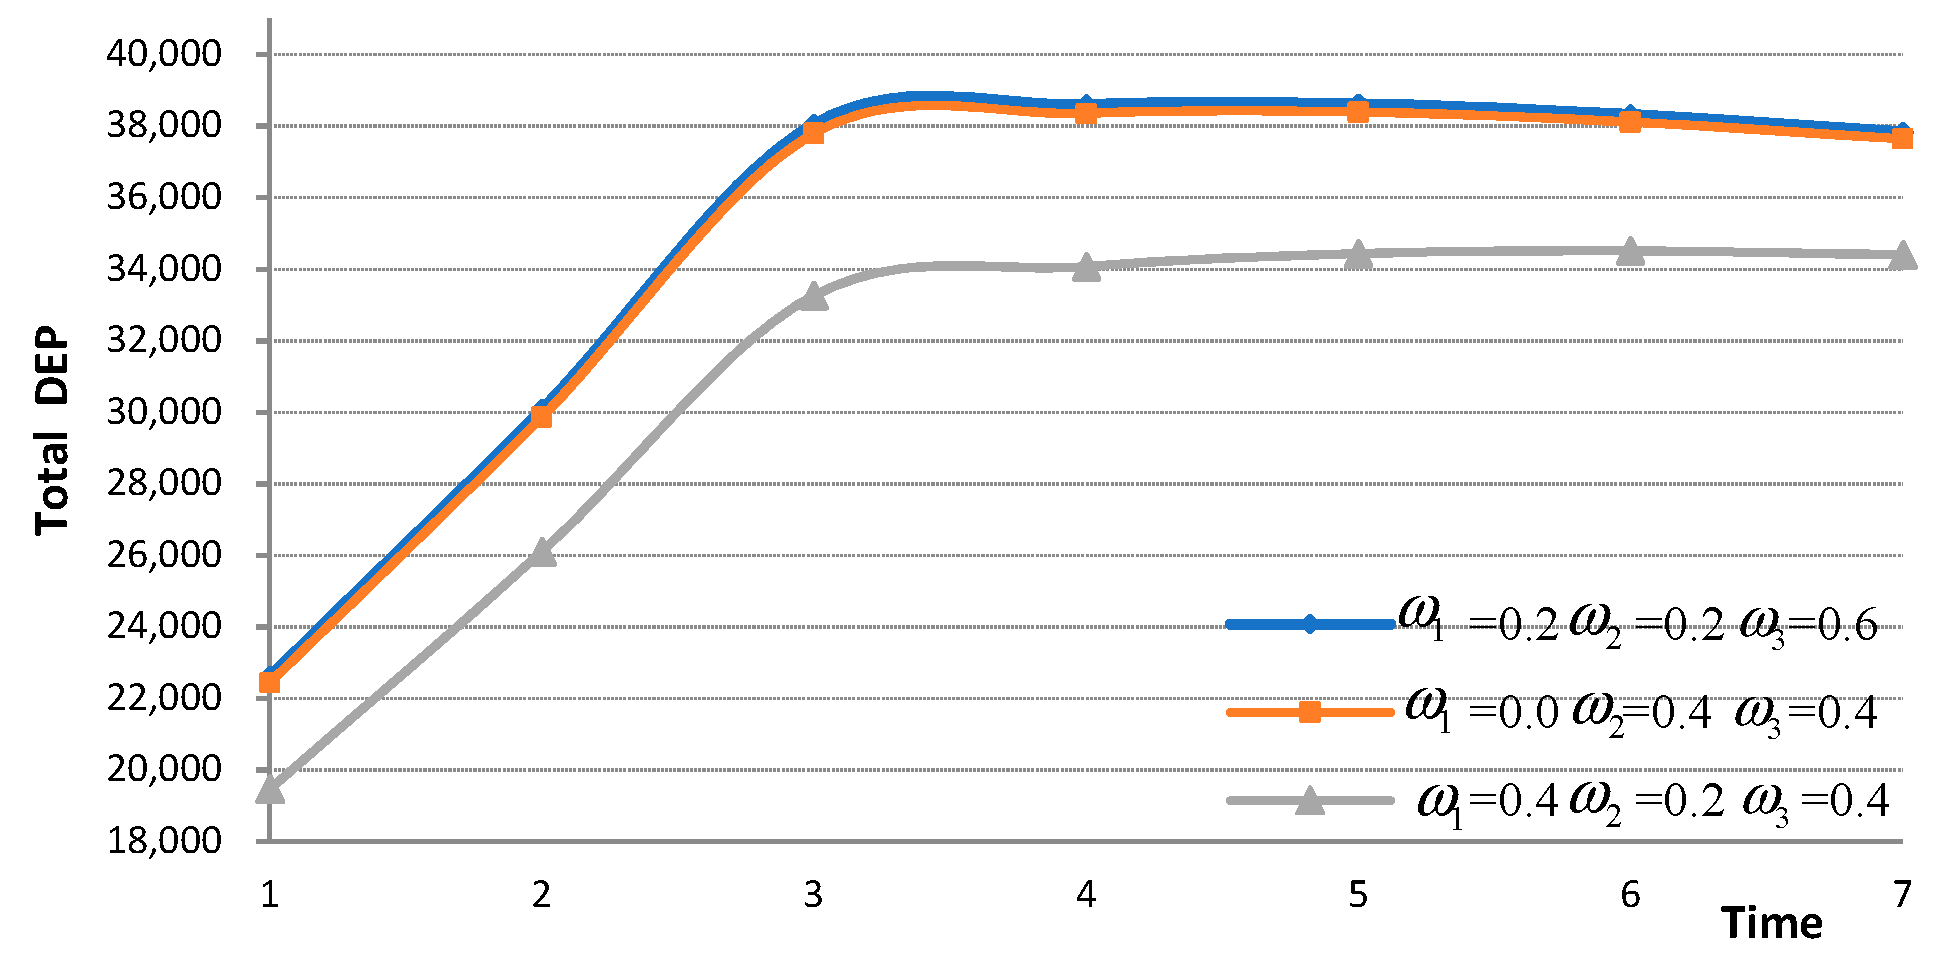
Change the weights of knowledge transferred from the venture capitalist, big data knowledge, and independent innovation knowledge from to , which means that venture-backed firms will not transfer knowledge from venture capitalists, but will buy these types of knowledge from a big data knowledge provider. From the experimental results in Figure 7, the total DEP declines a little and the optimal time of knowledge transfer and new product innovation stays the same. It can be concluded that although the fixed cost of the big data knowledge is smaller than the private knowledge of venture capitalists, the private knowledge of venture capitalists is more efficient. The reason is that firms, especially innovative start-ups, will stagnate technological innovation at a certain stage because of their knowledge level limitations, which indirectly increases the cost of technological innovation. Venture capitalists can help firms improve the efficiency of strategic and operational decision-making or directly dispatch professionals to help firms carry out technological innovation, and the efficiency of technological innovation can be significantly improved.
Let the weights of these three types of knowledge change from to ; it can be seen from the simulation results in Figure 7 that the total DEP declines sharply and the optimal time of the exit of VC and knowledge transfer changes from to . The reason is that although the private knowledge of investors is much more important for the innovation of a venture-backed firm, if the firm relies too much on the knowledge from a venture capitalist and the proportion of independent innovation knowledge is smaller in new products, the payback period of the venture capitalist will be extended, and the total DEP of the venture-backed firm will be greatly reduced.
5. Conclusions
This paper analyzed the importance of VC and knowledge transfer to technological innovation in the big data environment. We developed a model to study the influences of VC and knowledge transfer on innovation performance of VC-backed firms in such an environment. Our analysis takes fully into account the benefit from VC finance and the types of innovative knowledge that the VC-backed firms need for new product development. The result shows that the private knowledge transferred from venture capitalists can improve the technological innovation ability of VC-backed firms, and venture capitalists will select an innovative firm with higher efficiency and a higher proportion of independent innovation knowledge earlier to compensate for the known and unknown risks the investments will be exposed to. This model is in line with the actual economic situation, and the model is valid. The model can help venture capitalists to determine the scale and exit time of their investment and predict IRR. This model can also help innovative start-ups to illustrate the value and prospects of a project to attract investment in their business prospectus.
Our research carries several important implications. First of all, our model can help venture capitalists to determine the scale and payback period of VC and predict IRR. The model can also help innovative start-ups to predict the performance of new product development, and to illustrate the value and prospects of a project to attract investment from venture capitalists in their business prospectus. Secondly, our research shows that increasing the scale of VC within a certain level of technical knowledge cannot help a venture-backed firm to improve its innovation performance, but can increase the burden of cost. From the perspective of venture capitalists, the optimal exit time remains unchanged with the increase of VC investment. Therefore, the scale of VC has little effect on the exit time. Thirdly, the experimental results show that although the private knowledge of investors is beneficial for the innovation of venture-backed firms, relying too much on the knowledge from venture capitalists will make venture-backed firms develop less independent innovation knowledge in new products. Consequently, the payback period of venture capitalists will be extended, and the total DEP of venture-backed firms will be greatly reduced. The result implies that venture capitalists should not transfer too much knowledge to innovative start-ups, and they should encourage these firms to carry out independent innovation. Meanwhile, innovative start-ups can use the model in this paper to determine the proper weight of different types of knowledge in new product innovation.
However, due to the complexity of the VC funding process and knowledge transfer, the simplified model in this paper is subjected to a few limitations. First, we assume that the private knowledge from venture capitalists and the big data knowledge are transferred simultaneously to venture-backed firms. However, this assumption is not true in the real world. Future research can relax this assumption to allow different types of knowledge transferring at different time points. Second, the influence of private knowledge from venture capitalists on the innovation performance of venture-backed firms is only considered as a one-time knowledge transfer. Actually, knowledge transfer exists in different stages of the new venture funding process. Future research can examine how the roles of private knowledge from venture capitalists play at different stages. In addition, we only consider the benefits of knowledge transfer from venture capitalists, not the reverse effects of knowledge transfer from venture-backed firms to venture capitalists. Future research can take into account the reverse effects of the knowledge transfer process and incorporate it as the benefit that venture capitalists can receive from venture-backed firms. For example, the innovative ideas from venture-based firms could be used by the other portfolio companies of a venture capitalist.
Author Contributions
Conceptualization, C.W. and X.Y.; methodology, C.W.; software, C.W.; validation, C.W., X.Y. and M.E.M.; formal analysis, C.W.; investigation, V.L.; resources, C.W.; data curation, C.W.; writing—original draft preparation, C.W. and V.L.; writing—review and editing, X.Y.; visualization, C.W.; supervision, M.E.M.; project administration, C.W.; funding acquisition, C.W.
Funding
This research was funded by [the National Natural Science Foundation of China] grant number [71704016], and [the Key Scientific Research Fund of Hunan Provincial Education Department of China] grant number [19A006].
Acknowledgments
This research was supported by the National Natural Science Foundation of China, grant number 71704016, the Key Scientific Research Fund of Hunan Provincial Education Department of China, grant number 19A006, and Key Projects of Chinese Ministry of Education, grant number 17JZD022.
Conflicts of Interest
The authors declare no conflict of interest.
References
- Bottazzi, Laura, Marco Da Rin, and Thomas Hellmann. 2008. Who are the active investors? Evidence from venture capital. Journal of Financial Economics 89: 488–512. [Google Scholar] [CrossRef] [Green Version]
- Bottazzi, Laura, Marco Da Rin, and Thomas Hellmann. 2009. What role of legal systems in financial intermediation? Theory and evidence. Journal of Financial Intermediation 18: 559–98. [Google Scholar] [CrossRef] [Green Version]
- Cassiman, Bruno, and Reinhilde Veugelers. 2006. In search of complementarity in innovation strategy: Internal R&D and external knowledge acquisition. Management Science 52: 68–82. [Google Scholar]
- Da Rin, Marco, and María Fabiana Penas. 2015. Venture capital and innovation strategies. Industrial and Corporate Change 2: 1–17. [Google Scholar]
- Dai, Hongkun, and Jiuping Xu. 2007. Optimal model of technology adoption time with learning effect and its simulation. Journal of Management Sciences in China 5: 21–27. [Google Scholar]
- Dessi, Roberta, and Nina Yin. 2015. Venture capital and knowledge transfer. TSE Working Papers 27: 51–54. [Google Scholar] [CrossRef] [Green Version]
- Doraszelski, Ulrich. 2004. Innovations, improvements and the optimal adoption of new technology. Journal of Economic Dynamics and Control 28: 1461–80. [Google Scholar] [CrossRef]
- Douglas, James M. 1988. Conceptual Design of Chemical Processes. New York: McGraw-Hill, pp. 1–601. [Google Scholar]
- Engelen, Andreas, Harald Kube, Susanne Schmidt, and Tessa Christina Flatten. 2014. Entrepreneurial orientation in turbulent environments: The moderating role of absorptive capacity. Research Policy 43: 1353–69. [Google Scholar] [CrossRef]
- Farzin, Y. Hossein, Kuno J. M. Huisman, and Peter M. Kort. 1998. Optimal timing of technology adoption. Journal of Economic Dynamics and Control 22: 779–99. [Google Scholar] [CrossRef] [Green Version]
- Gonzalez-Uribe, Juanita. 2014. Venture capital and the diffusion of knowledge. SSRN Electronic Journal 1: 1–95. Available online: https://www.ixueshu.com/document/2414547eb9a2e132318947a18e7f9386.html (accessed on 16 September 2019). [CrossRef]
- Hall, Bronwyn H., Adam Jaffe, and Manuel Trajtenberg. 2005. Market value and patent citations. RAND Journal of Economics 36: 16–38. [Google Scholar]
- Helmers, Christian, Manasa Patnam, and P. Raghavendra Rau. 2017. Do board interlocks increase innovation? Evidence from a corporate governance reform in India. Journal of Banking & Finance 80: 51–70. [Google Scholar]
- Hirukawa, Masayuki, and Masako Ueda. 2011. Venture Capital and Innovation: Which is first? Pacific Economic Review 16: 421–65. [Google Scholar] [CrossRef]
- Horst, Peter, and Robert Duboff. 2015. Don’t let big data bury your brand. Harvard Business Review 93: 78–86. [Google Scholar]
- Huang, Jinsong, Ping Zhao, Gao Wang, and Qibin Lu. 2004. Market share research based on customer orientation. Chinese Journal of Management Science 12: 96–101. [Google Scholar]
- Jain, Bharat A. 2001. Predictors of performance of venture capitalist-backed organizations. Journal of Business Research 52: 223–33. [Google Scholar] [CrossRef]
- Koman, Gabriel, and Jana Kundrikova. 2016. Application of big data technology in knowledge transfer process between business and academia. Procedia Economics & Finance 39: 605–11. [Google Scholar]
- Kortum, Samuel S., and Josh Lerner. 1998. Assessing the contribution of venture capital to innovation. RAND Journal of Economics 31: 674–92. [Google Scholar]
- Lerner, Josh. 1995. Venture capitalists and the oversight of private firms. Journal of Finance 50: 301–18. [Google Scholar] [CrossRef]
- McGuire, Tim, James Manyika, and Michael Chui. 2012. Why big data is the new competitive advantage. Ivey Business Journal 76: 1–4. [Google Scholar]
- Mellichamp, Duncan A. 2017. Internal rate of return: Good and bad features, and a new way of interpreting the historic measure. Computers and Chemical Engineering 106: 396–406. [Google Scholar] [CrossRef]
- Mollica, Marcos A., and Luigi Zingales. 2007. The Impact of Venture Capital on Innovation and the Creation of New Businesses. Available online: http://conference.nber.org/confer/2007/ENTf07/luigi.pdf (accessed on 16 September 2019).
- Pahnke, Emily Cox, Rory McDonald, Dan Wang, and Benjamin Hallen. 2014. Exposed: Venture capital, competitor ties, and entrepreneurial innovation. Academy of Management Journal 58: 1334–36. [Google Scholar] [CrossRef]
- Popov, Alexander, and Peter Rosenboom. 2009. Does Private Equity Investment Spur Innovation? Evidence from Europe. Working Paper, No. 1063. Available online: https://core.ac.uk/download/pdf/6601640.pdf (accessed on 16 September 2019).
- Rosenbusch, Nina, Jan Brinckmann, and Verena Müller. 2013. Does acquiring venture capital pay off for the funded firms? A meta-analysis on the relationship between venture capital investment and funded firm financial performance. Journal of Business Venturing 28: 335–53. [Google Scholar] [CrossRef]
- Rymkul, Ismailova, Amina Mussina, and Nurgul Ismagulova. 2015. Venture capital as a source of innovation’s financing. Australian Journal of Basic and Applied Sciences 9: 120–24. [Google Scholar]
- Sahlman, William, and Michael Gorman. 1989. What do venture capitalists do? Journal of Business Venturing 4: 231–48. [Google Scholar]
- Smolarski, Jan, and Can Kut. 2011. The impact of venture capital financing method on SME performance and internationalization. International Entrepreneurship and Management Journal 7: 39–55. [Google Scholar] [CrossRef]
- Wadhwa, Anu, Corey Phelps, and Suresh Kotha. 2016. Corporate venture capital portfolios and firm innovation. Journal of Business Venturing 31: 95–112. [Google Scholar] [CrossRef]
- Weber, Barbara, and Christiana Weber. 2007. Corporate venture capital as a means of radical innovation: Relational fit, social capital, and knowledge transfer. Journal of Engineering and Technology Management 24: 11–35. [Google Scholar] [CrossRef]
- Wu, Chuanrong, and Feng Li. 2019. Multi-objective fuzzy optimization of knowledge transfer organizations in big data environment. International Journal of Embedded Systems 11: 419–26. [Google Scholar] [CrossRef]
- Wu, Chuanrong, Evgeniya Zapevalova, and Deming Zeng. 2019a. Optimization model of price change after knowledge transfer in the big data environment. International Journal of Computational Science and Engineering 19: 284–92. [Google Scholar] [CrossRef]
- Wu, Chuanrong, Evgeniya Zapevalova, Yingwu Chen, and Feng Li. 2018. Time optimization of multiple knowledge transfers in the big data environment. Computers Materials & Continua 54: 269–85. [Google Scholar]
- Wu, Chuanrong, Veronika Lee, and Mark E. McMurtrey. 2019b. Knowledge composition and its influence on new product development performance. Computers Materials & Continua 60: 365–78. [Google Scholar]
- Xu, Minli, and Zigang Zhang. 2001. Application of real options theory to R&D project evaluation. Systems Engineering 1: 10–14. [Google Scholar]
- Yang, Xiaoming, Sunny Li Sun, and Haibin Yang. 2015. Market-based reform, synchronization and product innovation. Industrial Marketing Management 50: 30–39. [Google Scholar] [CrossRef]
Figure 1.
Conceptual model for venture capital (VC) and knowledge transfer in the big data environment. DEP: discounted expected profits.
Figure 1.
Conceptual model for venture capital (VC) and knowledge transfer in the big data environment. DEP: discounted expected profits.

Figure 2.
Framework of maximum expected profit method.

Figure 3.
Changes of total DEP with internal rate of return (IRR) .

Figure 4.
Changes of total DEP with .

Figure 5.
Changes of total DEP with .

Figure 6.
Changes of total DEP with .

Figure 7.
Changes of total DEP with weight of each type of knowledge.

© 2019 by the authors. Licensee MDPI, Basel, Switzerland. This article is an open access article distributed under the terms and conditions of the Creative Commons Attribution (CC BY) license (http://creativecommons.org/licenses/by/4.0/).
Share and Cite
MDPI and ACS Style
Wu, C.; Yang, X.; Lee, V.; McMurtrey, M.E. Influence of Venture Capital and Knowledge Transfer on Innovation Performance in the Big Data Environment. J. Risk Financial Manag. 2019, 12, 188. https://doi.org/10.3390/jrfm12040188
AMA Style
Wu C, Yang X, Lee V, McMurtrey ME. Influence of Venture Capital and Knowledge Transfer on Innovation Performance in the Big Data Environment. Journal of Risk and Financial Management. 2019; 12(4):188. https://doi.org/10.3390/jrfm12040188
Chicago/Turabian StyleWu, Chuanrong, Xiaoming Yang, Veronika Lee, and Mark E. McMurtrey. 2019. "Influence of Venture Capital and Knowledge Transfer on Innovation Performance in the Big Data Environment" Journal of Risk and Financial Management 12, no. 4: 188. https://doi.org/10.3390/jrfm12040188