Article

The Effect of Risk, R&D Intensity, Liquidity, and Inventory on Firm Performance during COVID-19: Evidence from US Manufacturing Industry

1
Department of Management and Marketing, Texas A&M University-Corpus Christi, Corpus Christi, TX 78412, USA
2
Department of Management and Marketing, Augusta University, Augusta, GA 30912, USA
*
Author to whom correspondence should be addressed.
J. Risk Financial Manag. 2021, 14(10), 499; https://doi.org/10.3390/jrfm14100499
Submission received: 20 September 2021 / Revised: 6 October 2021 / Accepted: 13 October 2021 / Published: 18 October 2021

Abstract

:
Because prior knowledge may not generalize to the COVID-19 setting, scholars are racing to test the efficacy of existing theoretical frameworks during COVID-19. Most business studies are conceptual or surveys of damage. The main purpose of the paper is to extend the forthcoming stream that tests firm performance by examining it during COVID-19. We examine the sales growth of 1298 US manufacturers during COVID-19 compared to their pre-COVID-19 baselines. Riskier firms with higher R&D intensities performed better during COVID-19, especially when cash-to-inventory levels were low. This study is among the first to empirically identify actionable predictors of firm performance during COVID-19 via a quantitative analysis of strategies and performance outcomes. Understanding what type of firms perform at higher levels during COVID-19 will help decision makers make more informed decisions moving forward. Employing ordinary least squares (OLS) regression to test our hypotheses, our findings suggest that R&D intensive firms should pivot tactically regarding current asset management, if needed, but not strategically, while prioritizing inventory versus cash retention. The positive effect of inventory versus cash extends theory by suggesting a new boundary condition related to pandemics that reverses the positive link between cash and performance found during crises with more conventional levels of turbulence. Our most important contribution, however, is practical, via the testing of predictors that can help firms during COVID-19. For example, we found that firms with higher levels of operating risk experienced 60 percent more sales growth than risk-averse firms. This knowledge that risk-taking predicted performance during COVID-19 (especially when coupled with a focus on R&D intensity and inventory level) may encourage those that can adopt less risk-averse strategies, while others focus on tactical adjustments or mitigative measures during COVID-19 and future black swan events.

1. Introduction

On 9 January 2020, the World Health Organization announced the existence of a novel coronavirus. Around the world, governments enacted quarantines and travel restrictions. COVID-19 was formally recognized as a global crisis, and its ultimate toll on the global economy was severe and pervasive. Ozili and Arun (2020) documented its impact from January to April 2020, noting that global stock markets erased USD 6 trillion of wealth during one week in February alone, before describing supply chain shutdowns and recessions projected to be as severe as 2007–2008’s global financial crisis. In line with others (Irdina et al. 2020; Kumar et al. 2021; Kee et al. 2021), they then detailed COVID-19′s damage to the global travel, healthcare, energy, education, and finance industries. Yue and Cowling (2021) document the plight of employees and self-employed workers in the UK. In the USA, most businesses experienced sizable demand drops, 36% experienced supply shortfalls, 11% had trouble moving goods from production to markets, and a majority told employees to stay at home at least once, with roughly half of these employees losing salaries and employer-sponsored health insurance (US Bureau of Labor Statistics 2020).
Former Reuters European Affairs and current Politico editor, Paul Taylor (2021, p. 1) predicted that “Despite the arrival of the first vaccines against the coronavirus and the first disbursements from the EU’s big, fat recovery fund, the Continent is set for another annus horribilis of periodic lockdowns, stop-go restrictions on socializing and travel, mounting business failures, soaring unemployment, loan defaults and lingering economic uncertainty”. Magnus Nicolin, CEO of medical manufacturer Ansell, similarly warns that we must expect a new world characterized by “stop-start” economies, as “we’re going to be talking not just about COVID-19, but COVID-22 and COVID-24” (Evans 2021, p. 1).
Studies are generally conducted during conventional times. They are also conducted under more conventionally abnormal conditions (e.g., economic crises or natural disasters). COVID-19, however, has caused a once-in-a-lifetime global pandemic that leaves us uncertain about how to react in a world of unknown unknowns, where past guidance may or may not generalize to our current setting. It is no surprise, then, that scholars across all areas of science are racing to generate guidance whose efficacy has been validated during COVID-19. Business studies have been conducted, but due to its recency, this literature is dominated by conceptual papers (e.g., analogies from adjacent literatures) and empirical studies that are either qualitative, or quantitative analyses of damage rather than tests of performance during COVID-19. In other words, there is a critical shortage of studies that quantitatively test firm performance predictors during COVID-19, especially with respect to those comparing performance variables during COVID-19 with matched (or even unmatched) pre-COVID-19 baselines. The primary purpose of this study is to be among the first to fill this gap.
The cost of not knowing what predicts performance is substantial. Many businesses around the world are struggling and need assistance. Unfortunately, guidance drawn from pre-COVID-19 studies may or may not generalize to the COVID-19 setting. Another consideration is the possibility of spillover effects, as economic performance is impacted by organizational performance, and when firms suffer, employees and investors suffer, and pressure is added to already stressed government benefit systems. To examine performance drivers during COVID-19, we synthesize several literatures to form premises that suggest empirically testable hypotheses. Our main premise is that the types of strategies that outperform more conservative ones when industry dynamism and turbulence are high may be logical candidates to test during settings characterized by extreme turbulence, when uncertainties are unknown and risks less quantifiable. The broader scientific community displays an urgent and unwavering commitment to test the efficacy of guidance that might help today. It is critical that business researchers conduct similar tests of efficacy.
To test our hypotheses, we conduct various ordinary least squares (OLS) regression analyses, using five years of data from a sample of 1298 US manufacturing firms to compare the effect of risk and R&D intensity on performance during 2020 relative to each firm’s baseline performance level. Consistent with past studies with a direct relationship between risk and reward, we hypothesize that risk-taking and R&D-intensive firms may outperform those who adopt more conservative strategies. We also note the potential for global supply chain disruption during COVID to improve the performance of firms who allocate resources towards the purchasing of inventory versus firms with cash but a shortage of suppliers able to accept it in exchange for the timely delivery of goods. We thus also hypothesize that low cash-to-inventory levels negatively moderate our main effect. In other words, our study aims to provide findings that help managers decide whether they should play it safe, conserve cash, and attempt to weather the storm during COVID-19, or, instead, accept more risk and invest in R&D and inventory. Simply put, strategy formulation is more reliable when the knowledge bases used to generate it are accurate and current. The need for such knowledge today is strong and urgent, yet its availability is in short supply. Our findings suggest that risk-taking, R&D-intensive firms, especially those with low cash-to-inventory ratios, performed better during COVID-19 than more conservative, less R&D-intensive firms.
Because the U.S. manufacturing industry is a key actor within complex global supply chains, and because COVID-19 is more disruptive than many conventional crises (e.g., regionally confined economic crises or natural disasters), our findings also extend the international business and crisis literatures by testing the efficacy of firm performance predictors during a global pandemic, while examining liquidity-versus-inventory tradeoffs. Manufacturers around the world rely on global supply chains while trying to meet global demand for their offering. Whether and how previously theorized links between various antecedents and performance are affected by sudden disruptions to global supply chains and consumer markets during a pandemic is an open question. We ultimately suggest that certain firm performance predictors are better suited to retain efficacy in settings that are this extraordinarily disruptive and uncertain, while others are likely to become less important by comparison.
Our paper is organized as follows. In the next section, we describe the background literature that we build upon and offer our conceptual model and hypotheses. Then, we describe our sample, methods, and results, which we compare to the results of prior studies. We close by highlighting the theoretical and practical implications of our findings, discussing the limitations of our study and suggesting future research, and offering a high-level summary of our paper.

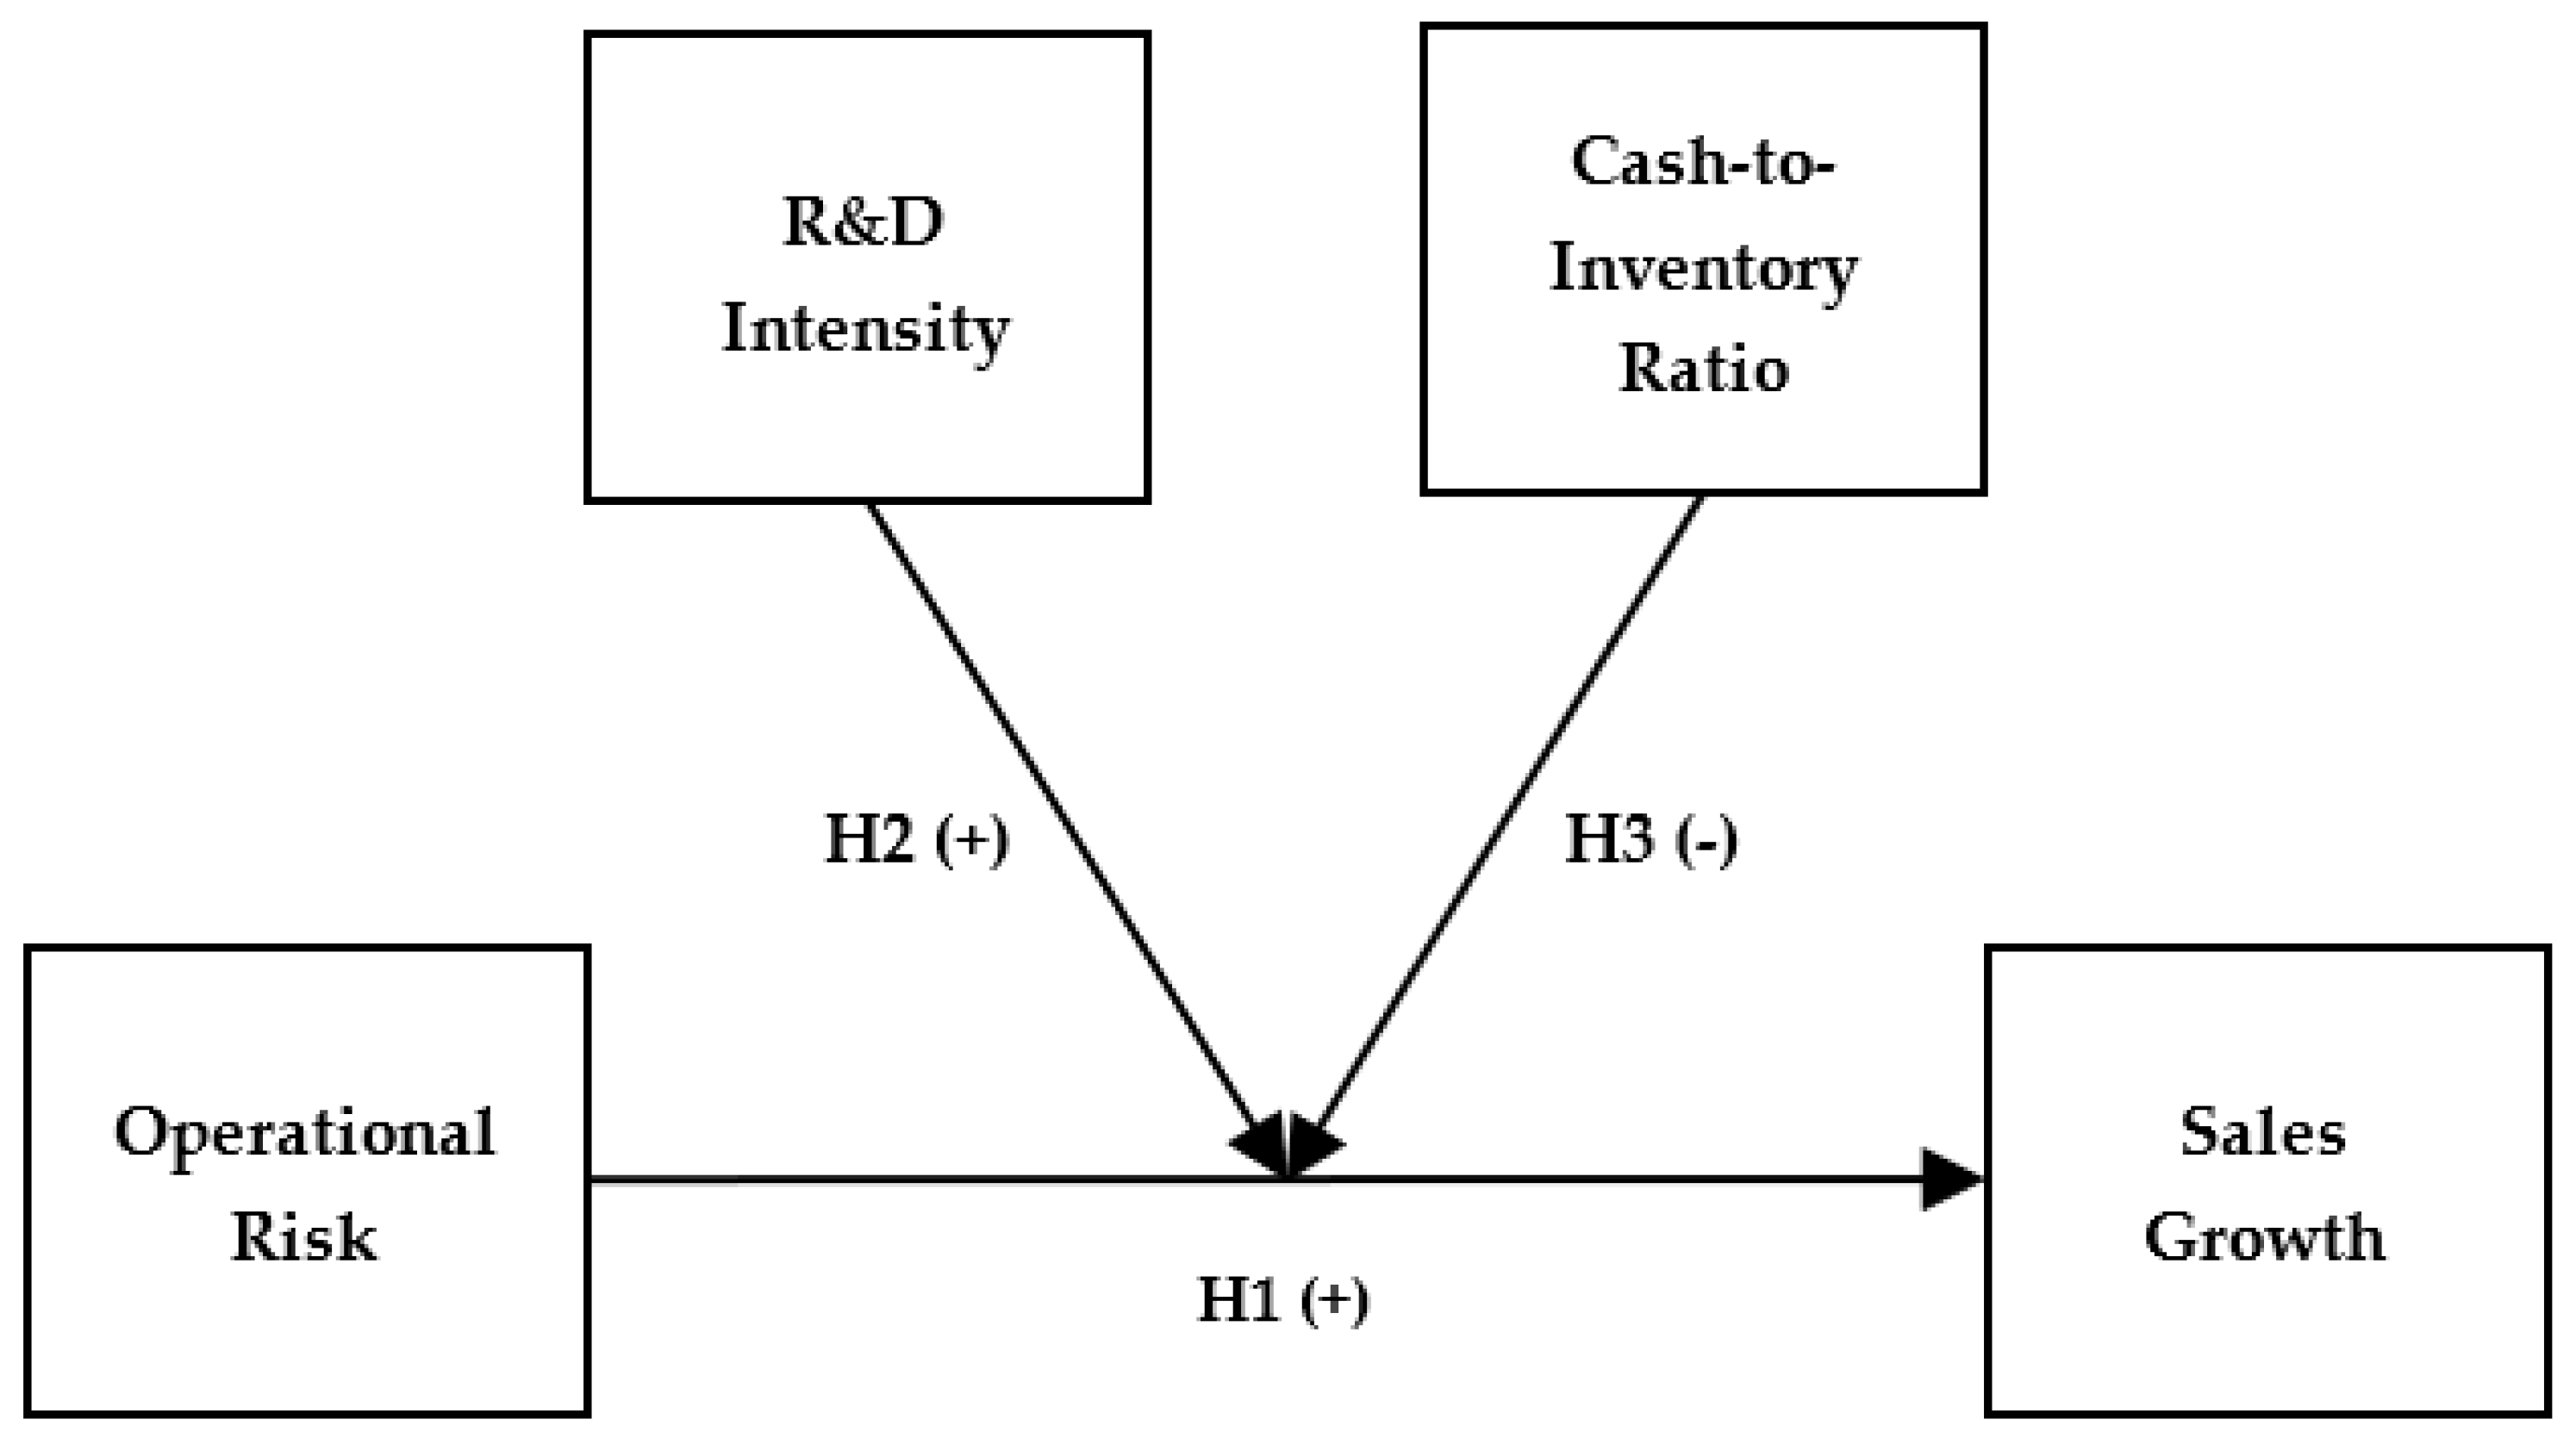
2. Background, Conceptual Model, and Hypothesis Development

We began by searching for relevant studies by entering the following terms into scholarly search engines (e.g., Web of Science, Google Scholar): crisis + firm performance OR sales growth OR revenue, pandemic + firm performance OR sales growth OR revenue, and disaster + firm performance OR sales growth OR revenue. We then conducted a snowballing search, analyzing citations listed in these papers. As a strategic management study, our focus was linking managerial actions to performance outcomes (e.g., revenue generation). While the crisis literatures in finance and economics are robust, they often study investor reactions or economic tolls instead of managerial strategies used to improve performance. Because the strategy literature is shallow, we hope to contribute to it by adding a new crisis study conducted during a pandemic.
The vast majority of studies focus on economic crises (e.g., Kristjánsdóttir and Óskarsdóttir 2021). We know that firms realign strategies to ensure survival and mitigate performance declines (Doern et al. 2019; Fainshmidt et al. 2019; Vaaler and McNamara 2004). We also know that large firms perform better due their larger and more efficient resource bases (Aldrich and Auster 1986; Gomes et al. 2001; Hall et al. 1995; Jovanovic 1982; Melitz 2003). Eggers’ (2020) literature review indicates that entrepreneurial mindsets increase risk-taking, R&D intensity, and performance during crises. Additionally, firms with dynamic strategic orientations tend to be more resilient and experience higher levels of customer loyalty and stock performance (Ahn et al. 2018; Alonso-Almeida et al. 2015; Nair et al. 2014). Experience, however, does not predict performance (Cowling et al. 2018).
Another robust stream investigates the effect of disasters (e.g., Lee et al. 2018). Focused more on description than prescription, it suggests that disasters damage production facilities and force retail operations to close, putting them at a disadvantage relative to firms not experiencing disaster; however, this disadvantage dissipates as surviving firms recover (Cainelli et al. 2018; Cole et al. 2019; De Mel et al. 2012; Park et al. 2013; Stromberg 2007). Notably, Bai et al. (2020) lament the lack of studies that test predictors of performance-based outcomes.
Studies also highlight the importance of supply chain disruption (Tang and Aruga 2021). It can be harder to find new suppliers than new customers, and disruptions are magnified by imperfect input substitutability and relying on single versus redundant chains—yet trading partners can also offer support (Atan and Snyder 2012; Carvalho et al. 2021; Todo et al. 2013; Tokui et al. 2017). Lee’s (2021) study of performance after Hurricane Harvey in the USA echoes this point, as social capital increased survival rates.
Mirroring its effect during economic crises, firm size assists during disaster as well. Pre-crisis earnings and planning (e.g., supplier diversification), post-disaster aid (such as government support), and the literal destruction of competitors also improve performance (Bătrâncea and Nichita 2015; Bătrâncea 2021; Cole et al. 2017; Fabling et al. 2019; Hayakawa et al. 2015). Shin and Lee (2019) found that generic resources improve outcomes, with cash the most useful due to its versatility. Whether disruptions are caused by a human (e.g., fires started by accident) or nature also matters, with the former associated with larger stock price declines (Bai et al. 2020).
While the literature related to infectious diseases is sparse, studies do exist. Wogwu and Hamilton (2018) and Tse et al. (2006) suggested reconfiguring assets aided public sector responses to Ebola and guinea worm ailment, and private sector responses to SARS. A COVID-19 literature also is burgeoning (Kantor and Kubiczek 2021; Oravský et al. 2020; Polukhina et al. 2021; Tang and Aruga 2021; Zimon and Tarighi 2021). Many papers quantify damage done to businesses or employees (e.g., Fairlie 2020), or document government aid (e.g., Robinson and Kengatharan 2020). Conceptual papers also exist, e.g., Cowling et al. (2020) suggesting that small firms may run out of cash.
The primary gap is a lack of quantitative studies of firm performance during COVID-19. We are aware of one such study (Clampit et al. 2021), which notes that the more uncertain nature of pandemics versus other crises may mean that strategies related to dynamism and agility may outperform those related to scale or efficiency. Their test of the effect of dynamic capabilities on the operational and revenue performance of small businesses supported their hypotheses. While they restricted analysis to small businesses, we analyze larger firms with publicly traded stocks, and while their tested endpoint is discrete, ours is compared to a pre-COVID-19 baseline.
To fill this gap, we now synthesize thought from relevant studies to generate premises that collectively suggest risk-takers (especially when R&D or inventory levels are high) perform better during COVID-19. Risk is commonly proxied as the variance of income streams, stock returns, or financial ratios (Chiu and Choi 2016; Gilley et al. 2002). The positive relationship between risk and performance in the finance literature is well established (Fletcher 2000; Modigliani and Pogue 1974). The link between strategic operational risk and firm performance is ambiguous (Nickel and Rodriguez 2002). Here, risk is often captured via measurements of revenue variance, and both positive (Fisher and Hall 1969; Merton 1974; Wang and Yen 2012; Wright et al. 1996) and negative (e.g., Bowman 1980; Miller and Bromiley 1990) associations have been documented.
We suggest that environmental dynamism may play a key role. While Gilley et al. (2002) and Pratono (2018) suggest that firms wait for uncertain periods before assessing environments and adopting riskier approaches, Imhof and Seavey (2014) suggest that strong forecasting ability predicts both less risk-taking and lower performance. The strategic ambidexterity literature examines tradeoffs when choosing strategies to either exploit current or explore newer resources, capabilities, and markets (March 1991). Osiyevskyy et al. (2020) documented this literature’s bundling of risk-taking with experimentation, R&D intensity, and increased performance variance. Importantly, it then suggests the adoption of contingency perspectives during crises. This is consistent with prior research suggesting that exploration-based risk-taking predicts positive performance in dynamic settings (e.g., Jansen et al. 2006) and during economic downturns (e.g., Archibugi et al. 2013; Shirokova et al. 2019). It also suggests that threshold effects may exist. The effects of risk-taking, then, may be different during turbulent crises, and the literature’s mixed findings regarding risk and performance during conventional times may now suggest positive outcomes.
In summary, these referenced literatures suggest that risk-taking, R&D-intensive firms may outperform others when turbulence is high. While these literatures do not explicitly consider pandemics, we suggest their logic will generalize to conditions of extreme turbulence such as COVID-19. To help disentangle effects attributable to risk-taking, per se, and risk-taking tied to R&D intensity (which we expect to have a stronger effect), we posit two testable hypotheses, which are illustrated in Figure 1.
Hypothesis 1 (H1).
A positive relationship exists between operating risk and firm performance during COVID-19.
Hypothesis 2 (H2).
The positive relationship between operating risk and firm performance is stronger for R&D-intensive firms during COVID-19.
Cash can mitigate the impact of foregone revenue or fund tactical adjustments during crises, as well as the propensity for supply chain disruption (Singhal et al. 2011). Because resources are limited, firms must select between retaining cash or bolstering inventory. The literature suggests both matter. We suggest that complexity and supply-side constraints may be critical factors when selecting. Atan and Snyder (2012) suggest that while cash is preferable during crises, key contingencies based on supply chain complexity may reverse this preference (e.g., inventory may be favored by firms with complex multi-tiered versus single-tiered chains or assembly versus serial/distribution archetypes). George (2005), meanwhile, found that “discretionary” slack (e.g., cash that can be deployed however managers desire) predicts lower performance in complex industries. Our contention is that compared to conservative companies, risk-takers are likely to participate in complicated supply chains that help them compete in complex industries.
For example, dynamic firms may rely on more synchronized supply chains (e.g., Just-In-Time production) that are prone to bottlenecks when highly technical and specialized components that may only be available from one vendor are not immediately available (e.g., LG as the sole producer of OLED panels for all high-end TV manufacturers). Unanticipated robust demand surges can leave even the most advanced manufacturing networks (that often incorporate sustainable smart manufacturing techniques, including cyber-physical monitoring, AI-assisted analytics, and Industry 4.0-based manufacturing systems) vulnerable to supply-side constraints (Adams and Krulicky 2021; Cohen and Macek 2021; Gibson and Macek 2021; Kovacova and Lăzăroiu 2021; Kovacova and Lewis 2021; Wade and Vochozka 2021). The struggle for riskier firms to meet demand, then, may greatly worry its managers, e.g., Elon Musk’s continual claim that Tesla can sell as many units as it can make, with supply-side constraints the primary impediment (e.g., O’Kane 2019). Logically, crises and associated supply chain disruptions may exacerbate these concerns. COVID-related bottlenecks, in fact, regularly prompt Musk to tweet messages such as, “Demand is no problem, but near-term cell supply makes it hard to scale” (Musk 2021). Some products may even experience an increase in demand during COVID-19, e.g., webcams or TVs, as more people work from and spend more time at home. Supply chain complexities and the history of supply-side constraints leads us to hypothesize that for riskier companies, inventory will be more important than cash during crises.
Hypothesis 3 (H3).
The positive relationship between operating risk and firm performance is stronger for firms with lower cash-to-inventory ratios.

3. Method and Results

3.1. Research Design

The independent variable is operating risk and the dependent variable is firm performance, while the two moderating variables are R&D intensity and cash-to-inventory ratio. To test our hypotheses, our independent and moderating variables are measured using average data of 2016–2019, and the dependent variable is measured using a percentage of 2020 firm performance relative to average firm performance during the four prior years (i.e., 2016–2019). This research design gives us an ability to examine the influence of our independent and moderating variables on firm performance during COVID-19 crises, which began in 2020. Below, we explain the sample and measures constructed in more depth.

3.2. Sample

We test our hypotheses on a sample of publicly traded U.S. manufacturers that reported earnings through the end of 2020. Data were obtained from Compustat and the Center for Research in Security Prices (CRSP). The Compustat database is the product of Standard & Poor’s Capital IQ division and has provided reliable and validated financial data for U.S. and global companies since 1962. Similarly, CSRP database is affiliated with University of Chicago Booth School of Business and provides reliable and validated historical stock market data for major publicly traded U.S. firms. Both of these datasets are extensively used by scholars who have studied any sort of U.S. based firms’ financial and market indicators. To examine U.S. manufacturing firms, we used all U.S. firms with SIC two-digit industry codes between 20 and 39, as these are the firms that are part of the manufacturing industry. We found 2440 U.S. firms, but 1142 had missing data. Our final sample, therefore, consisted of 1298 U.S. manufacturing firms.

3.3. Measures

We operationalize our dependent variable, firm performance, by measuring sales growth during the crisis event year (Venkatraman and Ramanujam 1986), calculated as the percentage of 2020 sales growth relative to average sales during the four prior years 2016–20191. Higher values indicate higher 2020 sales growth (the event year when the sample firms faced COVID-19 disruptions) versus average growth during the four prior years (the baseline years).
Firm-level operating risk is measured by calculating the coefficient of variation of sales for 2016–2019. Here, we calculate the ratio of the standard deviation of sales to average sales from 2016 to 2019 (Kanini et al. 2020; Wanke and Zinn 2004). Higher values indicate that performance was more volatile during the baseline period, suggesting that such firms engaged in riskier strategies, while lower values indicate less volatility during 2016–2019 (the baseline period), suggesting the adoption of less risky strategies and more stable revenue streams.
Our first moderating variable, R&D intensity, is proxied as the ratio of R&D expenses to total sales (Long and Ravenscraft 1993), with higher values suggesting firms are more R&D intensive. Our second moderating variable, cash-to-inventory ratio, is the ratio of total cash to total inventory, with higher values indicating higher cash versus inventory levels. We also include several control variables that may correlate with firm performance. First, we control for systematic risk (aka beta), which is a standard measure of non-diversifiable risk that reflects the underlying volatility of a stock relative to general market movements (Miller and Bromiley 1990). Next, consistent with Syukriyah et al. (2020), we control for prior performance using return on assets (ROA). We also control for the log of total long-term debt, total assets, and capital expenditures, with log transformations required due to skewed distributional properties. We also controlled for debt ratios, measured as total debt to total assets. Finally, to account for heterogeneity among firms within the manufacturing industry, we controlled for the level of firm diversification using the entropy measure (Jacquemin and Berry 1979). We measured this construct using Ε = i = 0 n Ρ i ln 1 / Ρ i 4 formula: where Pi is the ratio of a firm’s business segment i sales to total sales.

3.4. Results

Table 1 reports descriptive statistics and pairwise Pearson correlations. A positive, significant correlation exists between operating risk and 2020 sales growth, suggesting initial support for H1. As our dependent variable is continuous, we then analyzed our hypotheses using ordinary least squares (OLS) multiple regression analysis (see Wooldridge 2003). This research methodology is used for estimating linear relations between a dependent or an outcome variable, on the one hand, of the equation, and a set of explanatory or predictor variables on the other, while testing for multicollinearity by examining variance inflation factors (VIFs) for all models. The average VIF is 3, substantially below the value of 10 that indicates multicollinearity (Neter et al. 1996)2. Table 2 reports our model results. We include all control variables in Model 1, the independent variable in Model 2, and interaction terms in Models 3 and 4.
H2 predicts that R&D intensity strengthens the relationship between operating risk and 2020 sales growth. As Model 3’s coefficient parameter estimate for our interaction term between operating risk and R&D intensity is positive and significant (β = 0.00; p < 0.001), H2 is supported. As shown in Figure 2, the marginal effect for one standard deviation below operating risk and R&D intensity means is 0.928, while the marginal effect for one standard deviation above these means is 8.014, and firms with the highest risk and R&D intensity experienced the highest sales growth in 2020.
VariablesSales growth = Operating risk × R&D intensity + Operating risk + R&D intensity
+ Operating risk + Cash-inventory ratio + Financial risk + ROA
+ Long term debt + Assets + Capital expenditure + Debt ratio + Diversification + error
H3 predicts that high cash-to-inventory ratios attenuate the relationship between operating risk and 2020 sales growth. As Model 4’s coefficient parameter estimate for the interaction term of operating risk and cash-to-inventory ratio is negative and significant (β = −0.02; p < 0.05), H3 is supported. The marginal effect for one standard deviation below means for operating risk and cash-to-inventory ratio is −0.827, while the marginal effect for one standard deviation above means for operating risk and cash-to-inventory ratio is 0.431. As depicted in Figure 3, firms with the most operating risk and lowest cash-to-inventory ratios experienced the most 2020 sales growth.
Sales growth = Operating risk × Cash-inventory ratio + Operating risk
+ R&D intensity + Operating risk + Cash-inventory ratio + Financial risk + ROA
+ Long term debt + Assets + Capital expenditure + Debt ratio + Diversification + error
Overall, our results are generally consistent with prior studies that found positive links between operational risk and firm performance (e.g., Fisher and Hall 1969; Merton 1974; Wang and Yen 2012; Wright et al. 1996), and positive R&D intensity moderation (e.g., Kotabe et al. 2002). Some pre-COVID-19 findings, then, do seem to generalize to the COVID-19 setting. Our finding that low cash-to-inventory ratios improved performance, however, is inconsistent with Atan and Snyder’s (2012) findings. This suggests that in some ways (perhaps due to extreme turbulence), the COVID-19 setting is unusual.

3.5. Robustness Checks

We conduct several robustness checks to validate our findings. First, while we purposefully chose a single industry to form our sample (i.e., manufacturing industry), to eliminate performance differences across industries, further heterogeneity may exist among firms within this industry. We thus conducted the OLS regression again, including 3-digit level (i.e., finer) SIC industry effects. Second, to assess the sensitivity of the use of OLS regression, we re-constructed our dependent variable from a continuous outcome space to a dichotomous one using a median split. The dependent variable is assigned a value of zero to indicate below-industry median sales growth and a value of one to indicate above-industry median sales growth. We then conducted a probit regression and retested all three research hypotheses. Next, we address the issue related to heteroscedasticity. Like most studies that use financial ratios, our study also faces similar issues related heteroscedasticity, skewness, and kurtosis. To assess if our findings are robust across these issues, we conduct feasible generalized least squares regression. This technique allows estimation in the presence of AR(1) autocorrelation within heteroscedasticity across cross-sectional correlations (Rodrigues et al. 2020; Yousef et al. 2020; Yuzbasi and Ahmed 2020). The results for these robustness checks are reported in Table 3, Table 4 and Table 5, which show identical results to those in Table 2. Finally, to assess the endogeneity attributable to omitted variables bias, we first conducted two-stage least squares regression using three statistically and theoretically valid instrumental variables (1: total auditing expenses, 2: board independence ratio, and 3: CEO duality) and then performed the Durbin–Wu–Hausman test for endogeneity. The Durbin–Wu–Hausman statistic substantially failed to reach a conventional significance level (p = 0.87), suggesting that endogeneity is not biasing our results3.

4. Conclusions

To the best of our knowledge, this is the first quantitative, empirical study to test a predictor of revenue growth for manufacturers during COVID-19, measured against pre-COVID-19 baselines. Moreover, while the crisis literature is clear with respect to the benefits of being large and having broad resource bases, there seems to be tension between safety-oriented and less risk-averse approaches (e.g., the benefits of cash retention versus being more comfortable with risk and prioritizing inventory over liquidity). Additionally, it has very little to say at all with respect to predictors of firm performance during pandemics. Our finding that operational risk predicts performance, with this link being stronger when R&D intensity is high or inventory is prioritized over the retention of cash, has several implications.
Informed by research on risk-taking, we developed a theoretical argument suggesting that strategies involving more risk perform better during crises. While H1 and H2 are consistent with much of the literature, confirming that some theories do generalize to the COVID-19 settings, H3′s findings that prioritizing inventory over cash improved performance during COVID-19 are contrary to prior findings that suggest a positive link between cash and performance during crisis (Atan and Snyder 2012). We thus extend theory by suggesting that a new boundary condition specifically related to pandemics reverses this link. Natural disasters elicit visceral reactions related to physical safety but are finite in duration. Economic crises do not threaten safety but do possess uncertain durations. Pandemics offer the worst of both, and during these conditions of deep uncertainty, inventories should be preferred to cash.
With respect to practice, our primary suggestion for managers is to be comfortable with the idea of accepting greater risk rather than assuming that the proper response to crisis is to play it safe operationally, while stockpiling cash in the hopes of weathering the storm. More R&D-intensive companies, for example, might pivot tactically but not strategically, while continuing to prioritize inventory over cash. Managers of less R&D-intensive companies may attempt to become more intensive if capable (e.g., smaller firms that are agile enough to quickly adapt), but if not, such managers should accept that as risk-taking and R&D intensity have been associated with higher levels of performance during the COVID-19 pandemic, a focus on mitigative measures, including building inventory buffers, would be appropriate. Thus, the term “cash is king” may not be suitable for all firms, especially when world is facing crises and supply chain disruptions. We suggest that firms should develop inventory buffering strategies or mitigation plans before next crises hit. Even if our findings are not actionable by all, information validated during COVID-19 can still be useful, as knowing which strategies performed well will enable managers to make more informed decisions moving forward.
Our study does have limitations that future studies may help remedy. Empirically, for example, we performed a series of statistical analyses and carefully constructed our sample from a single industry and country. This may limit generalizability to other industries (e.g., services) or countries. For instance, while Swedish firms never experienced official shutdowns, firms were still impacted by global supply chain disruptions. Future studies should thus conduct tests in other countries (including developing markets) and using other variables to analyze additional industries.
Another limitation involves our lack of qualitative data. Future qualitative studies may help unpack underlying mechanisms, alternative channels, and threshold effects. Is R&D intensity, for instance, a signal of robust demand? Are causal mechanisms more immediate, e.g., indicative of dynamism that allows rapid pivots mid-crisis? While H3 was supported, its practical significance was relatively modest. Is there a missing moderator that may strengthen or eliminate the efficacy of the cash-to-inventory channel that we examined?
Future studies may also attempt to disentangle transitory attempts to tactically pivot versus benefits stemming from enduring strategic commitments to our focal variables. The idea of temporary tactics versus sustained strategies also has managerial implications. If, for example, aggressive tactical adjustments generate positive results, then managers of more conservative firms that cannot be transformed (quickly or at all) from risk-averse entities to strategic risk-takers may at least be able to adjust their tactics. If positive effects are primarily (or only) realized via more aggressive long-term strategic orientations, however, then tactical adjustments in this direction may be disregarded.
Ultimately, we designed our study around the idea that what helped firms outside of the COVID-19 setting may or may not continue to help during COVID-19. We designed our study around the ideas that what worked outside of the COVID-19 setting may or may not work during COVID-19. Any theory shown to improve firm performance when firms are operating in settings characterized by turbulence and uncertainty would seem to be a logical candidate to provide guidance during the extreme turbulence and uncertainty attributable to COVID-19. We found that this was, indeed, the case, as risk predicted performance, especially for high R&D-intensive firms. We also considered the literature’s suggestion that riskier, more dynamic firms often have more complicated and intricate supply chains that often work on a just-in-time basis. The interconnected nature of these supply chains, combined with their usage of specialized inputs that lack the simple substitutability of more commoditized inputs, suggests that they may be less robust to crisis induced disruption. We, therefore, suggested, and found, that our positive hypothesized relationship between operating risk and firm performance would be stronger for firms with low cash-to-inventory ratios.
We hope that managers will find our results useful when formulating their own strategies during COVID-19. Work remains to be done, however. Science is a collective tapestry, built one study at a time. Our objective was to be among the first of many that motivate follow-up inquiries. These forthcoming studies will undoubtedly dig deeper with respect to various underlying mechanisms and newly discovered boundary conditions, and this will hopefully provide more accurate guidance to all firms.

Author Contributions

All authors contributed equally with respect to conceptualization, methodology, software, validation, formal analysis, investigation, resources, data curation, writing—original draft preparation, writing—review and editing, visualization, supervision, project administration, and funding acquisition. All authors have read and agreed to the published version of the manuscript.

Funding

This research received no external funding.

Data Availability Statement

All data was obtained via publicly available data sources, e.g., Compustat.

Conflicts of Interest

The authors declare no conflict of interest.

Notes

1
Alternatively, we measured the percentage of 2020 sales growth versus 2019 and obtained similar results (untabulated).
2
The highest VIF in our models was for Assets (i.e., 8.27). We re-ran our models without Assets, and results remained
3
An insignificant Durbin–Wu–Hausman statistic indicates that the results from the OLS regression are appropriate in this context (Semadeni et al. 2014).

References

  1. Adams, Donald, and Tomas Krulicky. 2021. Artificial Intelligence-driven Big Data Analytics, Real-Time Sensor Networks, and Product Decision-Making Information Systems in Sustainable Manufacturing Internet of Things. Economics, Management, and Financial Markets 16: 81–93. [Google Scholar] [CrossRef]
  2. Ahn, Joon Mo, Letizia Mortara, and Tim Minshall. 2018. Dynamic capabilities and economic crises: Has openness enhanced a firm’s performance in an economic downturn? Industrial & Corporate Change 27: 49–63. [Google Scholar]
  3. Aldrich, Howard, and Ellen Auster. 1986. Even dwarfs started small: Liabilities of age and size and their strategic implications. Research in Organizational Behavior 8: 165–98. [Google Scholar]
  4. Alonso-Almeida, María, Kerstin Bremser, and Josep Llach. 2015. Proactive and reactive strategies deployed by restaurants in times of crisis: Effects on capabilities, organization and competitive advantage. International Journal of Contemporary Hospitality Management 27: 1641–61. [Google Scholar] [CrossRef]
  5. Archibugi, Daniele, Andrea Filippetti, and Marion Frenz. 2013. Economic crisis and innovation: Is destruction prevailing over accumulation? Research Policy 42: 303–14. [Google Scholar] [CrossRef] [Green Version]
  6. Atan, Zümbül, and Lawrence Snyder. 2012. Inventory strategies to manage supply disruptions. In Supply Chain Disruptions. Edited by Haresh Gurnani, Anuj Mehrotra and Saibal Ray. London: Springer, pp. 115–39. [Google Scholar]
  7. Bai, Chunguang, Wenlian Gao, and Joseph Sarkis. 2020. Operational risks and firm market performance: Evidence from China. Decision Sciences 52: 1–32. [Google Scholar] [CrossRef]
  8. Bătrâncea, Larissa. 2021. An econometric approach regarding the impact of fiscal pressure on equilibrium: Evidence from electricity, gas and oil companies listed on the New York stock exchange. Mathematics 6: 630. [Google Scholar]
  9. Bătrâncea, Larissa, and Anca Nichita. 2015. Which is the best government? Colligating tax compliance and citizens’ insights regarding authorities’ actions. Transylvanian Review of Administrative Sciences 11: 5–22. [Google Scholar]
  10. Bowman, Edward. 1980. Risk-return paradox for strategic management. Sloan Management Review 21: 17–31. [Google Scholar]
  11. Cainelli, Giulio, Andrea Fracasso, and Giuseppe Vittucci Marzetti. 2018. Natural disasters and firm resilience in Italian industrial districts. In Cluster Advantage and Firm Performance. Edited by Fiorenza Belussi and Jose-Luis Hervas-Oliver. Cham: Springer, pp. 223–43. [Google Scholar]
  12. Carvalho, Vasco, Makoto Nirei, Yukiko Saito, and Alireza Tahbaz-Salehi. 2021. Supply chain disruptions: Evidence from the great East Japan earthquake. The Quarterly Journal of Economics 136: 1255–321. [Google Scholar] [CrossRef]
  13. Chiu, Chun-Hung, and Tsan-Ming Choi. 2016. Supply chain risk analysis with mean-variance models: A technical review. Annals of Operations Research 240: 489–507. [Google Scholar] [CrossRef]
  14. Clampit, Jack, Melanie Lorenz, John Gamble, and Jim Lee. 2021. Performance stability among small and medium-sized enterprises during COVID-19: A test of the efficacy of dynamic capabilities. International Small Business Journal. [Google Scholar] [CrossRef]
  15. Cohen, Sarah, and Jaroslav Macek. 2021. Cyber-Physical Process Monitoring Systems, Real-Time Big Data Analytics, and Industrial Artificial Intelligence in Sustainable Smart Manufacturing. Economics, Management, and Financial Markets 16: 55–67. [Google Scholar] [CrossRef]
  16. Cole, Matthew, Robert Elliott, Toshihiro Okubo, and Eric Strobl. 2017. Pre-disaster planning and post-disaster aid: Examining the impact of the Great East Japan earthquake. International Journal of Disaster Risk Reduction 21: 291–302. [Google Scholar] [CrossRef]
  17. Cole, Matthew, Robert Elliott, Toshihiro Okubo, and Eric Strobl. 2019. Natural disasters and spatial heterogeneity in damages: The birth, life and death of manufacturing plants. Journal of Economic Geography 19: 373–408. [Google Scholar] [CrossRef]
  18. Cowling, Marc, Ross Brown, and Augusto Rocha. 2020. COVID-19? Did you save some cash for a rainy COVID-19 day? The crisis and SMEs. International Small Business Journal 38: 593–604. [Google Scholar] [CrossRef]
  19. Cowling, Marc, Weixi Liu, and Ning Zhang. 2018. Did firm age, experience, and access to finance count? SME performance after the global financial crisis. Journal of Evolutionary Economics 28: 77–100. [Google Scholar] [CrossRef]
  20. De Mel, Suresh, David McKenzie, and Christopher Woodruff. 2012. Enterprise recovery following natural disasters. Economic Journal 122: 64–91. [Google Scholar] [CrossRef]
  21. Doern, Rachel, Nick Williams, and Tim Vorley. 2019. Special issue on entrepreneurship and crises: Business as usual? An introduction and review of the literature. Entrepreneurship & Regional Development 31: 400–12. [Google Scholar]
  22. Eggers, Fabian. 2020. Masters of disasters? Challenges and opportunities for SMEs in times of crisis. Journal of Business Research 116: 199–208. [Google Scholar] [CrossRef]
  23. Evans, Simon. 2021. Prepare for COVID-22 and COVID-24, Ansell CEO Warns. Financial Review. April 11. Available online: https://www.afr.com/companies/manufacturing/prepare-for-covid-22-and-covid-24-ansell-ceo-warns-20210409-p57hyj (accessed on 1 April 2021).
  24. Fabling, Richard, Arthur Grimes, and Levente Timar. 2019. Natural selection: Firm performance following a catastrophic earthquake. In Resilience and Urban Disasters. Edited by Kamila Borsekova and Peter Nijkamp. London: Edward Elgar Publishing, pp. 30–50. [Google Scholar]
  25. Fainshmidt, Stav, Lucas Wenger, Amir Pezeshkan, and Mark Mallon. 2019. When do dynamic capabilities lead to competitive advantage? The importance of strategic fit. Journal of Management Studies 56: 758–87. [Google Scholar] [CrossRef]
  26. Fairlie, Robert. 2020. The Impact of COVID-19 on Small Business Owners: Continued Losses and the Partial Rebound in May 2020. Working Paper. Cambridge: National Bureau of Economic Research. [Google Scholar]
  27. Fisher, Irving, and George Hall. 1969. Risk and corporate rates of return. The Quarterly Journal of Economics 83: 79–92. [Google Scholar] [CrossRef]
  28. Fletcher, Jonathan. 2000. On the conditional relationship between beta and return in international stock returns. International Review of Financial Analysis 9: 235–45. [Google Scholar] [CrossRef]
  29. George, Gerard. 2005. Slack resources and the performance of privately held firms. Academy of Management Journal 48: 661–76. [Google Scholar] [CrossRef]
  30. Gibson, Peter, and Jaroslav Macek. 2021. Sustainable Industrial Big Data, Automated Production Processes, and Cyber-Physical System-based Manufacturing in Smart Networked Factories. Journal of Self-Governance and Management Economics 9: 22–34. [Google Scholar] [CrossRef]
  31. Gilley, Matthew, Bruce Walters, and Bradley Olson. 2002. Top management team risk taking propensities and firm performance: Direct and moderating effects. Journal of Business Strategies 19: 95–114. [Google Scholar] [CrossRef]
  32. Gomes, Joao, Jeremy Greenwood, and Sergio Rebelo. 2001. Equilibrium unemployment. Journal of Monetary Economics 48: 109–52. [Google Scholar] [CrossRef] [Green Version]
  33. Hall, Robert, Henry Farber, and John Haltiwanger. 1995. Lost jobs. Brookings Papers on Economic Activity 1995: 221–73. [Google Scholar] [CrossRef] [Green Version]
  34. Hayakawa, Kazunobu, Toshiyuki Matsuura, and Fumihiro Okubo. 2015. Firm-level impacts of natural disasters on production networks: Evidence from a flood in Thailand. Journal of the Japanese and International Economies 38: 244–59. [Google Scholar] [CrossRef] [Green Version]
  35. Imhof, Michael, and Scott Seavey. 2014. Corporate risk-taking, firm value and high levels of managerial earnings forecasts. Advances in Accounting 30: 328–37. [Google Scholar] [CrossRef]
  36. Irdina, Irdina, Daisy Mui Hung Kee, Vasunthra Reddy, Zafirah Izzati, Kamini Sri, Manuela Granda Perez, Camilo Alberto Perez Restrepo, Carolina Ardila Lopez, Akash Das, Kunal Malhotra, and et al. 2020. AirAsia’s efforts in maintaining good workplace environment for its employees during COVID-19. International Journal of Tourism and Hospitality in Asia Pasific (IJTHAP) 3: 22–32. [Google Scholar] [CrossRef]
  37. Jacquemin, Alexis, and Charles Berry. 1979. Entropy measure of diversification and corporate growth. The Journal of Industrial Economics 27: 359–69. [Google Scholar] [CrossRef]
  38. Jansen, Justin, Frans Van Den Bosch, and Henk Volberda. 2006. Exploratory innovation, exploitative innovation, and performance: Effects of organizational antecedents and environmental moderators. Management Science 52: 1661–74. [Google Scholar] [CrossRef] [Green Version]
  39. Jovanovic, Boyan. 1982. Selection and the evolution of industry. Econometrica: Journal of the Econometric Society 50: 649–70. [Google Scholar] [CrossRef]
  40. Kanini, Ndung’u, Kibati Patrick, and Muhanji Stella. 2020. Evaluation of the nexus between revenue volatility from commodity sales and financial performance of manufacturing companies in Kenya. International Academic Journal of Economics and Finance 3: 238–50. [Google Scholar]
  41. Kantor, Angelika, and Jakub Kubiczek. 2021. Polish culture in the face of the COVID-19 pandemic crisis. Journal of Risk and Financial Management 14: 181. [Google Scholar] [CrossRef]
  42. Kee, Daisy Mui Hung, Nurrida binti Misbah, Nurul Asyiqin binti Nazril, and Nur Hasmizah binti Musa. 2021. The Impact of COVID-19 on the fast-food industry in Malaysia. Journal of the Community Development in Asia (JCDA) 4: 44–57. [Google Scholar] [CrossRef]
  43. Kotabe, Masaaki, Srini Srinivasan, and Preet Aulakh. 2002. Multinationality and firm performance: The moderating role of R&D and marketing capabilities. Journal of International Business Studies 33: 79–97. [Google Scholar]
  44. Kovacova, Maria, and Elizabeth Lewis. 2021. Smart Factory Performance, Cognitive Automation, and Industrial Big Data Analytics in Sustainable Manufacturing Internet of Things. Journal of Self-Governance and Management Economics 9: 9–21. [Google Scholar] [CrossRef]
  45. Kovacova, Maria, and George Lăzăroiu. 2021. Sustainable Organizational Performance, Cyber-Physical Production Networks, and Deep Learning-assisted Smart Process Planning in Industry 4.0-based Manufacturing Systems. Economics, Management, and Financial Markets 16: 41–54. [Google Scholar] [CrossRef]
  46. Kristjánsdóttir, Helga, and Stefanía Óskarsdóttir. 2021. European FDI in Ireland and Iceland: Before and after the Financial Crisis. Journal of Risk and Financial Management 14: 23. [Google Scholar] [CrossRef]
  47. Kumar, Navaneetha, Padmalini Singh, Liew Pei Shan, Daisy Mui Hung Kee, Lee Tze Mei, Ngai Wan Ying, and Ooi Yu Zhi. 2021. A case study on domino’s business survival strategy during the COVID-19 pandemic. International Journal of Tourism and Hospitality in Asia Pasific (IJTHAP) 4: 28–41. [Google Scholar] [CrossRef]
  48. Lee, Jim. 2021. Reopening businesses after Hurricane Harvey: Evidence from a duration model with spatial effects. Disasters 45: 296–323. [Google Scholar] [CrossRef]
  49. Lee, Kuo-Jung, Su-Lien Lu, and You Shih. 2018. Contagion effect of natural disaster and financial crisis events on international stock markets. Journal of Risk and Financial Management 11: 16. [Google Scholar] [CrossRef] [Green Version]
  50. Long, William F., and David J. Ravenscraft. 1993. LBOs, debt and R&D intensity. Strategic Management Journal 14: 119–35. [Google Scholar]
  51. March, James. 1991. Exploration and exploitation in organizational learning. Organization Science 2: 71–87. [Google Scholar] [CrossRef]
  52. Melitz, Marc. 2003. The impact of trade on intra-industry reallocations and aggregate industry productivity. Econometrica 71: 1695–725. [Google Scholar] [CrossRef] [Green Version]
  53. Merton, Robert. 1974. On the pricing of corporate debt: The risk structure of interest rates. The Journal of Finance 29: 449–70. [Google Scholar]
  54. Miller, Kent, and Phillip Bromiley. 1990. Strategic risk and corporate performance: An analysis of alternative risk measures. Academy of Management Journal 33: 756–79. [Google Scholar]
  55. Modigliani, Franco, and Gerald Pogue. 1974. An introduction to risk and return: Concepts and evidence, part two. Financial Analysts Journal 30: 69–86. [Google Scholar] [CrossRef]
  56. Musk, Elon. 2021. Twitter. March 21. Available online: https://twitter.com/elonmusk/status/1376843024303583236 (accessed on 2 July 2021).
  57. Nair, Anil, Elzotbek Rustambekov, Michael McShane, and Stav Fainshmidt. 2014. Enterprise risk management as a dynamic capability: A test of its effectiveness during a crisis. Managerial and Decision Economics 35: 555–66. [Google Scholar] [CrossRef]
  58. Neter, John, Michael Kutner, Christopher Nachtsheim, and William Wasserman. 1996. Applied Linear Statistical Models. Chicago: McGraw-Hill Irwin. [Google Scholar]
  59. Nickel, Manuel Núñez, and Manuel Cano Rodriguez. 2002. A review of research on the negative accounting relationship between risk and return: Bowman’s paradox. Omega 30: 1–18. [Google Scholar] [CrossRef] [Green Version]
  60. O’Kane, Sean. 2019. Tesla still isn’t getting enough batteries from Panasonic. The Verge. April 11. Available online: https://www.theverge.com/2019/4/11/18305976/tesla-panasonic-gigafactory-batteries-model-3 (accessed on 1 April 2021).
  61. Oravský, Róbert, Peter Tóth, and Anna Bánociová. 2020. The ability of selected European countries to face the impending economic crisis caused by COVID-19 in the context of the global economic crisis of 2008. Journal of Risk and Financial Management 13: 179. [Google Scholar] [CrossRef]
  62. Osiyevskyy, Oleksiy, Galina Shirokova, and Paavo Ritala. 2020. Exploration and exploitation in crisis environment: Implications for level and variability of firm performance. Journal of Business Research 114: 227–39. [Google Scholar] [CrossRef]
  63. Ozili, Peterson, and Thankom Arun. 2020. Spillover of COVID-19: Impact on the global economy. SSRN Electronic Journal 3562570: 1–27. [Google Scholar] [CrossRef] [Green Version]
  64. Park, YoungWon, Paul Hong, and James Jungbae Roh. 2013. Supply chain lessons from the catastrophic natural disaster in Japan. Business Horizon 56: 75–85. [Google Scholar] [CrossRef]
  65. Polukhina, Anna, Marina Sheresheva, Marina Efremova, Oxana Suranova, Oksana Agalakova, and Anton Antonov-Ovseenko. 2021. The Concept of Sustainable Rural Tourism Development in the Face of COVID-19 Crisis: Evidence from Russia. Journal of Risk and Financial Management 14: 38. [Google Scholar] [CrossRef]
  66. Pratono, Aluisius. 2018. Does firm performance increase with risk-taking behavior under information technological turbulence? Empirical evidence from Indonesian SMEs. The Journal of Risk Finance 19: 361–78. [Google Scholar] [CrossRef]
  67. Robinson, James, and Navaneethakrishnan Kengatharan. 2020. Exploring the effect of COVID-19 on small and medium enterprises: Early evidence from Sri Lanka. Journal of Applied Economics & Business Research 10: 115–24. [Google Scholar]
  68. Rodrigues, Ricardo, Augusto Felício, and Pedro Verga Matos. 2020. Corporate Governance and Dividend Policy in the Presence of Controlling Shareholders. Journal of Risk and Financial Management 13: 162. [Google Scholar] [CrossRef]
  69. Semadeni, Matthew, Michael Withers, and Trevis Certo. 2014. The perils of endogeneity and instrumental variables in strategy research: Understanding through simulations. Strategic Management Journal 35: 1070–79. [Google Scholar] [CrossRef]
  70. Shin, HoWook, and Seung-Hyun Lee. 2019. Firm resource stock, resource complementarity, and the heterogeneity in resource value. Asia Pacific Journal of Management 36: 661–86. [Google Scholar] [CrossRef]
  71. Shirokova, Galina, Liudmila Ivvonen, and Elena Gafforova. 2019. Strategic entrepreneurship in Russia during economic crisis. Foresight and STI Governance 13: 62–76. [Google Scholar] [CrossRef]
  72. Singhal, Piyush, Gopal Agarwal, and Murali Lal Mittal. 2011. Supply chain risk management: Review, classification and future research directions. International Journal of Business Science & Applied Management (IJBSAM) 6: 15–42. [Google Scholar]
  73. Stromberg, David. 2007. Natural disasters, economic development, and humanitarian aid. Journal of Economic Perspectives 21: 199–222. [Google Scholar] [CrossRef]
  74. Syukriyah, Syukriyah, Satia Nur Maharani, and Dhika Maha Putri. 2020. Analysis of the capital adequate ratio (CAR), non-performing loans (NPL), and return on assets (ROA) effect on credit distribution of commercial banks listed on the Indonesia Stock Exchange. International Journal of Accounting & Finance in Asia Pasific (IJAFAP) 3: 91–96. [Google Scholar]
  75. Tang, Chaofeng, and Kentaka Aruga. 2021. Effects of the 2008 Financial Crisis and COVID-19 Pandemic on the Dynamic Relationship between the Chinese and International Fossil Fuel Markets. Journal of Risk and Financial Management 14: 207. [Google Scholar] [CrossRef]
  76. Taylor, Paul. 2021. Two Options for Europe’s Coronavirus Economy: Bad or a Lot Worse. Politico. January 1. Available online: https://www.politico.eu/article/europe-2021-coronavirus-economy-bad-or-worse (accessed on 1 April 2021).
  77. Todo, Yasuyuki, Kentaro Nakajima, and Petr Matous. 2013. How do supply chain networks affect the resilience of firms to natural disasters? Evidence from the great East Japan earthquake. Regional Science 55: 209–29. [Google Scholar] [CrossRef] [Green Version]
  78. Tokui, Joji, Kazuyasu Kawasaki, and Tsutomu Miyagawa. 2017. The economic impact of supply chain disruptions from the great East-Japan earthquake. Japan and the World Economy 41: 59–70. [Google Scholar] [CrossRef] [Green Version]
  79. Tse, Alan, Stella So, and Leo Sin. 2006. Crisis management and recovery: How restaurants in Hong Kong responded to SARS. International Journal of Hospitality Management 25: 3–11. [Google Scholar] [CrossRef]
  80. US Bureau of Labor Statistics. 2020. Business Response Survey to the Coronavirus Pandemic. Available online: https://www.bls.gov/brs/2020-results.htm (accessed on 1 July 2021).
  81. Vaaler, Paul, and Gerry McNamara. 2004. Crisis and competition in expert organizational decision making: Credit-rating agencies and their response to turbulence in emerging economies. Organization Science 15: 687–703. [Google Scholar] [CrossRef] [Green Version]
  82. Venkatraman, Natarjan, and Vasudevan Ramanujam. 1986. Measurement of business performance in strategy research: A comparison of approaches. Academy of Management Review 11: 801–14. [Google Scholar] [CrossRef] [Green Version]
  83. Wade, Karen, and Marek Vochozka. 2021. Artificial Intelligence Data-driven Internet of Things Systems, Sustainable Industry 4.0 Wireless Networks, and Digitized Mass Production in Cyber-Physical Smart Manufacturing. Journal of Self-Governance and Management Economics 9: 48–60. [Google Scholar] [CrossRef]
  84. Wang, Hsing-Kuo, and Yu-Fang Yen. 2012. An empirical exploration of corporate entrepreneurial orientation and performance in Taiwanese SMEs: A perspective of multidimensional construct. Total Quality Management & Business Excellence 23: 1035–44. [Google Scholar]
  85. Wanke, Peter, and Walter Zinn. 2004. Strategic logistics decision making. International Journal of Physical Distribution & Logistics Management 34: 466–78. [Google Scholar]
  86. Wogwu, Vivien Ejiro, and Donald Ibama Hamilton. 2018. Reconfiguration capability and competitive advantage: A study of Port Harcourt Public Health Sector. Management 8: 47–53. [Google Scholar]
  87. Wooldridge, Jeffrey. 2003. Cluster-sample methods in applied econometrics. American Economic Review 93: 133–38. [Google Scholar] [CrossRef]
  88. Wright, Peter, Stephen Ferris, Atulya Sarin, and Vidya Awasthi. 1996. Impact of corporate insider, blockholder, and institutional equity ownership on firm risk taking. Academy of Management Journal 39: 441–58. [Google Scholar]
  89. Yousef, Ibrahim, Hanada Almoumani, and Ihssan Samara. 2020. The Impact of Internationalization of the Boardroom on Capital Structure. Journal of Risk and Financial Management 13: 307. [Google Scholar] [CrossRef]
  90. Yue, Wei, and Marc Cowling. 2021. The COVID-19 lockdown in the United Kingdom and subjective well-being: Have the self-employed suffered more due to hours and income reductions? International Small Business Journal 39: 93–108. [Google Scholar] [CrossRef]
  91. Yüzbaşı, Bahadır, and Ejaz Ahmed. 2020. Ridge Type Shrinkage Estimation of Seemingly Unrelated Regressions and Analytics of Economic and Financial Data from” Fragile Five” Countries. Journal of Risk and Financial Management 13: 131. [Google Scholar] [CrossRef]
  92. Zimon, Grzegorz, and Hossein Tarighi. 2021. Effects of the COVID-19 global crisis on the working capital management policy: Evidence from Poland. Journal of Risk and Financial Management 14: 169. [Google Scholar] [CrossRef]
Figure 1. How sales growth is affected by risk, R&D intensity, and cash-to-inventory ratios.
Jrfm 14 00499 g001
Figure 2. Interaction effect of operating risk and R&D intensity.
Jrfm 14 00499 g002
Figure 3. Interaction effect of operating risk and cash inventory ratio.
Jrfm 14 00499 g003
Table 1. Pairwise correlations table.
MeanS.D.12345678910
1Sales growth avg.0.7112.26
2R&D intensity13.00179.280.18
3Cash-to-inventory0.491.150.030.01
4Operating risk41.0547.900.100.080.25
5Financial risk0.840.830.000.00−0.04−0.13
6ROA−5.78145.070.000.000.02−0.130.04
7Long-term debt1.431.50−0.01−0.02−0.18−0.370.360.04
8Assets2.401.300.00−0.03−0.06−0.430.390.140.84
9Capital expenditure0.711.40−0.04−0.06−0.20−0.420.320.020.830.84
10Debt ratio4.187.350.040.000.620.19−0.020.02−0.21−0.06−0.18
11Diversification2.896.56−0.03−0.03−0.11−0.260.130.020.420.430.44−0.12
Table 2. OLS regression: Sales growth in 2020.
Variables(1)(2)(3)(4)
Sales GrowthSales GrowthSales GrowthSales Growth
Constant−1.84−5.46 ***−5.05 ***−6.09 ***
(0.11)(0.00)(0.00)(0.00)
Financial risk−0.010.040.180.05
(0.98)(0.94)(0.70)(0.91)
ROA−0.000.020.050.05
(0.65)(0.91)(0.79)(0.78)
Long-term debt−0.19−0.30−0.33−0.40
(0.69)(0.57)(0.52)(0.45)
Assets1.37 **2.32 **2.19 **2.43 ***
(0.04)(0.01)(0.01)(0.01)
Capital expenditure−0.95 *−1.27 *−1.19 *−1.23 *
(0.07)(0.05)(0.06)(0.06)
Debt ratio0.050.27 **0.28 **0.28 **
(0.38)(0.02)(0.01)(0.01)
Diversification−0.04−0.02−0.03−0.02
(0.41)(0.68)(0.63)(0.71)
R&D intensity0.01 ***0.01 ***−0.690.01 ***
(0.00)(0.00)(0.19)(0.00)
Cash-to-inventory−0.15−0.78−0.000.14
(0.73)(0.15)(0.14)(0.84)
Operating risk 0.03 ***0.02 *0.04 ***
(0.00)(0.07)(0.00)
Operating risk X 0.00 ***
R&D intensity (0.00)
Operating risk X −0.02 **
Cash inventory ratio (0.03)
Observations1298129812981298
R-squared0.040.050.110.06
p-value in parentheses, *** p < 0.01, ** p < 0.05, * p < 0.1.
Table 3. Robustness check #1—Controlling for industry fixed effects using SIC 3-digit code.
Variables(1)(2)(3)(4)
Sales Growth Sales Growth Sales Growth Sales Growth
Constant−2.18−5.71−4.99−6.57
(0.67)(0.35)(0.40)(0.28)
Financial risk0.010.080.250.10
(0.98)(0.88)(0.64)(0.86)
ROA−0.000.000.040.03
(0.69)(0.98)(0.85)(0.86)
Long-term debt−0.20−0.31−0.35−0.42
(0.69)(0.59)(0.53)(0.47)
Assets1.46 **2.36 **2.22 **2.48 **
(0.04)(0.02)(0.02)(0.01)
Capital expenditure−0.80−1.24 *−1.14−1.21 *
(0.17)(0.09)(0.11)(0.09)
Debt ratio0.050.27 **0.28 **0.28 **
(0.45)(0.02)(0.02)(0.02)
Diversification−0.03−0.02−0.02−0.02
(0.59)(0.79)(0.73)(0.81)
R&D intensity0.01 ***0.01 ***−0.000.01 ***
(0.00)(0.00)(0.14)(0.00)
Cash-to-inventory−0.30−0.85−0.760.07
(0.50)(0.14)(0.18)(0.92)
Operating risk 0.02 **0.010.04 ***
(0.02)(0.23)(0.00)
Operating risk X 0.00 ***
R&D intensity (0.00)
Operating risk X −0.02 **
Cash-to-inventory (0.04)
Observations1298129812981298
R-squared0.040.050.110.06
p-value in parentheses, *** p < 0.01, ** p < 0.05, * p < 0.1, Industry fixed effect included.
Table 4. Robustness check #2—Probit regression with dependent variable median split.
Variables(1)(2)(3)(4)
Sales GrowthSales GrowthSales GrowthSales Growth
Constant0.24 *−0.46 ***−0.49 ***−0.58 ***
(0.09)(0.01)(0.01)(0.00)
Financial risk−0.11 **−0.11 **−0.12 **−0.11 **
(0.01)(0.02)(0.01)(0.02)
ROA−0.03 **0.000.000.01
(0.05)(0.84)(0.84)(0.69)
Long-term debt−0.01−0.06−0.07−0.06
(0.84)(0.25)(0.23)(0.24)
Assets0.020.24 ***0.25 ***0.25 ***
(0.84)(0.01)(0.01)(0.01)
Capital expenditure−0.06−0.07−0.07−0.06
(0.34)(0.30)(0.32)(0.36)
Debt ratio0.03 **0.010.010.01
(0.02)(0.40)(0.43)(0.32)
Diversification−0.01 ***−0.01 **−0.01 **−0.01 **
(0.01)(0.02)(0.02)(0.02)
R&D intensity0.000.000.010.00
(0.90)(0.77)(0.13)(0.86)
Cash-to-inventory0.20 **0.020.010.30 **
(0.01)(0.72)(0.84)(0.02)
Operating risk 0.01 ***0.01 ***0.01 ***
(0.00)(0.00)(0.00)
Operating risk X −0.00 *
R&D intensity (0.08)
Operating risk X −0.00 ***
Cash-to-inventory (0.00)
Observations1298129812981298
chi284.62104.997.2396.54
p-value in parentheses, *** p < 0.01, ** p < 0.05, * p < 0.1.
Table 5. Robustness check #3—Feasible generalized least squares regression.
Variables(1)(2)(3)(4)
Sales GrowthSales GrowthSales GrowthSales Growth
Constant0.160.010.04−0.04
(0.49)(0.97)(0.87)(0.87)
Financial risk−0.08 *−0.08 *−0.08 *−0.08 *
(0.08)(0.06)(0.07)(0.06)
ROA0.13 *0.16 **0.17 **0.16 **
(0.08)(0.02)(0.02)(0.02)
Long-term debt0.080.070.070.07
(0.27)(0.32)(0.33)(0.30)
Assets−0.08−0.05−0.04−0.05
(0.55)(0.70)(0.73)(0.68)
Capital expenditure−0.04−0.04−0.05−0.04
(0.65)(0.67)(0.60)(0.67)
Debt ratio0.040.040.030.04
(0.12)(0.17)(0.22)(0.15)
Diversification−0.00−0.00−0.00−0.00
(0.53)(0.54)(0.53)(0.54)
R&D intensity0.01 ***0.01 ***0.030.01 ***
(0.00)(0.00)(0.79)(0.00)
Cash inventory ratio0.070.030.000.22
(0.52)(0.76)(0.37)(0.17)
Operating risk 0.01 ***0.01 **0.01 ***
(0.00)(0.04)(0.00)
Operating risk X 0.00 ***
R&D intensity (0.00)
Operating risk X −0.01
Cash inventory ratio (0.09)
Observations1298129812981298
chi284.62104.997.2396.54
p-value in parentheses, *** p < 0.01, ** p < 0.05, * p < 0.1.
Publisher’s Note: MDPI stays neutral with regard to jurisdictional claims in published maps and institutional affiliations.

