
Application of Artificial Intelligence in Stock Market Forecasting: A Critique, Review, and Research Agenda


University School of Management Studies, Guru Gobind Singh Indraprastha University, Dwarka Sector 16-C, New Delhi 110078, India
*
Author to whom correspondence should be addressed.
J. Risk Financial Manag. 2021, 14(11), 526; https://doi.org/10.3390/jrfm14110526
Submission received: 13 September 2021
/
Revised: 16 October 2021
/
Accepted: 18 October 2021
/
Published: 4 November 2021
(This article belongs to the Special Issue Technical Analysis of Financial Markets)
Abstract
:The stock market is characterized by extreme fluctuations, non-linearity, and shifts in internal and external environmental variables. Artificial intelligence (AI) techniques can detect such non-linearity, resulting in much-improved forecast results. This paper reviews 148 studies utilizing neural and hybrid-neuro techniques to predict stock markets, categorized based on 43 auto-coded themes obtained using NVivo 12 software. We group the surveyed articles based on two major categories, namely, study characteristics and model characteristics, where ‘study characteristics’ are further categorized as the stock market covered, input data, and nature of the study; and ‘model characteristics’ are classified as data pre-processing, artificial intelligence technique, training algorithm, and performance measure. Our findings highlight that AI techniques can be used successfully to study and analyze stock market activity. We conclude by establishing a research agenda for potential financial market analysts, artificial intelligence, and soft computing scholarship.
1. Introduction
Stock prediction focuses on estimating the future price movement in a stock, which is generally perceived as a challenging task due to the non-stationarity and volatility of the stock data. Dynamic stock market price variation and its chaotic behavior have increased the price prediction problem where the extreme non-linear, dynamic, complicated domain knowledge inherent in the stock market has hiked the difficulty level for investors in making prompt investment decisions (Esfahanipour and Aghamiri 2010; Knill et al. 2012).
There are two traditional theories to take into account when estimating the stock price, namely, efficient market hypotheses (EMH) and random walk (RW) theory. EMH states that a stock price absorbs all known market knowledge at any time. Since market participants optimally use all known information, price fluctuations are unpredictable, as new information happens randomly (Fama 1970). Whereas according to the random walk theory, stock prices conduct a ‘random walk’, which means that all future prices do not follow any trends or patterns, and are a spontaneous deviation from previous prices, and an investor cannot possibly forecast the market (Cheng and Deets 1971; Van Horne and Parker 1967). Another model that challenges EMH is Paul Samuelson’s martingale model (Samuelson 1973), according to which, given all available information, current prices are the best predictors of an event’s outcome. The only significant predictor of the ultimate outcome, in particular, should be the most recent observed value (Richard and Vecer 2021).
The validity of the EMH and RW theory have been controversial. Therefore, with the emergence of computational and smart finance, and behavioral finance, economists have tried to establish another theory referred to as the inefficient market hypothesis (IMH), which states that financial markets are not always considered efficient markets. Market inefficiencies exist due to market psychology, transaction costs, information asymmetries, and human emotions (Asadi et al. 2012). The majority of studies have used AI techniques to support those arguments, and the fact that certain players can consistently outperform the market demonstrates that the EMH might not be entirely accurate in practice (Asadi et al. 2012). As a viable alternative to the EMH, the fractal market hypothesis (FMH) has also been established (Dar et al. 2017) by Peters (1994). According to the FMH, markets are stabilized by matching the demand and supply of investors’ investment horizons, whereas the EMH supposes that markets are in equilibrium (Dar et al. 2017; Karp and Van Vuuren 2019).
FMH examines the market’s daily randomness and the turbulence experienced during crashes and crises, and provides a compelling explanation for investor behavior over the course of a market cycle, including booms and busts (Moradi et al. 2021). Interestingly, it also considers the non-linear relationships in time series problems, hence making it a suitable theory for stock prediction and other time series (Aslam et al. 2021; Kakinaka and Umeno 2021; Naeem et al. 2021; Tilfani et al. 2020), or financial market related problems (Anderson and Noss 2013; Kumar et al. 2017; Singh et al. 2013). Nowadays, the value and benefits of forecasting in decision- and policy-making are unquestionably recognized across multiple dimensions. Naturally, the techniques that encounter the least amount of forecasting errors will survive and function properly (Moradi et al. 2021). Henceforth, many individuals, including academics, investment professionals, and average investors or traders, are actively searching for this superior system that will deliver high returns.
Stock price prediction based on time series of relevant variables and behavioral patterns (Khan et al. 2020a) helps determine prediction efficiency (Zahedi and Rounaghi 2015). Accurate modelling requires considering external phenomena that include recession or expansion periods and high- or low-volatility periods driven by cyclical and other short-term fluctuations in aggregate demand (Atsalakis and Valavanis 2009b). One of the essential requirements for anyone related to economic environments is to correctly predict market price changes and make correct decisions based on those predictions. Stock-market predictions have been a prevalent research topic for many years. The financial benefit may be considered the most critical problem of stock-market prediction. When a system can reliably select winners and losers in the competitive market environment, it will generate more income for the system owner.
This problem calls for developing intelligent systems for fetching real-time pricing information, which can enhance the profit-maximization for investors (Esfahanipour and Aghamiri 2010). Several intelligent systems or AI techniques have been developed in recent years for decision support, modelling expertise, and complicated automation tasks, including artificial networks, genetic algorithms, support vector machines, machine learning, probabilistic belief networks, and fuzzy logic (Chen et al. 2005; Sharma et al. 2020). Among all these techniques, artificial neural networks (ANNs) are widely popular across the fields mainly due to their ability to analyze complex non-linear relationships between input and output variables directly by learning the training data (Baba and Suto 2000). The characteristic of ANNs in providing models for a large class of real systems has attracted the attention of researchers seeking to apply ANNs to various decision support systems. Nevertheless, despite growing concerns for ANNs utilization, only limited success has been achieved so far mainly due to the random behavior and complexity of the stock market (Baba and Suto 2000).
Several studies have examined stock price forecasting using artificial intelligence. For e.g., Atsalakis and Valavanis (2009b) reviewed around 100 studies focusing on neural and neuro-fuzzy techniques applied to forecast stock markets; Bahrammirzaee (2010) conducted a comparative research review of three popular artificial intelligence techniques, i.e., expert systems, artificial neural networks, and hybrid intelligent systems, applied in finance; Gandhmal and Kumar (2019) systematically analyzed and reviewed stock market prediction techniques; Strader et al. (2020) also systematically reviewed relevant publications from the past twenty years, and classified them based on similar methods and contexts; and Obthong et al. (2020) surveyed machine learning algorithms and techniques for stock price prediction. While these contributions illuminated broad aspects of stock predictability problems using AI, only a few papers focused on how stock forecasting using AI analysis has appeared and evolved in recent decades (Fouroudi et al. 2020).
Our study is beneficial to stock traders, brokers, corporations, investors, and the government, as well as financial institutions, depositories, and banks. Successful AI-based models can assist stock traders, brokers, and investors in achieving massive gains that previously appeared impossible. When financial markets become more predictable, more investors will invest with confidence, allowing businesses to raise additional funds (via stock markets) to repay debt, launch new goods, and expand operations. As a result, consumer and corporate confidence will increase, which will benefit the broader economy (Müller 2019). Depositories will also see an increase in business as a result of the enlarged investor base. Increased investment in financial markets results in increased tax collections, which benefits the government (Neuhierl and Weber 2017). Increased money flow from investors or traders will also help financial institutions such as banks, mutual fund organizations, insurance businesses, and investment corporations (Neuhierl and Weber 2017; Škrinjarić and Orloví 2020). Additionally, just 0.128 percent of the world’s population trades or invests in the stock market—the remainder either lack access to the internet, or lack understanding of financial trading (Asktraders 2020). The majority of active traders and investors are afraid of trading and investing in financial markets because they lack the ability to appropriately forecast stock values due to market volatility (Smales 2017). As a result, they need to adopt an excellent forecasting model to instil investor trust and make massive profits (Hao and Gao 2020). We claim, in this review, that successful technology, supported by new AI-based models, can assist stock traders, brokers, and investors in attaining a competitive edge, which previously seemed unattainable.
Our study contributes by providing a coherent presentation and classification of artificial intelligence methods applied to various financial markets, which can be used for further analysis and comparison, as well as comparative studies. Moreover, our study also provides detailed future avenues on ‘feature selection algorithms’, ‘prediction range’ (long-term, short-term, and very short-term (minute-wise/hour-wise)), ‘stock markets covered’, ‘data pre-processing techniques’, ‘prediction forms’ (one-step-ahead and multiple-steps-ahead), and ‘performance measures’.
Additionally, the literature on the usage of artificial intelligence and soft computing techniques for stock market prediction is yet to develop an accurate predictive model (Zhou et al. 2019). One, the selection of input data is not rigorous in the majority of the studies leading to flawed model simulations and series estimations (Bildirici and Ersin 2009; Dhenuvakonda et al. 2020; Zhang et al. 2021). Two, the extant literature is, at best, partially successful in optimizing the parameter selections and model architectures (Tealab 2018). Three, the pre-processing of input data has not been carried out with precision in the extant literature so far (Atsalakis and Valavanis 2009b). To consolidate the extant literature and direct it towards developing a robust AI-based stock prediction model, we carry out this systematic literature review of papers listed on the Web of Science (WoS) and Scopus databases.
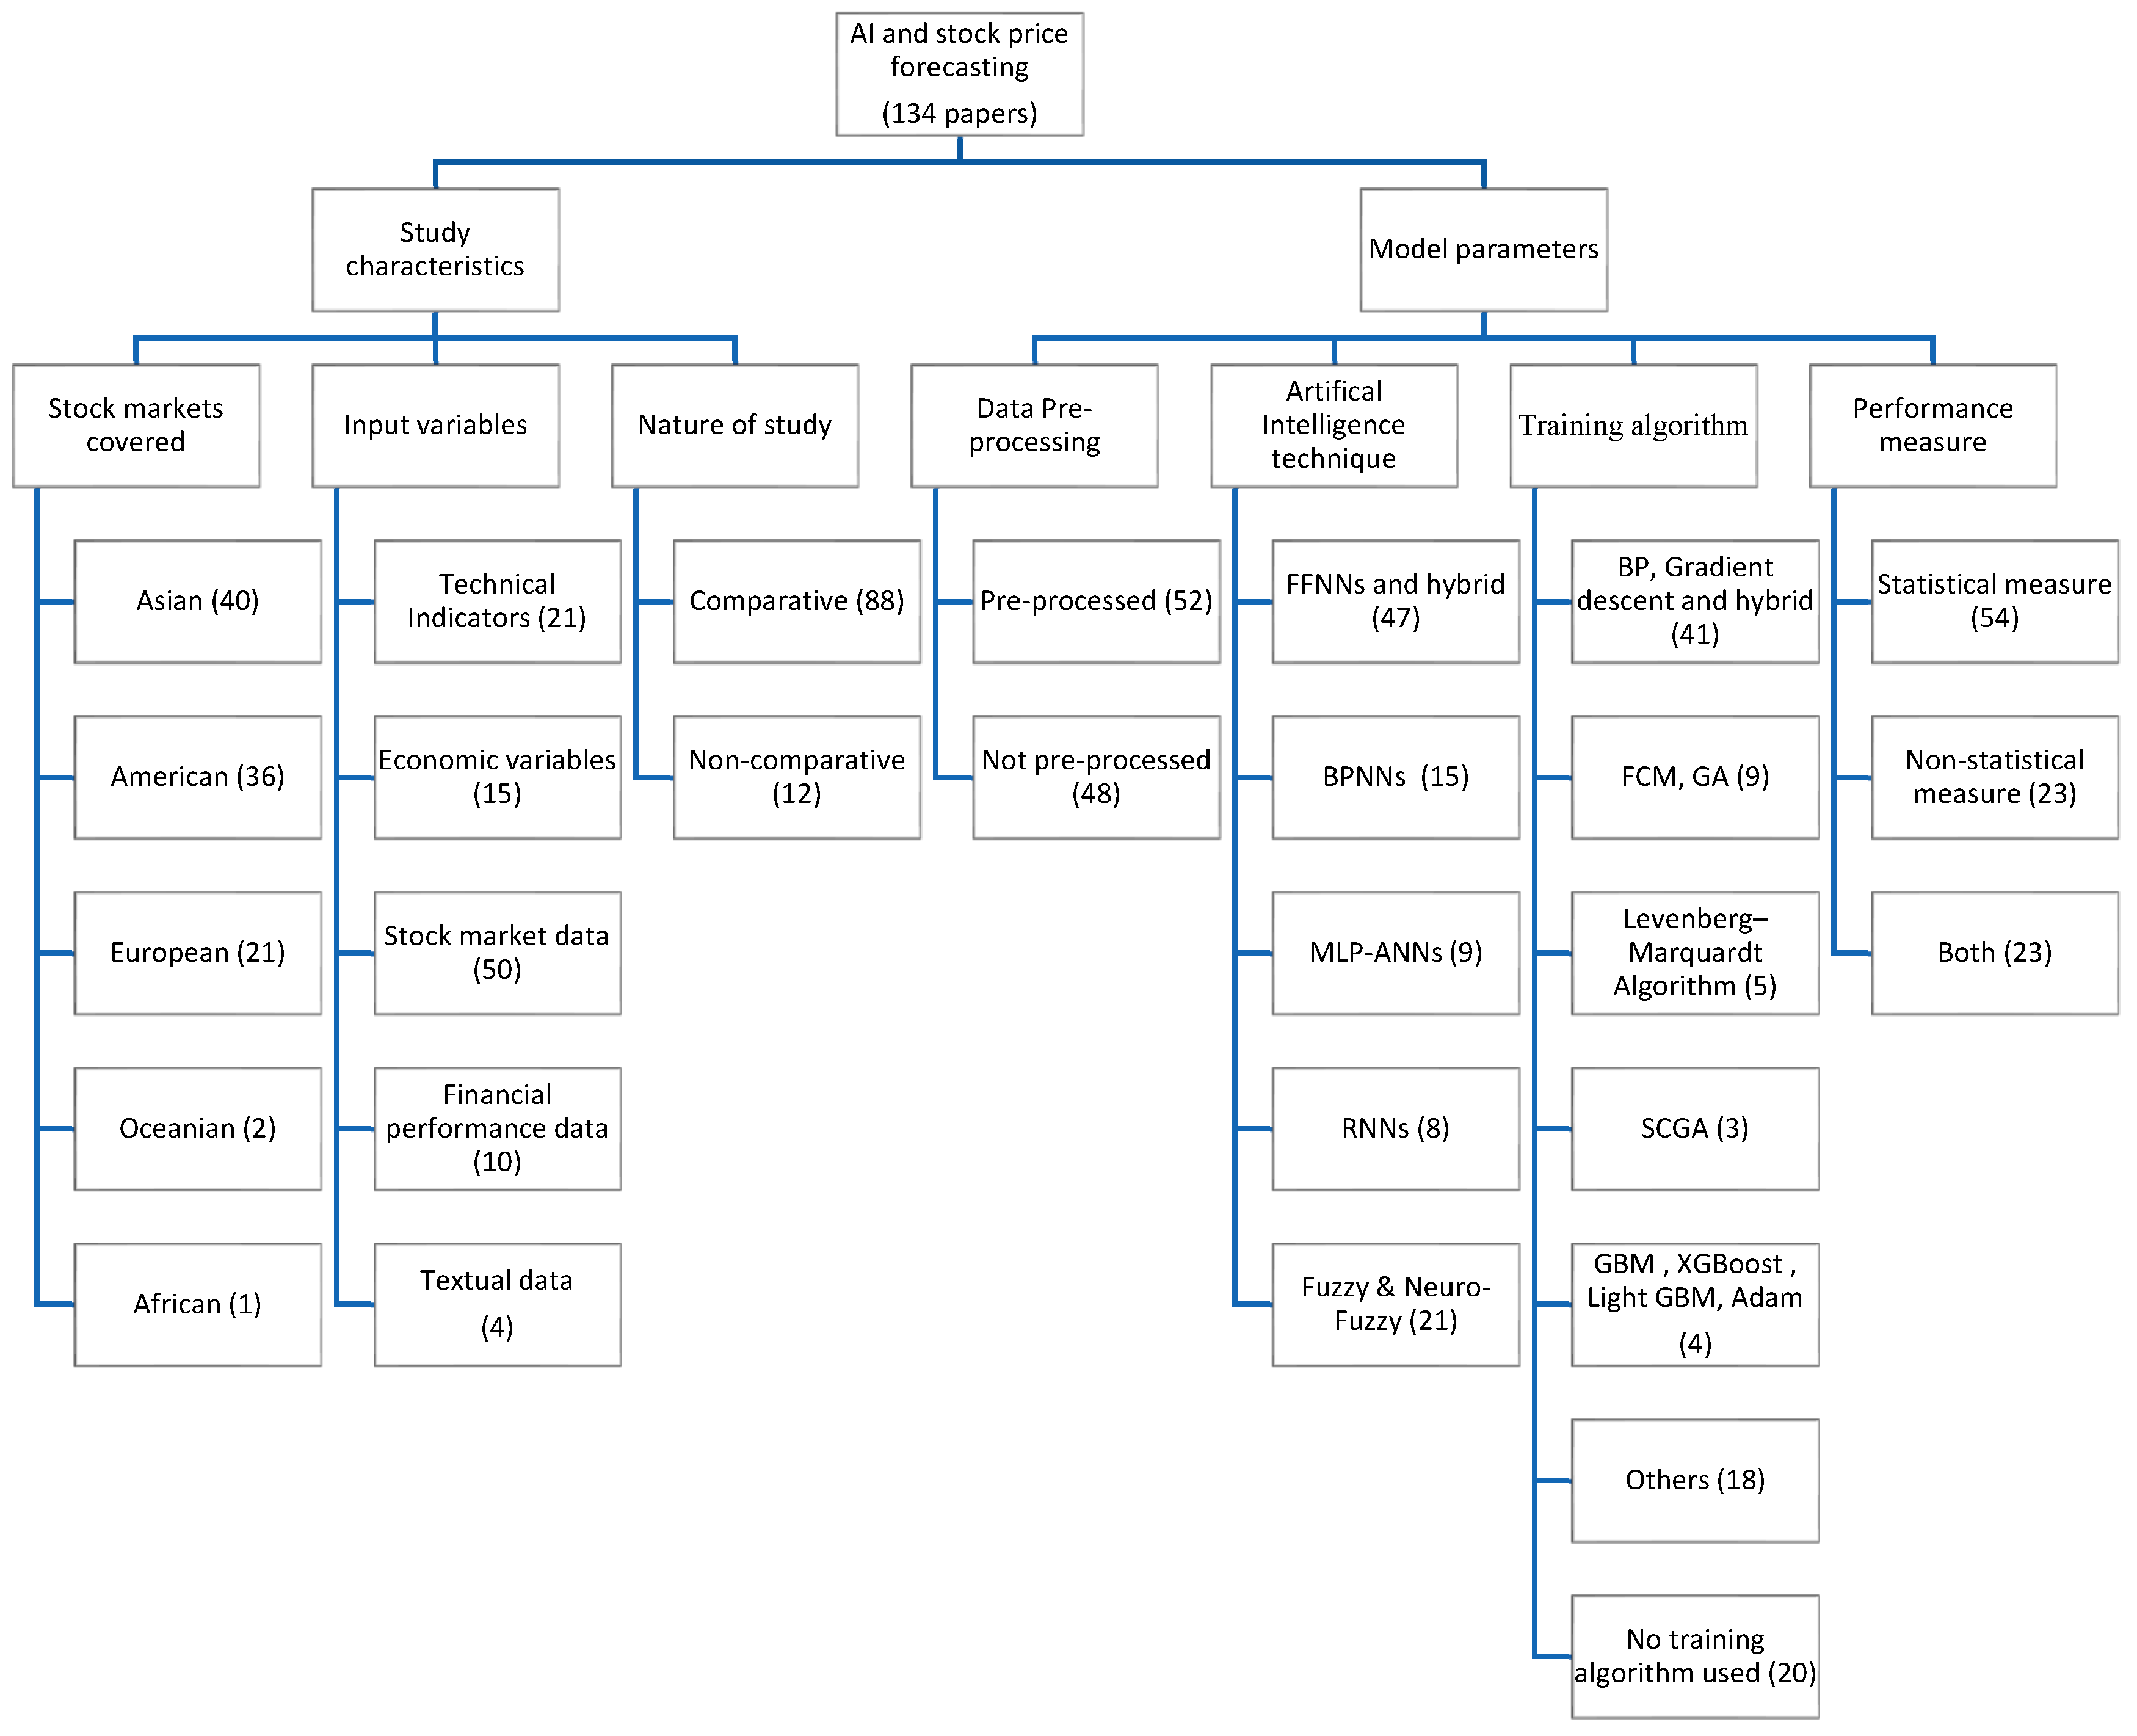
We begin by presenting an organizing framework classifying the extant literature into two major categories: study characteristics and model characteristics, where ‘study characteristics’ is further classified into the stock market covered, input data, and nature of the study; and ‘model parameter’ is grouped as data pre-processing, artificial intelligence technique, training algorithm, and performance measure (Figure 1). Our organizing framework is paralleled with a cohesive presentation of AI techniques employed on stock market predictions that can be used as a reference for future analysis and evaluation.
The rest of the paper is structured in the following manner. The second section represents the methodology of the paper outlining the keywords searched, acceptance criteria applied, and categorization framework. The third section outlays the trends and general description of the existing literature. The fourth section provides the results of this paper, as well as the thematic discussion that discusses the categories and subcategories. The fifth section and sixth section portray the gaps in the extant literature and the future research agenda, respectively. The last section concludes the paper.
2. Methodology
The study’s methodology is influenced by Bansal et al. (2019) and Tranfield et al. (2003), and involves a rigorous review protocol enabling a high level of transparency and replicability. The search was conducted in May 2021 on the WoS and Scopus database(s) after identifying keywords (search terms) related to the artificial intelligence techniques in the title. The keywords used are ‘neur*’, ‘artificial*’, ‘AI’, ‘machine learning’, ‘deep learning’, ‘fuzzy’, ‘soft computing’, ‘forecast*’, ‘predict*’, ‘estimate*’, ‘stock market’, ‘stock return’, ‘stock price’, ‘share return’, ‘share market’, ‘share price’, ‘index return’, ‘index price’, along with the required Boolean operators (‘AND’, ‘OR’, ‘NOT’, ‘NEAR’, ‘W/n’, etc.). Both the WoS and Scopus databases are referred to the search for relevant articles due to their multidisciplinary nature, and easier access to literature belonging to economics, finance, management, psychology, technology, etc., enabling them to attain the most significant and latest studies. Moreover, both the databases have good coverage, which goes back to 1990, compared to other databases (Jain et al. 2019). We set the limit for the search to articles published between 1989 and 2021 (Rosado-Serrano et al. 2018). The papers are only extracted and evaluated if they are indexed by WoS and Scopus (for high credibility), written in English (for correct interpretation), and matched to the query as specified, whereas the remainder of the papers are declined.
This query yielded us 283 papers (152 from WoS; 131 from Scopus) initially, which were filtered for duplicates, leaving us with 202 records. These records were screened twice, leading to the elimination of 24 articles in the first screening process based on titles and abstracts only, as they belonged to different research areas, such as neural sciences, psychology, etc. Further, in the second screening process, 30 more articles were rejected (as they were not related to neural, hybrid-neuro, and stock market prediction), this time by thoroughly analyzing the full text of 178 papers, as they did not focus on applying artificial intelligence technique to forecast stock markets. This task left us with 148 articles in total, as presented in the PRISMA diagram (Moher et al. 2009) in Figure 2.
After shortlisting 148 papers, we divided the entire literature into major and minor categories, only based on 43 auto-coded themes (as given in Table 1) generated with the help of NVivo 12 software. For example, themes such as ‘daily’, ‘index’, ‘market’, ‘price’, ‘returns’, ‘stock’, ‘stock market’, ‘stock price’, ‘time’, and ‘time series’ are categorized as ‘stock market covered’; whereas ‘data’, ‘financial’, ‘information’, ‘input’, ‘parameters’, ‘value’, and ‘variables’ are categorized as ‘input data’; and ‘algorithm’ is categorized as ‘training algorithm’, etc.
The above auto-coded themes are categorized into study characteristics and model characteristics. Study characteristics are further categorized as the stock market covered, input data, and nature of the study. Model characteristics are classified as data pre-processing, artificial intelligence technique, training algorithm, and performance measure. Study characteristics give a glimpse of the stock markets covered, the type of input variables used, and whether or not the author has undertaken a comparative analysis of different AI techniques. Model characteristics detail the forecasting methodology used in the extant literature, including data pre-processing, artificial intelligence techniques employed, training algorithm applied, and performance measures (statistical or non-statistical) used to compare the performance of different models.
Additionally, we also downloaded the text and CSV files (full record and cited references) of 148 papers from both the databases, which included bibliographic data such as title, publication year, source journal, keywords, abstract, authors, authors’ addresses, subject categories, and references (van Nunen et al. 2018). We utilised this text file to employ scientometric or bibliometric analysis using the famous bibliometrix R-tool package (Aria and Cuccurullo 2017). Bibliometric techniques focused on portraying the publication history, the characteristics, and the scientific output advancement within a specific research area (Fouroudi et al. 2020). In our study, we have fetched data related to most contributing countries (Table 2), most relevant authors (Table 3), publications (Table 4), and journals (Table 5) using the bibliometrics R-tool, which is explained in the following sections.
3. Trends and General Description of the Existing Literature
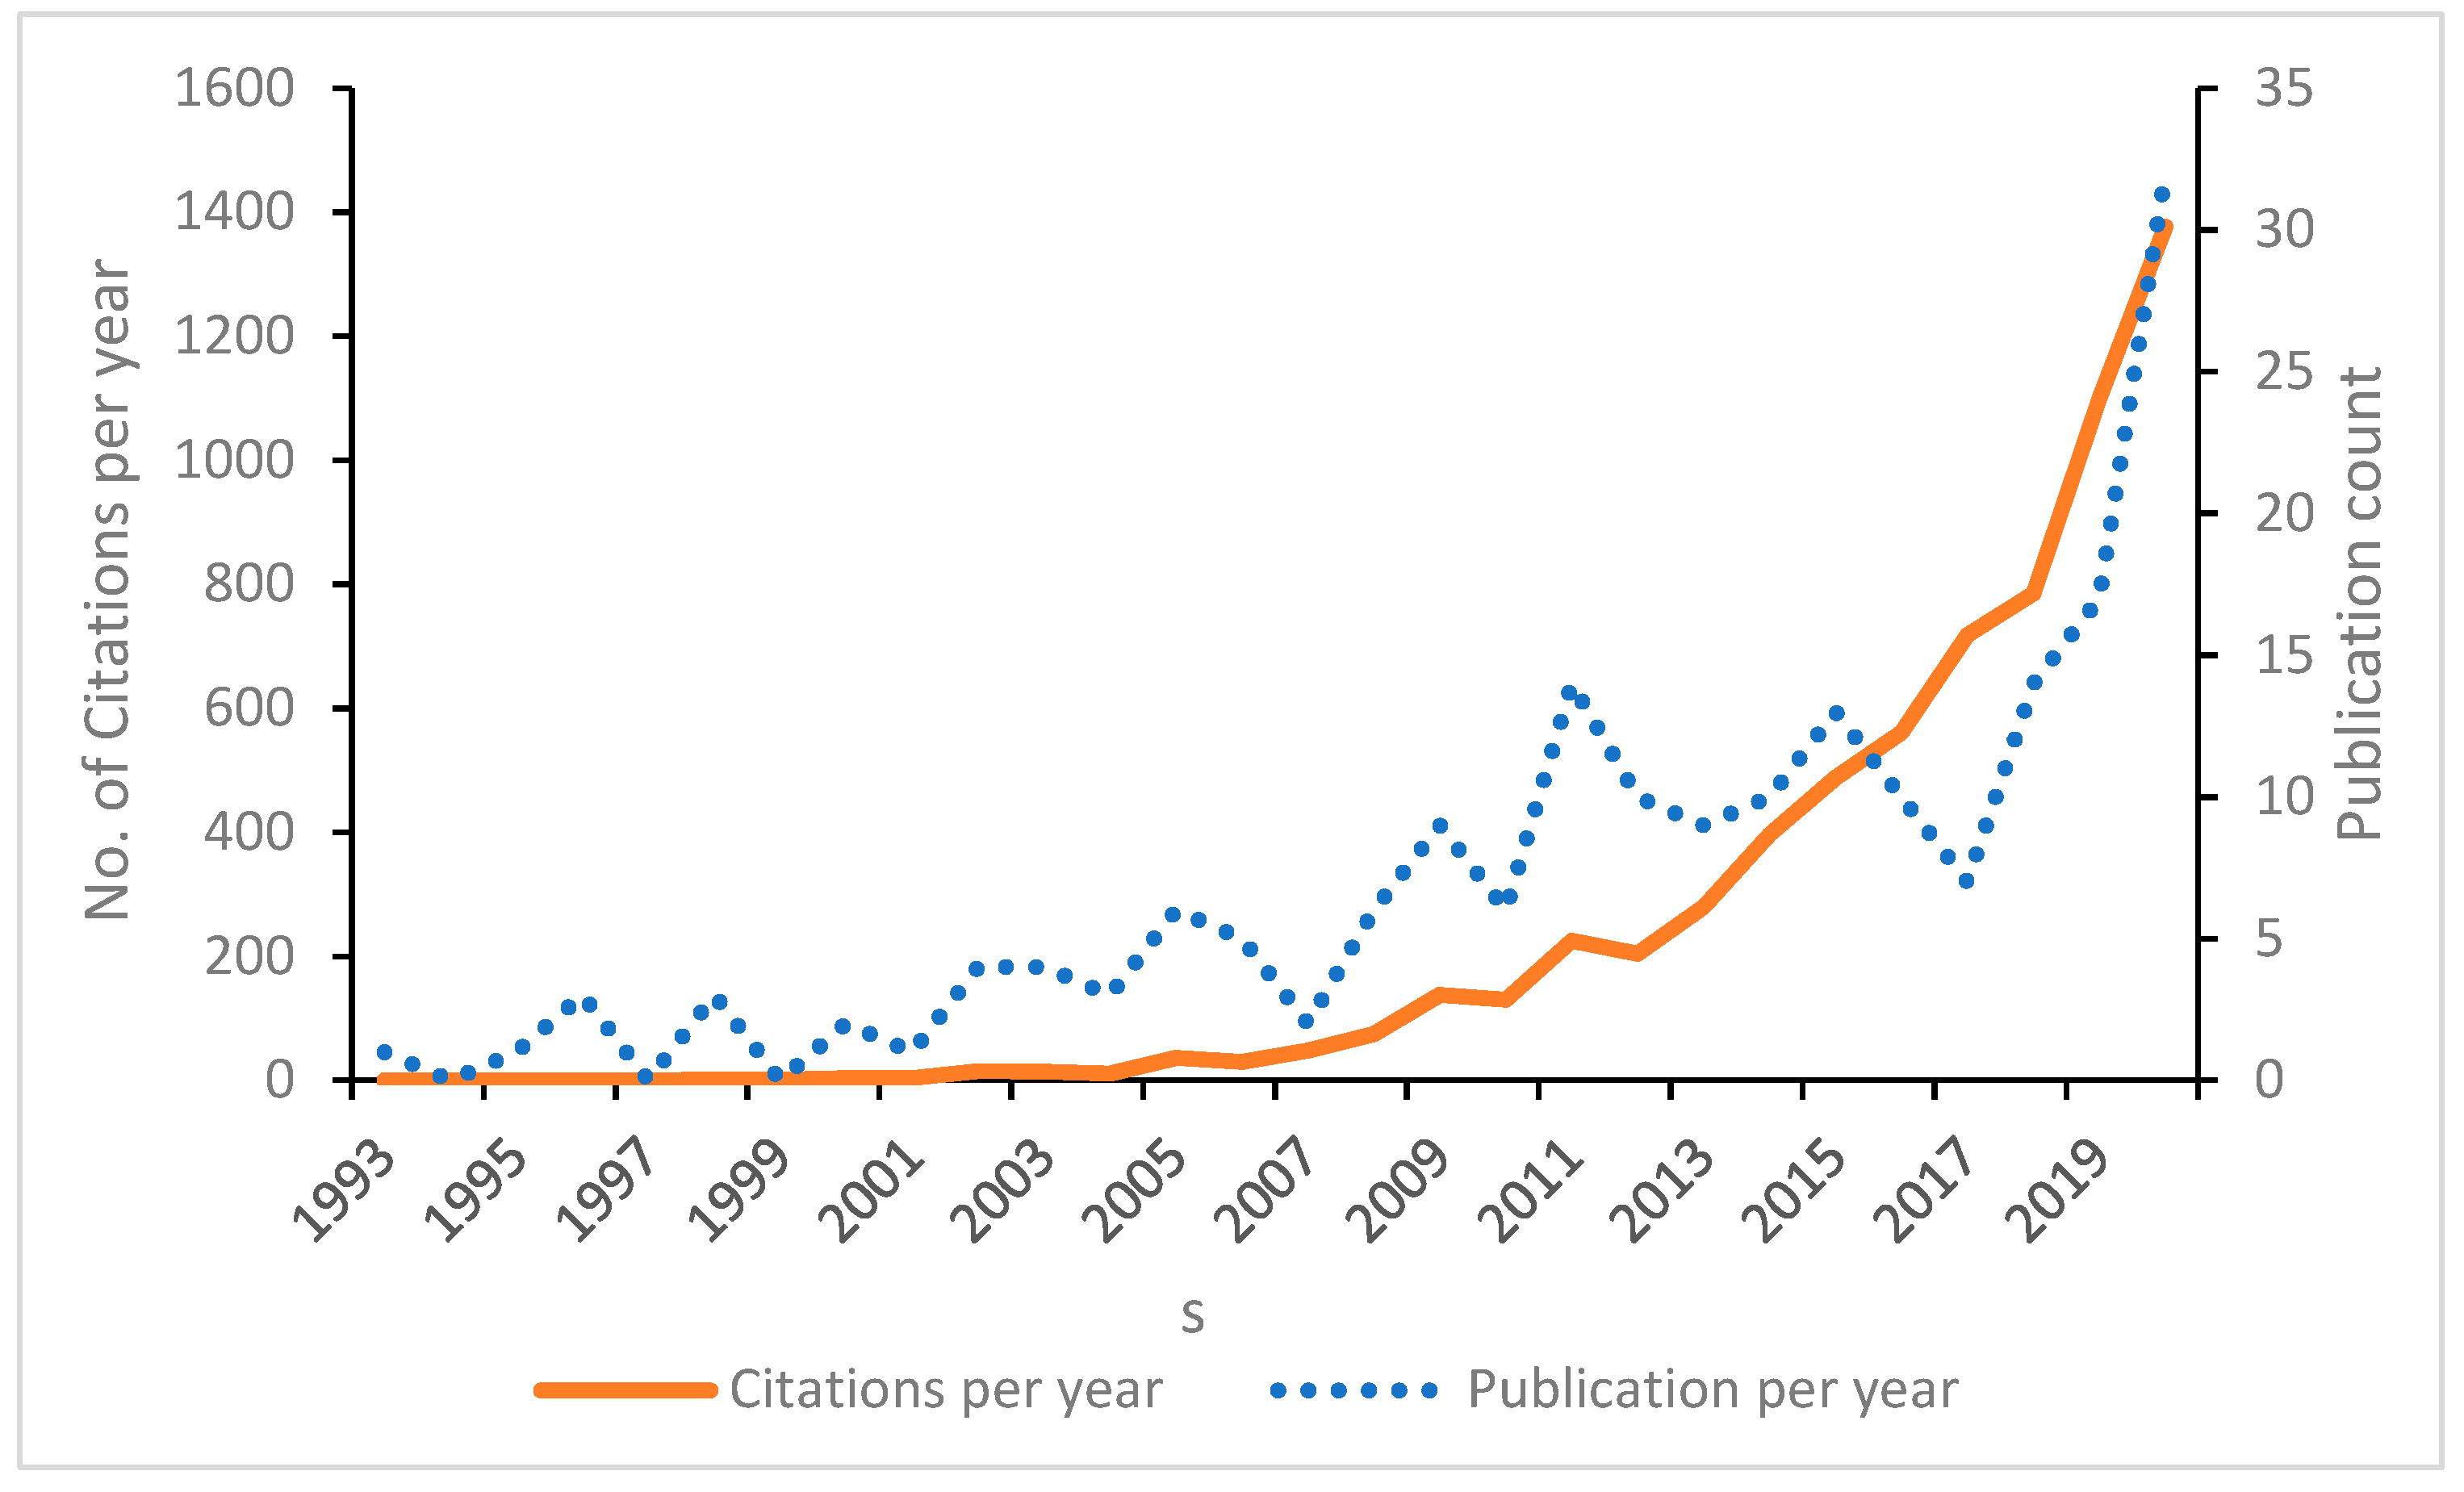
3.1. Publication Output and Growth Trend
Figure 3 summarizes the year-by-year publications and citations of papers relevant to the study’s subject. The research in applying AI techniques in stock market forecasting has significantly increased after 2008, representing a clear increasing trend in the related topic. This could be due to the global economic crisis of 2008 (Caporale et al. 2021), which made stock markets highly volatile, hence, attracting the widespread interest of research scholars and academicians in the discussed topic. The highest citation record is seen in the year 2020, with a 1377 citation record count.
3.2. Most Contributing Countries
Table 2 presents the top ten most contributing or productive countries, along with their international collaboration and citation analysis in the area of stock market prediction using AI. The documents retrieved were written by authors from 27 different countries. China was the most prolific publisher, followed by India, the USA, and Japan. Nonetheless, China (total citations = 1173) is unquestionably the leader in terms of total citations, as well as productivity (number of published articles = 42 (28.37 percent)). Five countries (i.e., Japan, Iran, Korea, Brazil, Australia in Table 2) hosted authors who published in the stock prediction using AI area (ergo, isolated countries in a collaboration aspect). In comparison, the remainder had at least one study that was published in multiple countries, where China (7) has the largest multi-country publications. The reason for this can be attributed to the growing emphasis on research and development, as well as increasing funding opportunities, in the country (Jia et al. 2021).

Table 2.
Top 10 most contributing countries.
| Country | Articles | SCP | MCP | Citations |
|---|---|---|---|---|
| China | 42 | 35 | 7 | 1173 |
| India | 16 | 14 | 2 | 307 |
| USA | 16 | 12 | 4 | 714 |
| Japan | 9 | 9 | 0 | 126 |
| Turkey | 7 | 6 | 1 | 571 |
| Greece | 6 | 3 | 3 | 516 |
| Iran | 6 | 6 | 0 | 351 |
| Korea | 5 | 5 | 0 | 425 |
| Brazil | 4 | 4 | 0 | 182 |
| Australia | 3 | 3 | 0 | 17 |
Note: SCP stands for single country publications; MCP stands for multi-country publications.
3.3. Most Relevant Authors and Publications
Table 3 provides a list of the ten most prolific writers who contributed at least one publication between 1989 and 2021, sorted by cumulative citations earned. The research impact is determined with the help of three author level metrics, namely: h-index; g-index; and m-index. H-index is computed by totaling the publication count for which an author has been cited by other authors at least that same number of times (Hirsch 2005). G-index calculates the distribution of citations received by an author’s publications, depicting the performance of researchers’ top articles (Mazurek 2017). M-index is the median number of citations computed as h/n, where n is the number of years since the first published paper of the author, and is also called the m-quotient (Bornmann et al. 2008). ‘Atsalakis, G. S,’ sits on the top of the list with the highest publication count, the number of citations (473), h-index (4), g-index (4), and m-index (0.308).
Table 3.
Top 10 relevant authors.
| Rank | Author | h_index | g_index | m_index | Total Citations | No. of Publications | Publication Year Start |
|---|---|---|---|---|---|---|---|
| 1 | Atsalakis, G. S. | 4 | 4 | 0.308 | 473 | 4 | 2009 |
| 2 | Valavanis, K. P. | 3 | 3 | 0.231 | 443 | 3 | 2009 |
| 3 | Kim, K. J. | 2 | 2 | 0.091 | 361 | 2 | 2000 |
| 4 | Han, I. | 1 | 1 | 0.045 | 325 | 1 | 2000 |
| 5 | Hadavandi, E. | 3 | 3 | 0.25 | 303 | 3 | 2010 |
| 6 | Baykan, O. K. | 1 | 1 | 0.091 | 219 | 1 | 2011 |
| 7 | Boyacioglu, M. A. | 1 | 1 | 0.091 | 219 | 1 | 2011 |
| 8 | Kara, Y. | 1 | 1 | 0.091 | 219 | 1 | 2011 |
| 9 | Daim, T. U. | 1 | 1 | 0.091 | 212 | 1 | 2011 |
| 10 | Guresen, E. | 1 | 1 | 0.091 | 212 | 1 | 2011 |
Table 4 depicts the top ten cited publications arranged according to the total citations received. Kim and Han (2000) lead in citation count (325 citations), representing high relevance to the content of this document, i.e., various genetic algorithms approaches featuring discretization in artificial neural networks for stock price index prediction, whereas Atsalakis and Valavanis (2009b), who present a survey of soft computing methods used for stock market forecasting, have received the highest number of total citations per year.
Table 4.
Top 10 cited publications.
| Rank | Publication | Total Citations (TC) | TC per Year |
|---|---|---|---|
| 1 | (Kim and Han 2000) | 325 | 14.7727 |
| 2 | (Atsalakis and Valavanis 2009b) | 295 | 22.6923 |
| 3 | (Kara et al. 2011) | 219 | 19.9091 |
| 4 | (Guresen et al. 2011) | 212 | 19.2727 |
| 5 | (Chen et al. 2003) | 204 | 10.7368 |
| 6 | (Enke and Thawornwong 2005) | 187 | 11 |
| 7 | (Yudong and Wu 2009) | 186 | 14.3077 |
| 8 | (Hadavandi et al. 2010) | 176 | 14.6667 |
| 9 | (Ticknor 2013) | 173 | 19.2222 |
| 10 | (Hsieh et al. 2011) | 173 | 15.7273 |
3.4. Most Relevant Sources
Table 5 shows the top 20 impactful journals publishing in the area of stock market prediction using AI over the last three decades, along with their h, g, and m index. ‘Expert Systems with Applications’ is the top journal in the list, with the highest number of publications (23), highest h-index (20), g-index (23), m-index (0.909), and citation count (2414), even though its publication start year is 2000. This is indicative of the growing interest of researchers in the field of AI applicability in different areas post-2000 (Johari 2020), and the significance of ‘Expert Systems with Applications’ in the creation and sharing of knowledge in this field.
Table 5.
Top 10 relevant sources.
| Rank | Source | h_index | g_index | m_index | Total Citations | No. of Publications | Publication Year Start |
|---|---|---|---|---|---|---|---|
| 1 | Expert Systems with Applications | 20 | 23 | 0.909 | 2414 | 23 | 2000 |
| 2 | Applied Soft Computing | 8 | 10 | 0.727 | 472 | 10 | 2011 |
| 3 | Computers & Operations Research | 2 | 2 | 0.105 | 280 | 2 | 2003 |
| 4 | Knowledge-Based Systems | 2 | 2 | 0.167 | 252 | 2 | 2010 |
| 5 | Neurocomputing | 4 | 4 | 0.154 | 140 | 4 | 1996 |
| 6 | International Journal of Forecasting | 2 | 2 | 0.083 | 122 | 2 | 1998 |
| 7 | Journal of Business Research | 1 | 1 | 0.056 | 79 | 1 | 2004 |
| 8 | Neural Computing & Applications | 4 | 8 | 0.041 | 64 | 8 | 1996 |
| 9 | Journal of Retailing | 1 | 1 | 0.038 | 61 | 1 | 1996 |
| 10 | Plos One | 2 | 4 | 0.286 | 53 | 4 | 2015 |
4. Thematic Discussion
4.1. Study Characteristics
This section comprehends the extant literature concerning the stock markets covered, the type of input variables used, and the usage of comparative analysis.
4.1.1. Stock Markets Covered
The extant literature explores different world indices and stock markets to extract the input data directly or indirectly, to train and test their model (Atsalakis and Valavanis 2009b), and subsequently, predict the future prices. Some studies focus on predicting the stock indices at particular points in time, to offer conclusions regarding the related risks, thereby raising questions on the reliability of market robustness for highly successful investments. Such cases can significantly contribute towards vital information about accurate forecasting of models, stock markets, and stock returns (Atsalakis 2014).
This category is designed according to the world continents coded as sub-categories (Europe, Asia, Oceania, America, and Africa) (as given in Table A1). The surveyed stock indices from developed markets include Standard and Poor’s 500 (S & P 500), the Dow Jones Industrial Average (DJIA), New York Stock Exchange (NYSE), and National Association of Securities Dealers Automated Quotations (NASDAQ) from: the USA (Chenoweth and Obradović 1996; Donaldson and Kamstra 1999); the Tokyo Stock Exchange Index (TOPIX) and NIKKEI in Japan (Bekiros 2007; Dai et al. 2012); the Financial Times Stock Exchange 100 Share (FTSE) in London (Kanas 2001; Kanas and Yannopoulos 2001; Vella and Ng 2014); the main German Stock Exchange index, DAX (Hafezi et al. 2015; Rast 1999; Siekmann et al. 2001; Vella and Ng 2014); the Toronto stock exchange (TSX) indices in Canada (Olson and Mossman 2003); the Australian stock exchange index (ASX) in Australia (Pan et al. 2005; Vanstone et al. 2005); and the New Zealand stock index (NZX-50) in New Zealand (Fong et al. 2005). Among all the developed stock indices, S & P 500 has the highest percentage of preference, used in 25% of studies as an input (Kim and Lee 2004).
Even though most of the studies have analyzed stocks from developed countries, equity stock markets from emerging nations are also considered in some works. From Asia, these include: the Korean stock market (Baek and Kim 2018; Oh and Kim 2002); the Chinese stock market (Baek and Kim 2018; Cao et al. 2011; Chen et al. 2018; Oh and Kim 2002); the Indian stock market (Bisoi and Dash 2014; Mehta et al. 2021); the Malaysian stock market (Sagir and Sathasivan 2017); the Thailand stock market (Inthachot et al. 2016); the Taiwan stock market (Hao et al. 2021; Wei and Cheng 2012); the Philippines stock market (Bautista 2001); the Indonesian stock market (Situngkir and Surya 2004); and the Bangladesh stock market (Mahmud and Meesad 2016). From Latin America, this includes the Brazilian stock market (De Oliveira et al. 2013; De Souza et al. 2012). From Europe, this includes: the Greece stock market (Atsalakis et al. 2011; Koulouriotis et al. 2005); the Turkish stock market (Bildirici and Ersin 2009; Göçken et al. 2016); the Slovakian stock market (Marček 2004); the Czech Republic stock market (Baruník 2008); the Hungarian stock market (Baruník 2008); and the Polish stock market (Baruník 2008). From Africa, this includes the Tunisian stock market (Slim 2010).
A few studies focus on using independent stocks or a portfolio of stocks instead of a particular stock exchange market index. For example, Pantazopoulos et al. (1998) use IBM stock price as input, Steiner and Wittkemper (1997) selected 16 stocks from DAX as input, Atsalakis and Valavanis (2006b, 2009a) have incorporated five stocks from the Athens Stock Exchange and the NYSE as input, and the research by Wah and Qian (2006) applied to 10 stocks from the NYSE.
4.1.2. Input Variables
The input variable selection is one of the crucial steps in AI model development, as their poor selection negatively impacts the model’s performance during training and testing phases (Hsieh et al. 2011). The extant literature projects different points of view when selecting (subjectively) appropriate variables for forecasting stock return behavior. Most of the studies use random input variables without explaining their selection criteria, however, using a proper selection criterion may be beneficial for obtaining superior results (Atsalakis 2014). We classify the extant literature based on the input variables (including technical indicators, economic variables, stock market data, and financial performance data and textual data) used in the models of reviewed articles (as given in Table A2). On average, the literature uses two to ten input variables for their model. However, Olson and Mossman (2003), Zorin and Borisov (2007), Enke and Thawornwong (2005), Lendasse et al. (2000), Zahedi and Rounaghi (2015), and De Oliveira et al. (2013) have used 61, 59, 31, 25, 20, and 18 input variables, respectively. The extant literature applies specific techniques to choose the most important input variables for the forecasting process among many selection criteria, based on the effect of each input on the result obtained (Atsalakis and Valavanis 2009b). A few studies cover a vast horizon of observations over the years, as mentioned by Kosaka et al. (1991), who use 300 stock prices as input.
Some studies provide no explanation for selecting input variables, and directly select explanatory variables from the previous literature that explain the effectiveness of using such variables in the least-squares method, stepwise regression, or neural networks (Qiu et al. 2016). The majority of the literature uses daily data, with only a few cases of missing values, as there is no assurance of obtaining better results if the period is kept longer. For example, Ortega and Khashanah (2014) use 2600 observations, Xi et al. (2014) use only 60 observations, and Adebiyi et al. (2014) use ten years of daily data. The technical indicator is a valuable tool for stock analysts and fund managers to analyze the real market situation, and therefore, using them can be more informative than using fair prices. Approximately 21 of the surveyed studies use technical indicators as input variables, which are sometimes combined with daily or previous closing prices, as mentioned by Kim and Han (2000), Armano et al. (2005), and Jaruszewicz and Mańdziuk (2004). Most of the authors may be biased toward fundamental and technical analysis, as they are complements rather than substitutes, thereby combining the related variables (Wu and Duan 2017).
Forecasting stock return or a stock index involves an assumption that publicly available information in the past has the power to predict the future returns or indices, and the sample of such information includes economic variables. It includes interest rates, exchange rates, bond prices, gold prices, crude oil prices, industry-specific information, including growth rates of industrial production and consumer prices, etc. (Enke and Thawornwong 2005). Some studies use daily closing prices of well-established markets like the S & P 500 and DJIA combined with the economic variables. For example, Wu and Flitman (2001) use previous S & P 500 values and six economic indices as input variables, whereas Maknickiene et al. (2018) input daily closing prices of American stock market indexes and economic variables into their model. Thawornwong and Enke (2004) and Qiu et al. (2016) have combined economic variables with financial variables as input.
Stock market data are one of the most commonly used input variables, covering 50% of surveyed articles. The stock market data includes daily opening/closing price (Chen et al. 2018; Gao and Chai 2018; Lei 2018), the daily minimum/maximum price (Chen et al. 2018; Gao and Chai 2018; Kim and Kim 2019; Lei 2018), transaction volume (Kim and Kim 2019; Lei 2018), dividend yield (Kanas 2001; Kanas and Yannopoulos 2001), lagged returns or prices (including stock or index returns, and the value of stocks or indices) (Baruník 2008; Mahmud and Meesad 2016), and the closing price of previous days (up to a week or month) (Jandaghi et al. 2010; Mahmud and Meesad 2016). The extant literature has combined stock market data with technical variables, economic variables, or financial indicators depending upon the input selection criteria employed. The financial performance data are related to the financial indicators of the company, such as the price-earnings ratio (Kim et al. 1998), market capitalization (Cao et al. 2005; Chaturvedi and Chandra 2004), accounting ratios (Olson and Mossman 2003; Zahedi and Rounaghi 2015), price-to-book value (Rihani and Garg 2006), common shares outstanding (Cao et al. 2011), the value of beta (market risk) (Cao et al. 2005; Chaturvedi and Chandra 2004), etc.
Due to the financial markets’ vulnerability to a variety of activities, including corporate takeovers, new product launches, and global pandemics, a few researchers have used textual data as feedback to AI models (Khan et al. 2020a). The textual data includes Google trends data (Hu et al. 2018), newspaper articles (Matsubara et al. 2018), microblogs (Khan et al. 2020a), posts or content on social media platforms such as Twitter and Facebook (Khan et al. 2020a), etc.
Such textual data comes predominantly from three sources, namely, public corporate disclosures/filings, media articles, and internet messages (Fernández-López et al. 2018). Furthermore, researchers have also integrated sentiment analysis in prediction models to obtain higher prediction accuracy, which is gaining widespread attention (Maknickiene et al. 2018). The textual data contains a public and political sentiment that has a massive potential of strongly impacting stock returns and trading volumes. In fact, the extant literature using textual information posits that textual sentiment has coexistent or short-term effects on stock prices, abnormal returns, returns, and trading volumes (Kearney and Liu 2014; Tetlock 2007; Tetlock et al. 2008).
Many studies have included textual data along with stock market data to obtain better prediction accuracy. For instance, Khan et al. (2020a) analyzed the social media and financial news data for predicting the stock market data for ten subsequent days, and their results reported a higher prediction accuracy of 80.53% and 75.16% after using textual data. Similarly, Khan et al. (2020b) used the sentiment and situation feature in their machine learning model, and their findings unveil that the sentiment feature enhances the prediction accuracy by 0–3%, whereas the political situation feature enhances the prediction accuracy by about 20%. Hao et al. (2021) analyzed financial news and stock price data of Taiwan-based companies to predict the stock price trends using fuzzy SVMs and traditional SVMs, where hybrid fuzzy SVMs reported superior prediction accuracy. Mehta et al. (2021) utilized financial news as input data into their machine learning and deep learning models, and their results reported more than 80% accuracy, validating the success of the proposed methodology. Additionally, researchers have incorporated sentiment analysis into prediction models to improve prediction accuracy, a topic that has gained widespread interest (Maknickiene et al. 2018).
4.1.3. Nature of Study
This section represents the comparison made by the authors of their benchmark models against other models to demonstrate the superior performance of the benchmark models. Over 88 percent of reviewed articles have studied the comparison in order to check the accuracy of their benchmark models, which are neural networks or hybrid-neuro for this study, including fuzzy cognitive maps (FCM), support vector machines (SVM), feed-forward neural networks (FFNN), recurrent networks, probabilistic neural networks (PNN), radial basis function network (RBFN), and others concerning the conventional techniques, such as GARCH family models, autoregressive (AR), autoregressive integrated moving average (ARIMA), autoregressive moving average (ARMA), RW (random walk), B and H strategy, stochastic volatility models, linear, and non-linear models. The comparison is made interchangeably with any of the conventional and non-conventional techniques, and the performance is measured with the help of different performance metrics, as depicted in the performance measure section. For example: Kimoto et al. (1990), Refenes et al. (1993), Qi (1999), and Sagir and Sathasivan (2017) have compared their ANN models with LR and MLR techniques; Harvey et al. (2000), Motiwalla and Wahab (2000), Thawornwong and Enke (2004) have made a comparison of the ANN model with LR, MLR, and the ‘buy and hold’ strategy; Zorin and Borisov (2007) and Safi and White (2017) have compared the ANN model with ARIMA; and Wu and Duan (2017) have analyzed both the Elman neural network- and BP neural network-based stock prediction models for comparison.
Furthermore, we observed that hybrid AI models are superior in terms of prediction accuracy, accounting for more than 90% (Atsalakis and Valavanis 2009a; Esfahanipour and Aghamiri 2010), in contrast with individual AI models that report prediction accuracy between 50–70% (Di Persio and Honchar 2016; Malagrino et al. 2018; Pang et al. 2020). For instance, Rather et al. (2015) compared the performance of RNN and a hybrid prediction model (HPM) in forecasting stock returns of five companies listed on the NSE, and their results showed an outstanding prediction performance of the HPM in comparison to RNN. Similarly, Hao and Gao (2020) also aimed to predict stock market index trends using a hybrid-neural network that uses multiple time scale feature learning, and compared the results with the benchmark AI models, such as simple ANN, SVM, LSTM, CNN, and the multiple pipeline model. Their findings showed an accuracy of 74.55%, which was the maximum achieved after running all the models.
Moreover, in surveyed articles, AI models showcase better performance when compared with traditional models (Baruník 2008; Bildirici and Ersin 2009). For example, Khansa and Liginlal (2011) compared vector autoregression and time-delayed neural networks for predicting stock market returns, and the prediction accuracy of time-delayed neural networks was 22% greater when compared with the vector autoregression. Likewise, Sagir and Sathasivan (2017) attempted to predict the future index of the Malaysia Stock Exchange Market using the ANN model and multiple linear regressions (MLR), and traditional forecasting techniques, and their findings confirm the higher prediction accuracy for the ANN model when compared to the traditional MLR technique.
4.2. Model Characteristics
This section details the specifications of forecasting methodology imbibed by authors in their studies, and the categories classified are: data pre-processing; artificial intelligence technique; training algorithm; and performance measure. Data pre-processing is usually done to prepare the data before using it as an input in the AI model for stock prediction. The category ‘artificial intelligence technique’ gives us the brief of the type of neural network, the transfer function, and the number of layers (input, hidden, and output) used in AI models by authors. The training phase in the model computation requires a training algorithm that helps in minimizing the performance error of the model, therefore, it is assigned as a separate category, and the last classification ‘performance measure’ outlays the various performance measures or their combinations used for the comparison of different model performances.
4.2.1. Data Pre-Processing
Theoretically, there is no requirement in reducing the input variable dimension for the neural network-based nonlinear modelling technique, as it can easily reach the regional minimum convergence level. However, with the development of the information age and increasing data complexity, data pre-processing has become indispensable for most of the authors in their study (Qiu et al. 2016). The stock market returns prediction via neural networks has some limitations due to a tremendous amount of noise, non-stationarity, and complex dimensionality, which can be overcome if data pre-processing is performed before the stock returns prediction using neural networks that involve a transformation of the raw, real-world data to a set of new vectors (Qiu et al. 2016). The aim of data pre-processing is to minimize the estimated error between the data before and after the transformation, thereby reducing the risk of over-fitting in the training phase (Hsieh et al. 2011). The surveyed articles display whether the data is pre-processed in their study or not, hence, the sub-themes are designed accordingly (as given in Table A3).
Data is pre-processed in 55% of the surveyed articles, and the pre-processing techniques used are data normalization, principal component analysis (PCA) (Abraham et al. 2001), and Z score (Leigh et al. 2002). The data normalization technique is further divided into logarithmic data pre-processing (Chun and Park 2005; Constantinou et al. 2006; Dai et al. 2012) and data scaling between the ranges of 0 to 1 (Bisoi and Dash 2014; Dash and Dash 2016; Mahmud and Meesad 2016; Nayak et al. 2016; Wu and Duan 2017), −1 to 1 (Ghasemiyeh et al. 2017; Hu et al. 2018; Inthachot et al. 2016; Wang et al. 2012; Zahedi and Rounaghi 2015), and −0.5 to 0.5 (Lei 2018). The data are normalized in order to synchronize the input data with the activation function used in the neural networks, which is a bounded function and is not capable of exceeding its upper bound when the stock data easily overshoots, thereby causing inconsistencies in training, testing, and validation phases (Hui et al. 2000). The PCA involves feature extraction that follows a quantitative approach for transforming a more significant number of (potentially) correlated factors (or variables) into a (fewer) number of uncorrelated factors called principal components (Abraham et al. 2001). The pre-processed data is fed into the neural networks for stock returns prediction, where the neural network ‘learns’ and trains itself after adjusting the interconnection weights between its layers (Abraham et al. 2001). It is interesting to highlight that not all articles provide details about data pre-processing techniques used or whether any pre-processing occurs, however, all the articles referring to data pre-processing find it to be necessary before the actual data analysis process starts (Atsalakis and Valavanis 2009b).
4.2.2. Artificial Intelligence Technique
Artificial intelligence refers to replicating human behavior by a machine with a set of highly complex input data required for learning and training, to produce an expected output (Wu and Duan 2017). The AI techniques such as ANNs, fuzzy logic, and genetic algorithms (GAs) are popular research subjects used by most authors in their study, as they can deal with complex problems that classical methods cannot solve. This study focuses on neural- and hybrid-neuro networks derived and applied to forecast stock markets.
An ANN consists of a system of interconnected ‘neurons’ that compute figures from input data so that input neurons feed the values to the hidden layer neurons, and the hidden layer provides them for the output layer (Zahedi and Rounaghi 2015). They are non-linear networks with the advantages of self-organizing, data-driven, self-learning capability, self-adaptive, and an associated memory, similar to the human brain, used to conduct, classify, predict, and recognize patterns (Hu et al. 2018). They also can learn and obtain hidden functional relationships, hence, they have been excessively used in the financial fields, such as stock prices, returns, profits forecasting, exchange rate, and risk analysis and prediction (Wang and Wang 2015). Different types of neural networks include FFNNs (Andreou et al. 2000; Atiya et al. 1997), BPNN1s (Quah and Srinivasan 1999; Witkowska 1995), MLP-ANNs (Kanas 2001; Kanas and Yannopoulos 2001), and RNNs (Gao and Chai 2018; Hsieh et al. 2011) (as presented in Table A4). Feed-forward neural networks are one of the simplest neural networks, and their hybrids are employed in approximately 47% of the surveyed articles (Chung and Shin 2020; Ghasemiyeh et al. 2017). The essential characteristic of FFNNs is that they are the simplest, and only establish connections with neurons in a forward manner, and they do not communicate with neurons on the same or the previous layer (Zavadskaya 2017). Additionally, they may or may not have the hidden layers, but compulsorily have both the input and output layers. Due to such simplicity, they cannot be used for deep learning problems, owing to the absence of backpropagation and dense layers (Chen and Abraham 2006).
BPNNs apply back-propagation of the error gradient to fine-tune the weights of the neural network obtained in the previous epoch (i.e., iteration). Such tuning aids in reducing the error rates, and makes the model highly reliable by increasing its generalization (Rumelhart et al. 1986). Lately, many studies have started using convolutional neural networks (CNNs), which are a type of feed-forward networks only, but have grid-like topology, unlike other neural networks. They apply a specialized kind of linear operation, and use convolution, apart from general matrix multiplication, in at least one of their layers. Studies that have employed CNN’s include Cao and Wang (2019), Chung and Shin (2020), Liu et al. (2020), and Wu et al. (2021).
The hybrids include: reasoning neural networks (Tsaih et al. 1998); long short term memory RNNs (LSTM-RNNs) (Qiu et al. 2020; Selvin et al. 2017; Zhuge et al. 2017); temporal difference learning (TD-Learning) neural networks (Baba and Suto 2000); genetic algorithm-based neural networks (Inthachot et al. 2016; Matilla-García and Argüello 2005); Elman neural networks (Halliday 2004); recurrent finite impulse-response neural networks (RFIR-ANN) (Wah and Qian 2006); adaptive time-delay neural networks (ATNNs) and the time delay neural networks (TDNNs) (Kim and Shin 2007); neural network-GARCH models (Bildirici and Ersin 2009; Guresen et al. 2011); autoregressive moving reference neural networks (Rather et al. 2015); and principal component analysis-based neural networks The multi-layer perceptron neural networks use a feed-forward algorithm and supervised learning for complex non-linear functions with a significant accuracy rate (Zavadskaya 2017). MLP-ANNs are usually trained with static backpropagation, and are primarily used for deep learning problems, as they have dense, fully connected layers, but they tend to become slower with the number of hidden layers (Mo and Wang 2013). Few studies use MLP-ANNs with other neural networks as well, for example, Ghasemiyeh et al. (2017) have employed MLP combined with the dynamic artificial neural network (DAN2) in their study, and Hui et al. (2000) have used the hybrid time lagged network (HTLN), which integrates the supervised multilayer perceptron using a temporal back-propagation algorithm with the unsupervised learning of the Kohonen network for stock returns prediction. A recurrent neural network (RNN) is another version of ANN, which uses a feedback mechanism, and is designed to learn sequential or time-varying patterns (Gao and Chai 2018). They have dynamic cycled connectivity between their nodes for communicating to the neurons in all the layers of the networks, and store the information (Zavadskaya 2017).
Lately, researchers have been actively using deep learning networks that exploit multiple layers of non-linear information processing with either supervised or unsupervised feature extraction and transformation, and for classification and pattern analysis (Ghai et al. 2021). The reasons behind their increased popularity include their drastically high chip processing abilities, and the increased size and complexity of data used for training (Deng and Yu 2013). Examples of deep learning neural networks are CNNs, LSTMs, RNNs, RBFNs, MLPs, etc.
In fact, the traditional neural networks (such as simple ANN and BPNN) have a shallow neural network structure with an input layer, hidden layer, and output layer (fewer layers), which lack effective learning and efficient data feature representation, thus affecting prediction accuracy. Therefore, researchers have started using deep learning neural networks, as they have a superior computational capacity, and report higher prediction accuracy (Cao and Wang 2019).
The number of layers in the neural network models (input, hidden, and output layers) varies in the reviewed articles, however, the majority study three-layer architecture. Representative studies include Constantinou et al. (2006), Inthachot et al. (2016), and Kim and Kim (2019), who have used three layers in their model, whereas Chen et al. (2018) and Rather et al. (2015) have used four layers in their model. The fewer the hidden units in the hidden layer, the more generalizable the ANN is. It is necessary not to over-fit the ANN with a large number of hidden units before the data can be memorized. This issue is because the hidden units are like a storage system in character. It learns about the noise present in the training set, along with the key structures, which are not needed to be generalized (Quah and Srinivasan 1999). A transfer (activation) function exists between every layer, which determines the strength that enables transmission of the summed signal to the next connected layer (Matilla-García and Argüello 2005). The transfer (activation) function helps in preventing the outputs from reaching huge values that can paralyze the ANN structure (Duch and Jankowski 1999). The transfer functions employed between different layers by the reviewed articles are log (Cao et al. 2011), sigmoid (Ghasemiyeh et al. 2017), hyperbolic tangent (Ruxanda and Badea 2014), tangent (Inthachot et al. 2016), and pure linear functions (Ghasemiyeh et al. 2017; Göçken et al. 2016; Guo et al. 2015).
The fuzzy and hybrids have an advantage over expert systems, as they can easily extract rules without explicitly formalizing them, which is an important factor in a chaotic and partially understood stock market environment, and the representative studies using the fuzzy models are Bekiros (2007), Mahmud and Meesad (2016), Rajab and Sharma (2019), and Sugumar et al. (2014). Different membership functions are used for fuzzification and defuzzification, which are: generalized bell (Atsalakis and Valavanis 2006a; Mahmud and Meesad 2016; Vella and Ng 2014); Gaussian (Bisoi and Dash 2014; Dash and Dash 2016; Rajab and Sharma 2019); logistic; sigmoid (Enke and Mehdiyev 2013; Laboissiere et al. 2015; Rather et al. 2015); trapezoid (Atsalakis et al. 2011; Dong and Zhou 2002); and triangular (Gradojevic et al. 2002; Hadavandi et al. 2010) membership functions.
The extant literature also talks about type-1 and type-2 fuzzy neural network systems (Huarng and Yu 2005), where type-1 fuzzy neural networks (FNN) have characteristics such as parallel computation, easy implementation, parameters convergence, and a fuzzy logic inference system, and the membership functions and the rules can be easily modelled, as well as trained, using linguistic and numeric information. Nevertheless, type-1 fuzzy neural network systems (Huarng 2001) face issues such as information or data uncertainty, which can be treated with the help of type-2 fuzzy (Chakravarty and Dash 2012; Lee et al. 2003; Liu et al. 2012) sets, which minimize the effects of uncertainties in rule-base fuzzy logic systems (Lee et al. 2003). Other fuzzy hybrids include ensembles of ANFIS models (Melin et al. 2012), ensembles of ANFIS models with genetic optimization of interval type-2 and type-1 fuzzy integrators (Soto et al. 2016), and ensembles of interval type-2 fuzzy neural network aggregation models (FAM) with modular neural networks (MNNs) (Soto et al. 2019).
4.2.3. Training Algorithm
The training phase in the model computation requires a training algorithm that helps in minimizing the loss index function that measures the AI model performance on a data set. The loss index function is composed of the error term and a regularization term, where the error term evaluates the fitness of the dataset in an AI model, and the regularization term helps in preventing the over-fitting problem (Hsieh et al. 2011). The back-propagation (BP) algorithm is the most widely accepted training method, incorporated by approximately 36% of the surveyed articles (Enke and Mehdiyev 2013; Guo et al. 2015).
Since the BP algorithm has a chance of being stuck in local minima, it may struggle to locate the global optimal solution. So far, the existing literature has relied on evolutionary algorithms (EAs), which are thought to be the most effective at locating the global solution due to the usage of probabilistic transformation rules, rather than deterministic rules, in updating the solutions. Numerous studies have proposed multiple variants of EAs to date, namely, particle swarm optimization (Chen and Abraham 2006; Hassan et al. 2005), genetic algorithm (Hadavandi et al. 2010; Kim and Kim 2019; Kim and Han 2000; Nayak et al. 2016; Qiu and Song 2016), harmony search (Dash et al. 2015), differential evolution (Enke and Mehdiyev 2013; Takahama et al. 2009), artificial bee colony (Shah et al. 2018), and some of the hybrid algorithms (Abdel-Kader 2011; Garg 2016) (as displayed in Table A5).
Other training methods used are fuzzy cognitive maps (FCM) (Sugumar et al. 2014; Wei 2011), Levenberg–Marquardt algorithm (Göçken et al. 2016; Safi and White 2017; Sagir and Sathasivan 2017; Wu and Duan 2017), sealed conjugate gradient algorithm (Bildirici and Ersin 2009), a hybrid of random optimization and error back-propagation (Baba and Kozaki 1992; Baba and Suto 2000), estimation of distribution algorithm (Chen et al. 2005), cross-validation method (Pérez-Rodríguez et al. 2005), delta rule learning algorithm (Wong et al. 1992), equalized learning algorithm (Mizuno et al. 1998), fuzzy system training (Atsalakis et al. 2011), genetic algorithm (Hadavandi et al. 2010; Kim and Kim 2019; Nayak et al. 2016; Qiu and Song 2016), least mean square training (Ansari et al. 2010; Bekiros 2007; Vella and Ng 2014), mean square error (Witkowska 1995; Steiner and Wittkemper 1997; Yumlu et al. 2004; Yümlü et al. 2005), moving window (Hui et al. 2000; Setnes and van Drempt 1999), quick-prop training algorithm (Martin Rast 1999), and simulated annealing training technique (Chun and Park 2005; Qiu et al. 2016).
Recently, researchers have started using novel training algorithms such as adaptive moment estimation (Adam) (Gao and Chai 2018) and boosting algorithms, including adaptive boosting (AdaBoost) (Nabi et al. 2020), gradient boosting method (GBM) (Ma 2020), extreme GBM (Dey et al. 2016), and light GBM (Ma 2020). Adam is considered computationally efficient, requires less memory, and is unaffected by the diagonal rescaling of the gradients (Kingma and Ba 2014). The boosting algorithms have the potential of enhancing the performance of the weak learning algorithm. They aid in selecting training sets for the weak classifier to force it to conclude something novel regarding the data after each iteration.
4.2.4. Performance Measure
The performance measures are used to evaluate the AI model performance, and are classified into statistical and non-statistical measures (see Table 6). Some of the statistical measures used in surveyed articles are mean square error (MSE), mean absolute error (MAE), mean squared prediction error (MSPE), root mean square error (RMSE), mean absolute percentage error (MAPE), normalized mean square error (NMSE), squared correlation (R-square), and standard deviation. Even though statistical errors provide an overview, they are insufficient for evaluating the model, providing no information on the direction of the stock price movement as investment decisions are taken according to the general trend (i.e., higher or lower next price). Therefore, the majority of the articles include non-statistical performance measures (Atsalakis et al. 2016). The non-statistical measures only deal with the profitability side of the forecast, the most common being the HIT rate, which calculates how successful the trend-forecasting abilities of the proposed model is (Atsalakis et al. 2016). Other non-statistical measures include an average rate of return, trend prediction, average annual profit, break-even transaction cost, and cumulative abnormal return. It is not reported in the reviewed articles regarding the superior performance measure for models forecast comparison, however, only a few articles provide definite conclusions about which measure is the best (Atsalakis et al. 2016).
5. Gaps in the Extant Literature
The results of this study indicate interesting areas that lacked critical examination and much deserved scholarly attention. Firstly, the input data being an essential part of the AI model is not investigated or fairly selected by most authors, as they directly influence the time series estimation, and the entire model simulation and training depend on it.
Secondly, the prediction accuracy relies on the optimal parameter selection used to implement AI models that can result in even more significant results. The extant literature unveiled that a varied combination of input variables is employed with different model characteristics, where every study provided satisfactory results. Since the model architecture directly impacts the system performance, many authors tried to improve the model architecture in their study, but they were partially successful. Most of them have employed trial and error methods, which are a labor-intensive and time-consuming process, without explaining their choices. Furthermore, many studies have estimated the degree of accuracy and the acceptability of certain forecasts by computing the deviations from the observed values (Bildirici and Ersin 2014b; Hao and Gao 2020). However, forecasting methods that report minimal forecast error may not be enough to meet the objective of profit maximization for the financial market practitioners, which means that stock trading with even a small forecast error may prove to be disadvantageous, calling for the need for accurate forecasting of the direction of movement. Thirdly, data pre-processing being an essential part of the experiment is vaguely applied in the existing literature. According to Atsalakis and Valavanis (2009a), the pre-processing of input data may affect the model prediction performance. Large ranged values of input data can suppress the training process effectiveness, therefore, data transformation techniques such as data scaling can help in providing the solution to the mentioned problem. Also, selecting appropriate indicators through sensitivity analysis can assist the elimination of redundant inputs, leading to better performance results.
Fourthly, the majority of the articles have used more than one performance measure to report their model’s accuracy, and very few articles talk about the important performance measures used to analyze the suitability and performance of the AI model. Validation is a critical aspect of any AI model construction, and relies on the performance measures used to analyze the result, hence, it is imperative to report a superior performance measure or a combination of them. Experimental validation aims to determine how well a learned AI model generalizes to a test set of data in place of the training set. This helps determine whether the model is overfitting or underfitting the results, such that an appropriate decision can be made (Twomey and Smith 1995). Just 50% of the papers reviewed in our study used the validation package, whereas the remainder presented their findings directly from the test set, omitting the critical phase of experimental validation. Additionally, there is a lack of nonlinear and medium/long-term time series forecasting, as most strategies concentrate on short-term forecasting. Also, there is a lack of references to other artificial intelligence techniques and multistep ahead forecasting.
6. Future Research Agenda
Over the past two decades, the extant literature on AI application to stock market prediction has grown exponentially. This review suggests different areas for future research (see Figure 4). First, future researchers can focus on implementing feature selection algorithms, and propose a parameter optimization method for different neural networks to obtain better experimental results. Only a few studies have employed feature selection algorithms. These findings further emphasize the importance of prospective researchers validating the proposed techniques (Chen et al. 2013a). Second, the existing literature focuses on short-term financial series forecasting, necessitating the need to investigate more mid-term, long-term, and very short-term (hourly or minutely) financial series forecasting, which can assist intraday traders and other financial investors in generating considerable profits. The literature on the intra-day stock price prediction is scarce, which could be picked, by future researchers.
Third, the majority of studies (Patalay and Bandlamudi 2020; Zhao et al. 2021) concentrate on financial markets in developed economies, but recently, several papers have shown that predictability of return still exists in less developed financial markets (Chen et al. 2003). Moreover, it was observed that the developed AI models function differently for developed markets (Cheng et al. 2007; Dong and Zhou 2002) and developing markets (Dai et al. 2012; Zhou et al. 2019). Harvey (1995) examined that the degree of predictability in the emerging or developing markets is much greater than what is seen in developed markets. Furthermore, local information plays a significant role in predicting returns in emerging or developing markets compared to developed markets. This characteristic can aid in explaining the predictability disparity between the two kinds of markets. Future researchers should focus on determining the cause for this discrepancy and, specifically, distinguishing the types of AI models used in both cases. Fourth, data pre-processing techniques, such as data transformation, scaling, and principal component analysis, can be used more often to increase prediction precision. Numerous studies on time series analysis have shown that pre-processing raw data is beneficial and essential for system reliability and model generalization to unknown data (Guo et al. 2015). As new data is gathered for stock market forecasts, if the predictive model can be refined to account for it, the model’s adaptation to the new data can improve, and its predictive accuracy can increase. Atsalakis and Valavanis (2009b) suggested that not all papers include pre-processing data information, or whether any pre-processing methods are used. This highlights the significance of considering the pre-processing techniques used in stock market forecasting. To improve the forecasting model’s performance, more effective dimensional reduction approaches should be applied. Fifth, most reviewed articles concentrate on the one-step-ahead forecast (that uses an output neuron). There are two forms of prediction: one-step-ahead and multiple-steps-ahead, where multiple-steps ahead prediction has been considered superior due to its dynamic nature (Guanqun et al. 2013). Future researchers may focus on multiple-step ahead predictions to develop accurate, high-performing AI prediction models with a high degree of accuracy. Sixth, since current scholarship does not have a superior output criterion for comparing model predictions, prospective researchers may experiment with, and compare, various performance metrics (statistical, non-statistical, or both) to determine their measuring power and suitability for AI models, thus, assisting in reporting more accurate results. Additionally, prospective researchers may perform experimental validation to determine if their model is over- or under-fitting the results, which will assist them in improving prediction accuracy.
Seventh, the implementation of more than one AI technique for comparison can be adopted in maximum studies focusing on stock market prediction. Moreover, most studies that have proposed a hybrid AI model have reported superior prediction accuracy compared to the single AI model, which calls for the need to experiment with hybrid AI techniques in the stock returns prediction area. Lastly, future researchers can also use textual data and quantitative data to obtain higher prediction accuracy in their prediction model.
7. Conclusions
Artificial neural network-based models can replicate or imitate the functioning of the human brain, and automatically determine predictions’ accuracy without the intervention of the human brain (Dhenuvakonda et al. 2020). However, ANNs have limitations: there are no established techniques for designing the optimal ANN model or network, and the right model (with high prediction accuracy) is highly dependent on the complexity of the data and implementation (Göçken et al. 2016).
We systematically reviewed 148 articles that have implemented neural networks and hybrid-neuro models to forecast stock market behavior. The authors have classified the models into seven themes: stock market covered; input data; data pre-processing; artificial intelligence technique; training algorithm; performance measure; and nature of the study. We observe that neural and hybrid-neuro approaches are ideal for stock market forecasting since they provide more accurate outcomes than the traditional models used in the majority of studies. Nonetheless, problems emerge when determining the model structure, which involves specifying the number of hidden layers, neurons, training algorithm, momentum, and epochs, among other characteristics. As a result, the model structure is usually determined by trial and error procedures.
The consequences of this analysis are numerous. An effective stock forecast model that incorporates intrinsic characteristics will ensure that predicted stock prices are comparable to the current market value, resulting in a more profitable financial system. Financial intermediaries and asset management firms are using AI to create financial decision support mechanisms will revolutionize almost every financial and investment decision-making area. Financial institutions worldwide can use neural networks to tackle difficult tasks that involve intuitive judgment or the detection of data patterns that elude conventional analytical techniques. Individual investors with no knowledge of stock market economics will also benefit from financial prediction systems: any reasonable outlook would inspire popular investors to invest in stock markets, thus assisting the economy in expanding. Indeed, as uncertainty has risen due to unforeseen occurrences, such as the COVID-19 pandemic (Zhang et al. 2020), it has become more difficult to forecast potential capital market activity using conventional techniques. Thus, it is critical to investigate how the implementation of AI can boost stock market forecasting.
Additionally, as market predictability improves as a result of better AI models, more individuals will begin saving, enabling businesses to collect additional funds from equity markets to cover leverage, new product launches, industry growth, and marketing costs. This will further boost customer and company sentiment, which has a positive effect on the overall economy (Müller 2019), including the businesses of depositories, banks, mutual fund organizations, insurance companies, and investment companies (Neuhierl and Weber 2017; Škrinjarić and Orloví 2020). With increased investments in the financial markets, the tax collections shall increase, hence, benefitting the government in attaining the goal of inclusive and sustainable development (Neuhierl and Weber 2017).
Furthermore, the fractal properties of financial markets (according to FMH) have implications for financial stability. FMH considers non-linear relationships, in which market prices may be inherent in the underlying (fractal) structure, dynamically adjusting to changes in demand and supply with abrupt changes (sharp corrections or sudden losses). Therefore, when examining the measurement and management of market risk, risk managers and regulators should take into account the market’s structure, including the time zones of its key investors, and the mechanism by which liquidity is formed. Moreover, sudden market disruptions can compel long-term investors to exit the market abruptly, potentially resulting in significant price drops in otherwise relatively stable markets. More market stabilizing tools must be introduced going forward in order to help bolster the confidence of longer-term investors and thus, market stability.
Author Contributions
G.D.S.: Conceptualization, Methodology, Supervision, Writing—Reviewing and Editing; R.C.: Writing—Original draft preparation, Visualization, Data curation. All authors have read and agreed to the published version of the manuscript.
Funding
This research received no external funding.
Data Availability Statement
The data used for this study is available in from Web of Science (WoS) and Scopus databases.
Acknowledgments
We would like to extend our gratitude towards Guru Gobind Singh Indraprastha University for providing us with the facilities and the infrastructure.
Conflicts of Interest
The authors declare no conflict of interest.
Appendix A
Table A1.
Stock markets covered.
Table A2.
Input data.
Table A3.
Data pre-processing.
Table A4.
Artificial intelligence technique.
Table A5.
Training algorithm.
| 1 | BPNN: Back-Propagation Neural Network. |
| 2 | Adam: Adaptive Moment Estimation. |
| 3 | AdaBoost: Adaptive Boosting. |
| 4 | GBM: Gradient Boosting Method. |
| 5 | XGBoost: Extreme Gradient Boosting. |
References
- Abdelaziz, Fouad Ben, Mohamed Amer, and Hazim El-Baz. 2014. An Epsilon Constraint Method for selecting Indicators for use in Neural Networks for Stock Market Forecasting. INFOR 52: 116–25. [Google Scholar] [CrossRef]
- Abdel-Kader, Rehab F. 2011. Hybrid discrete PSO with GA operators for efficient QoS-multicast routing. Ain Shams Engineering Journal 2: 21–31. [Google Scholar] [CrossRef] [Green Version]
- Abraham, Ajith, Baikunth Nath, and P. K. Mahanti. 2001. Hybrid intelligent systems for stock market analysis. In Lecture Notes in Computer Science (Including Subseries Lecture Notes in Artificial Intelligence and Lecture Notes in Bioinformatics). Berlin/Heidelberg: Springer, vol. 2074, pp. 337–45. [Google Scholar] [CrossRef] [Green Version]
- Abraham, Ajith, Ninan Sajith Philip, and Paramasivan Saratchandran. 2004. Modeling Chaotic Behavior of Stock Indices Using Intelligent Paradigms. arXiv arXiv:0405018. [Google Scholar]
- Adebiyi, Ayodele Ariyo, Aderemi Oluyinka Adewumi, and Charles Korede Ayo. 2014. Comparison of ARIMA and artificial neural networks models for stock price prediction. Journal of Applied Mathematics 2014: 614342. [Google Scholar] [CrossRef] [Green Version]
- Althelaya, Khaled A., Salahadin A. Mohammed, and El-Sayed M. El-Alfy. 2021. Combining deep learning and multiresolution analysis for stock market forecasting. IEEE Access 9: 13099–111. [Google Scholar] [CrossRef]
- Anderson, Nicola, and Joseph Noss. 2013. The Fractal Market Hypothesis and Its Implications for the Stability of Financial Markets. Bank of England Financial Stability Paper, No. 23. London: Bank of England. [Google Scholar]
- Andreou, Andreas S., Constantinos. C. Neocleous, Christos. N. Schizas, and Costas Toumpouris. 2000. Testing the Predictability of the Cyprus Stock Exchange: The Case of an Emerging Market. Paper presented at the IEEE-INNS-ENNS International Joint Conference on Neural Networks, Como, Italy, July 27; Piscataway: Institute of Electrical and Electronics Engineers (IEEE), pp. 360–65. [Google Scholar] [CrossRef]
- Ansari, Tanvir, Manoj Kumar, Anupam Shukla, Joydip Dhar, and Ritu Tiwari. 2010. Sequential combination of statistics, econometrics and Adaptive Neural-Fuzzy Interface for stock market prediction. Expert Systems with Applications 37: 5116–25. [Google Scholar] [CrossRef]
- Aria, Massimo, and Corrado Cuccurullo. 2017. bibliometrix: An R-tool for comprehensive science mapping analysis. Journal of Informetrics 11: 959–75. [Google Scholar] [CrossRef]
- Armano, Giuliano, Andrea Murru, and Fabio Roli. 2002. Stock market prediction by a mixture of genetic-neural experts. International Journal of Pattern Recognition and Artificial Intelligence 16: 501–26. [Google Scholar] [CrossRef]
- Armano, Giuliano, Michele Marchesi, and Andrea Murru. 2005. A hybrid genetic-neural architecture for stock indexes forecasting. Information Sciences 170: 3–33. [Google Scholar] [CrossRef]
- Asadi, Shahrokh, Esmaeil Hadavandia, Farhad Mehmanpazirb, and Mohammad Masoud Nakhostin. 2012. Hybridization of evolutionary Levenberg-Marquardt neural networks and data pre-processing for stock market prediction. Knowledge-Based Systems 35: 245–58. [Google Scholar] [CrossRef]
- Asktraders. 2020. How Many Traders Can Be Found Globally? Available online: https://www.asktraders.com/how-many-traders-can-be-found-globally/ (accessed on 15 July 2021).
- Aslam, Faheem, Paulo Ferreira, Haider Ali, and Sumera Kauser. 2021. Herding behavior during the COVID-19 pandemic: A comparison between Asian and European stock markets based on intraday multifractality. Eurasian Economic Review 20: 1–27. [Google Scholar]
- Atiya, Amir, Noha Talaat, and Samir Shaheen. 1997. An Efficient Stock Market Forecasting Model Using Neural Networks. Paper presented at the IEEE International Conference on Neural Networks, Houston, TX, USA, June 12; pp. 2112–15. [Google Scholar] [CrossRef]
- Atsalakis, George S. 2014. Surveying stock market forecasting techniques. Journal of Computational Optimization in Economics and Finance 2: 45–92. [Google Scholar]
- Atsalakis, George S., and Kimon P. Valavanis. 2006a. A Neuro-Fuzzy Controller for Stock Market Forecasting, Working Paper. Chania: Technical University of Crete.
- Atsalakis, George S., and Kimon P. Valavanis. 2006b. Neuro-Fuzzy and Technical Analysis for Stock Prediction, Working Paper. Chania: Technical University of Crete.
- Atsalakis, George S., and Kimon P. Valavanis. 2009a. Forecasting stock market short-term trends using a neuro-fuzzy based methodology. Expert Systems with Applications 36: 10696–707. [Google Scholar] [CrossRef]
- Atsalakis, George S., and Kimon P. Valavanis. 2009b. Surveying stock market forecasting techniques—Part II: Soft computing methods. Expert Systems with Applications 36: 5932–41. [Google Scholar] [CrossRef]
- Atsalakis, George S., Eftychios E. Protopapadakis, and Kimon P. Valavanis. 2016. Stock trend forecasting in turbulent market periods using neuro-fuzzy systems. Operational Research 16: 245–69. [Google Scholar] [CrossRef]
- Atsalakis, George S., Emmanouil M. Dimitrakakis, and Constantinos D. Zopounidis. 2011. Elliott Wave Theory and neuro-fuzzy systems, in stock market prediction: The WASP system. Expert Systems with Applications 38: 9196–206. [Google Scholar] [CrossRef]
- Baba, Norio, and Hidetsugu Suto. 2000. Utilization of artificial neural networks and the TD-learning method for constructing intelligent decision support systems. European Journal of Operational Research 122: 501–8. [Google Scholar] [CrossRef] [Green Version]
- Baba, Norio, and Motokazu Kozaki. 1992. An Intelligent Forecasting System of Stock Price Using Neural Networks. Paper presented at the [Proceedings 1992] IJCNN International Joint Conference on Neural Networks, Baltimore, MD, USA, June 7–11; pp. 371–77. [Google Scholar] [CrossRef]
- Baek, Jinwoo, and Sungzoon Cho. 2001. Time to Jump in? Long Rising Pattern Detection in KOSPI 200 Future Using an Auto-Associative Neural Network. Paper presented at the ICONIP, Shanghai, China, November 14–17. [Google Scholar]
- Baek, Yujin, and Ha Young Kim. 2018. ModAugNet: A new forecasting framework for stock market index value with an overfitting prevention LSTM module and a prediction LSTM module. Expert Systems with Applications 113: 457–480. [Google Scholar] [CrossRef]
- Bahrammirzaee, Arash. 2010. A comparative survey of artificial intelligence applications in finance: Artificial neural networks, expert system and hybrid intelligent systems. Neural Computing and Applications 19: 1165–95. [Google Scholar] [CrossRef]
- Bansal, Sanchita, Isha Garg, and Gagan Deep Sharma. 2019. Social entrepreneurship as a path for social change and driver of sustainable development: A systematic review and research agenda. Sustainability 11: 1091. [Google Scholar] [CrossRef] [Green Version]
- Baruník, Jozef. 2008. How do neural networks enhance the predictability of central European stock returns? Czech Journal of Economics and Finance 58: 359–76. [Google Scholar]
- Bautista, Carlos C. 2001. Predicting the Philippine Stock Price Index Using Artificial Neural Networks. Philippines: UPCBA Discuss, p. 107. [Google Scholar]
- Bekiros, Stelios D. 2007. A neurofuzzy model for stock market trading. Applied Economics Letters 14: 53–57. [Google Scholar] [CrossRef]
- Bildirici, Melike, and Özgür Ersin. 2009. Improving forecasts of GARCH family models with the artificial neural networks: An application to the daily returns in Istanbul Stock Exchange. Expert Systems with Applications 36: 7355–62. [Google Scholar] [CrossRef]
- Bildirici, Melike, and Özgür Ersin. 2014a. Modeling markov switching ARMA-GARCH neural networks models and an application to forecasting stock returns. The Scientific World Journal 2014: 497941. [Google Scholar] [CrossRef]
- Bildirici, Melike, and Özgür Ersin. 2014b. Asymmetric power and fractionally integrated support vector and neural network GARCH models with an application to forecasting financial returns in ise100 stock index. Economic Computation and Economic Cybernetics Studies and Research 48: 1–22. [Google Scholar]
- Bisoi, Ranjeeta, and Pradipta K. Dash. 2014. A hybrid evolutionary dynamic neural network for stock market trend analysis and prediction using unscented Kalman filter. Applied Soft Computing 19: 41–56. [Google Scholar] [CrossRef]
- Bornmann, Lutz, Rüdiger Mutz, and Hans-Dieter Daniel. 2008. Are there better indices for evaluation purposes than the h index? A comparison of nine different variants of the h index using data from biomedicine. Journal of the American Society for Information Science and Technology 59: 830–37. [Google Scholar] [CrossRef]
- Brownstone, David. 1996. Using percentage accuracy to measure neural network predictions in Stock Market movements. Neurocomputing 10: 237–50. [Google Scholar] [CrossRef]
- Cao, Jiasheng, and Jinghan Wang. 2019. Stock price forecasting model based on modified convolution neural network and financial time series analysis. International Journal of Communication Systems 32: 1–13. [Google Scholar] [CrossRef]
- Cao, Qing, Karyl B. Leggio, and Marc J. Schniederjans. 2005. A comparison between Fama and French’s model and artificial neural networks in predicting the Chinese stock market. Computers & Operations Research 32: 2499–512. [Google Scholar] [CrossRef]
- Cao, Qing, Mark E. Parry, and Karyl B. Leggio. 2011. The three-factor model and artificial neural networks: Predicting stock price movement in China. Annals of Operations Research 185: 25–44. [Google Scholar] [CrossRef]
- Caporale, Guglielmo Maria, Menelaos Karanasos, Stavroula Yfanti, and Aris Kartsaklas. 2021. Investors’ trading behaviour and stock market volatility during crisis periods: A dual long-memory model for the Korean Stock Exchange. International Journal of Finance & Economics 26: 4441–61. [Google Scholar] [CrossRef]
- Carta, Salvatore M., Sergio Consoli, Luca Piras, Alessandro Sebastian Podda, and Diego Reforgiato Recupero. 2021. Explainable Machine Learning Exploiting News and Domain-Specific Lexicon for Stock Market Forecasting. IEEE Access 9: 30193–205. [Google Scholar] [CrossRef]
- Casas, C. Augusto. 2001. Tactical asset allocation: An artificial neural network based model. Paper presented at the International Joint Conference on Neural Network, Shenzhen, China, July 18–22; Vol. 3, pp. 1811–16. [Google Scholar]
- Chakravarty, Sreejit, and Pradipta K. Dash. 2012. A PSO based integrated functional link net and interval type-2 fuzzy logic system for predicting stock market indices. Applied Soft Computing 12: 931–41. [Google Scholar] [CrossRef]
- Chang, Pei-Chann, Di-di Wang, and Chang-le Zhou. 2012. A novel model by evolving partially connected neural network for stock price trend forecasting. Expert Systems with Applications 39: 611–20. [Google Scholar] [CrossRef]
- Chaturvedi, Animesh, and Samanvaya Chandra. 2004. A Neural Stock Price Predictor Using Quantitative Data. Paper presented at the Sixth International Conference on Information Integrationand Web-Based Applications Services, iiWAS, Jakarta, Indonesia, September 27–29; Vienna: Östereichische Computer Gesellschaft. [Google Scholar]
- Chen, An-Sing, Mark T. Leung, and Hazem Daouk. 2003. Application of neural networks to an emerging financial market: Forecasting and trading the Taiwan Stock Index. Computers & Operations Research 30: 901–23. [Google Scholar] [CrossRef]
- Chen, Lin, Zhilin Qiao, Minggang Wang, Chao Wang, Ruijin Du, and Harry Eugene Stanley. 2018. Which Artificial Intelligence Algorithm Better Predicts the Chinese Stock Market? IEEE Access 6: 48625–33. [Google Scholar] [CrossRef]
- Chen, Mu-Yen, Da-Ren Chen, Min-Hsuan Fan, and Tai-Ying Huang. 2013a. International transmission of stock market movements: An adaptive neuro-fuzzy inference system for analysis of TAIEX forecasting. Neural Computing and Applications 23: 369–78. [Google Scholar] [CrossRef]
- Chen, Mu-Yen, Min-Hsuan Fan, Young-Long Chen, and Hui-Mei Wei. 2013b. Design of experiments on neural network’s parameters optimization for time series forecasting in stock markets. Neural Network World 23: 369–93. [Google Scholar] [CrossRef] [Green Version]
- Chen, Yuehui, and Ajith Abraham. 2006. Hybrid-Learning Methods for Stock Index Modeling. In Artificial Neural Networks in Finance and Manufacturing. Hershey: IGI Global, pp. 64–79. [Google Scholar] [CrossRef]
- Chen, Yuehui, Xiaohui Dong, and Yaou Zhao. 2005. Stock Index Modeling Using EDA Based Local Linear Wavelet Neural Network. Paper presented at the 2005 International Conference on Neural Networks Brain, ICNNB’05, Beijing, China, October 13–15; vol. 3, pp. 1646–50. [Google Scholar] [CrossRef]
- Cheng, Pao L., and M. King Deets. 1971. Portfolio returns and the random walk theory. The Journal of Finance 26: 11–30. [Google Scholar] [CrossRef]
- Cheng, Philip, Chai Quek, and M. L. Mah. 2007. Predicting the impact of anticipatory action on U.S. Stock Market—An event study using ANFIS (A Neural Fuzzy Model). Computational Intelligence 23: 117–41. [Google Scholar] [CrossRef]
- Chenoweth, Tim, and Zoran Obradović. 1996. A multi-component nonlinear prediction system for the S & P 500 index. Neurocomputing 10: 275–90. [Google Scholar] [CrossRef]
- Chun, Se-Hak, and Yoon-Joo Park. 2005. Dynamic adaptive ensemble case-based reasoning: Application to stock market prediction. Expert Systems with Applications 28: 435–43. [Google Scholar] [CrossRef]
- Chung, Hyejung, and Kyung-shik Shin. 2020. Genetic algorithm-optimized multi-channel convolutional neural network for stock market prediction. Neural Computing and Applications 32: 7897–914. [Google Scholar] [CrossRef]
- Constantinou, Eleni, Robert Georgiades, Avo Kazandjian, and Georgios P. Kouretas. 2006. Regime switching and artificial neural network forecasting of the Cyprus Stock Exchange daily returns. International Journal of Finance & Economics 11: 371–83. [Google Scholar] [CrossRef] [Green Version]
- Dai, Wensheng, Jui-Yu Wu, and Chi-Jie Lu. 2012. Combining nonlinear independent component analysis and neural network for the prediction of Asian stock market indexes. Expert Systems with Applications 39: 4444–52. [Google Scholar] [CrossRef]
- Dami, Sina, and Mohammad Esterabi. 2021. Predicting stock returns of Tehran exchange using LSTM neural network and feature engineering technique. Multimedia Tools and Applications 80: 19947–70. [Google Scholar] [CrossRef]
- Dar, Arif Billah, Niyati Bhanja, and Aviral Kumar Tiwari. 2017. Do global financial crises validate assertions of fractal market hypothesis? International Economics and Economic Policy 14: 153–65. [Google Scholar] [CrossRef]
- Dash, Rajashree, and PradiptaKishore Dash. 2016. Efficient stock price prediction using a self evolving recurrent neuro-fuzzy inference system optimized through a modified differential harmony search technique. Expert Systems with Applications 52: 75–90. [Google Scholar] [CrossRef]
- Dash, Rajashree, Pradipta Kishore Dash, and Ranjeeta Bisoi. 2015. A differential harmony search based hybrid interval type2 fuzzy EGARCH model for stock market volatility prediction. International Journal of Approximate Reasoning 59: 81–104. [Google Scholar] [CrossRef]
- de Faria, E. L., Marcelo P. Albuquerque, J. L. Gonzalez, J. T. P. Cavalcante, and Marcio P. Albuquerque. 2009. Predicting the Brazilian stock market through neural networks and adaptive exponential smoothing methods. Expert Systems with Applications 36: 12506–9. [Google Scholar] [CrossRef]
- De Oliveira, Fagner A., Cristiane N. Nobre, and Luis E. Zárate. 2013. Applying Artificial Neural Networks to prediction of stock price and improvement of the directional prediction index–Case study of PETR4, Petrobras, Brazil. Expert Systems with Applications 40: 7596–606. [Google Scholar] [CrossRef]
- De Souza, Alberto F., Fabio Daros Freitas, and André Gustavo Coelho de Almeida. 2012. Fast learning and predicting of stock returns with virtual generalized random access memory weightless neural networks. Concurrency Computation Practice and Experience 24: 921–33. [Google Scholar] [CrossRef]
- Deng, Li, and Dong Yu. 2013. Deep learning: Methods and applications. Foundations and Trends in Signal Processing 7: 197–387. [Google Scholar] [CrossRef] [Green Version]
- Desai, Vijay S., and Rakesh Bharati. 1998a. A comparison of linear regression and neural network methods for predicting excess returns on large stocks. Annals of Operations Research 78: 127–63. [Google Scholar] [CrossRef]
- Desai, Vijay S., and Rakesh Bharati. 1998b. The efficacy of neural networks in predicting returns on stock and bond indices. Decision Sciences 29: 405–23. [Google Scholar] [CrossRef]
- Dey, Shubharthi, Yash Kumar, Snehanshu Saha, and Suryoday Basak. 2016. Forecasting to Classification: Predicting the Direction of Stock Market Price Using Xtreme Gradient Boosting. Bengaluru: PESIT South Campus. [Google Scholar]
- Dhenuvakonda, Padmaja, R. Anandan, and N. Kumar. 2020. Stock price prediction using artificial neural networks. Journal of Critical Reviews 7: 846–850. [Google Scholar]
- Di Persio, Luca, and Oleksandr Honchar. 2016. Artificial neural networks architectures for stock price prediction: Comparisons and applications. International Journal of Circuits, Systems and Signal Processing 10: 403–13. [Google Scholar]
- Doeksen, Brent, Ajith Abraham, Johnson Thomas, and Marcin Paprzycki. 2005. Real Stock Trading Using Soft Computing Models. Paper presented at the International Conference on Information Technology: Coding and Computing (ITCC’05), Las Vegas, NV, USA, April 4–6; Piscataway: Institute of Electrical and Electronics Engineers (IEEE), vol. II, pp. 162–67. [Google Scholar] [CrossRef] [Green Version]
- Donaldson, R. Glen, and Mark Kamstra. 1999. Neural network forecast combining with interaction effects. Journal of the Franklin Institute 336: 227–36. [Google Scholar] [CrossRef]
- Dong, Ming, and Xu-Shen Zhou. 2002. Exploring the Fuzzy Nature of Technical Patterns of US Stock Market. Paper presented at the 1st International Conference on Fuzzy Systems and Knowledge Discovery: Computational Intelligence for the E-Age, Singapore, November 18–22; pp. 324–28. [Google Scholar]
- Duch, Włodzisław, and Norbert Jankowski. 1999. Survey of neural transfer functions. Neural Computing Surveys 2: 163–212. [Google Scholar]
- Egeli, B., M. Ozturan, and B. Badur. 2003. Stock Market Prediction Using Artificial Neural Networks. Paper presented at the 3rd Hawaii International Conference on Business, Honolulu, HI, USA, June 18–21; pp. 1–8. [Google Scholar]
- Enke, David, and Nijat Mehdiyev. 2013. Stock market prediction using a combination of stepwise regression analysis, differential evolution-based fuzzy clustering, and a fuzzy inference neural network. Intelligent Automation & Soft Computing 19: 636–48. [Google Scholar] [CrossRef]
- Enke, David, and Suraphan Thawornwong. 2005. The use of data mining and neural networks for forecasting stock market returns. Expert Systems with Applications 29: 927–40. [Google Scholar] [CrossRef]
- Esfahanipour, Akbar, and Werya Aghamiri. 2010. Adapted neuro-fuzzy inference system on indirect approach TSK fuzzy rule base for stock market analysis. Expert Systems with Applications 37: 4742–48. [Google Scholar] [CrossRef]
- Ettes, Dennis. 2000. Trading the stock markets using genetic fuzzy modeling. Paper presented at the IEEE/IAFE Conference on Computational Intelligence for Financial Engineering—Proceedings (CIFEr), New York, NY, USA, March 26–28; pp. 22–25. [Google Scholar]
- Fama, Sharpe William. 1970. Efficient capital markets: A review of theory and empirical work: Discussion. The Journal of Finance 25: 383–417. [Google Scholar] [CrossRef]
- Fernández-López, Sara, Lucía Rey-Ares, and Milagros Vivel-Búa. 2018. The role of internet in stock market participation: Just a matter of habit? Information Technology & People 31: 869–85. [Google Scholar] [CrossRef]
- Fernández-Rodríguez, Fernando, Christian Gonzalez-Martel, and Simon Sosvilla-Rivero. 2000. On the profitability of technical trading rules based on artificial neural networks:: Evidence from the Madrid stock market. Economics Letters 69: 89–94. [Google Scholar] [CrossRef]
- Fong, Bernard, A. C. M. Fong, G. Y. Hong, and L. Wong. 2005. An empirical study of volatility predictions: Stock market analysis using neural networks. In Lecture Notes in Computer Science (Including Subseries Lecture Notes in Artificial Intelligence and Lecture Notes in Bioinformatics). Berlin: Springer, pp. 473–80. [Google Scholar] [CrossRef]
- Fouroudi, Pantea, Philip J. Kitchen, Reza Marvi, Tugra Nazli Akarsu, and Helal Uddin. 2020. A bibliometric investigation of service failure literature and a research agenda. European Journal of Marketing 54: 2575–619. [Google Scholar] [CrossRef]
- Gandhmal, Dattatray P., and K. Kumar. 2019. Systematic analysis and review of stock market prediction techniques. Computer Science Review 34: 100190. [Google Scholar] [CrossRef]
- Gao, Tingwei, and Yueting Chai. 2018. Improving stock closing price prediction using recurrent neural network and technical indicators. Neural Computation 30: 2833–54. [Google Scholar] [CrossRef]
- Garg, Harish. 2016. A hybrid PSO-GA algorithm for constrained optimization problems. Applied Mathematics and Computation 274: 292–305. [Google Scholar] [CrossRef]
- Ghai, Ambica, Pradeep Kumar, and Samrat Gupta. 2021. A deep-learning-based image forgery detection framework for controlling the spread of misinformation. Information Technology & People. [Google Scholar] [CrossRef]
- Ghasemiyeh, Rahim, Reza Moghdani, and Shib Sankar Sana. 2017. A hybrid artificial neural network with metaheuristic algorithms for predicting stock price. Cybernetics and Systems 48: 365–92. [Google Scholar] [CrossRef]
- Göçken, Mustafa, Mehmet Özçalıcı, Aslı Boru, and Ayşe Tuğba Dosdoğruc. 2016. Integrating metaheuristics and artificial neural networks for improved stock price prediction. Expert Systems with Applications 44: 320–31. [Google Scholar] [CrossRef]
- Gradojevic, Nikola, Jing Yang, and Toni Gravelle. 2002. Neuro-Fuzzy Decision-Making in Foreign Exchange Trading and Other Applications. Paper presented at the CEA 36th Annual Meetings, Calgary, AB, Canada, May 30–Jun 2. [Google Scholar]
- Dong, Guanqun, Kamaladdin Fataliyev, and Lipo Wang. 2013. One-Step and Multi-Step Ahead Stock Prediction Using Backpropagation Neural Networks. Paper presented at the ICICS 2013—the 9th International Conference on Information, Communications and Signal Processing, Tainan, Taiwan, December 10–13. [Google Scholar]
- Guo, Zhiqiang, Huaiqing Wang, Jie Yang, and David J. Miller. 2015. A stock market forecasting model combining two-directional two-dimensional principal component analysis and radial basis function neural network. PLoS ONE 10: e0122385. [Google Scholar] [CrossRef] [PubMed] [Green Version]
- Guresen, Erkam, Gulgun Kayakutlu, and Tugrul U. Daim. 2011. Using artificial neural network models in stock market index prediction. Expert Systems with Applications 38: 10389–97. [Google Scholar] [CrossRef]
- Hadavandi, Esmaeil, Hassan Shavandi, and Arash Ghanbari. 2010. Integration of genetic fuzzy systems and artificial neural networks for stock price forecasting. Knowledge-Based Systems 23: 800–8. [Google Scholar] [CrossRef]
- Hafezi, Reza, Jamal Shahrabi, and Esmaeil Hadavandi. 2015. A bat-neural network multi-agent system (BNNMAS) for stock price prediction: Case study of DAX stock price. Applied Soft Computing 29: 196–210. [Google Scholar] [CrossRef]
- Halliday, R. 2004. Equity trend prediction with neural networks. Research Letters in the Information and Mathematical Sciences 6: 15–29. [Google Scholar]
- Hamid, Alain, and Moritz Heiden. 2015. Forecasting volatility with empirical similarity and Google Trends. Journal of Economic Behavior & Organization 117: 62–81. [Google Scholar] [CrossRef]
- Hao, Pei-Yi, Chien-Feng Kung, Chun-Yang Chang, and Jen-Bing Ou. 2021. Predicting stock price trends based on financial news articles and using a novel twin support vector machine with fuzzy hyperplane. Applied Soft Computing 98: 106806. [Google Scholar] [CrossRef]
- Hao, Yaping, and Qiang Gao. 2020. Predicting the trend of stock market index using the hybrid neural network based on multiple time scale feature learning. Applied Sciences 10: 3961. [Google Scholar] [CrossRef]
- Harvey, Campbell R. 1995. Predictable risk and returns in emerging markets. The Review of Financial Studies 8: 773–816. [Google Scholar] [CrossRef] [Green Version]
- Harvey, Campbell R., Kirsten E. Travers, and Michael J. Costa. 2000. Forecasting emerging market returns using neural networks. Emerging Markets Quarterly 4: 1–12. [Google Scholar]
- Hassan, Rania, Babak Cohanim, Olivier de Weck, and Gerhard Venter. 2005. A Comparison of Particle Swarm Optimization and the Genetic Algorithm. Paper presented at the AIAA/ASME/ASCE/AHS/ASC Structures,Structural Dynamics and Materials Conference, Austin, TX, USA, April 18–21; pp. 1138–1897. [Google Scholar] [CrossRef]
- Hirsch, Jorge E. 2005. An index to quantify an individual’s scientific research output. Proceedings of the National Academy of Sciences USA 102: 16569–72. [Google Scholar] [CrossRef] [Green Version]
- Hsieh, Tsung-Jung, Hsiao-Fen Hsiao, and Wei-Chang Yeh. 2011. Forecasting stock markets using wavelet transforms and recurrent neural networks: An integrated system based on artificial bee colony algorithm. Applied Soft Computing 11: 2510–25. [Google Scholar] [CrossRef]
- Hu, Hongping, Tang Li, Shuhua Zhang, and Haiyan Wang. 2018. Predicting the direction of stock markets using optimized neural networks with Google Trends. Neurocomputing 285: 188–95. [Google Scholar] [CrossRef]
- Huang, W., S. Wang, L. Yu, Y. Bao, and L. Wang. 2006. A new computational method of input selection for stock market forecasting with neural networks. In Lecture Notes in Computer Science (Including Subseries Lecture Notes in Artificial Intelligence and Lecture Notes in Bioinformatics). Edited by V. N. Alexandrov, G. D. Van Albada, P. M. A. Sloot and J. Dongarra. Berlin/Heidelberger: Springer, pp. 308–15. [Google Scholar] [CrossRef] [Green Version]
- Huang, Wei, Yoshiteru Nakamori, and Shou-Yang Wang. 2005. Forecasting stock market movement direction with support vector machine. Computers & Operations Research 32: 2513–22. [Google Scholar] [CrossRef]
- Huarng, Kunhuang. 2001. Effective lengths of intervals to improve forecasting in fuzzy time series. Fuzzy Sets and Systems 123: 387–94. [Google Scholar] [CrossRef]
- Huarng, Kunhuang, and Hui-Kuang Yu. 2005. A type 2 fuzzy time series model for stock index forecasting. Physica A: Statistical Mechanics and its Applications 353: 445–62. [Google Scholar] [CrossRef]
- Hui, Siu Cheung, M. T. Yap, and P. Prakash. 2000. A hybrid time lagged network for predicting stock prices. International Journal of the Computer, Internet and Management 8: 26–40. [Google Scholar]
- Inthachot, Montri, Veera Boonjing, and Sarun Intakosum. 2016. Artificial neural network and genetic algorithm hybrid intelligence for predicting thai stock price index trend. Computational Intelligence and Neuroscience 2016: 3045254. [Google Scholar] [CrossRef] [Green Version]
- Jain, Mansi, Gagan Deep Sharma, and Mandeep Mahendru. 2019. Can I sustain my happiness? A review, critique and research agenda for economics of happiness. Sustainability 11: 6375. [Google Scholar] [CrossRef] [Green Version]
- Gholamreza, Jandaghi, Reza Tehrani, Davoud Hosseinpour, Rahmatollah Gholipour, and Seyed Amir Shahidi Shadkam. 2010. Application of Fuzzy-neural networks in multi-ahead forecast of stock price. African Journal of Business Management 4: 903–14. [Google Scholar]
- Jang, Gia-Shuh, Feipei Lai, Bor-Wei Jiang, and Li-Hua Chien. 1991. An Intelligent Trend Prediction and Reversal Recognition System Using Dual-Module Neural Networks. Paper presented at the First International Conference on Artificial Intelligence Applications on Wall Street, New York, NY, USA, October 9–11; Piscataway: IEEE, pp. 42–51. [Google Scholar] [CrossRef]
- Jaruszewicz, Marcin, and Jacek Mańdziuk. 2004. One day prediction of NIKKEI index considering information from other stock markets. In Lecture Notes in Artificial Intelligence (Subseries of Lecture Notes in Computer Science). Berlin/Heidelberg: Springer, pp. 1130–35. [Google Scholar] [CrossRef] [Green Version]
- Schoenmakers, Kevin, Hepeng Jia, and Sian Powell. 2021. Towards new frontiers. Nature 593: S24–S27. [Google Scholar]
- Johari, AJohari Aayushi. 2020. AI Applications: Top 10 Real World Artificial Intelligence Applications. Available online: https://www.edureka.co/blog/artificial-intelligence-applications/ (accessed on 20 July 2021).
- Kakinaka, Shinji, and Ken Umeno. 2021. Cryptocurrency market efficiency in short- and long-term horizons during COVID-19: An asymmetric multifractal analysis approach. Finance Research Letters 42: 102319. [Google Scholar] [CrossRef]
- Kanas, Angelos. 2001. Neural network linear forecasts for stock returns. International Journal of Finance & Economics 6: 245–54. [Google Scholar] [CrossRef]
- Kanas, Angelos, and Andreas Yannopoulos. 2001. Comparing linear and nonlinear forecasts for stock returns. International Review of Economics & Finance 10: 383–98. [Google Scholar] [CrossRef]
- Kara, Yakup, Melek Acar Boyacioglu, and Ömer Kaan Baykan. 2011. Predicting direction of stock price index movement using artificial neural networks and support vector machines: The sample of the Istanbul Stock Exchange. Expert Systems with Applications 38: 5311–19. [Google Scholar] [CrossRef]
- Karp, A., and G. Van Vuuren. 2019. Investment Implications of the Fractal Market Hypothesis. Annals of Economics and Finance 14: 1950001. [Google Scholar] [CrossRef]
- Kearney, Colm, and Sha Liu. 2014. Textual sentiment in finance: A survey of methods and models. International Review of Financial Analysis 33: 171–85. [Google Scholar] [CrossRef] [Green Version]
- Khan, W., M. A. Ghazanfar, M. A. Azam, A. Karami, K. H. Alyoubi, and A. S. Alfakeeh. 2020a. Stock market prediction using machine learning classifiers and social media, news. Journal of Ambient Intelligence and Humanized Computing. [Google Scholar] [CrossRef]
- Khan, W., U. Malik, M. A. Ghazanfar, M. A. Azam, K. H. Alyoubi, and A. S. Alfakeeh. 2020b. Predicting stock market trends using machine learning algorithms via public sentiment and political situation analysis. Soft Computing 24: 11019–43. [Google Scholar] [CrossRef]
- Khansa, Lara, and Divakaran Liginlal. 2011. Predicting stock market returns from malicious attacks: A comparative analysis of vector autoregression and time-delayed neural networks. Decision Support Systems 51: 745–59. [Google Scholar] [CrossRef]
- Kim, G. H., and S. H. Kim. 2019. Variable Selection for Artificial Neural Networks with Applications for Stock Price Prediction. Applied Artificial Intelligence 33: 54–67. [Google Scholar] [CrossRef]
- Kim, Hyun-jung, and Kyung-shik Shin. 2007. A hybrid approach based on neural networks and genetic algorithms for detecting temporal patterns in stock markets. Applied Soft Computing 7: 569–76. [Google Scholar] [CrossRef]
- Kim, Kyoung-jae, and Won Boo Lee. 2004. Stock market prediction using artificial neural networks with optimal feature transformation. Neural Computing & Applications 13: 255–60. [Google Scholar] [CrossRef]
- Kim, Kyoung-jae, and Ingoo Han. 2000. Genetic algorithms approach to feature discretization in artificial neural networks for the prediction of stock price index. Expert Systems with Applications 19: 125–32. [Google Scholar] [CrossRef]
- Kim, Kyoung-jae, Ingoo Han, and Jonh S. Chandler. 1998. Extracting Trading Rules from the Multiple Classifiers and Technical Indicators in Stock Market. Paper presented at the Korea Society of Management Information Systems’ 98 International Conference on IS Paradigm Reestablishment, Vienna, Austria; Available online: https://koasas.kaist.ac.kr/bitstream/10203/5359/1/1998-100.pdf (accessed on 15 July 2021).
- Kim, Sung-Suk. 1998. Time-delay recurrent neural network for temporal correlations and prediction. Neurocomputing 20: 253–63. [Google Scholar] [CrossRef]
- Kimoto, Takashi, K. Asakawa, M. Yoda, and M. Takeoka. 1990. Stock Market Prediction System with Modular Neural Networks. Paper presented at the IJCNN International Joint Conference on Neural Networks, San Diego, CA, USA, June 17–21; Piscataway: Institute of Electrical and Electronics Engineers (IEEE), pp. 1–6. [Google Scholar] [CrossRef]
- Kingma, Diederik P., and Jimmy Ba. 2014. Adam: A Method for Stochastic Optimization. arXiv arXiv:1412.6980. [Google Scholar]
- KKnill, April, Kristina Minnick, and Ali Nejadmalayeri. 2012. Experience, information asymmetry, and rational forecast bias. Review of Quantitative Finance and Accounting 39: 241–72. [Google Scholar] [CrossRef]
- Kohara, Kazuhiro, Yoshimi Fukuhara, and Yukihiro Nakamura. 1996. Selective presentation learning for neural network forecasting of stock markets. In Neural Computing and Applications. New York: Springer, Vol. 4, pp. 143–48. [Google Scholar]
- Kosaka, M., H. Mizuno, T. Sasaki, R. Someya, and N. Hamada. 1991. Applications of Fuzzy Logic/Neural Network to Securities Trading Decision Support System. Paper presented at the 1991 IEEE International Conference on Systems, Man, and Cybernetics, Charlottesville, VA, USA, October 13–16; pp. 1913–18. [Google Scholar] [CrossRef]
- Koulouriotis, Dimitris E. 2004. Investment analysis & decision making in markets using adaptive fuzzy causal relationships. Operational Research 4: 213–33. [Google Scholar] [CrossRef]
- Koulouriotis, Dimitris E., Ioannis E. Diakoulakis, and Dimitris M. Emiris. 2001. A fuzzy cognitive map-based stock market model: Synthesis, analysis and experimental results. Paper presented at the 10th IEEE International Conference on Fuzzy Systems, Melbourne, Australia, December 2; pp. 465–68. [Google Scholar] [CrossRef]
- Koulouriotis, D. E., I. E. Diakoulakis, D. M. Emiris, and C. D. Zopounidis. 2005. Development of dynamic cognitive networks as complex systems approximators: Validation in financial time series. Applied Soft Computing 5: 157–79. [Google Scholar] [CrossRef]
- Kumar, Anoop S., Chaithanya Jayakumar, and Bandi Kamaiah. 2017. Fractal market hypothesis: Evidence for nine Asian forex markets. Indian Economic Review 52: 181–92. [Google Scholar] [CrossRef]
- Kuo, Ren Jie. 1998. A decision support system for the stock market through integration of fuzzy neural networks and fuzzy Delphi. Applied Artificial Intelligence 12: 501–20. [Google Scholar] [CrossRef]
- Kyriakou, Ioannis, Parastoo Mousavi, Jens Perch Nielsen, and Michael Scholz. 2021. Forecasting benchmarks of long-term stock returns via machine learning. Annals of Operations Research 297: 221–40. [Google Scholar] [CrossRef] [Green Version]
- Laboissiere, Leonel A., Ricardo A. S. Fernandes, and Guilherme G. Lage. 2015. Maximum and minimum stock price forecasting of Brazilian power distribution companies based on artificial neural networks. Applied Soft Computing 35: 66–74. [Google Scholar] [CrossRef]
- Lam, S. S. 2001. A genetic fuzzy expert system for stock market timing. Paper presented at the IEEE Conference on Evolutionary Computation—ICEC, Seoul, Korea, May 27–30; pp. 410–17. [Google Scholar]
- Lee, Ching-Hung, Jang-Lee Hong, Yu-Ching Lin, and Wei-Yu La. 2003. Type-2 fuzzy neural network systems and learning. International Journal of Computational Cognition 1: 79–90. [Google Scholar]
- Lee, Ming-Che, Jia-Wei Chang, Jason C. Hung, and Bae-Ling Chen. 2021. Exploring the effectiveness of deep neural networks with technical analysis applied to stock market prediction. Computer Science and Information Systems 18: 401–18. [Google Scholar] [CrossRef]
- Lei, Lei. 2018. Wavelet neural network prediction method of stock price trend based on rough set attribute reduction. Applied Soft Computing 62: 923–32. [Google Scholar] [CrossRef]
- Leigh, William, M. Paz, and R. Purvis. 2002. An analysis of a hybrid neural network and pattern recognition technique for predicting short-term increases in the NYSE composite index. Omega 30: 69–76. [Google Scholar] [CrossRef]
- Lendasse, Amaury, E. de Bodt, V. Wertz, and M. Verleysen. 2000. Non-linear financial time series forecasting—Application to the Bel 20 stock market index. European Journal of Economic and Social Systems 14: 81–91. [Google Scholar] [CrossRef]
- Li, Yelin, Hui Bu, Jiahong Li, and Junjie Wu. 2020. The role of text-extracted investor sentiment in Chinese stock price prediction with the enhancement of deep learning. International Journal of Forecasting 36: 1541–62. [Google Scholar] [CrossRef]
- Lin, Chin-Tsai, and Hsin-Yi Yeh. 2009. Empirical of the Taiwan stock index option price forecasting model–applied artificial neural network. Applied Economics 41: 1965–72. [Google Scholar] [CrossRef]
- Liu, Chih-Feng, Chi-Yuan Yeh, and Shie-Jue Lee. 2012. Application of type-2 neuro-fuzzy modeling in stock price prediction. Applied Soft Computing 12: 1348–58. [Google Scholar] [CrossRef]
- Liu, Fajiang, and Jun Wang. 2012. Fluctuation prediction of stock market index by Legendre neural network with random time strength function. Neurocomputing 83: 12–21. [Google Scholar] [CrossRef]
- Liu, Haifan, and Jun Wang. 2011. Integrating independent component analysis and principal component analysis with neural network to predict Chinese stock market. Mathematical Problems in Engineering 2011: 382659. [Google Scholar] [CrossRef]
- Liu, Suhui, Xiaodong Zhang, Ying Wang, and Guoming Feng. 2020. Recurrent convolutional neural kernel model for stock price movement prediction. PLoS ONE 15: e0234206. [Google Scholar] [CrossRef] [PubMed]
- Lu, Chi-Jie. 2010. Integrating independent component analysis-based denoising scheme with neural network for stock price prediction. Expert Systems with Applications 37: 7056–64. [Google Scholar] [CrossRef]
- Ma, Shangchen. 2020. Predicting the SP500 Index Trend Based on GBDT and LightGBM Methods. E3S Web of Conferences 214: 02019. [Google Scholar] [CrossRef]
- Mabu, Shingo, Yan Chen, Dongkyu Sohn, Kaoru Shimada, and Kotaro Hirasawa. 2009. Stock price prediction using neural networks with RasID-GA. IEEJ Transactions on Electrical and Electronic Engineering 4: 392–403. [Google Scholar] [CrossRef]
- Mahmud, Mohammad Sultan, and Phayung Meesad. 2016. An innovative recurrent error-based neuro-fuzzy system with momentum for stock price prediction. Soft Computing 20: 4173–91. [Google Scholar] [CrossRef]
- Maknickiene, Nijole, Indre Lapinskaite, and Algirdas Maknickas. 2018. Application of ensemble of recurrent neural networks for forecasting of stock market sentiments. Equilibrium Quarterly Journal of Economics and Economic Policy 13: 7–27. [Google Scholar] [CrossRef]
- Malagrino, Luciana S., Norton T. Roman, and Ana M. Monteiro. 2018. Forecasting stock market index daily direction: A Bayesian Network approach. Expert Systems with Applications 105: 11–22. [Google Scholar] [CrossRef]
- Marček, Dušan. 2004. Stock price forecasting: Statistical, classical and fuzzy neural network approach. In Lecture Notes in Artificial Intelligence (Subseries of Lecture Notes in Computer Science). Edited by V. Torra and Y. Narukawa. Berlin/Heidelberger: Springer, pp. 41–48. [Google Scholar] [CrossRef]
- Matilla-García, Mariano, and Carlos Argüello. 2005. A hybrid approach based on neural networks and genetic algorithms to the study of profitability in the spanish stock market. Applied Economics Letters 12: 303–8. [Google Scholar] [CrossRef]
- Matsubara, Takashi, Ryo Akita, and Kuniaki Uehara. 2018. Stock price prediction by deep neural generative model of news articles. IEICE TRANSACTIONS on Information and Systems E101D: 901–8. [Google Scholar] [CrossRef] [Green Version]
- Mazurek, Jiri. 2017. A modification to Hirsch index allowing comparisons across different scientific fields. arXiv arXiv:1703.05485. [Google Scholar]
- Mehta, Pooja, Sharnil Pandya, and Ketan Kotecha. 2021. Harvesting social media sentiment analysis to enhance stock market prediction using deep learning. PeerJ Computer Science 7: e476. [Google Scholar] [CrossRef]
- Melin, Patricia, Jesus Soto, Oscar Castillo, and Jose Soria. 2012. A new approach for time series prediction using ensembles of ANFIS models. Expert Systems with Applications 39: 3494–506. [Google Scholar] [CrossRef]
- Michalak, Krzysztof, and Piotr Lipinski. 2005. Prediction of high increases in stock prices using neural networks. Neural Network World 15: 359–66. [Google Scholar]
- Mizuno, Hirotaka, Michitaka Kosaka, and Hiroshi Yajima. 1998. Application Of Neural Network To Technical Analysis Of Stock Market Prediction. Architecture 7: 1–14. [Google Scholar]
- Mizuno, H., M. Kosaka, H. Yajima, and N. Komoda. 2001. Application of neural network to technical analysis of stock market prediction. Studies in Informatics and Control 7: 111–20. [Google Scholar]
- Mo, Haiyan, and Jun Wang. 2013. Volatility degree forecasting of stock market by stochastic time strength neural network. Mathematical Problems in Engineering 2013: 436795. [Google Scholar] [CrossRef] [Green Version]
- Moher, David, Alessandro Liberati, Jennifer Tetzlaff, and Douglas G. Altman. 2009. Preferred reporting items for systematic reviews and meta-analyses: The PRISMA statement. PLoS Medicine 62: 1006–12. [Google Scholar] [CrossRef]
- Moradi, Mahdi, Mehdi Jabbari Nooghabi, and Mohammad Mahdi Rounaghi. 2021. Investigation of fractal market hypothesis and forecasting time series stock returns for Tehran Stock Exchange and London Stock Exchange. International Journal of Finance & Economics 26: 662–78. [Google Scholar] [CrossRef]
- Motiwalla, Luvai, and Mahmoud Wahab. 2000. Predictable variation and profitable trading of US equities: A trading simulation using neural networks. Computers & Operations Research 27: 1111–29. [Google Scholar] [CrossRef]
- Müller, Sebastian. 2019. Economic links and cross-predictability of stock returns: Evidence from characteristic-based “styles”. Review of Finance 23: 363–95. [Google Scholar] [CrossRef]
- Nabi, Rebwar M., Ab M. Saeed Soran, and Habibollah Harron. 2020. A Novel Approach for Stock Price Prediction Using Gradient Boosting Machine with Feature Engineering (GBM-wFE). Kurdistan Journal of Applied Research 5: 28–48. [Google Scholar] [CrossRef]
- Nabipour, Mojtaba, Pooyan Nayyeri, Hamed Jabani, S. Shahab, and Amir Mosavii. 2020. Predicting Stock Market Trends Using Machine Learning and Deep Learning Algorithms Via Continuous and Binary Data, A Comparative Analysis. IEEE Access 8: 150199–212. [Google Scholar] [CrossRef]
- Naeem, Muhammad Abubakr, Elie Bouri, Zhe Peng, Syed Jawad Hussain Shahzad, and Xuan Vinh Vo. 2021. Asymmetric efficiency of cryptocurrencies during COVID19. Physica A: Statistical Mechanics and its Applications 565: 125562. [Google Scholar] [CrossRef]
- Nayak, Sarat Chandra, Bijan Bihari Misra, and Himansu Sekhar Behera. 2016. An adaptive second order neural network with genetic-algorithm-based training (ASONN-GA) to forecast the closing prices of the stock market. International Journal of Applied Metaheuristic Computing 7: 39–57. [Google Scholar] [CrossRef]
- Neuhierl, Andreas, and Michael Weber. 2017. Monetary policy and the stock market: Time-series evidence. National Bureau of Economic Research 44: 1–25. [Google Scholar] [CrossRef] [Green Version]
- Obthong, Mehtabhorn, Nongnuch Tantisantiwong, Watthanasak Jeamwatthanachai, and Gary Wills. 2020. A Survey on Machine Learning for Stock Price Prediction: Algorithms and Techniques. Paper presented at the FEMIB 2020—2nd International Conference on Finance, Economics, Management and IT Business, Prague, Czech Republic, May 5–6; pp. 63–71. [Google Scholar] [CrossRef]
- Oh, Kyong Joo, and Kyoung-jae Kim. 2002. Analyzing stock market tick data using piecewise nonlinear model. Expert Systems with Applications 22: 249–55. [Google Scholar] [CrossRef]
- Olson, Dennis, and Charles Mossman. 2003. Neural network forecasts of Canadian stock returns using accounting ratios. International Journal of Forecasting 19: 453–65. [Google Scholar] [CrossRef]
- Ortega, Luis, and Khaldoun Khashanah. 2014. A neuro-wavelet model for the short-term forecasting of high-frequency time series of stock returns. Journal of Forecasting 33: 134–46. [Google Scholar] [CrossRef]
- Pai, Ping-Feng, and Chih-Sheng Lin. 2005. A hybrid ARIMA and support vector machines model in stock price forecasting. Omega 33: 497–505. [Google Scholar] [CrossRef]
- Pan, Heping, Chandima Tilakaratne, and John Yearwood. 2005. Predicting Australian stock market index using neural networks exploiting dynamical swings and intermarket influences. Journal of Research and Practice in Information Technology 37: 43–54. [Google Scholar] [CrossRef]
- Pang, Xiongwen, Yanqiang Zhou, Pan Wang, Weiwei Lin, and Victor Chang. 2020. An innovative neural network approach for stock market prediction. The Journal of Supercomputing 76: 2098–118. [Google Scholar] [CrossRef]
- Pantazopoulos, Konstantinos N., L. H. Tsoukalas, N. G. Bourbakis, M. J. Brün, and E. N. Houstis. 1998. Financial prediction and trading strategies using neurofuzzy approaches. IEEE Transactions on Systems, Man, and Cybernetics, Part B (Cybernetics) 28: 520–31. [Google Scholar] [CrossRef]
- Patalay, S., and M. R. Bandlamudi. 2020. Stock price prediction and portfolio selection using artificial intelligence. Asia Pacific Journal of Information Systems 30: 31–52. [Google Scholar] [CrossRef]
- Pérez-Rodríguez, Jorge V., Salvador Torra, and Julian Andrada-Félix. 2005. STAR and ANN Models: Forecasting Performance on the Spanish Ibex-35 Stock Index. Hoboken: John Wiley & Sons, vol. 24. [Google Scholar]
- Peters, Edgar E. 1994. Fractal Market Analysis: Applying Chaos Theory to Investment and Economics. New York: John Wiley & Sons, Vol. 24. [Google Scholar]
- Qi, Min. 1999. Nonlinear predictability of stock returns using financial and economic variables. Journal of Business & Economic Statistics 17: 419–29. [Google Scholar] [CrossRef]
- Qiu, Jiayu, Bin Wang, and Changjun Zhou. 2020. Forecasting stock prices with long-short term memory neural network based on attention mechanism. PLoS ONE 15: e0227222. [Google Scholar] [CrossRef] [PubMed]
- Qiu, Mingyue, and Yu Song. 2016. Predicting the direction of stock market index movement using an optimized artificial neural network model. PLoS ONE 11: e0155133. [Google Scholar] [CrossRef] [Green Version]
- Qiu, Mingyue, Yu Song, and Fumio Akagi. 2016. Application of artificial neural network for the prediction of stock market returns: The case of the Japanese stock market. Chaos, Solitons and Fractals 85: 1–7. [Google Scholar] [CrossRef]
- Quah, Tong-Seng. 1999. Improving returns on stock investment through neural network selection. Artificial Neural Networks in Finance and Manufacturing 17: 295–301. [Google Scholar] [CrossRef]
- Rajab, Sharifa, and Vinod Sharma. 2019. An interpretable neuro-fuzzy approach to stock price forecasting. Soft Computing—A Fusion of Foundations, Methodologies and Applications 23: 921–36. [Google Scholar] [CrossRef]
- Raposo, R. de C. T., and A. J. D. O. Cruz. 2002. Stock market prediction based on fundamentalist analysis with fuzzy-neural networks. Paper presented at the 3rd WSES International Conference on Fuzzy Sets, Interlaken, Switzerland, February 11–14. [Google Scholar]
- Rast, Martin. 1999. Forecasting with fuzzy neural networks: A case study in stock market crash situations. Paper presented at the Annual Conference of the North American Fuzzy Information Processing Society—NAFIPS, New York, NY, USA, June 10–12; Piscataway: Institute of Electrical and Electronics Engineers (IEEE), pp. 418–20. [Google Scholar] [CrossRef]
- Rather, Akhter Mohiuddin, Arun Agarwal, and V. N. Sastry. 2015. Recurrent neural network and a hybrid model for prediction of stock returns. Expert Systems with Applications 42: 3234–41. [Google Scholar] [CrossRef]
- Rech, Gianluigi. 2002. Forecasting with Artificial Neural Network Models. Stockholm: Stockholm School of Economics. [Google Scholar]
- Refenes, Apostolos Nikolaos, M. Azema-Barac, and A. D. Zapranis. 1993. Stock Ranking: Neural Networks vs. Multiple Linear Regression. Paper presented at the 1993 IEEE International Conference on Neural Networks, San Francisco, CA, USA, March 28–April 1; Piscataway: Institute of Electrical and Electronics Engineers, pp. 1419–26. [Google Scholar] [CrossRef]
- Richard, Mark, and Jan Vecer. 2021. Efficiency testing of prediction markets: Martingale approach, likelihood ratio and bayes factor analysis. Risks 9: 31. [Google Scholar] [CrossRef]
- Rihani, V., and S. K. Garg. 2006. Neural networks for the prediction of stock market. IETE Technical Review (The Institution of Electronics and Telecommunication Engineers India) 23: 113–17. [Google Scholar] [CrossRef]
- Rosado-Serrano, Alexander, Justin Paul, and Desislava Dikova. 2018. International franchising: A literature review and research agenda. Journal of Business Research 85: 238–57. [Google Scholar] [CrossRef]
- Roy, Sanjiban Sekhar, Rohan Chopra, Kun Chang Lee, Concetto Spampinato, and Behnam Mohammadi-ivatlood. 2020. Random forest, gradient boosted machines and deep neural network for stock price forecasting: A comparative analysis on South Korean companies. International Journal of Ad Hoc and Ubiquitous Computing 33: 62–71. [Google Scholar] [CrossRef]
- Rumelhart, David E., Geoffrey E. Hinton, and Ronald J. Williams. 1986. Learning representations by back-propagating errors. Nature 323: 533–36. [Google Scholar] [CrossRef]
- Ruxanda, Gheorghe, and Laura Maria Badea. 2014. Configuring artificial neural networks for stock market predictions. Technological and Economic Development of Economy 20: 116–32. [Google Scholar] [CrossRef]
- Safi, Samir K., and Alexander K. White. 2017. Short and long-term forecasting using artificial neural networks for stock prices in Palestine: A comparative study. Electronic Journal of Applied Statistical Analysis 10: 14–28. [Google Scholar] [CrossRef]
- Safer, Alan M., and Bogdan M. Wilamowski. 1999. Using neural networks to predict abnormal returns of quarterly earnings. In Proceedings of the International Joint Conference on Neural Networks, Washington, DC, USA, July 10–16; Vol. 6, pp. 3840–43. [Google Scholar]
- Sagir, Abdu Masanawa, and Saratha Sathasivan. 2017. The use of artificial neural network and multiple linear regressions for stock market forecasting. MATEMATIKA: Malaysian Journal of Industrial and Applied Mathematics 33: 1–10. [Google Scholar] [CrossRef]
- Samuelson, Paul A. 1973. Proof that properly discounted present values of assets vibrate randomly. The Bell Journal of Economics and Management Science 4: 369. [Google Scholar] [CrossRef]
- Schumann, Matthias, and T. Lohrbach. 1993. Comparing Artificial Neural Networks with Statistical Methods within the Field of Stock Market Prediction. Paper presented at the Twenty-Sixth Hawaii International Conference on System Sciences, Wailea, HI, USA, January 8; Piscataway: Institute of Electrical and Electronics Engineers (IEEE), pp. 597–606. [Google Scholar] [CrossRef]
- Selvin, Sreelekshmy, R. Vinayakumar, E. A. Gopalakrishnan, V. K. Menon, and K. P. Soman. 2017. Stock Price Prediction Using LSTM, RNN and CNN-Sliding Window Model. Paper presented at the 2017 International Conference on Advances in Computing,Communications and Informatics (ICACCI), Udupi, India, September 13–16; pp. 1643–47. [Google Scholar] [CrossRef]
- Setnes, Magne, and O. J. H. van Drempt. 1999. Fuzzy Modeling in Stock-Market Analysis. Paper presented at the IEEE/IAFE Conference on Computational Intelligence for Financial Engineering (CIFEr), New York, NY, USA, April 27; Piscataway: Institute of Electrical and Electronics Engineers (IEEE), pp. 250–58. [Google Scholar] [CrossRef]
- Shah, Dev, Haruna Isah, and Farhana Zulkernine. 2019. Stock market analysis: A review and taxonomy of prediction techniques. International Journal of Financial Studies 7: 26. [Google Scholar] [CrossRef] [Green Version]
- Shah, Habib, Nasser Tairan, Harish Garg, and Rozaida Ghazali. 2018. A Quick Gbest Guided Artificial Bee Colony algorithm for stock market prices prediction. Symmetry 10: 292. [Google Scholar] [CrossRef] [Green Version]
- Sharma, Gagan Deep, Anshita Yadav, and Ritika Chopra. 2020. Artificial intelligence and effective governance: A review, critique and research agenda. Sustainable Futures 2: 100004. [Google Scholar] [CrossRef]
- Siekmann, Stefan, Rudolf Kruse, Jörg Gebhardt, Franck Van Overbeek, and Roger Cooke. 2001. Information fusion in the context of stock index prediction. International Journal of Intelligent Systems 16: 1285–98. [Google Scholar] [CrossRef]
- Singh, Krishna Kumar, Priti Dimri, and Madhu Rawat. 2013. Fractal Market Hypothesis in Indian Stock Market. International Journal 3: 11. [Google Scholar]
- Situngkir, Hokky, and Yohanes Surya. 2004. Neural network revisited: Perception on modified Poincare map of financial time-series data. Physica A: Statistical Mechanics and its Applications 344: 100–3. [Google Scholar] [CrossRef] [Green Version]
- Škrinjarić, Tihana, and Zrinka Orlović. 2020. Economic policy uncertainty and stock market spillovers: Case of selected CEE markets. Mathematics 8: 1077. [Google Scholar] [CrossRef]
- Slim, Chokri. 2010. Forecasting the Volatility of Stock Index Returns: A Stochastic Neural Network Approach. In Computational Science and Its Applications–ICCSA 2004. Lecture Notes in Computer Science. Berlin/Heidelberg: Springer, pp. 935–44. [Google Scholar] [CrossRef]
- Smales, Lee A. 2017. The importance of fear: Investor sentiment and stock market returns. Applied Economics 49: 3395–421. [Google Scholar] [CrossRef]
- Soto, Jesus, Oscar Castillo, Patricia Melin, and Witold Pedrycz. 2019. A New Approach to Multiple Time Series Prediction Using MIMO Fuzzy Aggregation Models with Modular Neural Networks. International Journal of Fuzzy Systems 21: 1629–48. [Google Scholar] [CrossRef]
- Soto, Jesus, Patricia Melin, and Oscar Castillo. 2016. Time series prediction using ensembles of ANFIS models with genetic optimization of interval type-2 and type-1 fuzzy integrators. International Journal of Hybrid Intelligent Systems 11: 211–26. [Google Scholar] [CrossRef]
- Steiner, Manfred, and Hans-Georg Wittkemper. 1997. Portfolio optimization with a neural network implementation of the coherent market hypothesis. European Journal of Operational Research 100: 27–40. [Google Scholar] [CrossRef]
- Strader, Troy J., John. J. Rozycki, Thomas. H. Root, and Yu-Hsiang (John) Huang. 2020. Machine Learning Stock Market Prediction Studies: Review and Research Directions. Journal of International Technology and Information Management 28: 63–83. [Google Scholar]
- Sugumar, Rajendran, Alwar Rengarajan, and Chinnappan Jayakumar. 2014. A technique to stock market prediction using fuzzy clustering and artificial neural networks. Computing and Informatics 33: 992–1024. [Google Scholar]
- Tabrizi, H. A., and H. Panahian. 2000. Stock Price Prediction by Artificial Neural Networks: A Study of Tehran’s Stock Exchange (TSE) [WWW Document]. Available online: http://www.handresearch.org (accessed on 13 May 2021).
- Takahama, Tetsuyuki, Setsuko Sakai, Akira Hara, and Noriyuki Iwane. 2009. Predicting stock price using neural networks optimized by differential evolution with degeneration. International Journal of Innovative Computing, Information and Control 5: 5021–31. [Google Scholar]
- Tealab, Ahmed. 2018. Time series forecasting using artificial neural networks methodologies: A systematic review. Future Computing and Informatics Journal 3: 334–40. [Google Scholar] [CrossRef]
- Tetlock, Paul C. 2007. Giving content to investor sentiment: The role of media in the stock market. The Journal of Finance 62: 1139–68. [Google Scholar] [CrossRef]
- Tetlock, Paul. C., M. Saar-Tsechansky, and S. Macskassy. 2008. More than words: Quantifying language to measure firms’ fundamentals. The Journal of Finance 63: 1437–67. [Google Scholar] [CrossRef]
- Thawornwong, Suraphan, and David Enke. 2004. The adaptive selection of financial and economic variables for use with artificial neural networks. Neurocomputing 56: 205–32. [Google Scholar] [CrossRef]
- Ticknor, Jonathan L. 2013. A Bayesian regularized artificial neural network for stock market forecasting. Expert Systems with Applications 40: 5501–6. [Google Scholar] [CrossRef]
- Tilfani, Oussama, Paulo Ferreira, and My Youssef El Boukfaoui. 2020. Multiscale optimal portfolios using CAPM fractal regression: Estimation for emerging stock markets. Post-Communist Economies 32: 77–112. [Google Scholar] [CrossRef]
- Tranfield, David, David Denyer, and Palminder Smart. 2003. Towards a methodology for developing evidence-informed management knowledge by means of systematic review. British Journal of Management 14: 207–22. [Google Scholar] [CrossRef]
- Tsaih, Ray, Yenshan Hsu, and Charles C. Lai. 1998. Forecasting S&P 500 stock index futures with a hybrid AI system. Decision Support Systems 23: 161–74. [Google Scholar] [CrossRef]
- Twomey, J. M., and A. E. Smith. 1995. Performance measures, consistency, and power for artificial neural network models. Mathematical and Computer Modelling 21: 243–58. [Google Scholar] [CrossRef]
- Van Horne, James C., and George G. C. Parker. 1967. The random-walk theory: An empirical test. Financial Analysts Journal 23: 87–92. [Google Scholar] [CrossRef]
- van Nunen, K., J. Li, G. Reniers, and K. Ponnet. 2018. Bibliometric analysis of safety culture research. Safety Science 108: 248–58. [Google Scholar] [CrossRef]
- Vanstone, Bruce J., Gavin R. Finnie, and Clarence N. W. Tan. 2005. Evaluating the Application of Neural Networks and Fundamental Analysis in the Australian Stockmarket. Paper presented at the IASTED International Conference on Computational Intelligence, Calgary, AB, Canada, July 4–6; pp. 62–67. [Google Scholar]
- Vella, Vince, and Wing Lon Ng. 2014. Enhancing risk-adjusted performance of stock market intraday trading with neuro-fuzzy systems. Neurocomputing 141: 170–87. [Google Scholar] [CrossRef]
- Versace, Massimiliano, Massimiliano Versace, Rushi Bhatt, Oliver Hinds, and Mark Shiffer. 2004. Predicting the exchange traded fund DIA with a combination of genetic algorithms and neural networks. Expert Systems with Applications 27: 417–25. [Google Scholar] [CrossRef]
- Wah, Benjamin W., and Ming-Lun Qian. 2006. Constrained formulations and algorithms for predicting stock prices by recurrent FIR neural networks. International Journal of Information Technology & Decision Making 5: 639–58. [Google Scholar] [CrossRef]
- Walczak, Steven. 1999. Gaining competitive advantage for trading in emerging capital markets with neural networks. Journal of Management Information Systems 16: 177–92. [Google Scholar] [CrossRef]
- Wang, Jie, and Jun Wang. 2015. Forecasting stock market indexes using principle component analysis and stochastic time effective neural networks. Neurocomputing 156: 68–78. [Google Scholar] [CrossRef]
- Wang, Jun, Huopo Pan, and Fajiang Liu. 2012. Forecasting crude oil price and stock price by jump stochastic time effective neural network model. Journal of Applied Mathematics 2012: 1–15. [Google Scholar] [CrossRef]
- Wang, Y.-F. 2002. Predicting stock price using fuzzy grey prediction system. Expert Systems with Applications 22: 33–38. [Google Scholar] [CrossRef]
- Wang, Yi-Hsien. 2009. Using neural network to forecast stock index option price: A new hybrid GARCH approach. Quality & Quantity 43: 833–43. [Google Scholar] [CrossRef]
- Watada, J. 2006. Structural learning of neural networks for forecasting stock prices. In Lecture Notes in Computer Science (Including Subseries Lecture Notes in Artificial Intelligence and Lecture Notes in Bioinformatics). Edited by B. Gabrys, R. J. Howlett and L. C. Jain. Berlin/Heidelberger: Springer, pp. 972–79. [Google Scholar] [CrossRef]
- Wei, Liang-Ying. 2011. An expanded Adaptive Neuro-Fuzzy Inference System (ANFIS) model based on AR and causality of multi-nation stock market volatility for TAIEX forecasting. African Journal of Business Management 5: 6377–87. [Google Scholar] [CrossRef]
- Wei, Liang-Ying, and Ching-Hsue Cheng. 2012. A hybrid recurrent neural networks model based on synthesis features to forecast the Taiwan stock market. International Journal of Innovative Computing, Information and Control 8: 5559–71. [Google Scholar]
- Witkowska, Dorota. 1995. Neural networks as a forecasting instrument for the polish stock exchange. International Advances in Economic Research 90: 577–88. [Google Scholar] [CrossRef]
- Wong, F. S., P. Z. Wang, T. H. Goh, and B. K. Quek. 1992. Fuzzy Neural Systems for Stock Selection. Financial Analysts Journal 48: 47–52. [Google Scholar] [CrossRef]
- Wu, Binghui, and Tingting Duan. 2017. A performance comparison of neural networks in forecasting stock price trend. International Journal of Computational Intelligence Systems 10: 336–46. [Google Scholar] [CrossRef] [Green Version]
- Wu, Jimmy Ming-Tai, Zhongcui Li, Gautam Srivastava, Meng-Hsiun Tasi, and Jerry Chun-Wei Lin. 2021. A graph-based convolutional neural network stock price prediction with leading indicators. Software: Practice and Experience 51: 628–44. [Google Scholar] [CrossRef]
- Wu, Xiaodan, Ming Fung, and Andrew Flitman. 2001. Forecasting Stock Market Performance Using Hybrid Intelligent System. In Computational Science—ICCS 2001. Lecture Notes in Computer Science. Berlin/Heidelberg: Springer, pp. 447–56. [Google Scholar] [CrossRef] [Green Version]
- Xi, Lu, Hou Muzho, Moon Ho Lee, Jun Li, Duan Wei, Han Hai, and Yalin Wu. 2014. A new constructive neural network method for noise processing and its application on stock market prediction. Applied Soft Computing 15: 57–66. [Google Scholar] [CrossRef]
- Yamashita, Takashi, Kotaro Hirasawa, and Jinglu Hu. 2005. Multi-branch neural networks and its application to stock price prediction. In Lecture Notes in Computer Science (Including Subseries Lecture Notes in Artificial Intelligence and Lecture Notes in Bioinformatics). Edited by R. Khosla, R. J. Howlett and L. C. Jain. Berlin/Heidelberger: Springer, pp. 1–7. [Google Scholar] [CrossRef]
- Yim, Juliana. 2002. A Comparison of Neural Networks with Time Series Models for Forecasting Returns on a Stock Market Index. In Developments in Applied Artificial Intelligence. IEA/AIE 2002. Lecture Notes in Computer Science. Berlin/Heidelberg: Springer, pp. 25–35. [Google Scholar] [CrossRef]
- Yiwen, Y., L. Guizhong, and Z. Zongping. 2000. Stock Market Trend Prediction Based on Neural Networks, Multiresolution Analysis and Dynamical Reconstruction. Paper presented at the IEEE/IAFE Conference on Computational Intelligence for Financial Engineering (CIFEr), New York, NY, USA, March 28; Piscataway: Institute of Electrical and Electronics Engineers (IEEE), pp. 155–57. [Google Scholar] [CrossRef]
- Zhang, Yudong, and Lenan Wu. 2009. Stock market prediction of S&P 500 via combination of improved BCO approach and BP neural network. Expert Systems with Applications 36: 8849–54. [Google Scholar] [CrossRef]
- Yumlu, M. Serdar, Fikret S. Gurgen, and Nesrin Okay. 2004. Turkish stock market analysis using mixture of experts. Paper presented at the Fourth International ICSC Symposium on Engineering of Intelligent Systems (EIS), Madeira, Portugal, February 29–March 2. [Google Scholar]
- Yümlü, Serdar, Fikret S. Gürgen, and Nesrin Okay. 2005. A comparison of global, recurrent and smoothed-piecewise neural models for Istanbul stock exchange (ISE) prediction. Pattern Recognition Letters 26: 2093–103. [Google Scholar] [CrossRef]
- Zahedi, Javad, and Mohammad Mahdi Rounaghi. 2015. Application of artificial neural network models and principal component analysis method in predicting stock prices on Tehran Stock Exchange. Physica A: Statistical Mechanics and Its Applications 438: 178–87. [Google Scholar] [CrossRef]
- Zavadskaya, Alexandra. 2017. Artificial intelligence in finance: Forecasting stock market returns using artificial neural networks. Hanken School of Economics, 1–154. [Google Scholar]
- Zhang, Dayong, Min Hu, and Qiang Ji. 2020. Financial markets under the global pandemic of COVID-19. Finance Research Letters 36: 101528. [Google Scholar] [CrossRef]
- Zhang, Defu, Qingshan Jiang, and Xin Li. 2004. Application of neural networks in financial data mining. Paper presented at the International Conference on Computational Intelligence—ICCI 2004, Istanbul, Turkey, December 17–19; pp. 392–95. [Google Scholar]
- Zhang, Dehua, and Sha Lou. 2021. The application research of neural network and BP algorithm in stock price pattern classification and prediction. Future Generation Computer Systems 115: 872–79. [Google Scholar] [CrossRef]
- Zhang, Yongjie, Gang Chu, and Dehua Shen. 2021. The role of investor attention in predicting stock prices: The long short-term memory networks perspective. Finance Research Letters 38: 101484. [Google Scholar] [CrossRef]
- Zhao, J., D. Zeng, S. Liang, H. Kang, and Q. Liu. 2021. Prediction model for stock price trend based on recurrent neural network. Journal of Ambient Intelligence and Humanized Computing 12: 745–53. [Google Scholar] [CrossRef]
- Zhongxing, Ye, and Liting Gu. 1993. A Hybrid Cognition System: Application to Stock Market Analysis. Paper presented at the 1993 International Conference on Neural Networks, Nagoya, Japan, October 25–29; pp. 3000–3. [Google Scholar] [CrossRef]
- Zhou, Feng, Hao-Min Zhou, Zhi-Hua Yang, and Li-Hua Yang. 2019. EMD2FNN: A strategy combining empirical mode decomposition and factorization machine based neural network for stock market trend prediction. Expert Systems with Applications 115: 136–51. [Google Scholar] [CrossRef]
- Zhuge, Qun, Lingyu Xu, and Gaowei Zhang. 2017. LSTM Neural Network with Emotional Analysis for prediction of stock price. Engineering Letters 25: 64–72. [Google Scholar]
- Zorin, A., and A. Borisov. 2007. Modelling Riga Stock Exchange Index Using Neural Networks. Available online: http://citeseerx.ist.psu.edu/viewdoc/download?doi=10.1.1.20.3706&rep=rep1&type=pdf (accessed on 2 June 2021).
Figure 1.
Organizing Framework. (Note: The percentage of papers falling into each category is mentioned in each box.).
Figure 1.
Organizing Framework. (Note: The percentage of papers falling into each category is mentioned in each box.).

Figure 2.
Study flow diagram.

Figure 3.
Annual publications and citations based on Web of Science (WoS) core database.

Figure 4.
Future research agenda.

Table 1.
Auto-coded themes.
| S No. | Theme | Papers | References | S No. | Theme | Papers | References |
|---|---|---|---|---|---|---|---|
| 1 | algorithm | 111 | 609 | 23 | price | 121 | 1224 |
| 2 | analysis | 106 | 524 | 24 | problem | 91 | 362 |
| 3 | daily | 105 | 481 | 25 | process | 108 | 506 |
| 4 | data | 125 | 1489 | 26 | rate | 98 | 401 |
| 5 | error | 105 | 459 | 27 | results | 104 | 404 |
| 6 | financial | 69 | 380 | 28 | returns | 82 | 452 |
| 7 | forecasting | 106 | 890 | 29 | set | 98 | 492 |
| 8 | function | 121 | 955 | 30 | stock | 126 | 1684 |
| 9 | fuzzy | 58 | 450 | 31 | stock market | 101 | 536 |
| 10 | index | 99 | 550 | 32 | stock price | 98 | 407 |
| 11 | information | 96 | 466 | 33 | system | 101 | 692 |
| 12 | input | 120 | 711 | 34 | test | 101 | 356 |
| 13 | layer | 111 | 663 | 35 | time | 116 | 864 |
| 14 | learning | 105 | 484 | 36 | time series | 106 | 544 |
| 15 | market | 116 | 1076 | 37 | trading | 104 | 426 |
| 16 | method | 113 | 651 | 38 | training | 113 | 478 |
| 17 | model | 123 | 1633 | 39 | using | 85 | 338 |
| 18 | network | 124 | 885 | 40 | value | 119 | 854 |
| 19 | neural | 119 | 585 | 41 | variables | 100 | 656 |
| 20 | output | 119 | 615 | 42 | vector | 95 | 375 |
| 21 | parameters | 91 | 367 | 43 | weight | 93 | 350 |
| 22 | prediction | 122 | 1298 |
Table 6.
Performance measure.
Publisher’s Note: MDPI stays neutral with regard to jurisdictional claims in published maps and institutional affiliations. |
© 2021 by the authors. Licensee MDPI, Basel, Switzerland. This article is an open access article distributed under the terms and conditions of the Creative Commons Attribution (CC BY) license (https://creativecommons.org/licenses/by/4.0/).
Share and Cite
MDPI and ACS Style
Chopra, R.; Sharma, G.D. Application of Artificial Intelligence in Stock Market Forecasting: A Critique, Review, and Research Agenda. J. Risk Financial Manag. 2021, 14, 526. https://doi.org/10.3390/jrfm14110526
AMA Style
Chopra R, Sharma GD. Application of Artificial Intelligence in Stock Market Forecasting: A Critique, Review, and Research Agenda. Journal of Risk and Financial Management. 2021; 14(11):526. https://doi.org/10.3390/jrfm14110526
Chicago/Turabian StyleChopra, Ritika, and Gagan Deep Sharma. 2021. "Application of Artificial Intelligence in Stock Market Forecasting: A Critique, Review, and Research Agenda" Journal of Risk and Financial Management 14, no. 11: 526. https://doi.org/10.3390/jrfm14110526