Article

Solvency Risk and Corporate Performance: A Case Study on European Retailers

by
Alexandra Horobet
1,*,
Stefania Cristina Curea
2,
Alexandra Smedoiu Popoviciu
1,
Cosmin-Alin Botoroga
1,
Lucian Belascu
3 and
Dan Gabriel Dumitrescu
1
1
Faculty of International Business and Economics, Bucharest University of Economic Studies, 010374 Bucharest, Romania
2
Department of Financial and Economic Analysis and Valuation, Bucharest University of Economic Studies, 010374 Bucharest, Romania
3
Faculty of Economic Sciences, “Lucian Blaga” University of Sibiu, 550324 Sibiu, Romania
*
Author to whom correspondence should be addressed.
J. Risk Financial Manag. 2021, 14(11), 536; https://doi.org/10.3390/jrfm14110536
Submission received: 29 September 2021 / Revised: 3 November 2021 / Accepted: 5 November 2021 / Published: 9 November 2021
(This article belongs to the Special Issue Risk Analysis for Corporate Finance)

Abstract

:
This paper proposes a new approach toward understanding the financial performance dynamics in the EU retail sector (pre-pandemic); we focus on the connection between indebtedness and solvency risk and other areas of corporate performance (e.g., liquidity, assets efficiency, and profitability). Its contribution resides in identifying the drivers behind solvency risk in a sector that went through significant transformations in recent decades, as well as the links between the various areas of performance of retailers, and their impacts on solvency risk, using the machine-learning random forest methodology. The results indicate a declining trend for solvency risk of EU food retailers after the global financial crisis and up until the beginning of the pandemic, which may reflect their maturity on the market, but also an adjustment to legal changes in the EU, meant to equalize the tax advantages of debt versus equity financing. Solvency risk accompanied by liquidity risk is a mark of the retail sector, and our results indicate that the most critical trade that EU retailers face is between solvency risk and liquidity, but is fading over time. The volatility of liquidity levels is an important predictor of solvency risk; hence, sustaining a stable and good level of liquidity supports lower risks of financial distress, and may mitigate the shock impacts for EU retailers. A higher solvency risk was accompanied by increased efficiency of asset use, but reduced profitability levels, which led to higher returns available to shareholders for high solvency risk retailers. Overall, retailers should focus on operational performance evidenced by financial indicator levels than on the volatility of these indicators as predictors of solvency risk.

1. Introduction

The choice that businesses face, between equity and debt, when financing needs related to current activities and/or investments, has never been an easy one. Both types of financing provide benefits and disadvantages and, until now, optimal capital structure is still a contentious issue in corporate finance (Titman and Tsyplakov 2007; Brusov et al. 2014; Dufour et al. 2018). While the main advantage of equity financing resides in the lack of a financial burden on the company, since there are no regular payments to financers, using it means giving up ownership over the business and sharing the decisions with the other equity holders. Moreover, limitations related to the amounts obtained through equity financing may appear, particularly when the company is on an aggressive growth trend. Increased debt financing also has advantages, as it reduces the overall tax burden through tax-deductible interest, but in times of economic downturn, it amplifies firms’ solvency risks and exposure to changes in market conditions (Abraham et al. 2020).
The Global Financial Crisis of 2007–2009 brought with it a substantial increase in global debt, from 292% of the global gross domestic product (GDP) in 2008 to 318% in 2018. The non-financial sector was the main contributor to this rise, along with government debt—their ratios to the global GDP rose from 78 to 92% and from 62 to 86%, respectively, representing an increase of approximately EUR 23 trillion (Lund 2018; Abraham et al. 2020). In the European Union (EU), the total debt of non-financial corporations in the (current) 27 member countries was also on the rise, growing from 97.7% of EU’s GDP in 2009 to 99.8% in 2019, according to the European Commission and Eurostat. On the one hand, the rise in corporate debt was the result of investment and growth opportunities, as well as of financing source diversification and the particular use of bond financing (Lund 2018). On the other hand, the high levels of debt carried by corporations may represent a significant risk for the global economy, as global default rates of non-financial corporations, above their long-term average, even before the COVID-19 pandemic. The prospects of higher interest rates once the quantitative easing programs were over added to the vulnerabilities of corporations (Lund et al. 2018).
The high levels of non-financial corporate debt became a central topic in economic discussions during the global pandemic generated by the novel coronavirus (COVID-19). At the beginning of the pandemic, companies were severely affected by lockdowns and border closures, raising concerns about the ability to meet their financial obligations as debts became due. Lustig and Mariscal (2020) warned that the high level of corporate debt will amplify the economic downturn and will impede a faster recovery. However, the negative impact of the pandemic on company financial conditions was unequal across sectors and industries (Ebeke et al. 2021; Mojon et al. 2021). The most affected sectors were accommodation and food services, transport, automotive and basic metals and, to a lesser extent, wholesale and retail trade. Information and communication services, food and pharmaceuticals, and manufacturing of computers and electronics coped better with the drop in consumer demand that led to declines in production and sales. From this perspective, Ebeke et al. (2021) show—based on simulations using financial data for over 4 million companies in Europe—which policies that were implemented during the pandemic would help businesses maintain their liquidity and limit insolvencies. The wholesale and retail sector will have the second lowest share of insolvent firms in the total number of firms in the sector, relative to the pre-pandemic values, in a range between 12 and 32% (compared to 4–20% pre-pandemic), only after the information and communications sector, with a share of 8–22% (compared to 5–20% pre-pandemic). One concerning finding is the connection between solvency and liquidity, which is also explored in our paper. For all sectors, the post-pandemic percentage of illiquid firms, in total firms, will significantly increase compared to pre-pandemic times, but again, with differences across sectors. The wholesale and retail sector has the second lowest increase, after the information and communications sector, but the increase is much higher as in the case of solvency, and when compared to the information and communications sector (from a range of 5–20% before the pandemic to 42–60% post-pandemic, compared to 12–28% pre-pandemic and 22–38% post-pandemic). Hence, the European wholesale and retail sector is expected go through the pandemic in a smoother manner compared to other industries, building on the steady growth that occurred up until 2019.
An overview of the evolution of the retail sector in the EU, in recent years, reflects its importance in the EU economy. According to Eurostat data, the retail sector held 14.08% of the total number of enterprises in the EU-27 (United Kingdom excluded) non-financial economy in 2018, and 10.21% of the turnover. Between 2011 and 2018, retail turnover grew by 13.43% and reached EUR 3.05 trillion at the end of 2018, although with differences from one country to another and between the main types of retail (EUROSTAT 2021). In 2020, despite the pandemic, EU residents spent approximately 35.5% of their budget in the retail sector; the countries with the highest rates of consumer spending in the retail sector were Hungary (53.3%) and Croatia (50.9%) (GfK 2021). The market share of EU retail companies in the top 250 companies globally was 35.2% in 2018, followed by the United States (US), with 30.8%, and the Asia Pacific, with 23.2% (Deloitte 2020a). Therefore, the biggest market share of retail sectors was in Europe, revealing the importance of retail on the overall GDP of EU.
The growth of non-food retail (excluding fuel) before the pandemic was higher than for food retail, but food retail was more resilient, similar to the evolution during the global financial crisis of 2007–2009 (EUROSTAT 2021). However, both types of sales (non-specialized stores with the sales of food and drinks prevailing, i.e., supermarkets, and other non-specialized stores, i.e., department stores) were dominated by internet and mail order sales, in terms of growth, until 2019; this dominance accentuated in 2020, given the lockdowns and other mobility restrictions imposed as a result of the pandemic. It is also worth noting that the retail turnover dynamic after 2007–2009 was positive, particularly in Eastern EU countries (Bulgaria, Czechia, Romania, Poland, Hungary, Lithuania), which have seen expansions of many Western food and non-food retailers.
Nevertheless, the retail sector has undergone a major transformation during the pandemic. The expansion of the market share of e-commerce, in the detriment of traditional retail companies and the changes in consumer behavior, have led retailers to rethink their current value propositions, to ensure they are sufficiently differentiated and compelling to the consumers they are targeting. This challenge determined an increase in the indebtedness of companies in the retail sector, but, for many retailers, the challenges were already present before the pandemic: higher debt, modest growth, declining profitability, and asset use efficiency, in terms of generating revenue (Deloitte 2020b).
In this framework, the current research proposes a new approach toward understanding the financial performance dynamics in the EU retail sector, pre-pandemic; we focus on the connection between indebtedness and solvency risk, as well as other areas of business performance (e.g., liquidity, assets efficiency, and profitability). The contribution to the literature resides in identifying the drivers behind retailer solvency risk in a dynamic setting, as well as the links between the various areas of business performance and the impact on solvency risk, using the machine-learning random forest methodology. The genuine “features” of the current research include the use of a large dataset, of 4596 EU retail companies, between 2011 and 2019, from 20 EU countries, which allowed for the study of solvency risk particularities and its link to the other business characteristics in a wider setting, and identifying idiosyncrasies at the country level. Moreover, a rather new approach to the analysis of solvency risk is applied, i.e., the machine-learning based random forest models, which can offer improved insight compared to linear and logistic regressions, for long time used in the analysis of default risk.
The main findings of the study indicate a declining trend for solvency risk of EU food retailers, after the global financial crisis and up until the beginning of the COVID-19 pandemic. This may reflect their maturity on the market and adjustments to legal changes in the EU meant to diminish the tax advantages of high interest payments associated with higher levels of debt. Solvency risk, accompanied by liquidity risk, is a mark of the retail sector, and results indicate that the most critical trade that EU retailers face is between solvency risk and liquidity, but this is fading over time. The volatility of liquidity levels is an important predictor of solvency risk; hence, sustaining a stable and good level of liquidity supports a lower risk of financial distress and may mitigate the shock impacts for EU retailers. A higher solvency risk was accompanied by increased efficiency of asset use, and reduced profitability levels, which led to higher returns available to shareholders for high solvency risk retailers. These findings suggest that EU retailers should monitor their solvency risk levels in an integrated framework, which considers the other areas of corporate performance, including their relation to returns available to shareholders.
Hence, sustaining a stable and good level of liquidity supports a lower risk of financial distress. This conclusion is even more important for retailers, where, as our results indicate, solvency risk accompanied by liquidity risk is a mark of the industry. Interestingly, efficiency and profitability indicators are less important as predictors of solvency risk in the food retail industry and, overall, the levels of performance hold a higher relevance for the prediction of solvency risk compared to the volatility of financial indicators.
The rest of the paper is organized as follows: Section 2 outlines the main research directions—the background to our approach. Section 3 introduces the data set and methodology; Section 4 presents the main findings and discusses their significance. Finally, Section 5 summarizes the results, presents the research limitations, and outlines directions for future research.

2. Research Background

Understanding the reasons behind periods of financial troubles, which may eventually lead to distress and bankruptcy, is one of the main areas of research in corporate finance. Over time, various approaches have attempted to shine a light on this topic, which is highly relevant from the perspective of financial managers, as well as investors who depend on the advice of financial analysts (Cheng and Wang 2015) and macroeconomic policies, given the negative effects that bankruptcies have on unemployment and the financial system (Vakhitova et al. 2018; Nwogugu 2007). Consequently, various scholars have focused on identifying the best factors and predictors behind financial distress and solvency risk, resulting in a multitude of ways, developed over time, for measuring financial distress, solvency risk, the bankruptcy probability, and the probability of default, which we will further review.
One of the first, and most well-known methods for measuring bankruptcy, is the Altman Z-score (Altman 1968); however, the oldest formal studies on business failure began in the 1930s (Heine 2000). Beaver (1966) was the first researcher who defined financial distress as a situation when total assets cannot cover total liabilities. Over time, the Altman model, which considers profitability, leverage, liquidity, solvency, and efficiency ratios in a multiple linear discriminant model (MDA), to assess whether a company has a significant bankruptcy risk, went through improvements proposed by various authors, which extended its significance in the international context (Altman et al. 2017; Russ et al. 2004); it was tested extensively on companies and sectors from all over the world. Moreover, researchers have used several statistical and econometric methods to investigate capital structure, solvency risk, or financial distress, beyond the Altman model. The literature developed in the field is abundant and we summarize its main features in the following paragraphs, focusing on performance characteristics that were mostly linked to solvency risk and on the methodologies employed. We also outline the findings, in regard to the retail sector, and review whether these findings are different compared to results from other sectors of the economy.
The extant research focuses on the predictors of financial distress, using both financial indicators and non-financial variables. In the first category, the literature is largely built upon the seminal work by Modigliani and Miller (1958). They advanced the irrelevance of capital structure for the value of companies, under the assumption of perfect markets, and reformulated it, a few years later, to account for market imperfections and to emphasize the tax benefit advantages of holding debt (Modigliani and Miller 1963). Other theories that focused on capital structure, indebtedness, and financial distress developed afterwards, of which the most prominent and empirically tested are the pecking order theory, introduced by Jensen and Meckling (1976), and the trade-off theory, advanced by Kraus and Litzenberger (1973). While the first set of authors posited negative links between liquidity and profitability, on the one hand, and indebtedness, on the other hand, the latter conjectured that company decisions on how much debt to use is influenced by costs and benefits, particularly in terms of tax advantages. The vast empirical literature that followed aimed at confirming or disagreeing with these arguments or introducing various conditionalities in the relationships between operational performance and indebtedness. Gruszczynski (2004) showed that, in the second half of the 1990s, the financial conditions of Polish companies were determined by their liquidity, profitability, and financial leverage levels, i.e., better liquidity, higher profitability, and lower financial leverage were positively linked to lower financial distress. Similar results were previously achieved by Kaiser (2001) and Lennox (1999). In the same vein, Kane et al. (1996) and Priego-de-la-Cruz et al. (2020) indicated that low profitability and liquidity levels are relevant factors for business failure. ROA and liquidity were also identified as good predictors of financial problems for Brazilian electricity distributors (Scalzer et al. 2019). For Hungarian firms, Pálinkó and Svoób (2016) have shown that their inability to create value, coupled with poor operational efficiency, were the main causes behind the increase in debt and financial leverage, which were further linked to liquidity shortages. Lisboa (2017) and, earlier, Proença et al. (2014), demonstrated that Portuguese companies with high levels of liquidity also had high indebtedness, but debt maturity was a critical mediator of this relationship: liquidity and long-term indebtedness were found to be positively related, while the reverse was true for liquidity and short-term indebtedness. In the case of Portuguese SMEs in the hospitality sector, Pacheco and Tavares (2017) identified profitability and liquidity as driving factors of business capital structures, along with growth, firm size, asset tangibility (the proportion of tangible assets in total assets), and non-debt tax benefits. Other variables, such as cash flow to total assets, legal form of the business sector of activity, and country-specific factors were introduced by De Jong et al. (2008), Majumdar (2014), Silva et al. (2020), and Lopes and Carvalho (2021).
For the second category of predictors, the proposals of researchers included input resources (labor and equipment), political influence and inflation (Gudmundsson 2002), corporate governance (Lin et al. 2010; Liang et al. 2016; Geng et al. 2011), macroeconomic factors (Liou 2007), and customer satisfaction (Ibrahim 2007). Certainly, there are consistent research studies that have included both types of indicators in the assessment of financial distress. For example, research on Indian listed companies identified that retention ratio, age, net asset value, return on investment, long-term equity ratio, institutional holdings, and holdings pledged are critical financial (and non-financial) forecasters for financial distress (Balasubramanian et al. 2019). Lee et al. (2010) researched listed Taiwanese firms between 2001 and 2005, using a corporate governance index and financial variables, and found that a combination of both financial and corporate governance variables offered the best predictions for financial distress. Tomas Žiković (2018) also showed the relevance of macroeconomic environment attributes for corporate performance and financial distress.
Methodologies used to estimate (and predict) the levels of financial distress, including early-warning mechanisms, have evolved over time, from the discriminant analysis framework proposed by Altman (Altman 1968; Altman et al. 1979; Altman and Hotchkiss 2010; Altman et al. 2017), and have been used by many other researchers (Gerantonis et al. 2009; MacCarthy 2017; Almamy et al. 2016; Ko et al. 2017—to name only a few). Later, authors, such as Martin (1997), Ohlson (1980), Zavgren (1985), Lo (1986), Opler and Titman (1994), and Routledge and Gadenne (2000) used logistic regressions to assess financial distress. This approach is still employed in numerous studies—see, for example, (Lee et al. 2010; Ong et al. 2011; Jabeur and Fahmi 2018; Ruxanda et al. 2018; Rahman et al. 2021; Shetty and Vincent 2021), given its relative ease of use and superior econometric performance comparative to multidimensional discriminant analysis models. Chen and Shen (2020), in a study on financial distress, in a sample of 262 financially distressed and 786 non-financially distressed Taiwanese listed companies during 2012–2018, stated that the most rigorous and accurate methods for building models that measure financial distress were LASSO-CART (89.74%) and LASSO-RF (86.30%). Research on financial distress and solvency risk benefited enormously in the last two decades, from the advent and further development of artificial neural networks, machine learning, and artificial intelligence. Thus, Odom and Sharda (1990) first applied the artificial neural network (ANN) methodology for bankruptcy prediction of American companies, using the same financial ratios as in the Altman (1968) study. Their results, which showed the higher performance of ANN relative to MDA, were encouraging and stimulated other research in the same direction. Over time, many studies confirmed the superiority of ANN methods over logistic regressions and MDA for signaling financial distress and assessing bankruptcy risk (see, for example, Serrano-Cinca (1996), Yim and Mitchell (2003), Lin (2009), Marinakos et al. (2014), Kirkos (2015), Mselmi et al. (2017)).
Regarding the machine-learning models, researchers have acknowledged the ability of decision trees and random forest algorithms to handle large amounts of data, among other features, which can improve the forecasting of financial distress. Klepáč and Hampel (2018) attempted to predict the bankruptcy of retail businesses in the EU between 2009 and 2013 using data from 170 companies that went bankrupt in 2014, and another 830 active companies that were active manufacturing firms. They used variables, such as ROA, net income, current ratio, total assets, liquidity ratios, credit period, stock turnover, and various prediction models—support vector machines (SVM), decision trees, random forests, and adaptive boosting. The results showed that the random forest and decision trees improved accuracy for bankruptcy prediction over the SVM method, and were better comparable to previous studies. There is consistent research that concludes that machine learning techniques can provide more accurate predictions than the standard empirical methods, because they use the data-driven process, and can deal with high-dimensional datasets. Nevertheless, the most important aspect of using the machine learning techniques is that they can analyze the unbalanced datasets and obtain helpful information inside the dataset (Vieira et al. 2009; Liang et al. 2018; Sehgal et al. 2021; Alessi and Savona 2021; Malakauskas and Lakštutienė 2021). More research, on the risk of default using machine learning based random forest models, was conducted in seven EU countries (Germany, Spain, Portugal, France, Finland, Italy, and United Kingdom), in a sample of 945,062 companies in 2010 and 1,019,312 firms in 2011 (Behr and Weinblat 2017a), showing that the most important variable for default prediction is the rate of return on assets, the rate of return on sales, dynamic gearing ratio, and debt ratio. The study emphasized the heterogeneities among the investigated countries, in terms of default patterns and variable importance. The authors continued their investigation of default prediction using balance sheet data of 446,464 companies based in the United Kingdom, Spain, Italy, France, and Germany, and concluded that random forest outperformed the logit and classification tree in almost all countries and years, as shown by the quality measures of the models (Behr and Weinblat 2017b).
Researcher papers have explored all sectors of the economy, in regard to the prediction of financial distress and solvency risks, and researchers have examined industries from various countries and regions. For example, in an attempt to measure the default probability in the manufacturing sector in Western European countries, Succurro (2017) relied on the construction of an indebtedness index that reflected the multi-layered features of debt, and permitted the evaluation of different companies, industrial sectors, and countries. Another study on European countries exposed a binary classification, in an attempt to predict the bankruptcy of engineering companies in a sample of 953 businesses (Staňková and Hampel 2018). For this research, the authors used logistic regression alongside machine learning, which was based on the classification tree method and support vector machine. The authors showed that, for measuring bankruptcy, the method for doing it is through logit models based on artificial features. Utami et al. (2020) studied financial distress and capital structure for firms activated in the infrastructure, utilities and transportation, and mining sectors. They found a negative and significant relationship between financial distress and capital structure in the mining sector, and a positive and significant relationship between the financial distress and capital structure in the utility and transportation, and infrastructure sectors. Alan and Lapré (2018) examined the US airline industry and concluded that inferior revenue management, lower aircraft utilization, and higher operational complexity increased the levels of financial distress for firms. Slovak companies were investigated by Boďa and Úradníček (2016), British companies by Almamy et al. (2016), South Korean companies by Bae (2012), Australian com[anies by Al-Hadi et al. (2019), and the list continues.
Research on the financial distress of companies in the retail sector is either part of the investigations, encompassing wider sectoral frameworks, or it only considers retailers. McGurr and DeVaney (1998) studied failed and non-failed US retailers between 1989 and 1993 using various methodologies, and Hu and Ansell (2007) applied different credit scoring models on healthy and distressed US retailers between 1994 and 2002, to predict default one year before the conditions of financial distress appeared. Their research focuses less on the retail sector and more on comparing the methodologies; the results show that no single methodology was clearly superior to the others. In the same vein of contrasting methodologies for the prediction of financial distress, Valencia et al. (2019) showed that applying a generalized additive model with an embedded variable selection for Colombian retailers offers results that are close in terms of accuracy to machine-learning models, such as random forest and support vector machines. In regard to the research on US retailers, mentioned above, the authors selected the retail sector as one possible sector to apply various methodologies, and not necessarily with the intention of a better comprehension of retailers. A more useful approach, in our opinion, is the Marinakos et al. (2014) contribution, referring to a solution that supports early warnings of financial distress of Greek pharmaceutical retailers. The proposed system, once implemented, is useful for the managers and owners of the businesses, and, as authors claim, has the potential to diminish financial distress risks for retailers in the industry. In this framework, a more interesting perspective is provided by Kaufinger and Neuenschwander (2020), in a recent paper, also on US retailers, which shows that retailers’ probability of failure is influenced by the accounting method used to value inventory, i.e., a cost-based valuation method increases 2.3 times the failure compared to a price-based method. Bertrand and Parnaudeau (2019) introduced weather conditions as a factor that impacts the sales, cash flow, and, ultimately, solvency risk of UK retailers. Moreover, the authors showed that better predicting weather conditions might help diminishing financial distress, and they propose a methodology for incorporating weather-related variables into the assessment of business failure risk. Another contribution belongs to Maripuu and Männasoo (2014), which includes wholesale and retail trade, among other sectors—manufacturing, transportation and storage, and construction and real estate—in an analysis on Estonian firms between 1995 and 2010. The research focuses on the influence of investment-related factors on financial distress and demonstrates that investment characteristics matter for this influence.
This study builds on previous research and findings. We propose a methodology based on machine-learning random forest, which is shown to be one of the best ways to predict financial distress and solvency risk (more on this in the next section) and was applied to the European Union retail sector in the period between the two major crises of the twenty-first century: the global financial crisis of 2007–2009 and the COVID-19 pandemic. The contribution to the literature resides in the investigation of a sector that has undergone tremendous changes in recent years and was obliged to make even more changes during the pandemic to deal with consumer demand uncertainty. The research proposed in this paper focuses on a large sample of companies from 20 EU member countries to gain a better understanding of the retail sector in the EU and its corporate performance, in relation to solvency risk. As a result, the findings provide light on differences in solvency risk and other aspects of business performance between companies, coming from different business settings, as well as between companies originating from different geographic locations. To the authors’ knowledge, this method has never been used in a previous study.
The research problem of this paper refers to the short- and long-term interaction between corporate performance in operational terms (e.g., liquidity, efficiency, and profitability) and solvency risk for EU retailers. Hence, the study tests two hypotheses, as follows:
Hypothesis 1 (H1).
There are significant differences, regarding the operational performances, between retailers with different levels of solvency risk.
Hypothesis 2 (H2).
The country where a retailer originates from is a predictor of solvency risk.
The methodology employed in the current research, i.e., random forest for classification, does not lead to results that evidence positive or negative relations between solvency risk and the variables included in the set of predictors, but it shows the predictive power of each variable for the solvency risk levels of companies, as further explained in the next section. Nevertheless, the existing connections between indebtedness and operational performance (liquidity, efficiency of using assets, and profitability), as well as between indebtedness and overall financial performance (return on equity) of EU retailers, were analyzed and discussed.

3. Research Methodology

The methodology used in this research involves the machine-learning random forest, which generates an ensemble of decision trees that assess the predictive power of a set of continuous and/or categorical variables on a continuous dependent variable (in random forest regression) or a categorical variable (in random forest classification). Breiman (2001) advanced this methodology, recognized by many others as an improved substitute for linear and logistic regressions (Brian Gray and Fan 2008; Biau 2012), and enhanced over time (Fawagreh et al. 2014). The fundamental idea introduced by Breiman (2001) was bagging, or an average of numerous noisy but unbiased models, which reduces variance, using trees that are even able to capture relationships between variables that are otherwise difficult to determine, and complex interactions (Hastie et al. 2016; Hayes et al. 2015). Thus, forests are grown by bootstrapping, creating samples based on drawing observations from the initial set of data, then randomly selecting subsets of predictors (or independent variables), and using them to create the nodes and the tree. In the end, a majority vote is taken among all of the grown trees, the ensemble prediction is calculated, and the final prediction corresponds to the most common predicted value in the trees (Breiman 2001; Arel-Bundock 2017). Another very useful feature of random forest is the lack of an implicit assumption of linearity in the relationships between predictors and the dependent variables, which increases its ability to identify meaningful links between variables. Moreover, the way the bagging procedure is implemented addresses the multicollinearity issue, which is a serious concern in traditional econometric methodologies (Garg and Tai 2013). As outlined in the previous section, random forests have been used in the literature in recent years to address solvency risk and financial distress (Fantazzini and Figini 2009; Behr and Weinblat 2017a; Ruxanda et al. 2018; Chen and Shen 2020; Gregova et al. 2020).
The random forest methodology was implemented in Tibco Statistica 13.0 and the data were split into a training sample, which includes 70% of the observations, and a test sample, with the 30% remaining observations. The training sample was used to build the model and identify the predictors of the dependent variable, while the test sample offered the accuracy of the model. The classification approach in random forest was used, since it was best adapted to the research question. The dependent categorical variable is the level of solvency risk—high, medium, or low—based on the median value of the total debt to shareholder fund (TD/SF) ratio for each company in the EU food retail industry, between 2011 and 2019, included in the sample. Companies in the sample were split in the three equal categories as the number of companies for the entire period, 2011–2019, and for each sub-period mentioned above: 2011–2013, 2014–2016, and 2017–2019. The set of predictors includes liquidity, efficiency, and profitability variables as continuous, and country as a categorical variable. More explanations on the final variable choice are provided in the “Results” section.
For a good understanding of our results, the features of the random forest algorithm used were the following: (i) prior probabilities were set at equal, which means that we estimated the likelihood that a company would fall in one of the three solvency risk categories, proportional to the size of the dependent variable—this is a natural choice, given that companies were included in three solvency risk categories based on their indebtedness. (ii) Misclassification costs were set at 1, meaning that no category of solvency risk was considered as having higher importance than the other two; hence, classifying a company in category 1 (for example, high solvency risk) instead of category 2 (medium solvency risk) is the same as classifying it in category 2, instead of category 1. The same is true for all other categories and potential misclassifications in the model. (iii) The number of predictor variables was set at 4, based on the default value in Statistica that uses the formula proposed by Breiman (2001). (iv) The number of forests initiated was 200, with a stopping condition based on a 5% percentage decrease in training error—these decisions were made based on trial and error. (v) Other stopping conditions: the minimum number of cases (firms) in a terminal node, was 114, the maximum number of levels was 10, the minimum number of cases in a child node was 5, and the maximum number of nodes was 100—these were based on the default values provided by the software, built on Breiman (2001).
The indicators we used are based on the corporate finance and financial analysis literature (Brealey et al. 2019; Berk and DeMarzo 2019), as well as in existing literature that addressed similar topics—Behr and Weinblat (2017a), Behr and Weinblat (2017b), Balasubramanian et al. (2019), or Chen and Shen (2020), under the restrictions of data availability. The final sample distributions across countries are the following: Belgium (54 companies), Croatia (65), Czech Republic (46), Estonia (42), Finland (195), France (1271), Germany (12), Greece (19), Hungary (63), Ireland (2), Latvia (77), Lithuania (13), Netherlands (9), Poland (541), Portugal (298), Romania (644), Slovakia (43), Slovenia (37), Spain (366), and Sweden (799).
Table 1 presents the indicators used in our analysis, along with the areas of performance they designate, as well as the meaning and calculation details. These indicators delineate four main areas of performance—solvency, liquidity, efficiency, and profitability—and we complemented them by the well-known aggregate performance indicators, return on assets (ROA) and return on equity (ROE). The latter are useful in this analysis due to their ability to capture the simultaneous effects of efficiency and profitability (in ROA) and of financial leverage or solvency risk (in ROE), according to the DuPont model (Soliman 2008; Bauman 2014; Paul 2021). Each indicator was calculated—the median value, the standard deviation, as a measure of volatility, and the trend for the 2011–2019 period, as well as for three 3-year periods: 2011–2013, 2014–2016, 2017–2019—with the aim of capturing the short- versus long-term perspectives on solvency risk determinants.
The data used in the paper were collected from the ORBIS/Amadeus—TP Catalyst database, which contains balance sheet and income statement information from approximately 400 million companies and entities in the world, and is recognized for its ability to allow sound comparisons between companies. Our data refer to companies that are headquartered in the European Union and have the 4711 4-digit NACE Code—retail sale in non-specialized stores with food, beverages, or tobacco predominating—as a main business classification. Financial information was collected with annual frequency between 2011 and 2019 (the last year of data available when our research was initiated) about very large, large, and medium-sized companies (according to the categories provided by the Orbis database) from all countries that were EU members on 31 July 2021. All data are in EUR.
The initial number of companies available in the database was 35,765—listed and non-listed—but a three-stage filtering process was applied, which resulted in a final number of 4596 from 20 EU-member countries: Belgium, Croatia, Czech Republic, Estonia, Finland, France, Germany, Greece, Hungary, Ireland, Latvia, Lithuania, Netherlands, Poland, Portugal, Romania, Slovakia, Slovenia, Spain, and Sweden. The final sample was created after the following filters were applied: (1) only companies with available records for all financial indicators and/or ratios of interest for our analysis that covered all areas of business performance—solvency, liquidity, efficiency, and profitability—were included. (2) Only companies with full data available for all of these indicators and/or ratios between 2011 and 2019 were included. (3) To remove outliers that would distort results, there were eliminated from the sample companies in the upper and lower 1% of each indicator’s median between 2011 and 2019 included in the analysis.

4. Results and Discussion

The main goal of this research resides in identifying the drivers behind the solvency risks of companies in a dynamic setting and, in this framework, to better grasp the links between the various areas of performance for businesses and their impact on solvency risk. Before presenting the results of the machine-learning random forest methodology, an understanding of the solvency risk attributes and of the other indicators of financial performance for the sample of companies included in the analysis, is useful, as it allows one to better grasp the financial performance on European retailers.

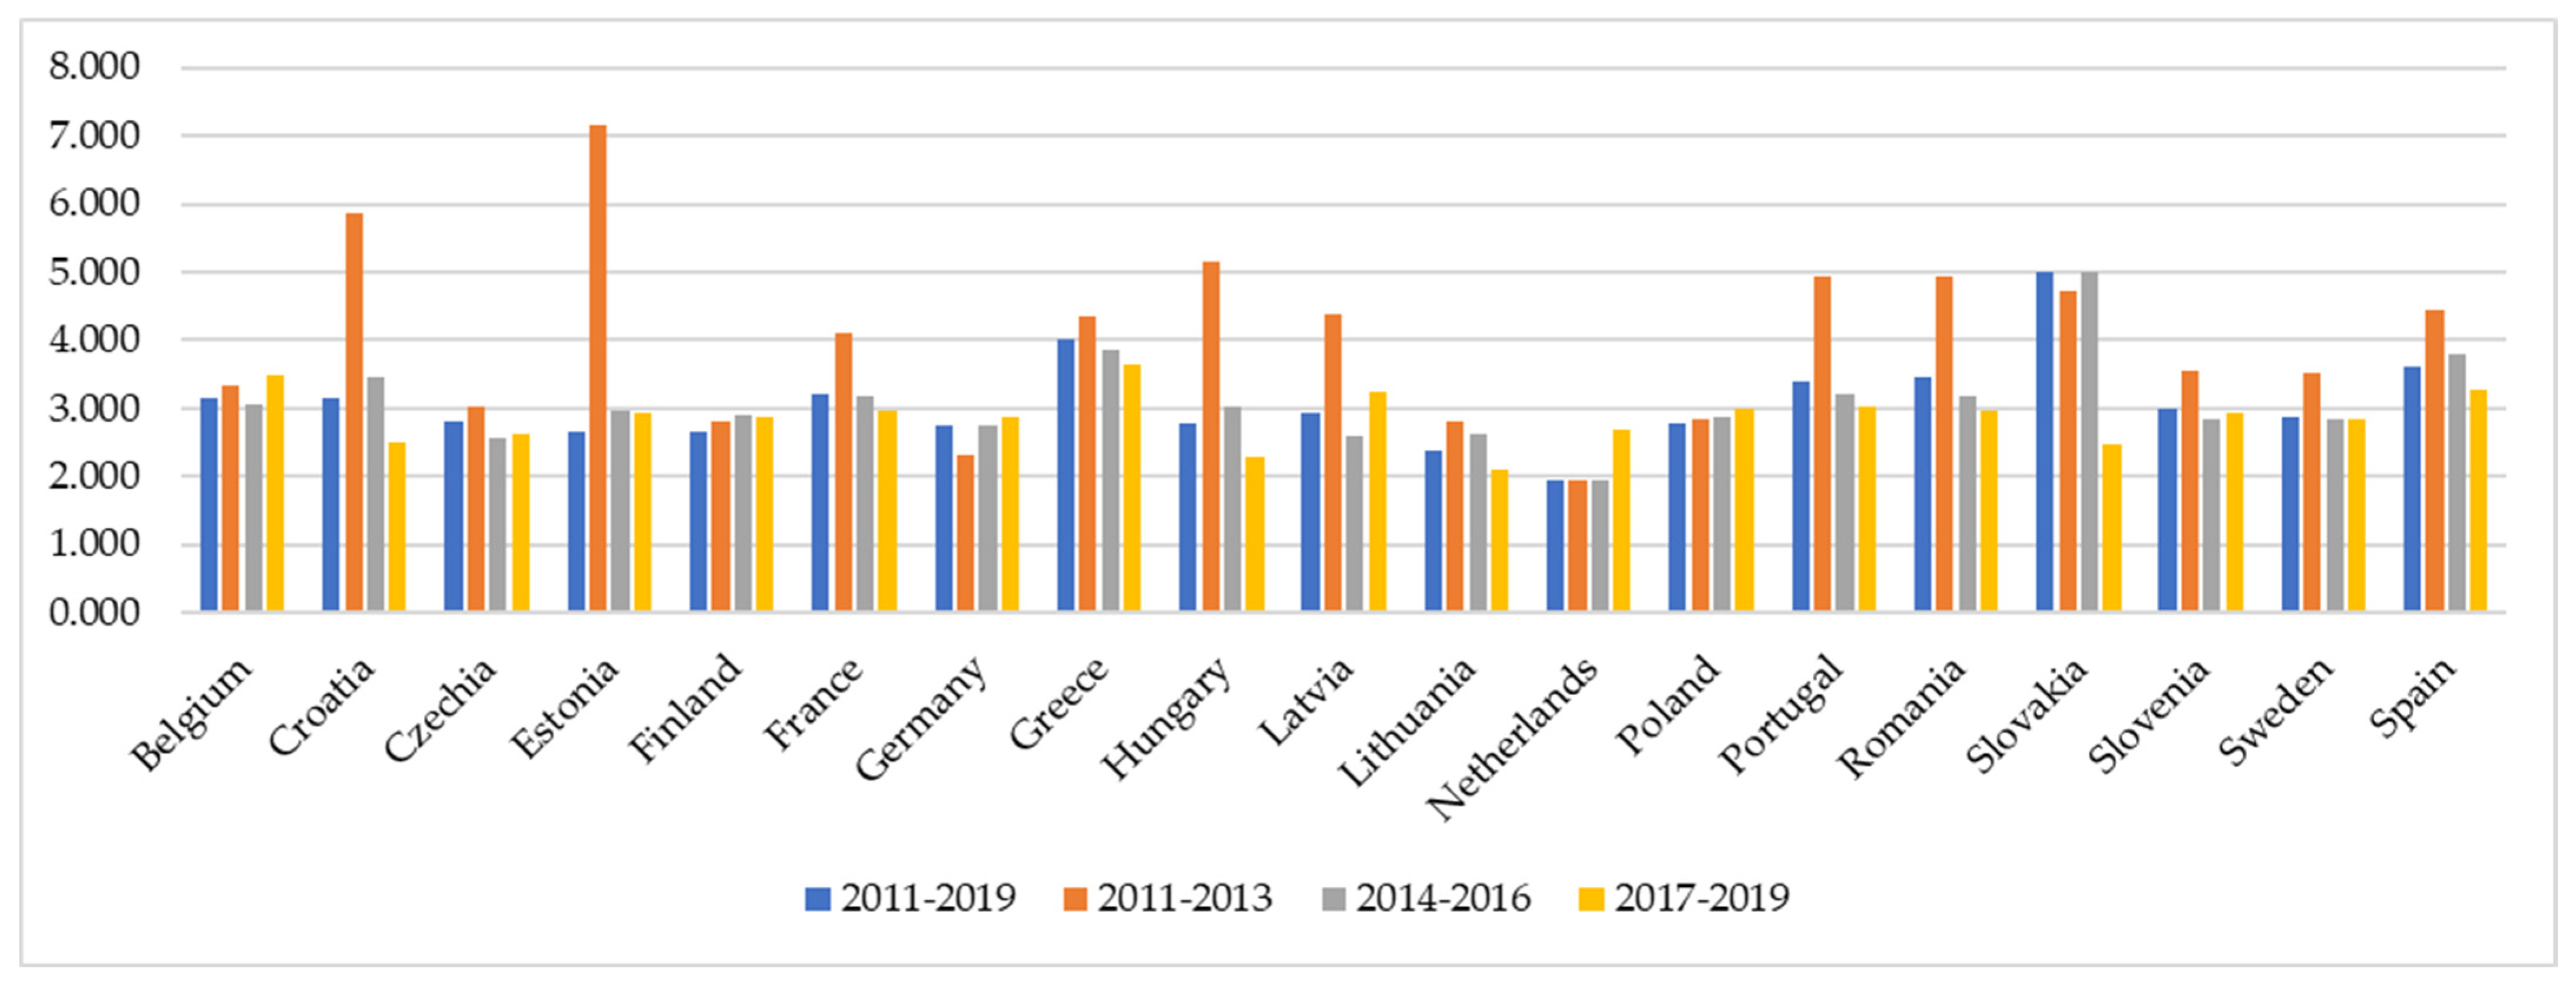
4.1. Solvency Risk in EU Food Retail—An Overview

Table 2 presents brief descriptive statistics of solvency risks for the companies included in our analysis, based on the median values of TD/SF for the entire period (2011–2019) and the three sub-periods (2011–2013, 2014–2016, and 2017–2019); thus, offering a short- versus long-term perspective, but also a dynamic view on solvency risk. For the 2011–2019 period, the overall mean of the TD/SF ratio was 1.912 and the median 1.281, indicating that retailers used more debt than equity to finance their businesses, although the proportion of debt compared to shareholder funds declined over time. For the full sample, the TD/SF ratio was 1.538 in 2011–2013, 1.241 in 2014–2016, and 1.142 in 2017–2019 (as median). The presence of higher means than medians for almost all samples and periods suggests that companies with significantly higher values of TD/SF exist (the exceptions are the low solvency risk sample for the 2011–2019 period, and 2014–2016 and 2017–2019 sub-periods). The differences between the three categories or levels of solvency risk—high, medium, and low—are rather impressive for the entire period and all sub-periods. Thus, for the entire period, firms in the high-risk category operated with 2.41 times more debt than firms in the medium-risk category, and with 5.91 times more debt than firms in the low-risk category. The differences are even higher for all three sub-periods: 2.66 and 6.44 in 2011–2013, 2.52 and 6.39 in 2014–2016, and 2.58 and 6.66 in 2017–2019, suggesting that the gap between the most indebted and least indebted companies in the industry increased over time. Similar and even higher differences between companies in the three solvency risk categories are also observable for the minimum and maximum values of TD/SD, regardless of the period used. It is also interesting that companies included in the high-risk category were more diverse than the ones in the other two categories, as indicated by the higher standard deviations of TD/SF means, for the entire period, and all three sub-periods. However, the good news is the negative trend of solvency risk over time observed at the full sample level and present for all solvency risk categories, indicating that the industry reduced its overall solvency risk between 2011 and 2019.
The declining trend in solvency risk and, thus, indebtedness of these companies, may be an indication of their maturity on the market, and, more likely, of certain legislative changes that occurred in the European Union, which are meant to equalize the tax advantages of debt versus equity financing. In principle, debt financing is more advantageous because it reduces the overall tax burden through tax-deductible interest (as opposed to equity financing, which does not benefit such a deduction). All other things equal, this tax effect provides an incentive for debt financing, which then influences the solvency ratios. The new legislation, in the form of Council Directive (EU) 2016 of 12 July 2016, which laid down the rules against tax avoidance practices that directly affect the functioning of the internal market (in effect, mostly from 2019) limits this benefit up to a certain threshold and, therefore, can equalize the bias towards debt or equity financing. The specific limitations to the deductibility of interest from profits before tax are of concern here, as they will offer companies less incentives to diminish their profits to pay less taxes and, consequently, they will be discouraged to carry higher amounts of debt and encouraged to use more equity-type financing. Given that this analysis covered the period before 2019, there is a strong probability that retailers, as all other businesses in the EU, had gradually adjusted their financing choices, in order to meet the requirements imposed by this EU Directive, which explains, at least partly, the decline in indebtedness.
The results presented in Table 3 and Table 4 are insightful on the upward and downward trends in solvency risks between 2011 and 2019. For the entire period, 3099 companies (67.42% of total) have seen their solvency risks increasing and only 1497 firms (32.58%) enjoyed a downward trend in solvency risk. However, since, overall, solvency risk declined at a sample level between 2011 and 2019, this means that the downward trends were steeper than the upward trends over the period. Hence, firms that decreased their solvency risk have done it at a higher pace than firms that increased their solvency risk. An interesting result is that the proportion of companies that have increased their solvency risk between 2011 and 2019 is quite similar across all three solvency risk categories, i.e., around 66–68%, with the remaining 32–34% of companies reducing their solvency risk over time. Another noteworthy observation is that mean and median TD/SF values were slightly higher for firms with a downward trend in solvency risk, in the high and medium-risk categories, while the reverse is true for firms in the low solvency risk category. This supports the previous opinion that downward trends in solvency risk were stronger than upward trends between 2011 and 2019.
Table 4 accompanies the results in Table 3, showing the “transfer” of companies in the food retail sector, among the three solvency risk categories, between the first to the second and third sub-period. Most companies remained in the high-risk and low-risk categories over all three periods—57.64% and 63.64%, respectively, while only 36.88% of them maintained their positions in the medium-risk category between 2011 and 2019. As expected, the movement of companies from one category to another was higher for adjacent categories. From the first to the second sub-period (2011–2013 to 2014–2016), 21.8% of them moved from the high- to medium-risk category, and 21.41% in the inverse direction, 18.67% moved from the medium to low-risk category, and 18.28% in the inverse direction, while only 3.07% moved from the high- to low-risk category, and 3.46% vice-versa. Similar results were found for movements from the second to the third sub-period (2014–2016 and 2017–2019): 22.52% of companies moved from the high- to the medium-risk category, and 21.08% in the opposite direction; 18.80% moved from the medium to the low-risk category, and 17.36% in the inverse direction; only 2.48% moved from the high- to the low-risk category, and 3.92% from the low to high-risk category.
Since the current analysis covers 20 EU countries, a brief perspective on solvency risk across these countries is also appealing. Over the whole period, 2011–2019, Greek companies had the highest level of solvency risk (a TD/SF ratio of 2.825 as median), followed by French companies (1.874) and Belgium firms (1.762)—see Figure 1 and Table A1 in Appendix A. At the opposite end, retailers from Czech Republic, Ireland, and Hungary enjoyed the lowest solvency risk—TD/SF median ratios of 0.628, 0.635, and 0.820 (with the remark that only two Irish companies were included in the analysis). Higher means than medians are also present for each country represented in the sample, with the exceptions of Ireland and the Netherlands, but both have only a small number of companies included in the analysis (two and nine, respectively). When looking over time—see Figure A1, Figure A2 and Figure A3 in Appendix A—the first sub-period (2011–2013) shows the highest levels of solvency risk for almost all countries and solvency risk categories—the notable exceptions are high-risk companies in Germany, Netherlands, and Poland, whose TD/SF ratios increased over time. Moreover, solvency risk levels (as TD/SF median) went up in the second sub-period compared to the first for high-risk companies in Finland and Slovakia, and for the two low-risk companies in Ireland, and in the third compared to the second for high-risk companies in Belgium, Croatia, Latvia, and Slovenia, for medium-risk companies in Czechia, Estonia, Hungary, Latvia, Slovakia, and Slovenia, and for low-risk companies in Czechia, Greece, Latvia, Lithuania, and Slovenia. The most important upsurges in solvency risk between 2011 and 2013 to 2014 and 2016 belong to Irish companies (28.4%) in the low-risk category and German firms (18.7%) in the high-risk category, while in 2017–2019 against 2014–2016, the solvency risk increase leaders were low-risk Czech companies (115.4%). At the opposite end, high-risk Estonian companies diminished their solvency risk level from the first to the second sub-period by 58.7%, followed by low-risk Croatian companies (50.1% decline), while medium-risk Czech companies have seen their median TD/SF level decrease from the second to the third sub-period by 65.5%, followed by high-risk Slovakian companies (50.6%). Positively, and supporting the previous conclusion of an industry that reduced its solvency risk over time, the median decline in TD/SF between the first and the second sub-period was 23.01% for low-risk firms, 21.66% for medium-risk firms, and 15.54% for high-risk firms, accompanied by subsequent declines from the second to the third sub-period of 7.25%, 6.97%, and 0.98%, respectively.
Figure 2 shows the distribution of companies from each country among the three solvency risk categories over the entire period (in percentages of the total number of companies included in the sample). More detailed statistics on the solvency risks of companies among countries are presented in Table A2 in Appendix A. Greece is the country with most companies falling in the high solvency risk category when the entire period is considered (63.2%), followed by France (48.9%) and Belgium (48.1%), while Czechia, Hungary, and Finland have the lowest percentage of companies with high solvency risk (6.5%, 14.3%, and 16.4%, respectively). At the other end, the countries with the most companies in the low solvency risk category were Czechia (78.3%), Lithuania (61.5%), and Finland (53.8%) had the highest percentages of companies with low solvency risk (except Ireland, with both its companies in this category). Apart from these countries, others show a rather balanced situation concerning the distribution of their companies in the three solvency risk categories. Moreover, when we consider the dynamics of solvency risk over the three sub-periods, the landscape is maintained to a significant extent. However, some interesting cases are noteworthy: in Czechia, 76.1% of companies had medium solvency risk in 2017–2019, a significant rise compared to only 15.2% and 17.4% in 2011–2013 and 2014–2016 sub-periods, which indicates an overall increase in solvency risk relative to the industry at EU level. Moreover, for 2017–2019, the percentage of Hungarian companies with a low solvency risk increased to 60.3% compared to 54% and 47.6% in 2011–2013 and 2014–2016 sub-periods, indicating a drop in solvency risk relative to the industry. Lithuania is an interesting case, due to the important changes in percentages of companies included in all three solvency risk categories over the three sub-periods. Overall, the percentage of companies in the high solvency risk category increased from 30.8% in 2011–2013 to 38.5% in 2017–2019, accompanied by fluctuating percentages for the low solvency risk category from 61.5% in 2011–2013 to 46.2% in 2014–2016 and 53.8% in 2017–2019. Slovakia has seen its percentage of companies in the high-risk category increase over time, from 27.9% in 2011–2013 and 2014–2016 to 34.9% in 2017–2019; it is accompanied by Sweden, with a similar evolution (26.8% in 2011–2013 and 37.2% in 2017–2019). Slovenia has experienced a reverse trend, in its case, the percentage of companies in the high-risk category declined from 40.5% in 2011–2013 to 35.1%. These diverse financial leverage patterns, reflected in different default patterns across European countries, were also identified by Behr and Weinblat (2017a), Behr and Weinblat (2017b), and Behr et al. (2019).
Finally, a short note on the link between solvency risk and firm size, i.e., turnover. The results show that firms in the high-risk category are larger, based on median turnover between 2011 and 2019—EUR 5915.00—compared to EUR 5261.00 for retailers in the medium-risk category and EUR 3904.00 for firms with low solvency risk. This finding is preserved for all three sub-periods, with the small exception of the 2011–2013 sub-period, when medium-risk firms had a slightly larger median turnover than high solvency risk firms (EUR 5526.00 against EUR 5083.00). These findings are not surprising, since business growth (and sometimes aggressive growth, as is the case of food retailers, particularly in Central and Eastern Europe) is usually financed by significant debt, as opposed to own funds (Omoshagba and Zubairu 2018; Khan et al. 2021). When examining the growth in turnover or total assets for the retailers in our sample, a higher solvency risk is associated with an increased compound annual growth rate (CAGR) compared to a lower solvency risk. As such, the mean turnover CAGR between 2011 and 2019 was 5.46% for high solvency risk firms, 3.80% for medium-risk, and only 2.89% for low-risk (median CAGR show the same pattern: 2.54%, 1.93%, and 1.5%, respectively). The mean total CAGR in assets was 4.92% for the high-risk firms, 3.96% for the medium-risk category, and 3.89% for the low-risk firms (confirmed by the median CAGR in assets of 3.04%, 2.6%, and 2.75%, respectively). ANOVA confirmed the statistically significant different values of CAGR among the three categories of firms; hence, these findings clearly show that retailers that operated with higher levels of debt grew more aggressively over time.

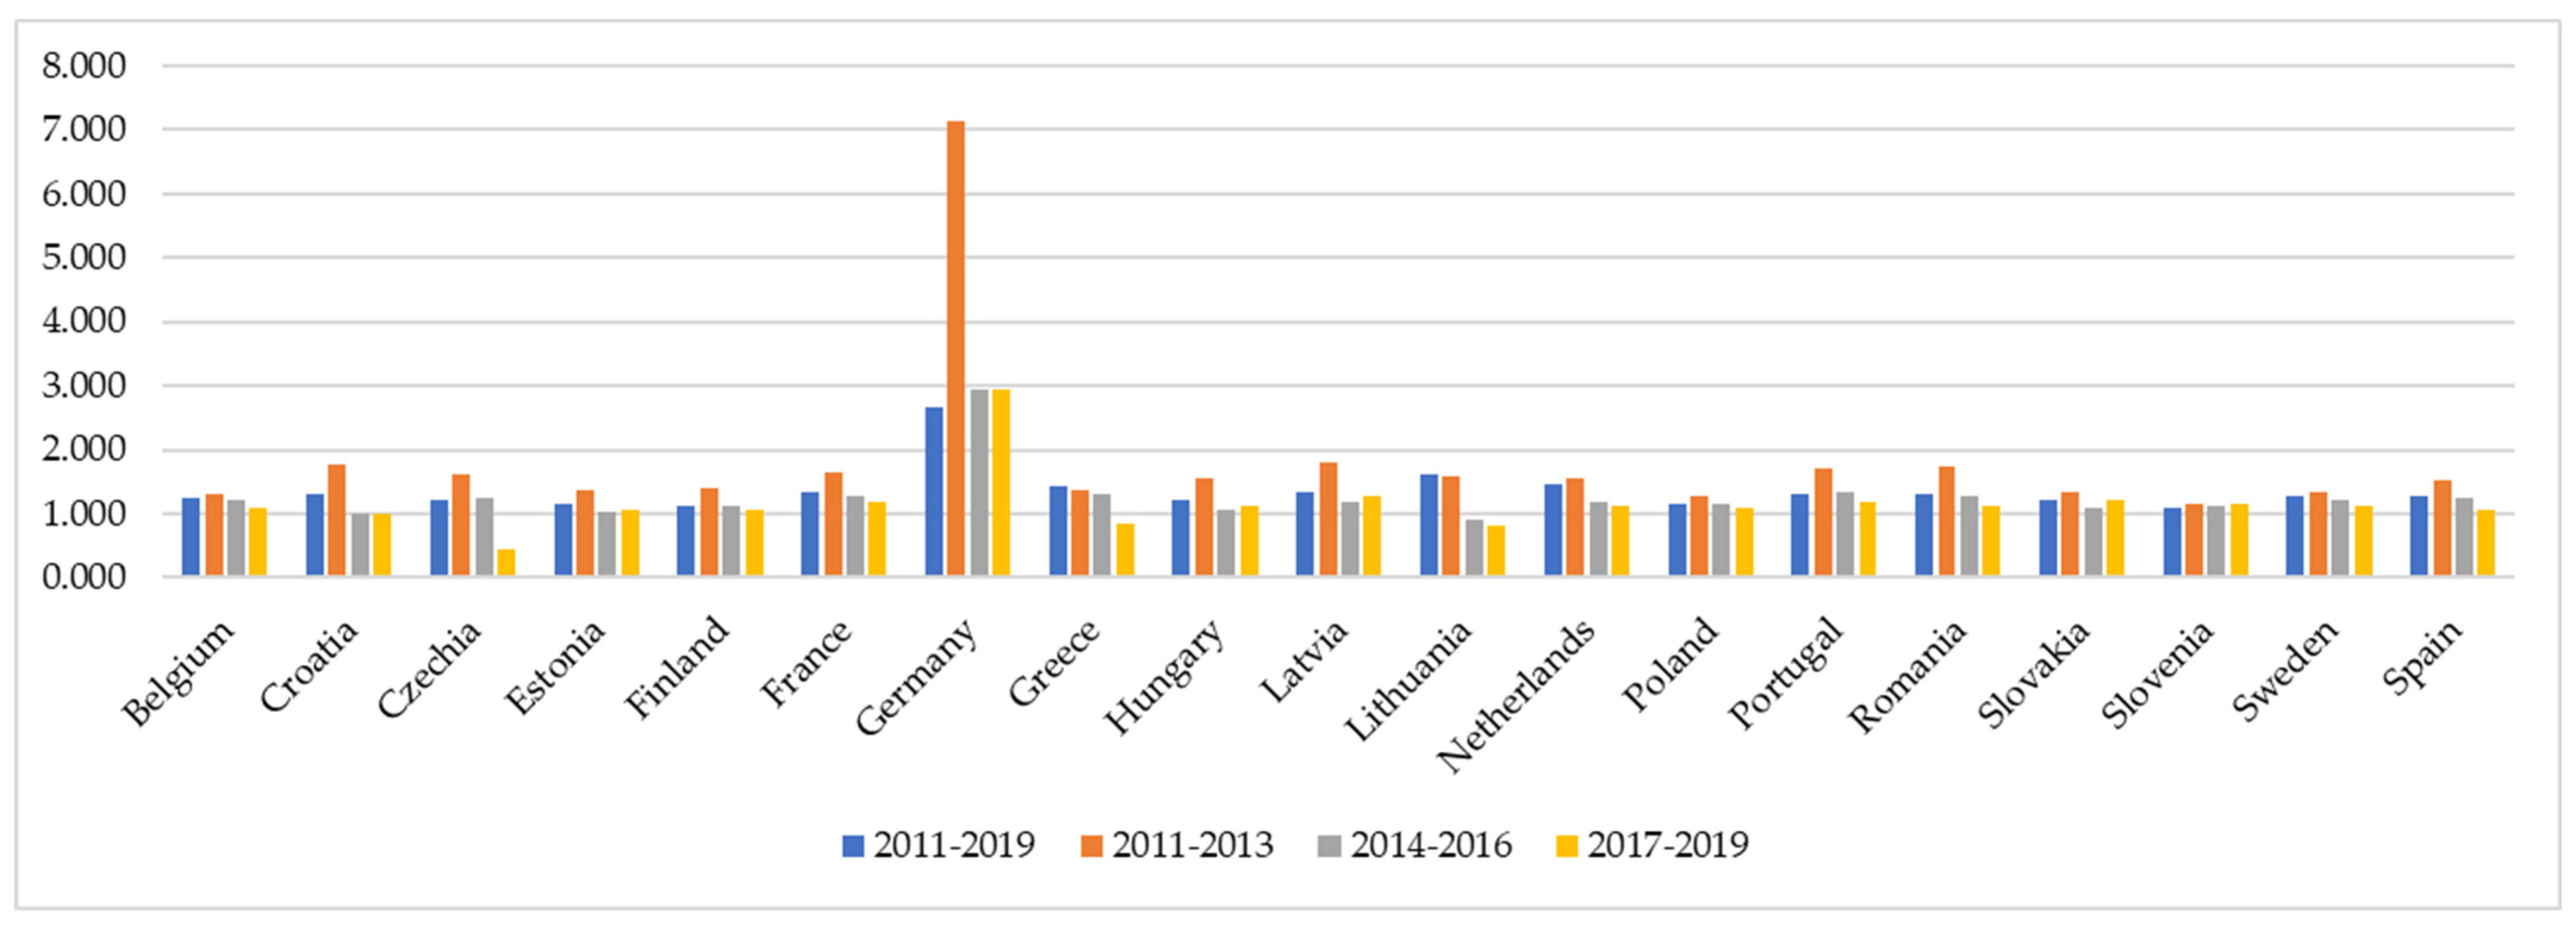
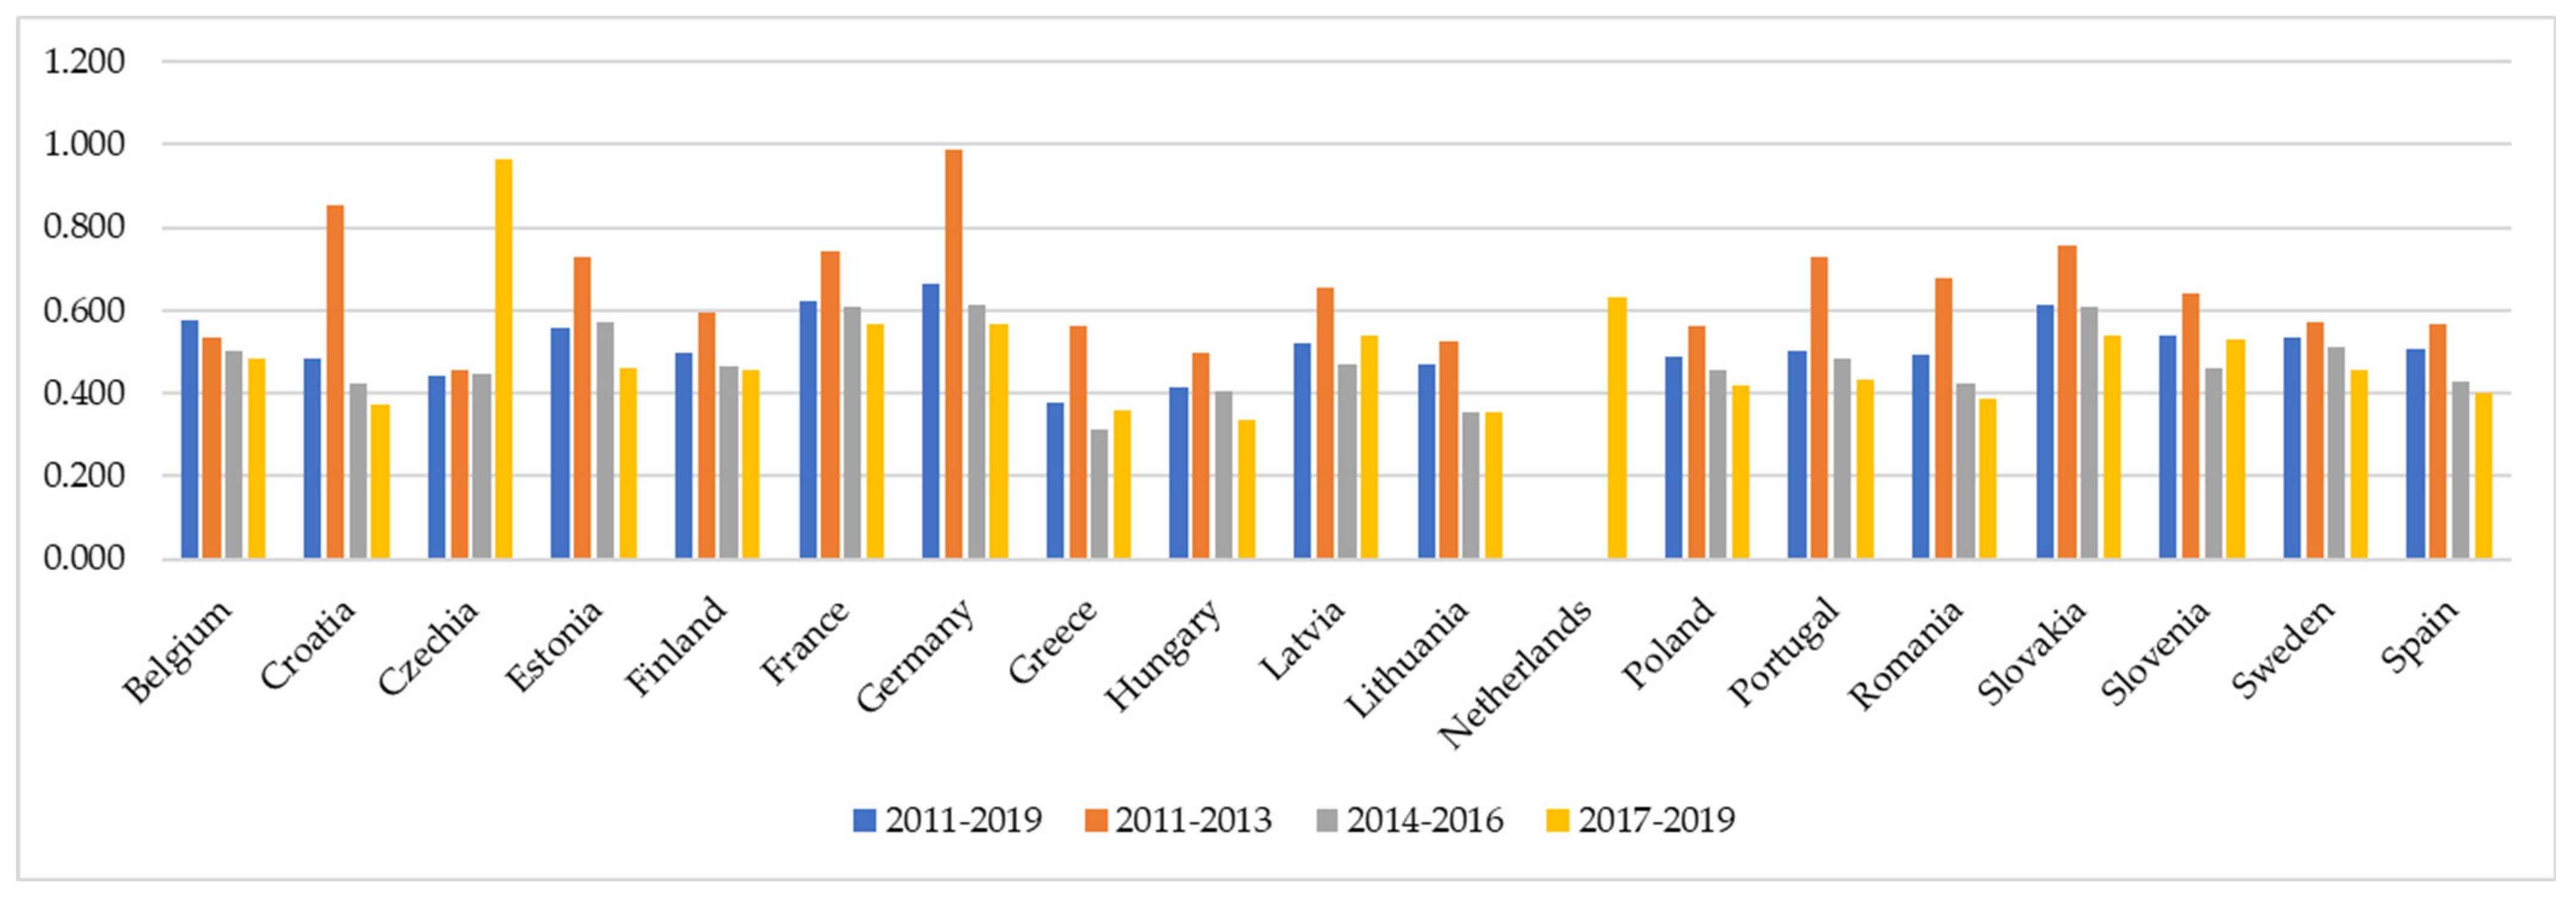
4.2. Trade-Offs in Solvency, Liquidity, Profitability, and Efficiency

The next step confronts solvency risk in EU food retail businesses with the other areas of performance, i.e., liquidity, profitability, and efficiency of asset use. Moreover, while solvency risk for EU food retailers declined between 2011 and 2019, the question is whether this evolution was accompanied by trade-offs in liquidity, profitability, and/or efficiency and, in case they existed, what the differences were between firms in the high, medium and low solvency categories.
Table 5 shows the median values, standard deviations, and trends for the six indicators of liquidity, efficiency, and profitability—outlined in Table 1—and for return on assets (ROAs) and return on equity (ROE), two widely used financial performance indicators for non-financial firms. Table A3, Table A4 and Table A5 in Appendix B show the same indicators for each solvency risk category over the 2011–2019 period.
The first performance relationship investigated is between solvency risk and liquidity. The results show that a higher solvency risk was accompanied over the 2011–2019 period by lower liquidity, measured by CR and NWC/turn. To exemplify, the median CR was 1.039 for high solvency risk firms, 1.286 for medium solvency risk firms, and 1.886 for low solvency risk firms. In the case of NWC/turn (median value), high solvency risk firms operated with 0.4% NWC to turnover, medium solvency risk firms with 2.7%, and low solvency risk firms with a ratio of 7%. Similar findings were valid for all three sub-periods investigated. All categories of firms diminished their liquidity between 2011 and 2019 (as a trend in CR and NWC/turn), but the decline in liquidity was more pronounced for firms with lower solvency risk. Furthermore, the negative trends in liquidity between 2011 and 2019 were more pronounced for CR than for NWC/turn, suggesting that the overall drop in liquidity was not accompanied by a similar decline in turnover. Belgian firms were the only ones with an upward trend in liquidity (as median), and no country had seen a positive trend in NWC/turn. Food retailers from Finland, Romania, Portugal, and Spain enjoyed the highest liquidity levels, while French, Belgian, and Slovakian companies had the lowest liquidity—the latter even operated at a CR below 1 (as a median over the 2011–2019 period). A higher volatility in liquidity ratios for less indebted companies (at lower solvency risk) was also noticeable, with firms from Romania, Spain, and Latvia showing the highest levels of volatility in liquidity between 2011 and 2019. At the other end, Slovakian, Czech, and French companies enjoyed less volatile liquidity over time. Interestingly, the retailers with higher and growing solvency risks have seen declines in CR and NWC/turn, while firms with a negative trend in solvency risk enjoyed increases in their liquidity levels (both in CR and NWC/turn). Overall, it seems that an actual trade-off between solvency risk and liquidity was not present over the analyzed period, and that increased solvency risk was associated with increased liquidity risk.
Further, the association between solvency risk and the ability of firms to use their assets to generate sales (or efficiency) was investigated. Here, a higher solvency risk was accompanied by increased efficiency of using assets, as evidenced by TAT—4.577 for high solvency risk firms, 4.268 for medium solvency risk firms, and 3.317 for low solvency risk firms, and a lower collection period of receivables (CollP)—1.903 days for high solvency risk firms, 1.771 days for medium solvency risk firms, and 2.658 days for low solvency risk firms. For each sub-period, the link between the higher solvency risk and better efficiency is preserved. Retailers from Sweden, Finland, and Poland enjoyed the highest median levels of TAT between 2011 and 2019, and those from Sweden, France, and Estonia had the lowest values of CollP. At the other end, the lowest values for TAT (as median between 2011 and 2019) were recorded for Croatia, Czechia, and Hungary, while the highest collection periods belonged to firms from Croatia, Romania, and Czechia. Only firms in the low solvency risk category have seen their TAT decline over time (as median), while those in the high and medium solvency risk categories have increased their efficiency at a rather similar pace between 2011 and 2019. In the case of CollP, there are small positive trends for firms in the medium and low solvency risk categories, but no trend for firms with high solvency risk. Moreover, we noticed higher trends in TAT than in CollP for all categories of firms, regardless of solvency risk. When looking at firms from different countries, 11 out of 20 countries have enjoyed an upward trend in TAT over the period (most in Belgium, Croatia, and Estonia), and 13 out of 20 a downward trend in CollP (most in Belgium, Portugal, and Spain), with no other specific differences worth mentioning. Moreover, the overall positive trend in the efficiency of retailers was accompanied by volatility in TAT, but most for firms in the high solvency risk category. No specific link between solvency risk and trends in CollP was observed. In terms of countries, retailers from Finland, Sweden, and Belgium had the highest volatility in TAT, while firms from Croatia, Romania, and Spain operated with the highest volatility in CollP. Thus, in the case of solvency risk versus efficiency, there seems to exist a trade-off between the two areas of performance, i.e., firms that assumed higher levels of debt operated at better and increasing efficiency levels, although more volatile over time.
Profitability is the last area of performance explored in relation to solvency risk. The results indicate that retailers with higher solvency risk were less profitable than retailers with lower solvency risk, in both EBIT margin and net profit margin (against operating revenues). Thus, the medians of the two profitability indicators over the 2011–2019 period were 1.51% and 1.10%, respectively, for high solvency risk firms, 2.14% and 1.63% for medium solvency risk firms, and 2.61% and 2.19% for low solvency risk firms. As in the case of liquidity and efficiency, the lower profitability (either in operational terms—through EBIT margin—or in after interest and tax terms—through net profit margin) of higher solvency risk firms was confirmed for all three sub-periods. However, firms in all solvency risk categories saw their profitability decline as a trend between 2011 and 2019, but high solvency risk firms faced lower declines in profitability than firms in the low-risk category. It is also notable that, the negative trends in net profit margin were higher than for EBIT margin for all firms, which suggests that interest and tax burdens increased for all firms, but more for higher solvency risk firms. On the positive side, profitability was less volatile for higher than for lower solvency risk firms. At the country level, Croatian and Swedish retailers showed the highest levels of profitability between 2011 and 2019, joined by Belgian firms, but only in terms of EBIT margin. Slovakian and Czech retailers were the least profitable in our EU sample. Moreover, 6 out of 20 countries enjoyed positive trends in EBIT margin (Belgium, Croatia, Czechia, Estonia, France, Slovakia) and only 2 out 20 in net profit margin (Belgium and Estonia). The most volatile profitability among countries was in Czechia, Croatia, and Belgium for EBIT margin, and in Latvia and Romania for net profit margin. The lowest volatility in profitability was in Slovakia, Estonia, and Czechia.
The results on the association between solvency risk and the aggregate performance of firms, measured by ROA and ROE, are further presented. Since ROA is the product of profitability and efficiency, and the previous findings indicate that a higher solvency risk is linked to increased efficiency, but lower profitability, exploring the link is challenging. When ROE is concerned, the link between solvency risk and the return available to shareholders is more obvious: since ROE is the product of ROA and financial leverage, higher solvency risk should lead to higher ROE. The results indicate that retailers in the low solvency risk category enjoyed better median ROA over the 2011–2019 period (8.75% versus 8.60% for medium solvency risk firms and 5.82% for high solvency risk firms—this means that, overall, the higher efficiency had a stronger impact on return on assets than the lower profitability associated to solvency risk. On the other hand, as expected, the ROE of firms in the high solvency risk category (25.65%) was higher than for medium solvency risk firms (20.64%) and for low solvency risk firms (13.39%). Thus, carrying more debt paid off in terms of returns to shareholders for EU retailers, albeit at the expense of operational profitability. A natural consequence of previous findings, the superiority of ROA for lower solvency risk firms, and of ROE for higher solvency risk companies was confirmed for all three sub-periods investigated. Thus, the findings of Doorasamy (2016) for South-African companies in the food industry, who show that higher financial leverage or indebtedness can increase ROE, are confirmed. Moreover, Barnett and Salomon (2012) insisted that highly indebted companies operate with high levels of ROE, which jointly lead to increases in the risk levels of firms. On the other hand, these results contradict the findings by Lenka (2017), which identified a negative relationship between ROE and indebtedness form most economic sectors in Czechia, including retail, as well as the results by Chadha and Sharma (2015), in the case of Indian manufacturing companies. In the case of ROA, we confirm the conclusions of Gleason et al. (2000) for European retailers, which show a negative link between higher debt and corporate performance. Similar findings were also advanced by Dawar (2014) for Indian companies, Yazdanfar and Öhman (2015) for Swedish firms, and Ahmed and Afza (2019) for business in Pakistan. However, caution should be taken when contrasting results, given that research methodologies differ, as well as the time frame of the analysis and the economic sector or industry under scrutiny.
At the country level, Swedish and Finnish retailers had the highest median ROA over the period (above 10%), and for ROE—Swedish firms with ROE above 30%—jointly with French firms. Another interesting point is that trends in ROA were negative for all solvency risk categories, but they were accompanied by positive trends in ROE for all firms, and sharper for more indebted companies (a natural effect of strong upward trends in indebtedness). Positive trends in ROA and ROE were found only in Belgium, Estonia, Finland, France, Latvia, Portugal, and Poland (the latter only for ROE). ROA and ROE displayed higher volatility over time for firms in the higher solvency risk category than for firms in the other two categories. In regard to countries, Swedish and Latvian retailers showed the highest volatility in ROA and ROE, and Slovakian and Czech companies the lowest.

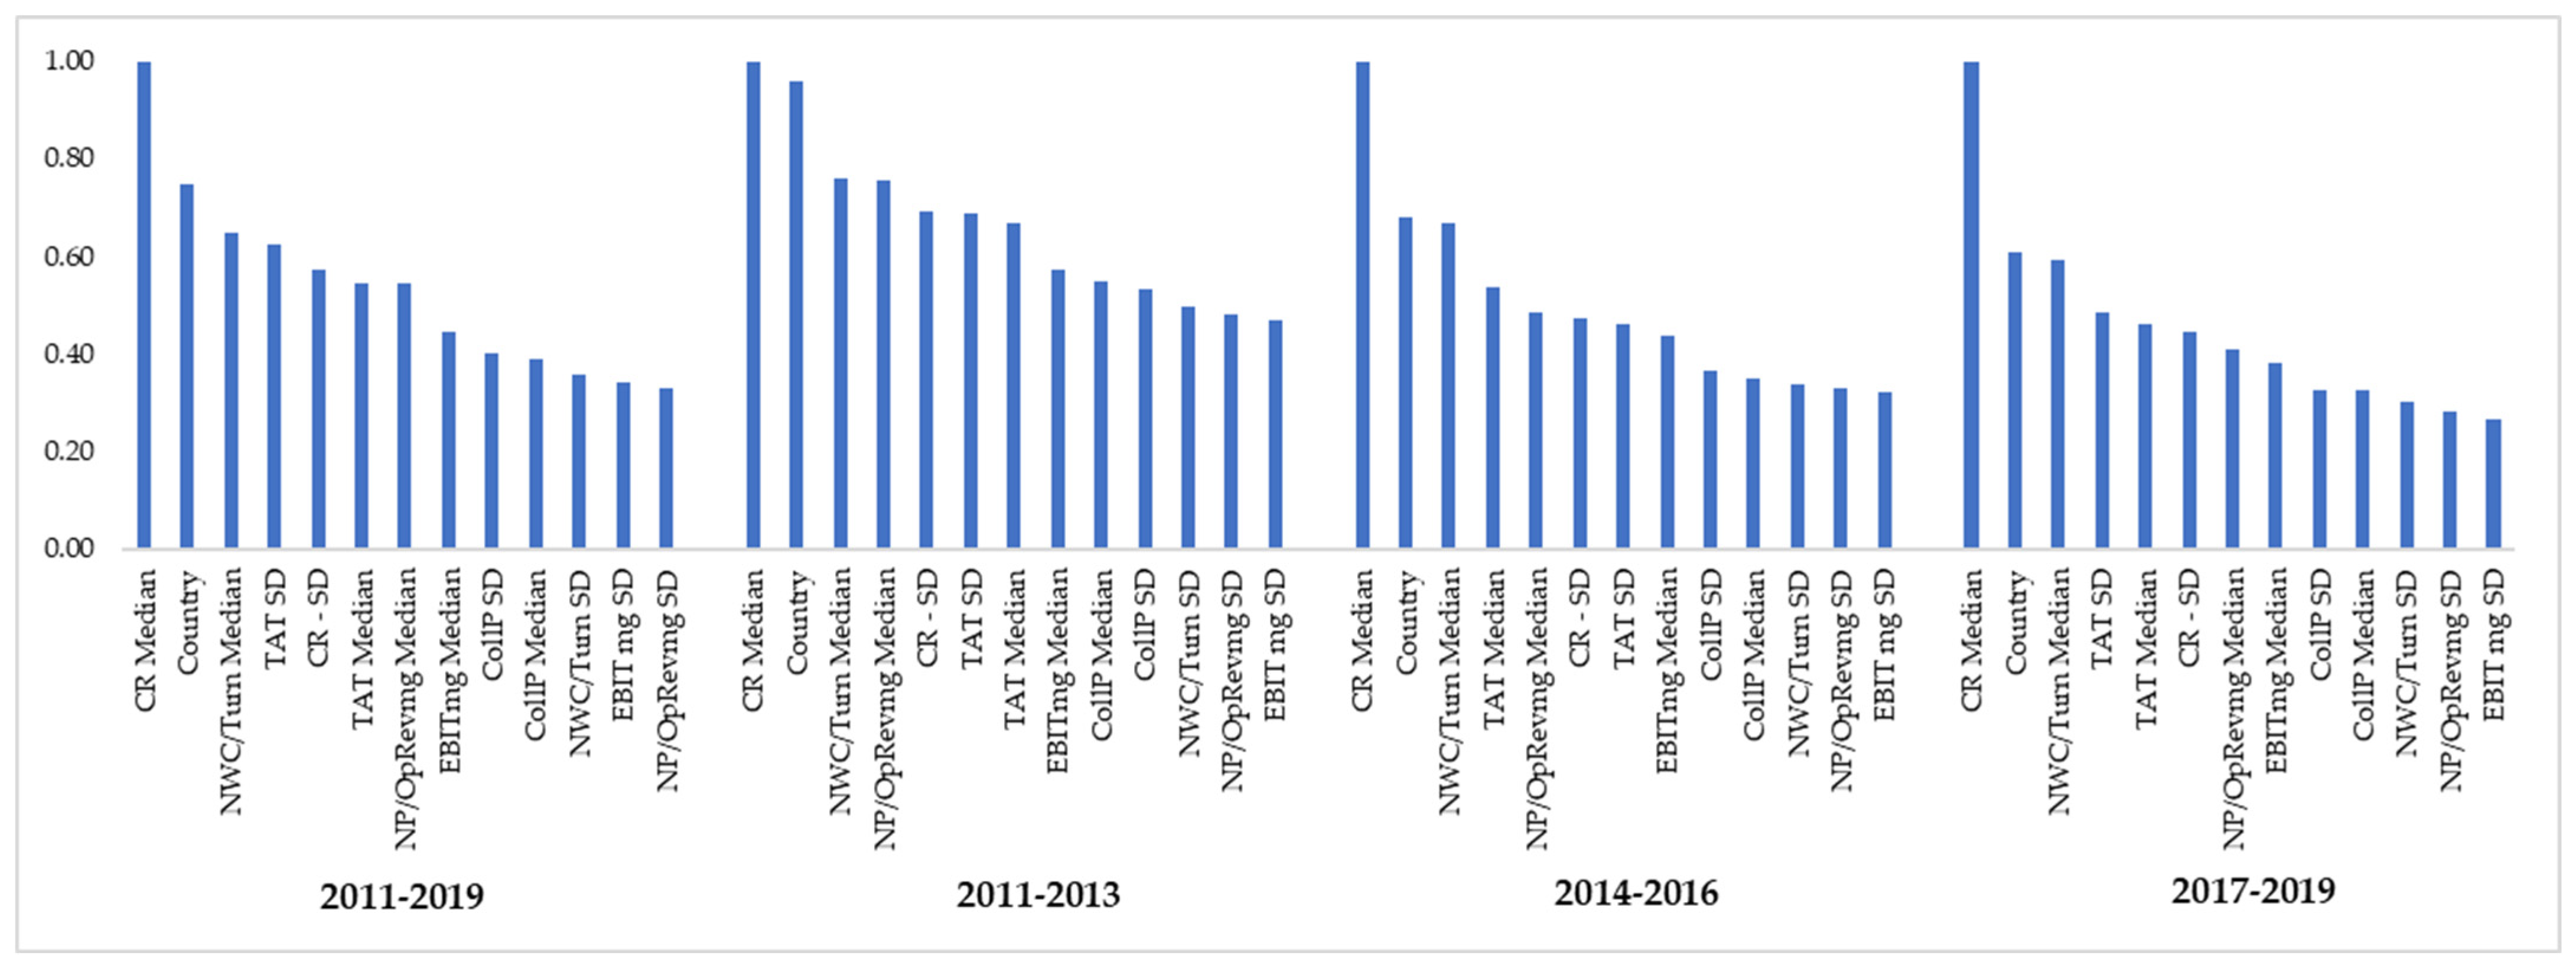
4.3. Drivers of Solvency Risk in EU Retail

The main objective of this research resides in exploring the main drivers behind solvency risk applied to the EU food retail industry. Equipped with the previous findings that show empirical connections among solvency risk, liquidity, efficiency, and profitability, the next research step proposes the machine-learning random forest classification algorithm to identify the best predictors of EU food retailer observed presence in the three solvency risk categories, i.e., high, medium, and low.
Various combinations of continuous and categorical variables were tested as predictors of TD/SF categories. The random forest algorithm was run with mean instead of median values, including or excluding standard deviations and trends, excluding country, and the best combination was proven to be median values, standard deviations, and country for the entire period and each sub-period. Once the set of predictors for the entire timeframe (2011–2019) was established, the same set of predictors was used for all three sub-periods as a robustness check for the model, but also to examine whether the same set of variables had predictive power for shorter versus longer periods. Table 6 shows the best risk estimates and standard errors for the random forest algorithm applied to the entire time frame (2011–2019) and for each sub-period, given a set of predictors formed of median and standard deviation values of liquidity, efficiency, and profitability variables (six continuous variables) and country (a categorical variable). The risk estimates represent the proportion of cases (firms) that were incorrectly classified by the trees in the random forest algorithm. Risk estimates for the train sample were 0.312 for 2011–2019 and varied between 0.319 and 0.349 for the three sub-periods (lowest for 2017–2019 and lowest for 2011–2013), with very small standard errors of only 0.008, regardless of the period. For the test sample, risk estimates were slightly higher—0.348 for 2011–2019 and varied between 0.361 and 0.414 for the three subperiods—and were accompanied by a somewhat higher standard error (0.013). Nevertheless, these results indicate that the selected set of predictors has significant power in explaining the classification of EU food retailers in the three solvency risk categories.
In Figure 3, the variable importance for the entire period and all three sub-periods is presented. The predictor importance is calculated based on normalizing the average of the predictor variable statistics for all variables included in the algorithm and over all splits and trees. The predictor statistics are computed for each variable, for each split, when the tree is built, and the best predictor—that offers the best split at a respective node—is chosen to perform the final split. The normalization of predictor statistics leads to a ranking in variables where the highest average gets a value of 1—the most important predictor—and the importance of all other predictors is determined relative to this highest average. Given this calculation process, the correct interpretation of these results is for each period taken separately when importance is concerned, and across periods, in terms of predictor rankings.
The most important findings evidenced in Figure 3 are the high importance of liquidity levels and the country for the firm’s classification, in terms of solvency risk and its presence in the first three ranks, for the entire period and all three sub-periods. This indicates that the most critical trade-off that retailers made was between solvency risk and liquidity, and this trade-off was maintained over shorter and longer periods of time. However, we should also note that while CR median is the most important predictor for solvency risk in all periods, the relative importance of the other variables against it declines over time. In the first sub-period, the median of NWC/turn is at 76.3%, but falls to 67.0% in the second sub-period and to 59.3% in the third sub-period. This may suggest that, despite the high importance of liquidity levels as predictors for solvency risk, the overall trade-off between liquidity and solvency risk may have faded over time. The volatility of liquidity, particularly of CR, holds a high ranking in the entire period and the first sub-period (fifth) and slightly lower (sixth) in the second and third sub-periods. However, NWC/turn volatility is one of the least important predictors for solvency risk, as it is placed in the 11th position in all periods. The findings are in line with Wu et al. (2010), who provided evidence that liquidity is a significant predictor of financial distress and, further, bankruptcy, in the case of NYSE- and AMEX-listed firms for the 1980–2006 period. Similarly, Cultrera and Bredart (2016) pointed towards liquidity and profitability as good predictors of bankruptcy for Belgian SMEs.
Efficiency variables (TAT Median and CollP Median) come in the 6th and 10th places in the ranking for the entire period, in the 7th and 9th for the first sub-period, the 4th and 10th in the second sub-period, and the 5th and 11th in the third sub-period; TAT is always more important than CollP. Moreover, the volatility of TAT holds the 4th position in the ranking for the entire period and the 6th–7th positions in the three sub-periods. Nevertheless, efficiency levels are more important for solvency risk than profitability; except for the 2011–2013 sub-period, efficiency variables hold higher positions in the predictor rankings than profitability variables. For the whole 2011–2019 period, EBIT margin and the net profit margin were placed in the 7th and 8th positions, with half the importance of CR median. Although, in the first and second sub-periods, net profit margin is ranked in the 3rd and 4th positions, respectively (but not the EBIT margin, placed in the 8th position for all sub-periods). Profitability volatility is the least important predictor of solvency risk, as in all periods, the standard deviations of EBIT margin and net profit margin are placed in the last positions in the rankings.
Overall, the joint importance of liquidity, efficiency, and profitability levels is more important than their volatility for all periods (59.7% versus 44.1% in 2011–2019, 71.6% versus 56.1% in 2011–2013, 58.1% versus 38.3% in 2014–2016, and 53.1% versus 35.3% in 2017–2019). However, a decline in all of the other performance attributes against CR declines strongly over time, from 66.3% in 2011–2013 to 43.6% in 2017–2019. This result suggests that maintaining a good level of liquidity is a concern for the food retail businesses and that solvency risk, accompanied by liquidity risk, are a mark of the industry. Finally, the categorical variable “country” has a high relative importance (against CR median) for explaining the classification of firms based on solvency risk, albeit declining over time: 74.9% in 2011–2019, 96.1% in 2011–2013, 68.4% in 2014–2016, and 61.1% in 2017–2019. This means that important differences between countries are present in terms of retailers’ solvency risk levels and that they are preserved over time (see Figure 2 above), despite a reducing importance of these differences in relation to liquidity levels.
Further, Table 7 shows the classification matrix for the entire period and all sub-periods, applied to all firms included in the random forest algorithm. The most important results in Table 7 refer to the percentages of firms that were observed as belonging to a solvency risk category (high, medium, or low) and were indicated by the model (predicted) to be part of the same category—the bolded percentages. This result correlates with the risk estimates in Table 6. For the entire period, our model predicts 73.17% of the firms included in the high solvency risk category as being in this category, 60.31% of the firms in the medium solvency risk category as belonging here, and 69.52% of the firms in the low solvency risk category as being included in this category, based on the set of predictors used. For each sub-period, the model better predicts the placement of retailers in the high solvency risk category compared to the other two categories, followed by firms in the low-risk category and firms in the medium-risk category. This may suggest that the predictors in our model have a higher significance for higher solvency risk firms than for medium- and low-risk companies.
The last results reported are the gains charts, which show the percentage of cases (firms) correctly classified into a specific category, when selecting the top x percent of cases (on the horizontal axis) from the sorted cases, according to the classification probabilities. These charts are useful when assessing the performance of the model, i.e., to determine how useful the set of predictors are, included for the case (firm) classifications in the chosen categories. The higher the difference between the model curve and the baseline curve (which shows a random classification of cases, resulting from flipping a coin) the better the model performance in predicting the classification. We show, in Figure 4, these charts for the entire period, noting that they are very similar for all three sub-periods. They substantiate the risk estimates and the classification matrixes, indicating that our model is performing well and better than chance for all solvency risk categories, with a plus for the high- and low-risk categories.

5. Conclusions

Solvency is a key financial concern for the food retail industry in the European Union. The results of the current analysis show that there are significant differences between retailers, depending on their country of origin, but further analysis, including several non-financial factors, such as population size, year of incorporation (company history), corporate governance, level of marketing expenditure, etc., is needed, and can form the basis of a follow-up study, using food retailers as a starting point.
There was an evident declining trend for solvency risk and, thus, indebtedness of the EU food retailers, after the global financial crisis and until the beginning of the pandemic, which may reflect their maturity on the market, but also an adjustment to certain legal changes in the European Union, meant to equalize the tax advantages of debt versus equity financing (Council Directive (EU) 2016). The new legislation limits the benefit of debt financing through lower tax burdens due to tax-deductible interests, up to a certain threshold, which will diminish the bias towards debt financing. Whether regulations were induced, or were the results of business decisions, EU food retailers have entered the pandemic well prepared, enjoying declining levels of debt and good profitability levels, which support their adjustments to the restrictions imposed by authorities to limit the spread of the virus.
An ongoing question is whether the downward trend in solvency risk came with trade-offs, in terms of liquidity, profitability, and/or efficiency. Our results show that higher solvency risk is associated with lower liquidity, which can be best explained by the trade-off between long-term liabilities and short-term liabilities in an industry, which is historically dependent on long payment terms. Further, a higher solvency risk was accompanied by an increased efficiency of using assets, which may be an indication of a firm’s ability to use additional debt to invest in assets with ever-higher efficiency. In terms of profitability, results show that, unsurprisingly, retailers were willing to assume higher solvency risks by paying additional indebtedness costs, which eroded their net profit margins (net after financing cost). Interestingly profit margins were also lower, but since they are insensitive to financing costs, further analysis would be required to decompose the influence of factors over declining profitability over time. This could become the subject of a follow-up study by the authors. Putting all of the effects together, our results are consistent with the microeconomic theory, which states that, when profit increases because of higher indebtedness, the return available to shareholders should increase as well, except where, of course, debt cost offsets the marginal increase in profits. However, this should not be the case for the analyzed period, as financing costs consistently decreased, driven by very small (to zero—and even negative) interest rates in several EU countries.
There seems to be a link between solvency risk and firm size, as measured by turnover, in the sense that larger firms have higher levels of indebtedness, and, vice-versa, firms with a higher solvency risk are larger in size (when measured by turnover). This is not a surprising finding, as growth (sometimes aggressive, as was the case with the food retail industry in the EU after the global financial crisis) is usually financed by significant debt, as opposed to a company’s own funds.
The predictive model of solvency risk based on a retailer’s performance and location (as country of headquarters) indicated that the most critical trade-off that retailers made was between solvency risk and liquidity, regardless of whether this was considered over shorter or longer periods. This is consistent with recent research—Ebeke et al. (2021)—which shows that maintaining high liquidity levels helps firms in distress or with a higher solvency risk, to mitigate the shock impact, as was the case during the pandemic. Moreover, the results of the random forest model show that this trade-off between liquidity and solvency risk may have faded over time for food retailers, while the volatility of liquidity holds a high ranking as a predictor of solvency risk. Hence, sustaining a stable and good level of liquidity supports a lower risk of financial distress. This conclusion is even more important for retailers, where, as our results indicate, solvency risk accompanied by liquidity risk is a mark of the industry. Interestingly, efficiency and profitability indicators are less important as predictors of solvency risk in the food retail industry, and, overall, the levels of performance hold a higher relevance for the prediction of solvency risk compared to the volatility of financial indicators.
There are some implied financial, economic, and social ramifications from the current research. First, during periods of economic calm, companies are seeking to increase leverage to grow the size of their businesses. This may be particularly true for a low-margin segment of the industry, such as the retail food sector analyzed in this paper, where there may be limited opportunities to reap monopolistic profits from innovations, etc. It would be interesting to see if the effects hold in higher-margin industries, as well as what happened with the retail food sector a few years after the pandemic, which drove many more companies to innovate supply chains and distribution channels. Second, public policy may have a strong effect on targeted companies—fiscal policy in this case. In the EU context, it is important to note that measures are adopted almost simultaneously by all member states and there are limited opportunities for tax or legislation “arbitrage”, which unifies the conclusions regarding the disincentives to total debt coming from fiscal policy. This may provide a boost to EU regulators for future public policy purposes. Finally, the retail food sector is strategic to any economy, as it supplies for basic goods, and provides a distribution channel for local producers and for agribusiness in general. It would be interesting to analyze solvency risk for upstream sectors to understand where the ball stands, in terms of commercial power and/or prowess.
As any other empirical study, our research is not free from limitations; hence, our findings need to consider the following. First, the paper investigated a single industry, the food retail, which makes the results strictly applicable to it, given that performance patterns are very different from one industry to another. Investigations on other industries—particularly on the different types of retail, and comparing the results, was considered by the authors, and may be the focus of further research. Second, there is an inherent limitation associated with the populations of the firms included in our research, which needed to have full data available for the nine years covered in our work. We assumed this limitation to gain accuracy; however, this means that many companies were excluded, particularly from some countries. Hence, an improved data service may further increase the relevance of our research. Third, the research addressed the case of retailers from the European Union, but the analysis may be extended to retailers at a global level, which would shed light into how the transformation that retail underwent reflected in the financial performance. Fourth, location entered the model as the country of headquarters, which may alter the results, given that the bigger retailers are multinational corporations with affiliates all over the EU, and the performances of these affiliates in the host countries are reflected in the mother company’s performance. Fifth, when the study was initiated, data were available for a timeframe of only ten years, until 2019, but it would be highly interesting to extend the research to data covering the year 2020, to grasp the impact of the pandemic on the food retail industry.

Author Contributions

Conceptualization, A.H., C.-A.B., S.C.C., A.S.P., L.B., D.G.D.; data collection and curation: C.-A.B., A.S.P.; methodology: A.H., S.C.C., L.B., D.G.D.; formal analysis: A.H., S.C.C., L.B., D.G.D.; writing—original draft preparation: C.-A.B., S.C.C., A.S.P., D.G.D.; writing—review and editing: A.H., L.B.; supervision: A.H. All authors have read and agreed to the published version of the manuscript.

Funding

This research received no external funding.

Institutional Review Board Statement

Not applicable.

Informed Consent Statement

Not applicable.

Data Availability Statement

Data used in this research are provided by Orbis—TP Catalyst of Bureau van Dijk, available to the authors through the Bucharest University of Economic Studies.

Conflicts of Interest

The authors declare no conflict of interest.

Appendix A

Table A1. Descriptive statistics of TD/SF by country of company headquarters, full sample, 2011–2019.
CountryNumber of CompaniesMeanMinimumMaximumStandard DeviationLower QuartileMedianUpper Quartile
Belgium542.1820.2216.2321.5341.0001.7623.094
Croatia651.9520.16012.5872.2320.6071.0822.585
Czech Republic460.7640.1413.0300.6560.4020.6280.827
Estonia421.6000.2329.3072.0530.5430.8221.643
Finland1951.1260.1168.3991.0340.4890.7971.392
France12712.4490.23014.2021.9911.1211.8743.106
Germany122.2350.2458.0432.1470.7501.7262.571
Greece193.1960.1409.7332.5940.8142.8254.860
Hungary631.2290.1589.4151.5390.4000.8201.485
Ireland20.6350.6150.6540.0280.6150.6350.654
Latvia771.7340.1736.3661.4920.6231.2252.106
Lithuania131.2260.2223.7431.1140.4490.8042.062
Netherlands91.7020.8822.8750.5811.2011.7191.941
Poland5411.2080.10511.3521.2220.4770.8271.436
Portugal2981.9620.12514.0742.1240.6811.2952.224
Romania6441.9710.10313.3112.0730.6331.2752.376
Slovakia432.0610.31910.7662.2190.7831.1622.251
Slovenia371.8540.1365.4231.4390.8181.1442.958
Sweden7991.6670.10512.7221.6050.6821.1951.993
Spain3662.1360.11513.7932.5210.5961.1592.606
Full sample45961.9120.10314.2021.9190.6921.2812.363
Figure A1. Solvency risk by country, full period, and three sub-periods—high solvency risk category. Note: the graph shows the median values of the TD/SF ratio.
Jrfm 14 00536 g0a1
Figure A2. Solvency risk by country, full period, and three sub-periods—medium solvency risk category. Note: the graph shows the median values of the TD/SF ratio.
Jrfm 14 00536 g0a2
Figure A3. Solvency risk by country, full period, and three sub-periods—low solvency risk category. Note: the graph shows the median values of the TD/SF ratio.
Jrfm 14 00536 g0a3
Table A2. Distribution of companies and descriptive statistics for TD/SF median, 2011–2019.
CountryCategories TD/SFMeanNumber of CompaniesPercentage of Total Number of Companies MinimumMaximumStandard DeviationLower QuartileMedianUpper Quartile
BelgiumHigh solvency risk3.4442648.1%1.9206.2321.2612.2193.1454.169
Medium solvency risk1.2441935.2%0.9251.7990.2711.0001.2451.347
Low solvency risk0.515916.7%0.2210.7950.2250.2680.5780.721
CroatiaHigh solvency risk4.0842335.4%1.92412.5872.6002.3143.1394.803
Medium solvency risk1.2811523.1%0.8871.8890.3000.9991.3221.527
Low solvency risk0.5102741.5%0.1600.8530.2390.2660.4850.741
CzechiaHigh solvency risk2.83236.5%2.6703.0300.1832.6702.7973.030
Medium solvency risk1.275715.2%0.9431.7000.3050.9531.2151.548
Low solvency risk0.4923678.3%0.1410.8380.2030.3300.4430.656
EstoniaHigh solvency risk4.623921.4%2.0409.3072.8122.3592.6536.783
Medium solvency risk1.2141126.2%0.8991.8180.3060.9471.1631.395
Low solvency risk0.5572252.4%0.2320.8270.1920.3750.5570.750
FinlandHigh solvency risk2.9933216.4%1.9968.3991.2302.1932.6573.182
Medium solvency risk1.2095829.7%0.8721.8960.2960.9421.1301.395
Low solvency risk0.51010553.8%0.1160.8480.1950.3720.4970.671
FranceHigh solvency risk3.83462148.9%1.91214.2022.0432.3913.2084.570
Medium solvency risk1.35545035.4%0.8661.9080.2901.1131.3431.584
Low solvency risk0.61020015.7%0.2300.8620.1620.5080.6250.745
GermanyHigh solvency risk3.915541.7%2.0448.0432.4702.3902.7514.345
Medium solvency risk1.630325.0%1.4381.8520.2091.4381.6001.852
Low solvency risk0.589433.3%0.2450.7790.2400.4290.6670.750
GreeceHigh solvency risk4.6251263.2%2.3929.7332.1852.8734.0265.893
Medium solvency risk1.437210.5%1.0571.8170.5371.0571.4371.817
Low solvency risk0.469526.3%0.1400.8140.3070.2440.3780.771
HungaryHigh solvency risk4.003914.3%2.0659.4152.6052.2872.7695.224
Medium solvency risk1.2882031.7%0.9091.9080.3290.9631.2201.561
Low solvency risk0.4593454.0%0.1580.8480.1710.3430.4170.526
IrelandLow solvency risk0.6352100.0%0.6150.6540.0280.6150.6350.654
LatviaHigh solvency risk3.5242431.2%2.0036.3661.3902.2922.9324.571
Medium solvency risk1.3532633.8%0.8781.9030.3311.0721.3431.676
Low solvency risk0.5102735.1%0.1730.8120.1870.3510.5210.630
LithuaniaHigh solvency risk2.636412.5%2.0623.7430.7852.0792.3703.194
Medium solvency risk1.60613.1%1.6061.606 1.6061.6061.606
Low solvency risk0.474847.1%0.2220.8560.2480.2380.4700.649
NetherlandsHigh solvency risk2.259333.3%1.9412.8750.5341.9411.9612.875
Medium solvency risk1.423666.7%0.8821.8410.3831.1941.4511.719
PolandHigh solvency risk3.2699517.6%1.91011.3521.5702.2942.7803.643
Medium solvency risk1.24916430.3%0.8751.9000.2811.0441.1631.428
Low solvency risk0.49028252.1%0.1050.8620.2090.3010.4910.647
PortugalHigh solvency risk4.2629331.2%1.91214.0742.4982.3623.4015.609
Medium solvency risk1.33310334.6%0.8691.9080.3191.0321.3161.587
Low solvency risk0.50010234.2%0.1250.8540.2080.3220.5040.692
RomaniaHigh solvency risk4.17621333.1%1.90913.3112.2842.3833.4695.311
Medium solvency risk1.35019830.7%0.8771.9050.3021.0931.3231.612
Low solvency risk0.48323336.2%0.1030.8620.2220.2920.4930.674
SlovakiaHigh solvency risk4.8421227.9%2.02210.7662.5692.5675.0016.259
Medium solvency risk1.2911739.5%0.9161.8570.3191.0251.2051.580
Low solvency risk0.6131432.6%0.3190.8640.1760.4410.6140.783
SloveniaHigh solvency risk3.2991540.5%2.0605.4231.1392.2063.0074.591
Medium solvency risk1.1641232.4%0.8661.8520.2830.9851.0981.266
Low solvency risk0.5141027.0%0.1360.8180.2440.2630.5390.709
SwedenHigh solvency risk3.61921426.8%1.91912.7221.9542.2562.8784.261
Medium solvency risk1.31531839.8%0.8651.9080.2941.0681.2661.560
Low solvency risk0.52126733.4%0.1050.8560.2040.3500.5360.684
SpainHigh solvency risk4.84611932.5%1.91113.7932.8682.6453.6196.141
Medium solvency risk1.30410227.9%0.8671.9050.2971.0481.2811.561
Low solvency risk0.49814539.6%0.1150.8630.2100.3230.5080.682

Appendix B

Table A3. Descriptive statistics of liquidity, efficiency, profitability, and aggregate performance indicators for high solvency risk companies, 2011–2019.
IndicatorMeanMedianMinimumMaximumLower QuartileUpper QuartileStandard Deviation
CR Median1.0651.0390.3795.7620.8401.2210.400
CR—SD1.0170.1790.016622.0510.1100.29519.516
CR Trend0.040−0.009−1.98744.389−0.0430.0211.398
NWC/S Median0.0020.004−0.1820.297−0.0210.0260.052
NWC/S SD0.0770.0230.00352.4560.0140.0401.350
NWC/SD Trend0.008−0.001−1.04116.217−0.0060.0030.416
TAT Median4.7604.5770.53710.1963.2246.1651.998
TAT SD0.9120.7210.0427.4330.4291.2000.717
TAT Trend0.011−0.002−1.1741.438−0.1280.1390.283
CollP Median5.5301.9030.00071.4280.9115.2219.418
CollP SD3.1970.9020.000194.3360.3703.0607.720
CollP Trend0.0420.000−15.07956.106−0.1270.1392.086
EBITmg Median1.8991.509−1.94413.6610.7652.6281.682
EBIT mg SD2.5091.0560.0431134.2530.6821.75729.302
EBIT mg Trend−0.212−0.015−329.25327.101−0.2080.1488.464
NP/OpRevmg Median1.3771.104−1.9079.7480.4991.9041.240
NP/OpRevmg SD1.9470.8600.000890.2870.5111.46922.943
NP/OpRevmg Trend−0.242−0.043−254.46415.115−0.2020.0676.528
ROA Median7.6775.822−14.91050.7392.30210.9557.630
ROA SD6.1215.1640.10937.8703.1767.8934.296
ROA Trend−0.299−0.177−10.9396.311−1.0500.5301.594
ROE Median33.60925.651−128.342420.45811.15247.69733.886
ROE SD34.08922.1360.457387.24412.77537.93942.123
ROE Trend0.1120.256−89.458117.105−3.1243.92010.405
Table A4. Descriptive statistics of liquidity, efficiency, profitability, and aggregate performance indicators for medium solvency risk companies, 2011–2019.
IndicatorMeanMedianMinimumMaximumLower QuartileUpper QuartileStandard Deviation
CR Median1.3471.2860.3827.9781.0291.5500.608
CR—SD0.5630.2590.01733.1050.1610.4231.941
CR Trend−0.023−0.017−6.3776.271−0.0750.0270.385
NWC/S Median0.0320.027−0.1690.5230.0030.0570.057
NWC/S SD0.1020.0250.00153.0000.0160.0421.618
NWC/SD Trend0.009−0.002−0.31512.176−0.0080.0030.340
TAT Median4.5074.2640.4289.9073.0975.8061.883
TAT SD0.7860.5950.04211.2200.3541.0220.717
TAT Trend0.0290.024−2.5392.319−0.0850.1480.261
CollP Median4.7441.7710.00072.5250.8394.3528.552
CollP SD2.7320.7700.000220.9000.3132.1568.820
CollP Trend−0.0460.003−46.2709.218−0.1110.1232.032
EBITmg Median2.4862.142−2.09413.4341.0573.4772.022
EBIT mg SD2.3001.1110.047505.6310.7381.82915.130
EBIT mg Trend−0.098−0.030−111.00352.394−0.2330.1333.270
NP/OpRevmg Median1.9081.633−1.90311.2210.8082.6391.594
NP/OpRevmg SD1.7260.9340.022303.5830.5711.5568.875
NP/OpRevmg Trend−0.125−0.043−69.61424.872−0.2150.0771.979
ROA Median10.5188.603−13.96867.0373.56115.1049.425
ROA SD6.2635.3050.10340.5553.1308.2474.428
ROA Trend−0.242−0.150−9.9317.670−1.0320.5841.685
ROE Median24.68920.644−31.795170.3668.37035.31322.415
ROE SD17.62712.6630.292311.9057.15321.78521.448
ROE Trend0.2500.091−46.01868.504−1.5782.0795.682
Table A5. Descriptive statistics of liquidity, efficiency, profitability, and aggregate performance indicators for low solvency risk companies, 2011–2019.
IndicatorMeanMedianMinimumMaximumLower QuartileUpper QuartileStandard Deviation
CR Median2.2241.8860.3768.6901.3412.6481.306
CR—SD1.6200.4840.041953.2450.2640.97024.488
CR Trend−0.203−0.047−190.85011.387−0.1460.0314.909
NWC/S Median0.0880.070−0.1550.5260.0300.1250.090
NWC/S SD0.1280.0330.005106.0050.0200.0542.713
NWC/SD Trend−0.020−0.004−21.5970.397−0.0120.0020.553
TAT Median3.5603.3170.48710.1852.3954.4231.604
TAT SD0.6090.4340.0377.2870.2470.7830.574
TAT Trend0.0420.029−1.6272.018−0.0540.1340.225
CollP Median5.7192.6580.00074.4450.9086.1829.275
CollP SD3.2431.1770.000144.5260.4382.9227.740
CollP Trend0.0040.015−27.75730.726−0.1210.2281.879
EBITmg Median3.0492.605−1.95513.5051.1254.4872.508
EBIT mg SD2.6991.2960.085592.5630.7852.20415.715
EBIT mg Trend0.085−0.035−5.949103.766−0.2600.1672.790
NP/OpRevmg Median2.5472.194−1.80311.9150.9613.6642.110
NP/OpRevmg SD2.2311.0770.054606.5300.6821.86716.214
NP/OpRevmg Trend0.021−0.065−6.163109.888−0.2510.0893.040
ROA Median10.8528.746−8.01964.4333.35415.7339.919
ROA SD5.8614.6130.12138.2902.7527.6124.631
ROA Trend−0.191−0.060−12.7347.227−0.8580.6451.714
ROE Median16.77413.393−11.916117.5134.93623.53116.078
ROE SD10.8157.2360.115316.9424.20112.83915.508
ROE Trend0.1920.048−65.04856.491−1.0641.3554.161

References

  1. Abraham, Facundo, Juan Jose Cortina Lorente, and Sergio L. Schmukler. 2020. Growth of Global Corporate Debt: Main Facts and Policy Challenges. World Bank Policy Research Working Paper 9394. Washington, DC: World Bank. [Google Scholar]
  2. Ahmed, Naweed, and Talat Afza. 2019. Capital structure, competitive intensity and firm performance: Evidence from Pakistan. Journal of Advances in Management Research 16: 796–813. [Google Scholar] [CrossRef]
  3. Alan, Yasin, and Michael A. Lapré. 2018. Investigating operational predictors of future financial distress in the US airline industry. Production and Operations Management 27: 734–55. [Google Scholar] [CrossRef]
  4. Alessi, Lucia, and Roberto Savona. 2021. Machine Learning for Financial Stability. In Data Science for Economics and Finance. Edited by Sergio Consoli, Diego Reforgiato Recupero and Michaela Saisana. Cham: Springer, pp. 65–87. [Google Scholar]
  5. Al-Hadi, Ahmed, Bikram Chatterjee, Ali Yaftian, Grantley Taylor, and Mostafa Monzur Hasan. 2019. Corporate social responsibility performance, financial distress and firm life cycle: Evidence from Australia. Accounting & Finance 59: 961–89. [Google Scholar]
  6. Almamy, Jeehan, John Aston, and Leonard N. Ngwa. 2016. An evaluation of Altman’s Z-score using cash flow ratio to predict corporate failure amid the recent financial crisis: Evidence from the UK. Journal of Corporate Finance 36: 278–85. [Google Scholar] [CrossRef]
  7. Altman, Edward I. 1968. Financial ratios, discriminant analysis and the prediction of corporate bankruptcy. The Journal of Finance 23: 589–609. [Google Scholar] [CrossRef]
  8. Altman, Edward I., and Edith Hotchkiss. 2010. Corporate Financial Distress and Bankruptcy: Predict and Avoid Bankruptcy, Analyze and Invest in Distressed Debt. Hoboken: John Wiley & Sons, vol. 289. [Google Scholar]
  9. Altman, Edward I., Małgorzata Iwanicz-Drozdowska, Erkki K. Laitinen, and Arto Suvas. 2017. Financial distress prediction in an international context: A review and empirical analysis of Altman’s Z-score model. Journal of International Financial Management & Accounting 28: 131–71. [Google Scholar]
  10. Altman, Edward I., Tara K. N. Baidya, and Luis Manoel Ribeiro Dias. 1979. Assessing potential financial problems for firms in Brazil. Journal of International Business Studies 10: 9–24. [Google Scholar] [CrossRef]
  11. Arel-Bundock, Vincent. 2017. The political determinants of foreign direct investment: A firm-level analysis. International Interactions 43: 424–52. [Google Scholar] [CrossRef] [Green Version]
  12. Bae, Jae Kwon. 2012. Predicting financial distress of the South Korean manufacturing industries. Expert Systems with Applications 39: 9159–65. [Google Scholar] [CrossRef]
  13. Balasubramanian, Senthil Arasu, G. S. Radhakrishna, P. Sridevi, and Thamaraiselvan Natarajan. 2019. Modeling corporate financial distress using financial and non-financial variables: The case of Indian listed companies. International Journal of Law and Management 61: 457–84. [Google Scholar] [CrossRef]
  14. Barnett, Michael L., and Robert M. Salomon. 2012. Does it pay to be really good? Addressing the shape of the relationship between social and financial performance. Strategic Management Journal 33: 1304–20. [Google Scholar] [CrossRef]
  15. Bauman, Mark P. 2014. Forecasting operating profitability with DuPont analysis: Further evidence. Review of Accounting and Finance 13: 191–205. [Google Scholar] [CrossRef]
  16. Beaver, W. H. 1966. Financial ratios as predictors of failure. Journal of Accounting Research 4: 71–111. [Google Scholar] [CrossRef]
  17. Behr, Andreas, and Jurij Weinblat. 2017a. Default patterns in seven EU countries: A random forest approach. International Journal of the Economics of Business 24: 181–222. [Google Scholar] [CrossRef]
  18. Behr, Andreas, and Jurij Weinblat. 2017b. Default prediction using balance-sheet data: A comparison of models. The Journal of Risk Finance 18. [Google Scholar] [CrossRef]
  19. Behr, Andreas, Schiwy Christopher, and Jurij Weinblat. 2019. Investment, default propensity score and cash flow sensitivity in six EU member states: Evidence based on firm-level panel data. Applied Economics 51: 5345–68. [Google Scholar] [CrossRef]
  20. Berk, Jonathan B., and Peter DeMarzo. 2019. Corporate Finance, Global Edition, 5th ed. Harlow: Pearson. [Google Scholar]
  21. Bertrand, Jean-Louis, and Miia Parnaudeau. 2019. Understanding the economic effects of abnormal weather to mitigate the risk of business failures. Journal of Business Research 98: 391–402. [Google Scholar] [CrossRef]
  22. Biau, Gérard. 2012. Analysis of a random forests model. The Journal of Machine Learning Research 13: 1063–95. [Google Scholar]
  23. Boďa, Martin, and Vladimír Úradníček. 2016. The portability of Altman’s Z-score model to predicting corporate financial distress of Slovak companies. Technological and Economic Development of Economy 22: 532–53. [Google Scholar] [CrossRef] [Green Version]
  24. Brealey, Richard, Stewart Myers, and Franklin Allen. 2019. Principles of Corporate Finance, 13th ed. New York: McGraw-Hill Education. [Google Scholar]
  25. Breiman, Leo. 2001. Random forests. Machine Learning 45: 5–32. [Google Scholar] [CrossRef] [Green Version]
  26. Brusov, Peter, Tatiana Filatova, and Natali Orekhova. 2014. Mechanism of formation of the company optimal capital structure, different from suggested by trade off theory. Cogent Economics & Finance 2: 946150. [Google Scholar]
  27. Chadha, Saurabh, and Anil K. Sharma. 2015. Capital structure and firm performance: Empirical evidence from India. Vision: The Journal of Business Perspective 19: 295–302. [Google Scholar] [CrossRef]
  28. Chen, Suduan, and Zong-De Shen. 2020. Financial Distress Prediction Using Hybrid Machine Learning Techniques. Asian Journal of Economics, Business and Accounting, 1–12. [Google Scholar] [CrossRef]
  29. Cheng, Ching-Hsue, and Ssu-Hsiang Wang. 2015. A quarterly time-series classifier based on a reduced-dimension generated rules method for identifying financial distress. Quantitative Finance 15: 1979–94. [Google Scholar] [CrossRef]
  30. Council Directive (EU). 2016. Available online: https://eur-lex.europa.eu/legal-content/EN/TXT/PDF/?uri=CELEX:32016L1164&from=EN (accessed on 3 August 2021).
  31. Cultrera, Loredana, and Xavier Bredart. 2016. Bankruptcy prediction: The case of Belgian SMEs. Review of Accounting and Finance 15: 101–19. [Google Scholar] [CrossRef]
  32. Dawar, Varun. 2014. Agency theory, capital structure and firm performance: Some Indian evidence. Managerial Finance 40: 1190–206. [Google Scholar] [CrossRef]
  33. De Jong, Abe, Rezaul Kabir, and Thuy Thu Nguyen. 2008. Capital structure around the world: The roles of firm-and country-specific determinants. Journal of Banking & Finance 32: 1954–69. [Google Scholar]
  34. Deloitte. 2020a. Global Powers of Retailing 2020a. Available online: https://www2.deloitte.com/ph/en/pages/consumer-business/articles/global-powers-of-retailing.html (accessed on 3 August 2021).
  35. Deloitte. 2020b. Recession 2.0. The Retail Evolution’s Great Acceleration. Available online: https://www2.deloitte.com/content/dam/Deloitte/us/Documents/consumer-business/us-cb-covid-recession-2020.pdf (accessed on 3 September 2021).
  36. Doorasamy, Michelle. 2016. Using DuPont analysis to assess the financial performance of the top 3 JSE listed companies in the food industry. Investment Management and Financial Innovations 13: 29–44. [Google Scholar] [CrossRef] [Green Version]
  37. Dufour, Dominique, Philippe Luu, and Pierre Teller. 2018. The influence of cash flow on the speed of adjustment to the optimal capital structure. Research in International Business and Finance 45: 62–71. [Google Scholar] [CrossRef]
  38. Ebeke, Christian, Nemanja Jovanovic, Laura Valderrama, and Jing Zhou. 2021. Corporate Liquidity and Solvency in Europe during COVID-19: The Role of Policies. Washington, DC: International Monetary Fund. [Google Scholar]
  39. EUROSTAT. 2021. Statistics Explained. Available online: https://ec.europa.eu/eurostat/statistics-explained/index.php?title=Retail_trade_volume_index_overview#Turnover_for_retail_and_wholesale_trade (accessed on 12 September 2021).
  40. Fantazzini, Dean, and Silvia Figini. 2009. Random survival forests models for SME credit risk measurement. Methodology and Computing in Applied Probability 11: 29–45. [Google Scholar] [CrossRef]
  41. Fawagreh, Khaled, Mohamed Medhat Gaber, and Eyad Elyan. 2014. Random forests: From early developments to recent advancements. Systems Science & Control Engineering: An Open Access Journal 2: 602–9. [Google Scholar]
  42. Garg, Akhil, and Kang Tai. 2013. Comparison of statistical and machine learning methods in modelling of data with multicollinearity. International Journal of Modelling, Identification and Control 18: 295–312. [Google Scholar] [CrossRef]
  43. Geng, Zhaoyuan, Lan Tan, Xiaoli Gao, Yining Ma, Lufeng Feng, and Jiaying Zhu. 2011. Financial distress prediction models of listed companies by using non-financial determinants in Bayesian criterion. Paper presented at the 2011 International Conference on Management and Service Science, Wuhan, China, August 12–14; pp. 1–5. [Google Scholar]
  44. Gerantonis, Nickolaos, Konstantinos Vergos, and Apostolos G. Christopoulos. 2009. Can Altman Z-score Models Predict Business Failures in Greece? Research Journal of International Studies 12: 21–28. [Google Scholar]
  45. GfK. 2021. GfK Study, European Retail in 2020 and 2021, Growth from Knowledge. Available online: https://insights.gfk.com/gfk-study-on-european-retail (accessed on 3 August 2021).
  46. Gleason, Kimberly C., Lynette Knowles Mathur, and Ike Mathur. 2000. The interrelationship between culture, capital structure, and performance: Evidence from European retailers. Journal of Business Research 50: 185–91. [Google Scholar] [CrossRef]
  47. Gray, J. Brian, and Guangzhe Fan. 2008. Classification tree analysis using TARGET. Computational Statistics & Data Analysis 52: 1362–72. [Google Scholar]
  48. Gregova, Elena, Katarina Valaskova, Peter Adamko, Milos Tumpach, and Jaroslav Jaros. 2020. Predicting financial distress of Slovak enterprises: Comparison of selected traditional and learning algorithms methods. Sustainability 12: 3954. [Google Scholar] [CrossRef]
  49. Gruszczynski, Marek. 2004. Financial distress of companies in Poland. International Advances in Economic Research 10: 249–56. [Google Scholar] [CrossRef]
  50. Gudmundsson, Sveinn Vidar. 2002. Airline distress prediction using non-financial indicators. Journal of Air Transportation 7: 3–24. [Google Scholar]
  51. Hastie, Trevor, Robert Tibshirani, and Ryan J. Tibshirani. 2016. The Elements of Statistical Learning: Data Mining, Inference and Prediction, 2nd ed. Springer Series in Statistics; New York: Springer. [Google Scholar]
  52. Hayes, Timothy, Satoshi Usami, Ross Jacobucci, and John J. McArdle. 2015. Using Classification and Regression Trees (CART) and random forests to analyze attrition: Results from two simulations. Psychology and Aging 30: 911. [Google Scholar] [CrossRef] [Green Version]
  53. Heine, Michael. 2000. Predicting Financial Distress of Companies: Revisiting the Z-Score and ZETA. Available online: http://pages.stern.nyu.edu/~ealtman/Zscores.pdf (accessed on 16 August 2021).
  54. Hu, Yu-Chiang, and Jake Ansell. 2007. Measuring retail company performance using credit scoring techniques. European Journal of Operational Research 183: 1595–606. [Google Scholar] [CrossRef]
  55. Ibrahim, Salma. 2007. The Relationship between Non-Financial Information and Financial Distress. The AAA 2008 MAS Meeting Paper. Available online: https://ssrn.com/abstract=997870 (accessed on 10 August 2021).
  56. Jabeur, Sami Ben, and Youssef Fahmi. 2018. Forecasting financial distress for French firms: A comparative study. Empirical Economics 54: 1173–86. [Google Scholar] [CrossRef]
  57. Jensen, Michael, and William Meckling. 1976. Theory of the Firm: Managerial Behavior, Agency Costs, and Capital Structure. Journal of Financial Economics 3: 305–60. [Google Scholar] [CrossRef]
  58. Kaiser, Ulrich. 2001. Moving in and Out of Financial Distress: Evidence for Newly Founded Service Sector Firms. ZEW Discussion Paper No. 01-09. Mannheim: Zentrum für Europäische Wirtschaftsforschung. [Google Scholar] [CrossRef] [Green Version]
  59. Kane, Gregory D., Frederick M. Richardson, and Patricia Graybeal. 1996. Recession-induced stress and the prediction of corporate failure. Contemporary Accounting Research 13: 631–50. [Google Scholar] [CrossRef]
  60. Kaufinger, Gregory G., and Chris Neuenschwander. 2020. Retail Apocalypse? Maybe blame accounting. Investigating inventory valuation as a determinant of retail firm failure. American Journal of Business 35. [Google Scholar] [CrossRef]
  61. Khan, Kanwal Iqbal, Faisal Qadeer, Mário Nuno Mata, José Chavaglia Neto, Qurat ul An Sabir, Jéssica Nunes Martins, and José António Filipe. 2021. Core predictors of debt specialization: A new insight to optimal capital structure. Mathematics 9: 975. [Google Scholar] [CrossRef]
  62. Kirkos, Efstathios. 2015. Assessing methodologies for intelligent bankruptcy prediction. Artificial Intelligence Review 43: 83–123. [Google Scholar] [CrossRef]
  63. Klepáč, Václav, and David Hampel. 2018. Predicting bankruptcy of manufacturing companies in EU. Economics and Management 21: 159–174. [Google Scholar] [CrossRef]
  64. Ko, Yu-Chien, Hamido Fujita, and Tianrui Lin. 2017. An evidential analysis of Altman Z-score for financial predictions: Case study on solar energy companies. Applied Soft Computing 52: 748–59. [Google Scholar] [CrossRef]
  65. Kraus, Alan, and Robert H. Litzenberger. 1973. A State-Preference Model of Optimal Financial Leverage. Journal of Finance 28: 911–22. [Google Scholar] [CrossRef]
  66. Lee, Li-Tze, Chiang Ku Fan, Hsiang-Wen Hung, and Yu-Chun Ling. 2010. Analysis of Financial Distress Prediction Models. Journal of Testing and Evaluation 38: 635–40. [Google Scholar]
  67. Lenka, Strýčková. 2017. The relationship between company returns and leverage depending on the business sector: Empirical evidence from the Czech Republic. Journal of Competitiveness 9: 98–110. [Google Scholar]
  68. Lennox, Clive. 1999. Identifying failing companies: A re-evaluation of the logit, probit and DA approaches. Journal of Economics and Business 51: 347–64. [Google Scholar] [CrossRef]
  69. Liang, Deron, Chih-Fong Tsai, An-Jie Dai, and William Eberle. 2018. A novel classifier ensemble approach for financial distress prediction. Knowledge and Information Systems 54: 437–62. [Google Scholar] [CrossRef]
  70. Liang, Deron, Chia-Chi Lu, Chi-Fong Tsai, and G. A. Guan-An Shih. 2016. Financial ratios and corporate governance indicators in bankruptcy prediction: A comprehensive study. European Journal of Operational Research 252: 561–72. [Google Scholar] [CrossRef]
  71. Lin, Fengyi, Deron Liang, and Wing-Sang Chu. 2010. The role of non-financial features related to corporate governance in business crisis prediction. Journal of Marine Science and Technology 18: 4. [Google Scholar] [CrossRef]
  72. Lin, Tzong-Huei. 2009. A cross model study of corporate financial distress prediction in Taiwan: Multiple discriminant analysis, logit, probit and neural networks models. Neurocomputing 72: 3507–16. [Google Scholar] [CrossRef]
  73. Liou, Dah-Kwei. 2007. Macroeconomic Variables and Financial Distress. Journal of Accounting, Business & Management 14. [Google Scholar]
  74. Lisboa, Inês. 2017. Capital structure of exporter SMEs during the financial crisis: Evidence from Portugal. European Journal of Management Studies 22: 25–49. [Google Scholar]
  75. Lo, Andrew W. 1986. Logit versus discriminant analysis: A specification test and application to corporate bankruptcies. Journal of Econometrics 31: 151–78. [Google Scholar] [CrossRef]
  76. Lopes, Fernanda Cristina, and Luciana Carvalho. 2021. Intangible assets and business performance in Latin America. RAUSP Management Journal. Ahead of print. [Google Scholar] [CrossRef]
  77. Lund, Susan, Jonathan Woetzel, Eckart Windhagen, Richard Dobbs, and Diana Goldshtein. 2018. Rising Corporate Debt: Peril or Promise? McKinsey Global Institute Discussion Paper. Available online: https://www.mckinsey.com/business-functions/strategy-and-corporate-finance/our-insights/rising-corporate-debt-peril-or-promise (accessed on 5 September 2021).
  78. Lund, Susan. 2018. Are We in a Corporate Debt Bubble? Project Syndicate. Available online: https://www.project-syndicate.org/commentary/growing-corporate-debt-crisis-risks-by-susan-lund-2018-06 (accessed on 3 August 2021).
  79. Lustig, Nora, and Jorge Mariscal. 2020. 20 How COVID-19 Could Be Like the Global Financial Crisis (or Worse). In Mitigating the COVID Economic Crisis: Act Fast and Do Whatever It Takes. Edited by R. Baldwin and B. Weder di Mauro. London: CEPR Press, pp. 185–90. [Google Scholar]
  80. MacCarthy, James. 2017. Using Altman Z-score and Beneish M-score models to detect financial fraud and corporate failure: A case study of Enron Corporation. International Journal of Finance and Accounting 6: 159–66. [Google Scholar]
  81. Majumdar, Raju. 2014. The determinants of indebtedness of unlisted manufacturing firms in India: A panel data analysis. Management Research Review 37: 833–54. [Google Scholar] [CrossRef] [Green Version]
  82. Malakauskas, Aidas, and Aušrinė Lakštutienė. 2021. Financial Distress Prediction for Small and Medium Enterprises Using Machine Learning Techniques. Engineering Economics 32: 4–14. [Google Scholar] [CrossRef]
  83. Marinakos, Georgios, Sophia Daskalaki, and Theodoros Ntrinias. 2014. Defensive financial decisions support for retailers in Greek pharmaceutical industry. Central European Journal of Operations Research 22: 525–51. [Google Scholar] [CrossRef]
  84. Maripuu, Peeter, and Kadri Männasoo. 2014. Financial distress and cycle-sensitive corporate investments. Baltic Journal of Economics 14: 181–93. [Google Scholar] [CrossRef]
  85. Martin, Daniel. 1997. Early warning of bank failure: A logit regression approach. Journal of Banking & Finance 1: 249–76. [Google Scholar]
  86. McGurr, Paul T., and Sharon A. DeVaney. 1998. Predicting business failure of retail firms: An analysis using mixed industry models. Journal of Business Research 43: 169–76. [Google Scholar] [CrossRef]
  87. Modigliani, Franco, and Merton H. Miller. 1958. The Cost of Capital, Corporation Finance and Theory of Investment. The American Economic Review 48: 261–97. [Google Scholar]
  88. Modigliani, Franco, and Merton H. Miller. 1963. Corporate Income Taxes and the Cost of Capital: A Correction. The American Economic Review 53: 433–43. [Google Scholar]
  89. Mojon, Benoit, Daniel Rees, and C. Christian Schmieder. 2021. How Much Stress Could Covid Put on Corporate Credit? Evidence Using Sectoral Data. Basel: BIS Quarterly Review, March. [Google Scholar]
  90. Mselmi, Nada, Amine Lahiani, and Taher Hamza. 2017. Financial distress prediction: The case of French small and medium-sized firms. International Review of Financial Analysis 50: 67–80. [Google Scholar] [CrossRef]
  91. Nwogugu, Michael. 2007. Decision-making, risk and corporate governance: A critique of methodological issues in bankruptcy/recovery prediction models. Applied Mathematics and Computation 185: 178–96. [Google Scholar] [CrossRef]
  92. Odom, Marcus D., and Ramesh Sharda. 1990. A neural network model for bankruptcy prediction. Paper presented at the 1990 IJCNN International Joint Conference on Neural Networks, San Diego, CA, USA, June 17–21; pp. 163–68. [Google Scholar]
  93. Ohlson, James A. 1980. Financial ratios and the probabilistic prediction of bankruptcy. Journal of Accounting Research 18: 109–31. [Google Scholar] [CrossRef] [Green Version]
  94. Omoshagba, Toyin Praise, and Umaru M. Zubairu. 2018. A Systematic Review of the Field of Debt Financing. Covenant Journal of Entrepreneurship 2: 34–49. [Google Scholar]
  95. Ong, Shuk-Wern, Voon Choong Yap, and Roy W. L. Khong. 2011. Corporate failure prediction: A study of public listed companies in Malaysia. Managerial Finance 91: 114–26. [Google Scholar] [CrossRef]
  96. Opler, Tim C., and Sheridan Titman. 1994. Financial distress and corporate performance. The Journal of Finance 49: 1015–40. [Google Scholar] [CrossRef]
  97. Pacheco, Luis, and Fernando Tavares. 2017. Capital structure determinants of hospitality sector SMEs. Tourism Economics 23: 113–32. [Google Scholar] [CrossRef]
  98. Pálinkó, Éva, and Ágnes Svoób. 2016. Main causes and process of financial distress. Public Finance Quarterly 61: 516. [Google Scholar]
  99. Paul, Pinku. 2021. A Study of Multilayered Profitability Analysis by Using DuPont Model: Evidence from Indian Pharmaceutical Industry. Global Business Review. [Google Scholar] [CrossRef]
  100. Priego-de-la-Cruz, Albá Maria, Esteban Alfaro-Cortés, and Monserrat Manzaneque-Lizano. 2020. Understanding the stakeholders’ role in a business failure situation: An empirical boosting approach. Spanish Accounting Review 23: 113–26. [Google Scholar] [CrossRef]
  101. Proença, Pedro, Raul M. S. Laureano, and Luis M. S. Laureano. 2014. Determinants of capital structure and the 2008 financial crisis: Evidence from Portuguese SMEs. Social Behavioral Sciences 150: 182–91. [Google Scholar] [CrossRef] [Green Version]
  102. Rahman, Mahfuzur, Cheong Li Sa, and Md KaiumMasud. 2021. Predicting Firms’ Financial Distress: An Empirical Analysis Using the F-Score Model. Journal of Risk and Financial Management 14: 199. [Google Scholar] [CrossRef]
  103. Routledge, James, and David Gadenne. 2000. Financial distress, reorganization and corporate performance. Accounting & Finance 40: 233–59. [Google Scholar]
  104. Russ, Robert W., Wendy W. Peffley, and Alfred C. Greenfield. 2004. The Altman Z-Score Revisited. Available online: https://papers.ssrn.com/sol3/papers.cfm?abstract_id=484923 (accessed on 15 July 2021). [CrossRef]
  105. Ruxanda, Gheorghe, Cătălina Zamfir, and Andreea Muraru. 2018. Predicting financial distress for Romanian companies. Technological and Economic Development of Economy 24: 2318–37. [Google Scholar] [CrossRef] [Green Version]
  106. Scalzer, Rodrigo S., A. Rodrigues, M. Á. D. S. Macedo, and P. Wanke. 2019. Financial distress in electricity distributors from the perspective of Brazilian regulation. Energy Policy 125: 250–59. [Google Scholar] [CrossRef]
  107. Sehgal, Sanjay, R. K. Mishra, F. Deisting, and R. Vashisht. 2021. On the determinants and prediction of corporate financial distress in India. Managerial Finance 47: 1428–47. [Google Scholar] [CrossRef]
  108. Serrano-Cinca, Carlos. 1996. Self organizing neural networks for financial diagnosis. Decision Support Systems 17: 227–38. [Google Scholar] [CrossRef]
  109. Shetty, Shilpa H., and Theresa Nithila Vincent. 2021. Corporate Default Prediction Model: Evidence from the Indian Industrial Sector. Vision, 1–17. [Google Scholar] [CrossRef]
  110. Silva, Marta, Luis Gomes, and Isabel Cristina Lopes. 2020. Explanatory factors of the capital structure. Emerging Science Journal 4: 519–29. [Google Scholar] [CrossRef]
  111. Soliman, Mark T. 2008. The use of DuPont analysis by market participants. The Accounting Review 83: 823–53. [Google Scholar] [CrossRef]
  112. Staňková, Michaela, and David Hampel. 2018. Bankruptcy prediction of engineering companies in the EU using classification methods. Acta Universitatis Agriculturae et Silviculturae Mendelianae Brunensis 66: 1347–56. [Google Scholar] [CrossRef] [Green Version]
  113. Succurro, Marianna. 2017. Financial bankruptcy across European countries. International Journal of Economics and Finance 9: 132–46. [Google Scholar] [CrossRef] [Green Version]
  114. Titman, Sheridan, and Sergey Tsyplakov. 2007. A dynamic model of optimal capital structure. Review of Finance 11: 401–51. [Google Scholar] [CrossRef]
  115. Tomas Žiković, Ivana. 2018. Challenges in Predicting Financial Distress in Emerging Economies: The Case of Croatia. Eastern European Economics 56: 1–27. [Google Scholar] [CrossRef]
  116. Utami, Devi Wahyu, Heni Hirawati, and Axel Giovanni. 2020. Capital Structure and Financial Distress: Empirical Study of Companies in the Mining Sector and the Infrastructure, Utilities & Transportation Sector. Journal of Research in Business, Economics, and Education 2: 1370–80. [Google Scholar]
  117. Vakhitova, R. Z., N. G. Vishnevskaya, and O. V. Aleshkina. 2018. Modeling the Impact of Enterprise Bankruptcy on Unemployment Rate. In The International Science and Technology Conference “FarEastCon”. Cham: Springer, pp. 340–48. [Google Scholar]
  118. Valencia, Carlos, Sergio Cabrales, Laura Garcia, Juan Ramirez, and Diego Calderona. 2019. Generalized additive model with embedded variable selection for bankruptcy prediction: Prediction versus interpretation. Cogent Economics & Finance 7: 1597956. [Google Scholar]
  119. Vieira, Armando S., João Duarte, Bernadete Ribeiro, and João C. Neves. 2009. Accurate prediction of financial distress of companies with machine learning algorithms. Paper presented at the International Conference on Adaptive and Natural Computing Algorithms, Kuopio, Finland, April 23–25; Berlin and Heidelberg: Springer, pp. 569–76. [Google Scholar]
  120. Wu, Yuanbo, Clive Gaunt, and Steven Gray. 2010. A Comparison of Alternative Bankruptcy Prediction Models. Journal of Contemporary Accounting & Economics 6: 34–45. [Google Scholar]
  121. Yazdanfar, Darush, and Peter Öhman. 2015. Debt financing and firm performance: An empirical study based on Swedish data. The Journal of Risk Finance 16: 102–18. [Google Scholar] [CrossRef]
  122. Yim, Juliana, and Heather Mitchell. 2003. A comparison of corporate failure models in Australia: Hybrid neural networks, logit models and discriminant analysis. Paper presented at the International Conference on Industrial, Engineering and Other Applications of Applied Intelligent Systems, Kuala Lumpur, Malaysia, July 26–29; Berlin and Heidelberg: Springer, pp. 348–58. [Google Scholar]
  123. Zavgren, Christine V. 1985. Assessing the vulnerability to failure of American industrial firms: A logistic analysis. Journal of Business Finance & Accounting 12: 19–45. [Google Scholar]
Figure 1. Solvency risk by country, full period—all risk categories. Source: authors’ calculations and representation.
Jrfm 14 00536 g001
Figure 2. Solvency risk by country, 2011–2019. Source: authors’ calculations and representations.
Jrfm 14 00536 g002
Figure 3. Predictor importance, entire period, and three sub-periods. Source: STATISTICA output and authors’ representation.
Jrfm 14 00536 g003
Figure 4. Gains charts for solvency risk categories, 2011–2019. Note: the blue line in the graphs shows the baseline result—the classification obtained by chance—and the red line shows the performance of our model. Source: STATISTICA output.
Jrfm 14 00536 g004
Table 1. Financial indicators used in analysis—brief description.
IndicatorsCalculationExplanation Calculation
Performance area: solvency—debt share in total company financing
Debt-to-equity ratio (TD/SF) T D / S F = T o t a l   d e b t S h a r e h o l d e r s f u n d s A higher value designates higher solvency risk.Authors’ calculations based on Orbis data for total debt and shareholder funds (an approximation of how much the shareholders would receive if a business were to liquidate, which includes common and preferred stock, retained earnings, and treasury stock accounts).
Performance area: liquidity—ability to pay for short-term obligations, as they become due
Current ratio (CR) C R = C u r r e n t   a s s e t s C u r r e n t   l i a b i l i t i e s The company is in a better position to pay its short-term obligations when the CR and NWC/turn are higher.Authors’ calculations based on Orbis data for current assets, current liabilities, and turnover.
Net working capital share in turnover (NWC/turn) N W C T u r n = C u r r e n t   a s s e t s C u r r e n t   l i a b i l i t i e s T u r n o v e r
Performance area: efficiency—ability to generate sales and turnover from the assets used by the company
Total assets turnover (TAT) T A T = T u r n o v e r T o t a l   a s s e t s A higher value for TAT means that the company generates more sales from the total assets it uses.Authors’ calculations based on Orbis data for turnover and total assets.
Average collection period (CollP) C o l l P = A v e r a g e   a c c o u n t s   r e c e i v a b l e S a l e s A lower value means that customers pay over shorter periods; thus, lowering the asset use efficiency.Available directly on Orbis database.
Performance area: Profitability—business ability to manage costs and generate profits
EBIT (Earnings before Interest and Taxes) margin (EBITmg) E B I T m g = E B I T T u r n o v e r A higher value indicates better operational profitability before the payment of financial obligations and taxes.Authors’ calculations based on Orbis data for EBIT and turnover.
Net profit margin (NP/OpRevmg) N P / O p R e v m g = N e t   p r o f i t O p e r a t i n g   r e v e n u e A higher value indicates better operational profitability on a net basis (after the payment of financial obligations and taxes).Authors’ calculations based on Orbis data for net profit and operating revenues.
Return on assets (ROA) R O A = P r o f i t T o t a l   a s s e t s = P r o f i t T u r n o v e r × T u r n o v e r T o t a l   a s s e t s A higher value shows a better operational performance based on the profit obtained when using all the assets of the firm.Available directly on Orbis database as ROA before tax.
Return on equity (ROE) R O E = P r o f i t E q u i t y = R O A × T o t a l   a s s e t s E q u i t y A higher value means higher returns available to shareholders.Available directly on Orbis database as ROE before tax.
Source: authors’ compilation.
Table 2. Descriptive statistics of TD/SF, full sample, and categories, 2011–2019.
Number of CompaniesMeanMedianMinimumMaximumLower QuartileUpper QuartileStandard Deviation
2011–2019
Full sample45961.9121.2810.10314.2020.6922.3631.919
High solvency risk15323.9023.0981.90914.2022.3634.7232.157
Medium solvency risk15321.3191.2810.8651.9081.0591.5660.298
Low solvency risk15320.5160.5240.1030.8640.3400.6920.206
2011–2013
Full sample45962.8551.5380.025208.2050.8003.1505.280
High solvency risk15325.8734.0330.054208.2052.6236.7328.102
Medium solvency risk15321.9421.5130.02521.1531.1332.0811.784
Low solvency risk15320.7480.6260.02710.6700.3960.8770.683
2014–2016
Full sample45961.9751.2410.05336.4520.6572.3292.395
High solvency risk15324.1763.1331.86636.4522.3294.8733.083
Medium solvency risk15321.2671.2410.8151.8641.0031.5160.296
Low solvency risk15320.4830.4900.0530.8150.3140.6570.200
2017–2019
Full sample45961.8931.1420.02563.3530.6012.2112.899
High solvency risk15324.0612.9461.74063.3532.2114.3904.217
Medium solvency risk15321.1771.1420.7571.7360.9261.4090.283
Low solvency risk15320.4400.4430.0250.7560.2870.6010.185
Note: means are statistically significantly different between categories of solvency risk for all periods (ANOVA). Source: authors’ calculations.
Table 3. Descriptive statistics of TD/SF based on 2011–2019 trend and solvency risk categories.
TrendSolvency RiskNumber of CompaniesTD/SF MeanMinimumMaximumStandard DeviationLower QuartileMedianUpper Quartile
UPWARDHigh10383.8761.90914.2022.1122.3543.0794.776
Medium10151.3140.8651.9080.2991.0521.2761.563
Low10460.5190.1030.8640.2060.3400.5300.696
Total3099
DOWNWARDHigh4943.9591.91014.0712.2492.3893.1224.662
Medium5171.3280.8661.9080.2971.0881.2961.567
Low4860.5080.1050.8630.2080.3380.5100.684
Total1497
Note: Means are statistically significantly different between trend directions and categories of solvency risk for all periods (ANOVA). Source: authors’ calculations.
Table 4. Dynamics of solvency risk, 2011–2013 (number of companies).
First Sub-Period
2011–2013
Second Sub-Period
2014–2016
Third Sub-Period: 2017–2019
HighMediumLow
High
1532
High—115188324325
Medium—3347519366
Low—4711432
Total959450123
Medium
1532 companies
High—3282338411
Medium—918193565160
Low—2861671199
Total442720370
Low
1532 companies
High—5333182
Medium—2805516362
Low—119943181975
Total1313621039
Note: figures represent the number of companies. The table should be read as follows: of the 1532 companies with high solvency risk in the first sub-period, 1151 were also in the high solvency risk category in the second category, of which, 883 remained in this category in the third sub-period. Source: authors’ calculations.
Table 5. Liquidity, profitability, efficiency, and aggregate performance indicators, full sample, 2011–2019.
Performance AreaIndicatorMeanMedianMinimumMaximumLower QuartileUpper QuartileStandard Deviation
LiquidityCR Median1.5451.2710.3768.6900.9861.7210.994
CR—SD1.0670.2710.016953.2450.1550.51418.115
CR Trend−0.062−0.019−190.85044.389−0.0810.0242.956
NWC/S Median0.0410.027−0.1820.526−0.0020.0680.077
NWC/S SD0.1020.0260.001106.0050.0160.0451.983
NWC/SD Trend−0.001−0.002−21.59716.217−0.0080.0030.445
EfficiencyTAT Median4.2763.9770.42810.1962.8475.5171.907
TAT SD0.7690.5830.03711.2200.3350.9900.684
TAT Trend0.0270.018−2.5392.319−0.0860.1400.258
CollP Median5.3312.0390.00074.4450.8875.2789.097
CollP SD3.0570.9350.000220.9000.3612.6888.111
CollP Trend0.0000.006−46.27056.106−0.1190.1622.001
ProfitabilityEBITmg Median2.4782.014−2.09413.6610.9433.5392.150
EBIT mg SD2.5031.1380.0431134.2530.7361.91321.087
EBIT mg Trend−0.075−0.027−329.253103.766−0.2330.1475.481
NP/OpRevmg Median1.9441.569−1.90711.9150.7062.7721.753
NP/OpRevmg SD1.9680.9490.000890.2870.5791.62117.008
NP/OpRevmg Trend−0.115−0.049−254.464109.888−0.2220.0764.312
Aggregate performanceROA Median9.6837.665−14.91067.0372.94413.8219.155
ROA SD6.0825.0100.10340.5552.9927.8904.456
ROA Trend−0.244−0.131−12.7347.670−0.9790.5851.665
ROE Median25.02418.709−128.342420.4587.69134.75426.142
ROE SD20.84412.7530.115387.2446.51523.86630.333
ROE Trend0.1850.091−89.458117.105−1.6622.2367.253
Note: more detailed results by country and sub-periods are available from the authors. Source: authors’ calculations.
Table 6. Risk estimates for random forest models.
2011–20192011–20132014–20162017–2019
SamplesRisk
Estimate
Standard ErrorRisk
Estimate
Standard ErrorRisk
Estimate
Standard ErrorRisk
Estimate
Standard Error
Train0.3120.0080.3490.0080.3260.0080.3190.008
Test0.3480.0130.4140.0130.3760.0130.3610.013
Source: STATISTICA output and authors’ calculations.
Table 7. Classification matrix, all periods and firms.
Solvency Risk CategoryOBSERVED Cases (Firms)Predicted Solvency Risk
2011–20192011–20132014–20162017–2019
HighMedium LowHighMedium LowHighMedium Low HighMedium Low
High 15321121352591055349128110934578111236060%
73.17%22.98%3.85%68.86%22.78%8.36%72.39%22.52%5.09%72.58%23.50%3.92%
Medium 1532385924223412827293386883263382943207
25.13%60.31%14.56%26.89%53.98%19.13%25.20%57.64%17.17%24.93%61.55%13.51%
Low153210336410651503631019974001035903931049
6.72%23.76%69.52%9.79%23.69%66.51%6.33%26.11%67.56%5.87%25.65%68.47%
All4596160916401347161715391440159216281376158416961316
35.01%35.68%29.31%35.18%33.49%31.33%34.64%35.42%29.94%34.46%36.90%28.63%
Source: STATISTICA output and authors’ calculations.
Publisher’s Note: MDPI stays neutral with regard to jurisdictional claims in published maps and institutional affiliations.

