

The Effect of Religion in European Financial Statement Disclosures: A Real Earnings’ Management Case

1
Department of Agribusiness and Supply Chain Management, School of Applied Economics and Social Sciences, Agricultural University of Athens, 32200 Theves, Greece
2
Amsterdam Business School, University of Amsterdam, 1012 WP Amsterdam, The Netherlands
*
Author to whom correspondence should be addressed.
J. Risk Financial Manag. 2023, 16(11), 464; https://doi.org/10.3390/jrfm16110464
Submission received: 16 August 2023
/
Revised: 17 October 2023
/
Accepted: 18 October 2023
/
Published: 24 October 2023
(This article belongs to the Special Issue Global Trends and Challenges in Economics and Finance)
Abstract
:Prior research has extensively examined the relationship between religion and accrual-based earnings management. However, there is currently little research on the relationship between religion and real (non-accrual) earnings management, especially in Europe. This paper aims to fill this research gap and examines whether and how the effect of religion could be linked with firms’ real earnings management activities. Four hypotheses are developed and tested, with our results providing indications that the degree of overall religiosity is negatively and significantly associated with real earnings management. Furthermore, when investigating the effects of different religions in Europe, Christianity and Islam have the opposite impact on firms’ real earnings management activities. Overall, our paper indicates that in European countries, the religious environment can mitigate firms’ manipulations on earnings.
1. Introduction
The objective of this paper is to provide empirical evidence regarding the relationship between religion and real earnings management in the context of EU member states. Hofstede (1980, 2001) pioneeringly examined the bond between social and cultural dimensions. As a critical part of the culture, religion could be given particular attention. Previous literature has confirmed that religion could impact company activities (Kanagaretnam et al. 2015). In this context, in the past few decades, real earnings management has become one of the most provocative topics in accounting literature. Researchers have investigated the determinants of business ethics that could mitigate accrual-based earnings management in companies (Elias 2002; McGuire et al. 2012; Mukhibad and Nurkhin 2019). However, there is little research examining this theme in Europe. In addition, Du et al. (2015) call for a research focus on the asymmetric influence of different religions on earnings management.
Researchers have studied the association between religion and corporate social responsibility (CSR), accounting irregularity, the cost of equity, equity structure, auditor going-concern opinions, and other themes (Brammer et al. 2007; McGuire et al. 2012; El Ghoul et al. 2012; Baxamusa and Jalal 2016; Omer et al. 2018). Two mechanisms can be highlighted through which religion may influence firms’ activities and characteristics. The first works through the effect of social norms; religiosity is an example of such a mean. Individuals are inclined to behave in ways that follow the common norms of adhering groups (Kohlberg 1984). Therefore, religion could help regulate the behaviors of its adherents and thus shape up common rules in a local society. McGuire et al. (2012) indicate that religious social norms work as an external monitoring mechanism and could mitigate the financial reporting irregularities of local firms as being unethical. The second one works through risk aversion. Considering that an important reason for the existence of religion is that people expect certainty in life, it could be inferred that religious people have a lower risk tolerance than non-religious people. Accounting and finance studies link religion and corporations with this risk-aversion trait. Relevant research indicates that firms located in areas with higher religiosity are less likely to engage in inappropriate activities such as tax avoidance and high-risk investments (Grullon et al. 2010; Kumar et al. 2011; Dyreng et al. 2012; Baxamusa and Jalal 2016).
Earnings management originates from the discretion and flexibility of managers when making operating decisions. Compensation incentives can drive managers to manipulate earnings. After the introduction of the Sarbanes-Oxley Act, accrual earnings management decreased sharply and real earnings management increased severely (Gunny 2010). This implies that identifying and measuring real earnings management in current capital markets could help upgrade regulatory policies and protect shareholders’ interests. When researchers associate religion with earnings management, they provide different, or even contradictory results. For instance, using a cross-country dataset, Callen et al. (2011) find that there is no significant association between religion and earnings management. Grullon et al. (2010) and Dyreng et al. (2012), on the other hand, indicate that religious social norms can affect managers’ choices of earnings management. By studying the sample of American firms, McGuire et al. (2012) find the degree of religiosity is negatively associated with accrual-based earnings management, while there is a positive association between religiosity and real earnings management. Other related studies examining a similar question mainly test the religious effect on accrual earnings management. Their results indicate that religion could mitigate firms’ manipulation activities on earnings. Nevertheless, very few studies focus on real earnings management. Therefore, we argue it would be necessary to further examine the association between religion and real earnings management (Cohen et al. 2008). Real earnings management is an area worthwhile for further research since it has direct implications for the well-functioning of firms and the overall economy. The practice of real earnings management may mislead investors (Healy and Wahlen 1999), and lead to adverse selection problems. Moreover, managers may engage in real earnings management to cater for their own personal interests. Managers, whose compensation is linked to earnings targets and/or is concerned with short-term analyst forecasts, may engage in real earnings management. Such behavior often comes in the form of reduced R&D expenses to inflate earnings, collect earnings-linked bonuses, and gain a good reputation (Christopoulos et al. 2014; Dobbin and Jung 2010; Marrakchi Chtourou et al. 2001; Burgstahler and Dichev 1997; Graham et al. 2005; Bartov et al. 2002). However, this is likely to impede innovation, which is a crucial factor for economic growth and society’s prosperity. Therefore, a deeper understanding of the factors that affect real earnings management seems like a worthwhile endeavor.
To bridge this gap, our paper uses religious data of EU member states collected from the Pew Research Center’s Religion and Public Life Project and from the WRDS (Compustat Global dataset). The total number of observations is 20,038 from 2010 to 2020. Including firm-specific and country-specific control variables, such as the leverage ratio of firms and national GDP, four models are developed to test the potential relationship between religion and real earnings management. Our results indicate that the degree of religiosity in a country can mitigate firms’ real earnings management, which is indeed unaffected by the proxies used. We find a positive and significant association between Islam and real earnings management, compared to a negative association with Christianity.
In our view, our paper contributes in three ways to existing literature1. Firstly, we enrich the corporate governance literature through our probing of real earnings management, and we provide further empirical evidence on the effect of religion on corporate activities. Secondly, this paper extends the existing literature by testing a European firm sample, considering that other similar investigations focus on the U.S. and China. Thirdly, we distinguish between the different effects of religions on real earnings management. Specifically, test results of models 3 and 4 indicate that Christianity and Islam have potentially opposite effects on real earnings management. Future research may further study the competitive impacts of religions on accrual and non-accrual earnings management and/or the influence of CEOs’ beliefs on earnings management (Du et al. 2015).
The remainder of this paper is structured as follows. In the next section, the literature regarding religion in Europe and earnings management, including real earnings management, is discussed. Four hypotheses are formulated, and our expectations for the test results are provided. Then, our research approach is discussed, including our sample selection, data processing, and regression models. Our results are presented and discussed, and then we close with our conclusions.
2. Literature Review and Hypotheses Development
2.1. Religion and Religiosity
2.1.1. Religion in Europe
Even though the trail of religion can be traced back to primitive society, the concept of “religion” emerged in the 16th and 17th centuries. Developing with the process of human history, religion has become a social-cultural system, which contains a wide range of factors that closely relate to human society, such as moral standards, worldviews, texts, and organization. Around the world, religious people account for about 84% of the total population. The majority of them are affiliated with Christianity, Islam, Hinduism, and Buddhism. In Europe, the three major religious trends involve Christianity (including the Catholic Church, Protestantism, and Orthodoxy), Islam, and unaffiliated.
Christianity is based on the teachings of Jesus of Nazareth, and confessions and salvation are among its main cores. Till now, Christianity has been the largest and most influential religion in Europe. Islam is a typical monotheistic religion that regards the Quran as its primary sacred scripture. Except from geography, recent migration prompts the concentration of Muslims in the Southeastern part of Europe as well as the formation of Muslim communities in Western Europe. For unaffiliated groups, many social surveys, such as the Eurobarometer, have indicated the ratio of non-believers to be increasing across European countries. Bruce (2002) sums up that: “… individualism, diversity, and egalitarianism in the context of liberal democracy undermine the authority of religious beliefs”. The spread of secularization facilitates changes in religious populations to some extent.
2.1.2. Social Norm
Social norm theory can explain the influence of religion on the behaviors of individuals and organizations. According to this theory, individuals tend to behave in ways that abide by the common norms of their adhering groups (Kohlberg 1984). Since social norms are the informal rules that stem from interactions among groups and societies, local religious norms reflect a significant part of social norms. Stavrova et al. (2013) argue that religiosity is an example of such a social norm.
Religion has two basic traits: cultural attributes and institutional ones (Stark and Finke 2000). The former provide the general compliance outline for humans to pursue values, while the latter fill the outline with many concrete details and form implicit, informal, and normative mechanisms. On the one hand, religions resort to doctrines, ethics, and morality to shape people’s individual values and beliefs. For example, both Christianity and Islam promote trust in interpersonal relationships and condemn fraud. Thus, religions help to form traditional informal standards and regulate the behaviors of people who live in a particular locality. Consequently, it can be predicted that whether managers are religious or not, they would be affected by religious social norms in the local geographic areas where they live or work because these norms are environmental elements that have existed for a long time and even been rooted in the local culture (Kohlberg 1984; Cialdini and Goldstein 2004).
The influence of religion on human behavior and economic activities can be traced to Adam Smith’s “The Wealth of Nations”. Guiso et al. (2003) find that religious people trust the government and the legal system more, are less willing to break the law, and are more likely to believe that market outcomes are fair. Choi (2010) predicts that religious affiliation can influence individual switching tendencies through religious doctrines and then studies the impact that religion exerts on consumer switching behavior. McGuire et al. (2012) indicate religious social norms work as an external monitoring mechanism that can mitigate the accounting manipulation of firms in a local geographic area. In this paper, the religious social norms are mainly associated with business ethics appealed by religiosity. Specifically, if managers misreport or manipulate the financial results, such decisions will be considered unethical. Dyreng et al. (2012) list two traits of religious individuals: honesty and risk aversion. By investigating whether religion is associated with accrual choices managers make when disclosing financial information, they find that companies located in areas with a higher level of religious adherence are less likely to restate annual financial results and this has a potential relationship with reminders of moral codes of conduct in these localities. Ma et al. (2020) hold that ethical norms related to religiosity could drive companies to focus on long-term firm value and to be conscious of shareholder interests. In this case, firms’ adoption of accounting conservatism is positively associated with the level of religiosity in the geographic areas within which they are based and function.
2.1.3. Risk Aversion
Risk aversion is another path that many accounting and finance scholars have followed. Christianity, the largest religion in Europe, guides its followers to believe in and accept the death and resurrection of Jesus, and with confessions and living a Christian life, sinful people can be reconciled with God and thus offered salvation. Believing that humans will experience divine judgment at the end of their lives and then receive salvation or damnation, Christians are less likely to do things that will or might break Christian rules and disciplines, considering potential religious punishment. Islamism also constrains its adherents’ daily behaviors. Following the guidance of the Quran and Allah, adherents practice the Five Pillars of Islam in every aspect of their lives and society. In financial affairs, because of the promotion of fairness, Shariah regards interest as a form of exploitation, and Islamic banks are prohibited from receiving interest in any business transaction. Usury is strictly forbidden in Islam, which represents disproportionate risk-taking among participants. Prior research has shown that both implicit and explicit moral ethics and behavioral norms brought by religion increase the tendency of uncertainty avoidance in society (Miller and Hoffmann 1995), and that makes religious persons entertain lower risk tolerance than non-religious people. In addition, the expectation of certainty is an important reason for people to believe in religion. It is reasonable to link risk aversion to local religiosity.
Prior research has connected organizations, individuals, and religion with risk aversion, and religious traditions can lead to decision makers’ cognitive bias toward risk aversion. Hilary and Hui (2009) directly study how religiosity influences organizational behavior and find that US companies located in a more religious country exhibit lower risk exposure, as measured by a lower variance in ROA and equity returns. According to the findings of Grullon et al. (2010), religiosity has a substantial deterrent impact on inappropriate conduct by local-headquartered firm managers. Kumar et al. (2011) investigate the influence of religion-induced gambling norms on market outcomes. This paper distinguishes between the different attitudes of the Protestant and Catholic churches toward gambling. Protestants are more likely to view gambling as a sinful activity, while the Roman Catholic Church does not react that severely and maintains a tolerant attitude to some extent. The results can again be juxtaposed to reflect the effects of risk aversion from religion in capital markets. Dyreng et al. (2012) find companies in religiously conservative regions to be less likely to partake in tax avoidance and to be more open about negative news in voluntary disclosures. Adhikari and Agrawal (2016) use four methods to measure bank risks in different American counties and reveal that banks surrounded by a higher level of local religiosity take less risk. For example, these banks hold safer assets and provide fewer risk incentives to their employees and executives. Baxamusa and Jalal (2016) study CEOs’ religious affiliations and three sets of decisions in companies (capital structure, diversification, and investments) and argue that CEOs with different religious affiliations demonstrate different risk appetites when making decisions (e.g., R&D investment). Aibibula et al. (2017) also find a negative association between the religious beliefs of entrepreneurs and R&D investments due to risk aversion.
Another branch of the literature represented by Miller (2000) concludes that Western religious adherents are more risk-averse than Eastern religious adherents. This difference can explain, to some extent, the mixed findings in previous studies about religious influence and believers’ tendencies towards risk.
2.2. Earnings Management
2.2.1. Background Information on Earnings Management
The study of earnings management emerged in the 1980s. The extensive use of earnings management in financial statement disclosures has increasingly drawn the attention of regulators and academics. Although there may be a lack of agreement on the exact definition of earnings management, it cannot be neglected that earnings management has been one of the most provocative topics in accounting research. Taking the position of accounting policymakers, Healy and Wahlen (1999) define earnings management as “managers’ use of judgment in financial reporting and in structuring transactions to alter financial reports to either mislead some stakeholders about the underlying economic performance of a firm or to affect contractual outcomes that depend on reported accounting numbers”.
There are many motivations that can lead to earnings management. Demand for financing with a relatively low cost of capital is one of the primary drivers. As a result, companies may adopt aggressive accounting policies that lead to frequent accounting restatements (Richardson et al. 2003). In addition, according to contracting theory, compensation plan incentives can drive managers to manipulate earnings and increase private gains. Although stock options could align management interests with shareholders’ and reduce agency costs, they could also incentivize managers to take improper actions to increase earnings numbers (Christopoulos et al. 2014; Dobbin and Jung 2010). Marrakchi Chtourou et al. (2001) indicate the association between short-term stock options held by non-executive committee members and income-increasing earnings management. A further motivation involves “beating benchmarks’’ by avoiding losses and surpassing analyst forecasts (Burgstahler and Dichev 1997). Among the additional motivations are included the maintenance of firm reputation; smoothing earnings; avoidance of lawsuits; and others (Graham et al. 2005; Bartov et al. 2002).
2.2.2. Measurement of Earnings Management
Earnings manipulation can be achieved through two main means: (1) accrual-based earnings management and (2) real earnings management. In the former, managers use their discretion in applying accounting policies or making accounting estimations to adjust companies’ financial disclosures. Accrual-based earnings management is easily achieved in looser regulatory environments and/or where incomplete accounting reporting standards are in effect (e.g., Dechow et al. 1995; Jones 1991). Real earnings management emerged much later as a research focus and is regarded as an alternative to accrual-based exploitations. It involves manipulations in real firm activities, and management of earnings in this case is more variant and undetectable (e.g., Dechow and Sloan 1991; Gunny 2010; Roychowdhury 2006). Previous research has examined three forms of real earnings management: the reduction in discretionary costs such as research and development (R&D) expenditures and training costs; the expansion of production in order to reduce unit costs; and the acceleration of sales or the selling of assets of the company.
For the measurement of accrual-based earnings management, the Jones and modified Jones models have been widely used (Jones 1991; Dechow et al. 1995), whereas for the measurement of real earnings management, two estimations are often applied in the literature: the aggregation of abnormal discretionary expenses and abnormal production costs and the aggregation of abnormal cash flows and abnormal discretionary expenses. Since Roychowdhury (2006) built up an approach to measure real earnings management with abnormal cash flows, abnormal production costs, and abnormal discretionary expenses, many other studies have employed the same model to derive real earnings management data. As managers regard real earnings management as a more ethical and less risky option (Bruns and Merchant 1990; Graham et al. 2005), in this paper, we chose real earnings management as our primary dependent variable based on the Roychowdhury (2006) approach.
2.2.3. Prior Research on Real Earnings Management
Gunny (2010) shows that before the Sarbanes-Oxley Act, firm management mainly used accrual manipulations, but after the Act, this behavior totally changed, with accrual earnings management dropping sharply while real earnings management rose drastically. This implies that external legal factors could have significantly influenced the choices of earnings management in a company. Leuz et al. (2003) use firm-level data from 31 countries and find that outside investor rights and legal enforcement can negatively influence the intensity of earnings management. Following the Hofstede (1980) proxies, Guan et al. (2006) provide evidence for the negative relationship between earnings management and uncertainty avoidance. Callen et al. (2011) research culture and earnings management and find that the cultural metrics of individualism are significantly negatively related to earnings management. Business ethics is another channel that may restrict earnings management. By investigating Islamic banks, Quttainah et al. (2013) show a negative relationship between Islamic banks and earnings management, probably due to the religious-based system of business ethics.
Internal corporate governance could also impact managers’ real earnings manipulations. Bushee (1998) finds that institutional investors would exert a restrictive effect on the intensity of real earnings management in firms. Cheng (2004) shows that the compensation committee could detect real earnings management and make related adjustments to react, such as adjusting compensation payoffs. Garcia Osma (2008) indicates that the proportion of independent directors on the board of directors is positively related to earnings management.
Presented in financial statement disclosures, real earnings management can be captured through changes in certain accounting items. For example, a firm’s R&D capitalization policy is manipulable to some extent since the management can decide the moment of R&D expenditure capitalization (Skordoulis et al. 2020; Prencipe et al. 2008). By using such discretion, the management can, therefore, “create” significant economic benefits in financial statements (Chambers et al. 2002). Markarian et al. (2008) study Italian family firms and find that these firms smooth their earnings by capitalizing their R&D expenditures. Focusing on French companies as samples, Cazavan-Jeny et al. (2011) found that small and highly indebted companies are more likely to use R&D capitalization policies to manage their earnings.
2.3. Religion and Earnings Management
As discussed, religion works on individuals and organizations through social norms and risk aversion. As a result, firms located in regions with a high level of religiosity present characteristics, such as an unwillingness to break rules and a conservatism in investment decisions and could be reluctant to engage in accrual-based and/or real earnings’ manipulations.
Prior studies have explored the association between religion/religiosity and earnings management, with different associations for accrual-based and real earnings manipulations. Callen et al. (2011) use a cross-country data set to investigate whether culture and religion can reduce the management of earnings. Their results provide evidence that, after controlling for the influence of different cultural characteristics (Hofstede 1980, 2001), religious affiliations and the degree of religiosity have no significant relationship with earnings manipulations. McGuire et al. (2012) take U.S. firms as their study focus to investigate the impact of religion on financial reporting irregularities and the methods managers would choose to do so. In their findings, there is a negative association between religiosity and abnormal accruals, a proxy for accruals management, and a positive relation between religiosity and measures of real earnings manipulations. Grullon et al. (2010) and Dyreng et al. (2012) test the link between religion and earnings management, and their findings also indicate that religious social norms can influence managers’ methods of earnings management. Du et al. (2015) adopt geographic measures of religious variables to examine how religion influences firms’ earnings manipulations in the Chinese market. Their results indicate a significant negative association exists due to the curbing of unethical corporate behaviors. In addition, regulatory intensity variables are tested, and the results suggest religion acting as an informal regulatory mechanism. Kanagaretnam et al. (2015) employ a country-level measure of religiosity to study religion and banks from an international sample. The tests employed show the aggregate measure of religiosity to be negatively related to income-increasing earnings management and less opportunistic behavior.
Following this review of the literature we formulate our first hypothesis as:
Hypothesis 1 (H1).
Firms headquartered in EU countries with a strong religious atmosphere are less likely to engage in real earnings management.
In this hypothesis, our estimation of real earnings management follows the seminal work of Roychowdhury (2006).
2.4. Religion and R&D Investment
Research has also confirmed that managers exercise discretion and manage earnings in a variety of ways, ranging from cutting expenditures or carrying out special transactions (so-called real earnings management) to manipulating accounting earnings.
Reducing investment in research and development (R&D) is a typical method of real earnings management so that current performance meets desired thresholds (Dechow and Sloan 1991; Wang and D’Souza 2006; Prencipe et al. 2008; Garcia Osma 2008). According to the imprinting theory (Marquis and Tilcsik 2013), cultural factors in an area can form a distinct “imprint” that continually affects the local economy and business activities.
Choi (2020) investigates the linkage between national culture and R&D investment. By using data for 12,362 firms from 40 countries, the author finds that in cultures with more individualistic, less masculine, and more indulgent features, firms tend to make more R&D investments.
Yan et al. (2021) use a nationwide survey with Chinese private firms to examine the effect of Confucian culture on corporate R&D. Their findings indicate that firms headquartered in provinces with stronger Confucian cultures are more likely to invest in corporate R&D and increase related expenditures. Du (2021) examines whether adherents of all religions in China are risk-averse and whether followers of different religions show equally risk-averse appetites. The findings of this study also suggest that religions can significantly and negatively affect corporate R&D, and Western religious beliefs have a more pronounced negative influence. Following this logic, we predict that there is a similar association between religions and corporate R&D expenditure in Europe.
Thus, our remaining hypotheses are formulated as follow:
Hypothesis 2 (H2).
Firms headquartered in EU countries with a strong religious atmosphere are less likely to engage in R&D investment.
Whereby we specifically use R&D expenditure as a proxy for real earnings management.
Hypothesis 3 (H3).
The prevalence of Christianity in a country can negatively affect firms’ real earnings management.
Hypothesis 4 (H4).
The prevalence of Islam in a country can negatively affect firms’ real earnings management.
In Hypotheses 3 and 4 we aim to study whether different religions in EU countries have different influences on firms.
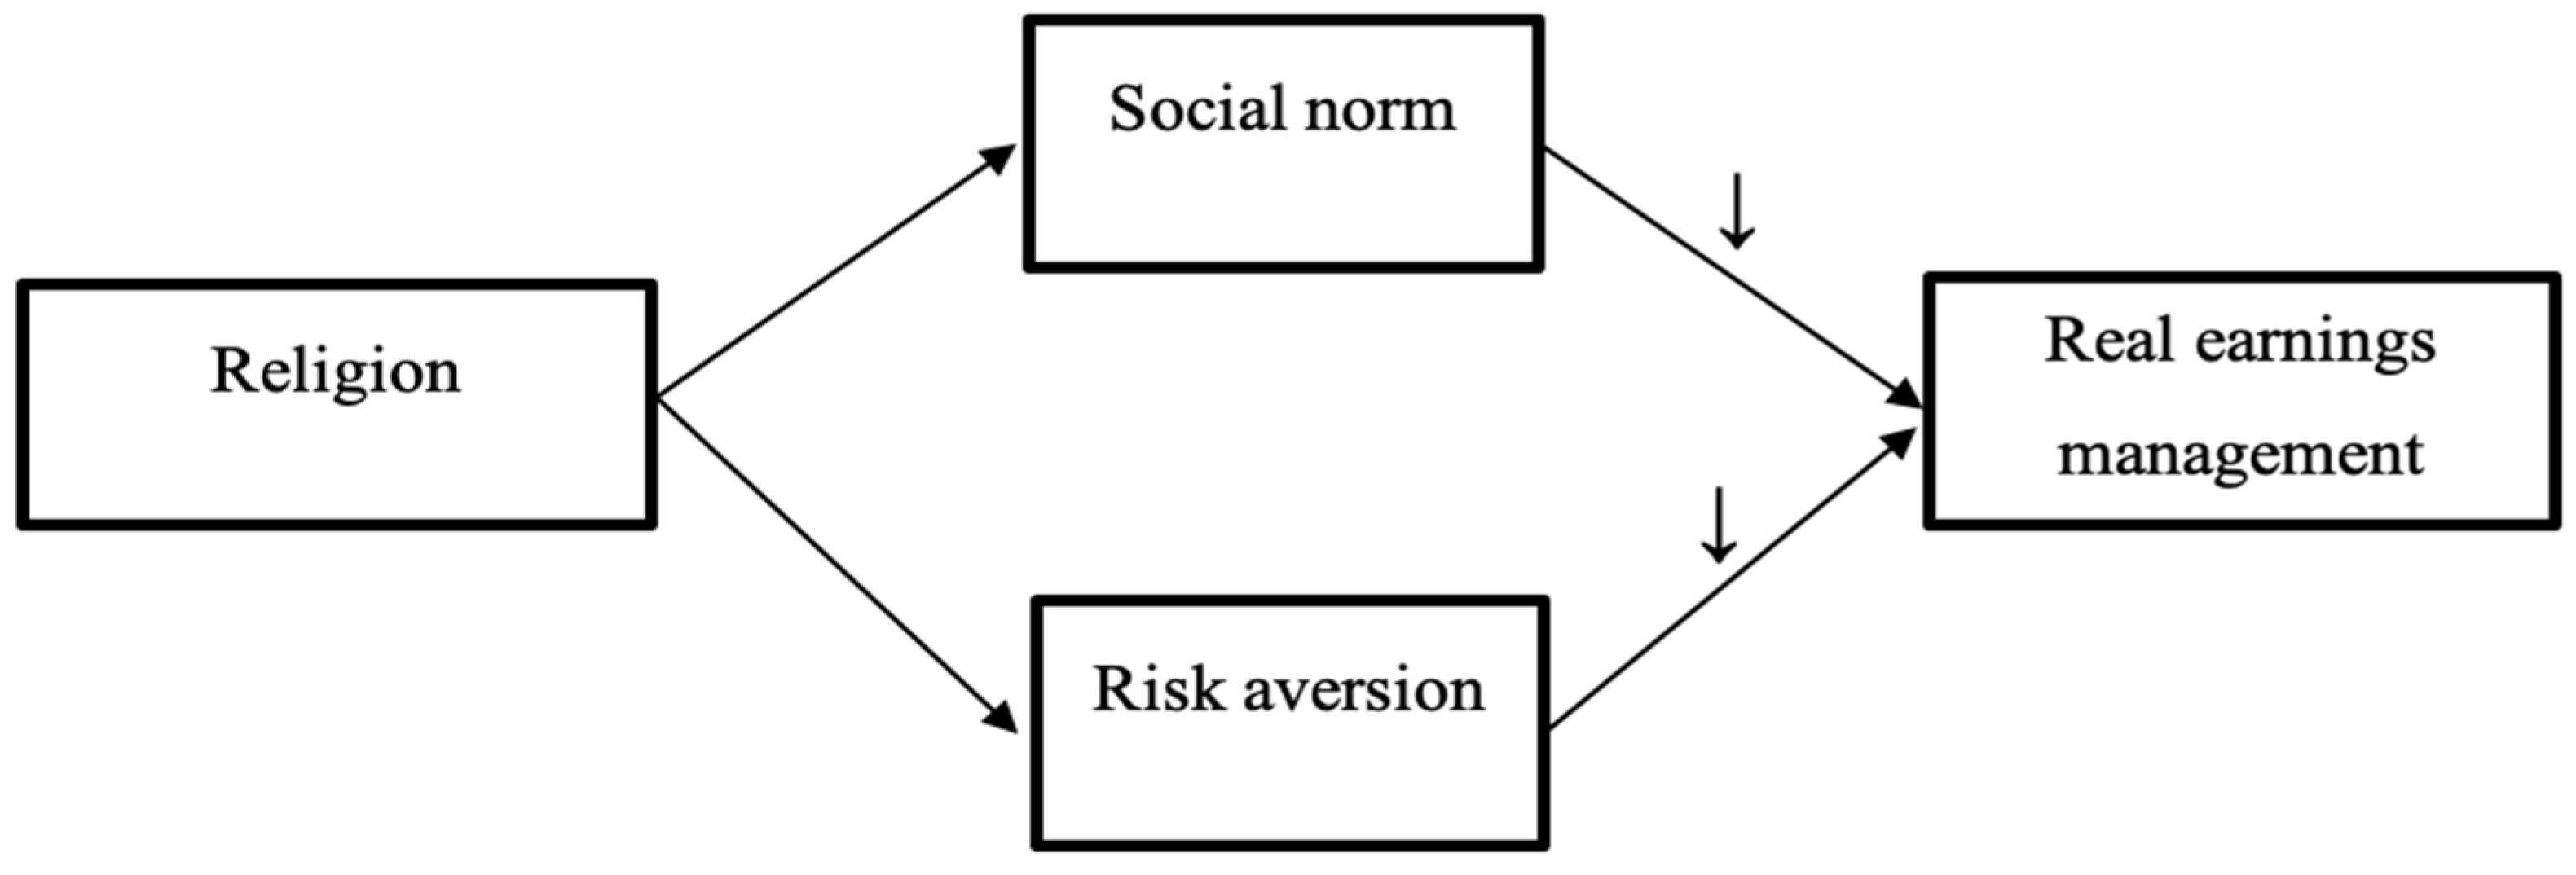
Figure 1 summarizes the paths through which religion can affect real earnings management. According to social norm theory and risk aversion theory, religion is expected to be negatively associated with real earnings management. In addition, Table 1 summarizes the key articles scrutinized in our review.
3. Research Method
3.1. Data and Sample Selection
Our paper focuses on the period from 2010 to 2020 due to the availability and completeness of religious data in the Pew Research database. Listed entities in all EU member states participate in our examination sample for three reasons. First, the historical interaction between these countries with similar cultures and traditions if these were to be contrasted with Asian or American countries. In this manner, the possibility of a significant relationship between religion and real earnings management due to unobservable cultural factors could be mitigated/reduced due to the similar cultural setting. In addition, the major religions are more easily identifiable in this setting, further aiding the examination of their possible influence on business activities. Second, firms in EU member states report financial disclosures in accordance with IFRS, further facilitating the proxying of our dependent variables and reducing noise in our empirical testing. Third, the overall development of EU countries is relatively high, and monitoring institutions are reasonably well functioning; thus, real (non-accrual-based) earnings management could be more prevalent than accrual-based earnings management.
Data are collected from Compustat, Pew Research Center’s Religion & Public Life Project, Eurostat, and the World Justice Project of Law Index. Firm data were collected from Compustat Global in WRDS. Initially, we derive firms’ real earnings management data. Following Roychowdhury (2006), we first eliminate firms with SIC codes between 4400 and 5000 and SIC codes between 6000 and 6500, which involve regulated industries, banks, and financial institutions, and we delete “inactive” firms. The details of the REM models employed and related proxies follow in the next section.
Data relating to religion are collected from the Pew Research Center’s Religion and Public Life Project. We mainly collect three categories of religious groups: Christians, Muslims, and unaffiliated. The first two categories are used to compare the effect of different religions on firms’ real earnings management since Christianity and Islam are the two main religions in Europe. The last category “unaffiliated” is used to derive the proportion of the religious population, which is calculated as “one minus the unaffiliated percentage”. All figures on the Pew Research website are already expressed as percentages.
Firm-level data used for the control variables are obtained from Compustat Global. In addition to eliminating firms with missing observations and those of the particular industries mentioned earlier, we winsorize our data at the first and ninety-nineth percentiles to prevent the possible influence of outliers.
Values for country-level variables are downloaded from Eurostat and the World Justice Project. Datasets are merged by country codes while screening out unavailable and missing values. A more detailed discussion of our data collection process can also be seen in the following section. Table 2 describes how our final firm-year observations are derived.
3.2. Variables
3.2.1. Measuring the Effect of Religion
REL is our main independent variable, representing the degree of religiosity in the EU countries where our sample companies are headquartered. Existing literature mainly uses four methods to measure religious traditions. First drawing from questionnaire or interview data. Guiso et al. (2003) and Callen et al. (2011), for example, tie data from the World Value Survey on the belief in heaven, religious affiliations, church attendance, and other categories to estimate the effect of religious traditions. McGuire et al. (2012) measure religiosity by using a database of more than 610,000 interviews from different countries conducted by the Gallup organization. Second, the ratio of the number of religious believers to the total population in the area where a firm is headquartered is a proxy of religiosity. Hilary and Hui (2009) and Dyreng et al. (2012) follow this method and calculate the level of religious adherence in the country of a US firm’s HQ. Third, by focusing on the proportions of the religious population for different religions, researchers can study the influence of cultural differences (mainly religious differences) on economic and business activities. For example, Baxamusa and Jalal (2016) and Adhikari and Agrawal (2016) utilize this approach. The fourth method involves the utilization of geographic factors. In this case, researchers use the number of religious sites, such as churches and temples, in a certain area to construct an instrumental variable. Articles that adopt this approach focus on the Chinese context since information regarding religious population data in China is not usually available.
In our paper, we chose the demographic approach to proxy for our main independent variable, whereby the degree of religiosity in a country is measured as the percentage of religious affiliation in the total population. By taking time factors into account, we collect data from 2010 to 2020, matching our financial sample. Then, in order to construct the religious adherence for our sample years, we follow the existing literature (Hilary and Hui 2009; Dyreng et al. 2012) and use the two years’ figures to linearly interpolate the degree of religiosity for every year in the decade. We hand collect religious data from the Pew Research Center’s Religion and Public Life Project for that same period.
To test Hypotheses 3 and 4, we also collect the proportion of Christian adherents and Muslims out of the total population for each EU member state participating in our sample in order to proxy for Christianity and Islam. The data for Christianity and Islam are processed in the same manner as and for the same period as REL.
3.2.2. Measuring Real Earnings Management
As mentioned earlier, we follow Roychowdhury’s (2006) seminal work to derive real earnings management data. In this context, real activity manipulation is defined as departures from normal operational practices used to mislead the perceptions of financial information users that management has achieved the expected operating goals. Roychowdhury (2006) finds evidence to support that companies can beat expected earnings through three methods: improving production to report the lower cost of goods sold; manipulating sales mainly through lenient credit terms; and reducing discretionary expenditures. These three manipulation methods can cause abnormal deviations in operating cash flows and could reflect the extent of real earnings management. The measurement model of real earnings management is developed in three parts, as described by the following formulae:
where CFOt is cash flow from operations in year t, TAt−1 is the total assets at the end of yeart−1, ΔSalest is the changes of sales revenue between yeart−1 and yeart and in each fiscal year, abnormal cash flow from operations equals the actual CFO minus the “normal” CFO.
where PRODt is the sum of the cost of goods sold (COGS) and changes of inventory in year t. This model combines the measures of COGS and inventory.
where DISEXPt is discretionary expenses in year t, which is measured as selling and administrative expenses.
After running the above three models, abnormal CFO, abnormal production costs, and abnormal expenses for every firm and year can be derived. The degree of real earnings management can then be obtained as:
where REMt is real earnings management in year t.
When the company carries out upward real earnings management, it will reduce the cost of the unit product by expanding production. This will lead to an increased book value of inventory. In other words, this method will increase abnormal production costs. By increasing price discounts and providing more lenient credit items, the company can accelerate and/or generate sales, which can increase profits, but at the same time, it will bring a reduction in operating cash flows (a net reduction in abnormal operating cash flow). When profits are increased by reducing R&D expenditures, advertising expenditures, and administrative expenses, discretionary expenses will also decrease. Therefore, the three parts of REM have different coefficient signs.
3.2.3. Measuring R&D Expenditure
The variable R&D proxies another aspect of real earnings management and is used in testing Hypothesis 2. According to prior research (e.g., Choi 2020; Yan et al. 2021), corporate R&D investment can be proxied by: The number and quality of patents that a firm obtains every year; the increase in intangible assets of a firm; a dummy variable that equals 1 if the firm has R&D expenditures, and 0 otherwise; the natural logarithm of the amount of related expenditures in a firm-year period; and the amount of R&D expenditures divided by the firm’s current-year sales revenue. We take R&D expenditure as a percentage of revenue in our regression examination and use the other measures in robustness testing.
3.2.4. Control Variables and Others
In each empirical specification, we control for factors that could relate to innate business characteristics and/or determinants of dependent variables that could correlate with our variable of interest. We separate these control factors into two groups: firm-specific and country-specific.
At firm level, we include firm size (SIZE). Due to the difference in enterprise scale, the opportunity for earnings manipulation activities can vary in companies. SIZE is measured as the natural logarithm of total assets at the end of the year.
Leverage (LEV) can also influence earnings management (Kalantonis et al. 2021). LEV is total liabilities scaled by total assets.
Return on assets (ROA) is included in our model as a proxy for risk exposure (Hilary and Hui 2009).
LOSS is a dummy we include to proxy for profit/loss making.
Variation in audit firms can achieve different external supervision of financial reports. In the case of a “Big4” firm, investors are more likely to believe that the financial statements are fairly stated and that the company is less likely to engage in earnings manipulation. These firm-level variables are usually included in the extant literature on religious factors and earnings management (Dyreng et al. 2012; McGuire et al. 2012; Baxamusa and Jalal 2016; Du et al. 2015). In addition, research focusing on firms’ R&D expenditure also considers these variables as control (dummy) factors (Choi 2020).
In cross-country research, gross domestic product (GDP) is an unavoidable variable since it is closely associated with the overall development of a given society. Callen et al. (2011) and Choi (2020), for example, include GDP as a country-level variable.
The law index (LAW) can reflect the degree of regulatory force and can proxy for the level of overall monitoring of formal regulatory institutions in a country. From the World Justice Project, we collect law index data in EU member states for each year in our testing period. A law index score reflects an overall grade measured in a hundred-mark system.
Finally, we include industry (two-digit SIC code) and year fixed effects to absorb potential unobservable influences.
Table 3 shows the proxies for all variables:
3.3. Empirical Model
Hypotheses 1 to 4 are tested with OLS regressions with fixed effect estimates and robust standard errors. Our regression models are the following:
Model 1
where REL is the tested independent variable. The rest are the control variables discussed earlier. “” represents random noise. Model 1 is used to test Hypothesis 1. In light of our literature review, we predict coefficient β1 to describe a negative association.
Model 2
In this model, we use R&D expenditure as the dependent variable to proxy for firms’ real earnings management. By running this model, we can test whether the religious atmosphere in a country can influence the R&D expenditure of companies, thus testing Hypothesis 2. Considering the characteristics of R&D activities, the coefficient β1 is predicted to be negative.
Model 3
where Christianity is the independent variable. This model is used to test Hypothesis 3. Consistent with the main variable of interest in Hypothesis 1, the coefficient estimate for Christianity is expected to be negative.
Model 4
where Islam is the independent variable. According to prior research, a negative β1 is expected. Model 3 and model 4 are used to compare the effect of different religions (Christianity and Islam) on real earnings management. From the regression results, Hypotheses 3 and 4 can be tested.
4. Results
4.1. Descriptive Statistics
Table 4 provides the descriptive statistics of the dependent and independent variables of the above four models. There are 20,761 observations in the sample from 2010 to 2020. The two dependent variables are REM and R&D. The mean value of REM is 0.0247, and the standard deviation is 0.819. R&D has a mean value of 3.920 with a standard deviation of 130.8. R&D has a large range of values. REM ranges from −77 to 40, and R&D from a minimal −1 to 8108. Comparing this to the sample (2000–2010) in Ipino and Parbonetti (2017), the average value of REM is −0.056, which indicates the objective of real earnings management in firms to have shifted from a downward manipulation of earnings (from −0.056 to 0.025).
The three independent variables are REL, Christianity, and Islam. From Table 4, the degree of religiosity in EU countries has a mean of 0.801 with a standard deviation of 0.112. This implies that 80% of people in EU countries are religiously affiliated, indicating a strong influence of religion. Among EU countries, it can be seen that the minimal value of religiosity is 0.216 and the maximal is 0.99. When the two main religions are selected separately, Christianity has a larger influence than Islam in European countries. The mean of Christianity is 0.746, with a standard deviation of 0.137. Whereas the mean of Islam is 0.05 with a standard deviation of 0.0289. This shows that demographically, although the proportion of Muslim population is much smaller than that of Christians, the variation is stable and small across EU countries. At minimum and maximum levels, there are 21.6% and 99% of people, respectively, believing in Christianity, while for Islam, these figures are at only 1% (min) and 14.2% (max). According to these numbers, some countries are statistically fully religious since 99% of the population has such beliefs; in some others, the majority of the population is non-religious.
When it comes to control variables, with the exception of dummies, there are 5 variables depicted in Table 4. Firm size (SIZE) is transformed using a natural logarithm, with a minimum value of −6.2, implying that the level of total assets of some companies is quite small. The mean of LEV is 0.53 with a standard deviation of 0.32, and the mean of ROA is −0.04 with a standard deviation of 0.25. For country-specific variables, the GDP variable has a mean value of 13.41 and a standard deviation of 1.13. The law index (LAW) presents a large difference across countries. The mean is 0.75, the minimum is 0.53, and the maximum is 0.9.
4.2. Analysis of Correlation
Table 5 presents Pearson correlation results among REL and other variables for each of the four models. This summarized examination is to ensure that there is no higher correlation within the independent variables. If the absolute value of a coefficient in the matrix is 0.8 or higher, multicollinearity is present and could decrease the t-statistic, leading to insignificant associations. It is clear that in Table 5, no variable has an absolute value of coefficient above 0.8, indicating no multicollinearity issues.
Consistent with our earlier expectations, the table shows a negative correlation between the degree of religiosity and the two dependent variables—REM and R&D—that proxy for real earnings management. The low correlation between REM and R&D suggests that these two proxies capture different dimensions of real earnings manipulation in corporates. All independent variables, except for Islam, are negatively and significantly correlated with REM. The coefficient of Islam and REM is positive, which is opposite to our earlier prediction. For R&D, the coefficient sign is consistent with our expectations, and the significance is at 0.01, indicating a strong relationship.
4.3. Hypotheses Testing
Hypothesis 1 predicts that religion is negatively associated with real earnings management, and Hypothesis 2 foretells that religion is negatively associated with R&D investment. Both hypotheses concern the effect of the degree of religiosity on firms’ earnings manipulation. Table 6 presents the multivariate regression results of Hypotheses 1 and 2.
We perform a fixed-effect OLS regression with robust standard errors for each model. The number of observations for model 1 amounts to 20,038, and in model 2, there are 19,501 data points. REM and R&D are used as proxies for real earnings management activities. The adjusted R2 for models 1 and 2 is the same at 0.00644. This indicates that the independent variables only explain a small part—0.6% percent—of the variance in the response variables, REM and R&D. Both models show significant F-statistics.
Based on the theory, Hypothesis 1 expects that the degree of religiosity negatively affects REM. Therefore, a negative coefficient for the variable REL is expected. The first result column in Table 6 is for Model 1. In this column, REL has a negative coefficient of −0.3, which is significant at 1% level or above (p-value < 0.01 with t = −4.42). This result implies that an increase in the degree of religiosity will decrease firms’ earnings manipulation. More specifically, this coefficient estimate suggests that when REL increases by one unit, real earnings management decreases by 0.3 units. Therefore, the test result strongly supports this hypothesis, which suggests that religion can mitigate real earnings management to some extent. The results contradict prior studies, such as Callen et al. (2011) (indicating no relationship) and McGuire et al. (2012) (indicating a positive relationship). Our results indicate religion as part of social norms to influence firms’ choice with regards to earnings manipulation. A possible reason is that our paper takes a different geographic sample from that of the former two mentioned studies.
The second column is for Hypothesis 2. Based on risk aversion theory, Hypothesis 2 predicts that the level of R&D investment is negatively associated with the degree of religiosity in the country where the firm is located. According to the test result, Model 2 finds a negative coefficient of −19.131, significant at 0.05 (p-value < 0.05 with t = −2.20). This means that with one unit increase in REL, R&D decreases by more than 19 units. This outcome denotes that religion negatively affects R&D expenditure. In other words, if a company is headquartered in a higher religious area, it is thereby less likely to engage in R&D investments. Considering that R&D activities are usually high-risk and highly uncertain, model 2 indicates compliance with the risk aversion theory.
Table 7 depicts the regression results for Hypotheses 3 and 4. Models 3 and 4 are aimed at testing whether Christianity and Islam have a significant effect on real earnings management and, if so, how this impact works. As discussed earlier, Christianity and Islam are the two main religions in European countries and have been long integrated into people’s lives. Therefore, it is unavoidable to investigate these two religions if a study plans to focus on European religions and religious influence. As it can be seen in Table 7, the number of observations included in the two regression models is 20,038.
Hypothesis 3 expects that Christianity can negatively influence earnings manipulation. In Column (1) of Table 7, the coefficient of Christianity is −0.264. The negative sign of the main variable of interest (Christianity) indicates that companies are less likely to manage earnings if their countries have a higher Christian ratio. In addition, this coefficient estimate is negative and significant (at 1% for Christianity-REM tests and a t-value of −4.07), indicating strong support for Hypothesis 3.
Column (2) of Table 7 displays the result for Hypothesis 4. This hypothesis predicts that Islam negatively affects real earnings manipulation. Therefore, a negative coefficient for Islam is expected, which has the same sign as Christianity in Hypothesis 3. In Column (2), after controlling for year and industry fixed effects, the coefficient estimate of Islam is 0.857, with a p-value < 1%. This implies that Islamic beliefs in a country can positively affect the real earnings management of firms, and such an impact is significant. Thus, the result rejects Hypothesis 4, which suggests that, at least in EU countries, Islamic culture does not help to mitigate activities of real earnings management. This positive result also contradicts the finding of Quttainah et al. (2013). Quttainah et al. (2013) studied earnings management in Islamic banks and found that Islamic banks are less prone to earnings management because important determinants, such as the Shari’ah Supervisory Board and the Auditing Organization for Islamic Financial Institutions, play a role in the operation of banks. The possible explanations for the opposite results can be explained first because Quttainah et al. (2013) selected organizations in the financial industry to construct a test sample, while this paper contains all industries except for regulated industries such as banks and financial institutions. Second, although the two studies use cross-country data, country selections are different. Specifically, Quttainah et al. (2013) focus on Islamic banks in traditionally Islamic countries, such as Iran and Turkey, with mature Muslim communities and cultures. This paper aims to study EU countries, where the proportion of Muslims is much smaller than that of Christians. Therefore, even if a firm is a “religious” firm, in EU countries it is more likely to be a typical “Christian” firm than an “Islamic” firm. In all, the positive and significant coefficient indicates that Hypothesis 4 should be rejected.
4.4. Robustness Testing
To strengthen the reliability of our results, we undertook the following robustness tests:
Firstly, we winsorized at the top and bottom 5% of the control variables to eliminate the adverse effect of extreme values. The new results are consistent with the previous ones. Results are depicted in Table 8, panel A.
Secondly, we used the religious data collected from the European Values website to replace the independent REL variable, and then we tested our hypotheses again. The result shows that REL is still negatively and significantly associated with REM, while REL does not show a significant influence on firms’ R&D expenditure. Results are portrayed in Table 9, panel B.
Lastly, we separated all observations into two groups through the BIG4 variable and then tested the group results. The effects are consistent again with the results in Section 4.3. REL is significantly and negatively associated with REM, independent of the accounting firms that the local companies choose (“Big4” or others). The results are shown in Table 10, panel C. To sum up, robustness testing findings suggest the reliability of our results. We also acknowledge that previous research has proxied real earnings managements using abnormal CFO, overproduction, and abnormal discretionary expenses. Our baseline results still hold when we consider these three measures separately to assess the impact of religion on real earnings management. To conserve space, results are available upon request.
5. Conclusions
Hilary and Hui (2009) document that a higher level of religiosity could lead to more conservative investment in local companies. This paper focuses on the effects of religious factors on real earnings management. In particular, we examine whether there is a negative association between the degree of religiosity in a country and the real earnings management behavior of companies in this country. In addition, we examine whether different religions, such as Christianity and Islam, have a different effect on firms’ (non-accrual) earnings manipulation.
A significant body of the accounting literature has studied earnings management and its association with other topics (Elias 2002; Leuz et al. 2003; Roychowdhury 2006; Garcia Osma 2008; Ipino and Parbonetti 2017). It is not surprising to find that prior research has talked about the impact of religion (as an external factor) on firms’ behaviors for manipulating earnings (Dyreng et al. 2012; McGuire et al. 2012; Quttainah et al. 2013; Du et al. 2015). However, these studies mainly focus on accrual-based earnings management, which is easily captured from annual financial and audit reports. Only a few articles pay enough attention to real earnings management, which is more concealed. Considering the limited discussion about religious factors and real earnings management, this paper helps to fill this research gap by examining how religiosity in European Union member states affects EU-based firms’ real earnings management. Based on social norm and risk aversion theories, four hypotheses are put forward, all predicting a negative relationship between religiosity and REM.
In order to answer our research question, a dataset from Compustat and the Pew Research database is examined. The main sample consists of 20,761 observations of 3090 firms headquartered in the EU from 2010 to 2020. The regression models consider religiosity (the Christian and Muslim ratios of the local populations) as independent variables, with these variables obtained from the Pew Research database. Real earnings management-related figures and R&D expenditures were derived from the Compustat database and are used as dependent variables in the four models. Furthermore, all regression models consider firm size, leverage, return on assets, loss, and the type of audit firm as firm-level control variables, additionally including GDP and the law index as country-level control variables.
We test four hypotheses. Hypotheses one and two expect the degree of overall religiosity to have a negative effect on both REM and R&D (as an alternative proxy for real earnings management). The results of models 1 and 2 indicate a negative and significant association between religiosity for both proxies, thus accepting both hypotheses. Hypotheses three and four put particular emphasis on the different types of religions and their effects on firms’ real earnings manipulations. Both hypotheses anticipate a negative association between Christianity and Islam and real earnings management. Model 3 indicates a negative and significant association between Christianity and real earnings management, while model 4 indicates that Islam has a positive and significant impact on real earnings management. Therefore, hypothesis three is accepted, but hypothesis four is rejected. In addition, the coefficient of Christianity in model 3 is −0.26, whose absolute value is smaller than that of Islam in model 4, which is −0.86. This difference in coefficients may reveal that the influence of Islam on firms’ operating activities is greater than the influence of Christianity, even though Christianity has much greater adherent numbers in EU member states. Our robustness testing supports our main findings. We also find evidence that the effect of religion on real earnings management is stronger among firms with low levels of external monitoring, providing evidence for the role of a “cultural institution” where the activities of formal institutions are absent or lagging behind.
This paper has some limitations and potential future research avenues. First, we proxy for religious factors using demographics only. Potential statistical errors could drive our findings. In addition, this method of analysis could not capture the complete workings of religion and omit significant characteristics of its effects. Future research could focus on the construction of a more unbiased and complete proxy to evaluate such types of cultural-level attributes. Second, our control variables are not incorporating important information due to the absence of related data. For instance, executive factors may also impact the paper results since the religious beliefs of CEOs could influence the design of corporate policies (Cai et al. 2019), and ownership concentration in a firm could also influence earnings manipulation (Callen et al. 2011). Future researchers could add more control variables to their regression. Third, our sample only includes data from EU member states. Other European countries (e.g., Britain) are not included in our examination, and this could have an impact on our output. Fourth, we consider the relatively low R-squares of our estimations as an additional weakness. Perhaps future research will augment our model with additional controls to improve its explanatory power. Future studies could extend the scope to all European countries to obtain a more reliable result. Last, we do not pay much attention to external regulation that could affect the association between religion and real earnings manipulation. The consideration of relevant moderating effects is another possible future path.
Author Contributions
Conceptualization, K.S.T. and J.Z.; methodology, K.S.T. and J.Z.; software, K.S.T. and J.Z.; validation, K.S.T. and J.Z.; formal analysis, K.S.T. and J.Z.; investigation, K.S.T. and J.Z.; resources, K.S.T. and J.Z.; data curation, K.S.T. and J.Z.; writing—original draft preparation, K.S.T. and J.Z.; writing—review and editing, K.S.T. and J.Z.; visualization, K.S.T. and J.Z.; supervision, K.S.T. and J.Z.; project administration, K.S.T. and J.Z. All authors have read and agreed to the published version of the manuscript.
Funding
This research received no external funding.
Data Availability Statement
Data are available upon request.
Conflicts of Interest
The authors declare no conflict of interest.
| 1 | As mentioned earlier there is no consensus in the literature on the existence of a link between religion and real earnings management. Differences in the findings could be driven from the distinctive samples used. A sorting of the related literature indicates the majority of the studies to concentrate either on companies in America or in China; whereas cross-country samples usually contain countries all over the world (Kanagaretnam et al. 2015). Our review of the related literature is in support of Kanagaretnam et al. (2015) indicating that there is little research in examining how EU listed entities behave in this context. Our primary contribution therefore is to document that differences in religiosity between countries are related to differences in real (non-accrual) earnings management and we extend prior research on the examination of this relation to the international setting by examining a more homogenous (i.e., EU) reporting setting. Additionally our study can be viewed as identifying softer dimensions such as religion, in addition to previously identified international institutional factors, that influence financial reporting behavior. Overall, our findings support the growing awareness among researchers studying international financial markets that informal institutions such as religion which is a major source of morality and ethical behavior matter in financial reporting and financial decisions, even when those decisions are made by sophisticated professional managers. |
References
- Adhikari, Binay, and Anup Agrawal. 2016. Does local religiosity matter for bank risk-taking? Journal of Corporate Finance 38: 272–93. [Google Scholar] [CrossRef]
- Aibibula, Hailipitimu, Gege Wang, and Chengcheng Zhang. 2017. Religious Belief and Firm R&D Investment. Technology and Investment 8: 142–50. [Google Scholar]
- Ball, Ray, and Lakshmanan Shivakumar. 2006. The Role of Accruals in Asymmetrically Timely Gain and Loss Recognition. Journal of Accounting Research 2: 207–242. [Google Scholar] [CrossRef]
- Bartov, Eli, Dan Givoly, and Carla Hayn. 2002. The rewards to meeting or beating earnings expectations. Journal of Accounting and Economics 33: 173–204. [Google Scholar] [CrossRef]
- Basu, Sudipta. 1997. The conservatism principle and the asymmetric timeliness of earnings. Journal of Accounting and Economics 1: 3–37. [Google Scholar] [CrossRef]
- Baxamusa, Mufaddal, and Abu Jalal. 2016. CEO’s religious affiliation and managerial conservatism. Financial Management 45: 67–104. [Google Scholar] [CrossRef]
- Brammer, Stephen, Geoffrey Williams, and John Zinkin. 2007. Religion and attitudes to corporate social responsibility in a large cross-country sample. Journal of Business Ethics 71: 229–43. [Google Scholar] [CrossRef]
- Bruce, Steve. 2002. God is Dead: Secularization in the West. Oxford: Blackwell Publishing. [Google Scholar]
- Bruns, William, and Kenneth Merchant. 1990. The dangerous morality of managing earnings. Management Accounting 72: 22–25. [Google Scholar]
- Burgstahler, David, and Ilia Dichev. 1997. Earnings management to avoid earnings decreases and losses. Journal of Accounting and Economics 24: 99–126. [Google Scholar] [CrossRef]
- Bushee, Brian. 1998. The influence of institutional investors on myopic R&D investment behavior. Accounting Review 73: 305–33. [Google Scholar]
- Cai, Ye, Yongtae Kim, Siqi Li, and Carrie Pan. 2019. Tone at the top: CEOs’ religious beliefs and earnings management. Journal of Banking & Finance C 106: 195–213. [Google Scholar]
- Callen, Jeffrey L., Morel Morel, and Grant Richardson. 2011. Do culture and religion mitigate earnings management? Evidence from a cross-country analysis. International Journal of Disclosure and Governance 8: 103–21. [Google Scholar] [CrossRef]
- Cazavan-Jeny, Anne, Thomas Jeanjean, and Peter Joos. 2011. Accounting choice and future performance: The case of R&D accounting in France. Journal of Accounting and Public Policy 30: 145–65. [Google Scholar]
- Chambers, Dennis, Ross Jennings, and Robert B. Thompson. 2002. Excess returns to R&D-intensive firms. Review of Accounting Studies 7: 133–58. [Google Scholar]
- Cheng, Shijun. 2004. R&D Expenditures and CEO Compensation. The Accounting Review 2: 305–328. [Google Scholar]
- Choi, Kyeong-Seop. 2020. National culture and R&D investments. The European Journal of Finance 26: 500–31. [Google Scholar]
- Choi, Youngtae. 2010. Religion, religiosity, and South Korean consumer switching behaviors. Journal of Consumer Behaviour 9: 157–71. [Google Scholar] [CrossRef]
- Christopoulos, Apostolos, Spyros Papathanasiou, Petros Kalantonis, Andreas Chouliaras, and Savvas Katsikidis. 2014. Investigation of cointegration and casualty relationships between the PIIGS’stock markets. Stock Markets European Research Studies 17: 109–23. [Google Scholar]
- Cialdini, Robert, and Noah Goldstein. 2004. Social influence: Compliance and conformity. Annual Review of Psychology 55: 591–621. [Google Scholar] [CrossRef]
- Cohen, Daniel, Aiyesha Dey, and Thomas Lys. 2008. Real and accrual-based earnings management in the pre-and post-Sarbanes-Oxley periods. The Accounting Review 83: 757–87. [Google Scholar] [CrossRef]
- Dechow, Patricia, and Richard Sloan. 1991. Executive incentives and the horizon problem: An empirical investigation. Journal of Accounting and Economics 14: 51–89. [Google Scholar] [CrossRef]
- Dechow, Patricia, Richard Sloan, and Amy Sweeney. 1995. Detecting earnings management. Accounting Review 70: 193–225. [Google Scholar]
- Dobbin, Frank, and Jiwook Jung. 2010. The misapplication of Mr. Michael Jensen: How agency theory brought down the economy and why it might again. In Markets on Trial: The Economic Sociology of the US Financial Crisis: Part B. Bradford: Emerald Group Publishing Limited. [Google Scholar]
- Du, Xingqiang. 2021. Religious Entrepreneurs and Corporate R&D Investment. In on Informal Institutions and Accounting Behavior. Singapore: Springer, pp. 207–59. [Google Scholar]
- Du, Xingqiang, Wei Jian, Shaojuan Lai, Yingjie Du, and Hongmei Pei. 2015. Does religion mitigate earnings management? Evidence from China. Journal of Business Ethics 131: 699–749. [Google Scholar] [CrossRef]
- Dyreng, Scott, William Mayew, and Christopher Williams. 2012. Religious social norms and corporate financial reporting. Journal of Business Finance & Accounting 39: 845–75. [Google Scholar]
- El Ghoul, Sadok, Omrane Guedhami, Yang Ni, Jeffrey Pittman, and Samir Saadi. 2012. Does religion matter to equity pricing? Journal of Business Ethics 111: 491–518. [Google Scholar] [CrossRef]
- Elias, Rafik. 2002. Determinants of earnings management ethics among accountants. Journal of Business Ethics 40: 33–45. [Google Scholar] [CrossRef]
- Garcia Osma, Beatriz. 2008. Board independence and real earnings management: The case of R&D expenditure. Corporate Governance: An International Review 16: 116–31. [Google Scholar]
- Graham, John R., Campbell R. Harvey, and Shiva Rajgopal. 2005. The economic implications of corporate financial reporting. Journal of Accounting and Economics 40: 3–73. [Google Scholar] [CrossRef]
- Grullon, Gustavo, George Kanatas, and James Weston. 2010. Religion and Corporate (mis) Behavior. Working Paper. Houston: Rice University. [Google Scholar]
- Guan, Liming, Daoping He, and David Yang. 2006. Auditing, integral approach to quarterly reporting, and cosmetic earnings management. Managerial Auditing Journal 21: 569–81. [Google Scholar] [CrossRef]
- Guiso, Luigi, Paola Sapienza, and Luigi Zingales. 2003. People’s opium? Religion and economic attitudes. Journal of Monetary Economics 50: 225–82. [Google Scholar] [CrossRef]
- Gunny, Katherine. 2010. The relation between earnings management using real activities manipulation and future performance: Evidence from meeting earnings benchmarks. Contemporary Accounting Research 27: 855–88. [Google Scholar] [CrossRef]
- Healy, Paul, and James Michael Wahlen. 1999. A review of the earnings management literature and its implications for standard setting. Accounting Horizons 13: 365–83. [Google Scholar] [CrossRef]
- Hilary, Gilles, and Kai Wai Hui. 2009. Does religion matter in corporate decision making in America? Journal of Financial Economics 93: 455–73. [Google Scholar] [CrossRef]
- Hofstede, Geert. 1980. Culture and organizations. International Studies of Management & Organization 10: 15–41. [Google Scholar]
- Hofstede, Geert. 2001. Culture’s recent consequences: Using dimension scores in theory and research. International Journal of Cross Cultural Management 1: 11–17. [Google Scholar] [CrossRef]
- Ipino, Elisabetta, and Antonio Parbonetti. 2017. Mandatory IFRS adoption: The trade-off between accrual-based and real earnings management. Accounting and Business Research 47: 91–121. [Google Scholar] [CrossRef]
- Jones, Jennifer. 1991. Earnings management during import relief investigations. Journal of Accounting Research 29: 193–228. [Google Scholar] [CrossRef]
- Kalantonis, Petros, Christos Kallandranis, and Marios Sotiropoulos. 2021. Leverage and firm performance: New evidence on the role of economic sentiment using accounting information. Journal of Capital Markets Studies 5: 96–107. [Google Scholar] [CrossRef]
- Kanagaretnam, Kiridaran, Gerald Lobo, and Chong Wang. 2015. Religiosity and Earnings Management International Evidence from the Banking Industry. Journal of Business Ethics 132: 277–96. [Google Scholar] [CrossRef]
- Kohlberg, Lawrence. 1984. Essays on Moral Development/2 The Psychology of Moral Development. San Francisco: Harper & Row. [Google Scholar]
- Kumar, Alok, Jeremy Page, and Oliver Spalt. 2011. Religious beliefs, gambling attitudes, and financial market outcomes. Journal of Financial Economics 102: 671–708. [Google Scholar] [CrossRef]
- Leuz, Christian, Dhananjay Nanda, and Peter Wysocki. 2003. Earnings management and investor protection: An international comparison. Journal of Financial Economics 69: 505–27. [Google Scholar] [CrossRef]
- Ma, Lijun, Min Zhang, Jingyu Gao, and Tingting Ye. 2020. The effect of religion on accounting conservatism. European Accounting Review 29: 383–407. [Google Scholar] [CrossRef]
- Markarian, Garen, Lorenzo Pozza, and Annalisa Prencipe. 2008. Capitalization of R&D costs and earnings management: Evidence from Italian listed companies. The International Journal of Accounting 43: 246–67. [Google Scholar]
- Marquis, Christopher, and András Tilcsik. 2013. Imprinting: Toward a multilevel theory. The Academy of Management Annals 7: 195–245. [Google Scholar] [CrossRef]
- Marrakchi Chtourou, Sonda, Jean Bedard, and Lucie Courteau. 2001. Corporate Governance and Earnings Management. Available online: https://papers.ssrn.com/sol3/papers.cfm?abstract_id=275053 (accessed on 15 August 2023).
- McGuire, Sean T., Thomas C. Omer, and Nathan Y. Sharp. 2012. The impact of religion on financial reporting irregularities. The Accounting Review 87: 645–73. [Google Scholar] [CrossRef]
- Miller, A. S. 2000. Going to Hell in Asia: The Relationship between Risk and Religion in a Cross Cultural Setting. Review of Religious Research 1: 5–18. [Google Scholar] [CrossRef]
- Miller, Alan, and John Hoffmann. 1995. Risk and religion: An explanation of gender differences in religiosity. Journal for the Scientific Study of Religion 34: 63–75. [Google Scholar] [CrossRef]
- Mukhibad, Hasan, and Ahmad Nurkhin. 2019. Islamic Business Ethics Disclosure and Earnings Management–Evidence from Islamic Banks in Indonesia. Journal of Islamic Finance 8: 31–42. [Google Scholar]
- Omer, Thomas, Nathan Sharp, and Dechun Wang. 2018. The impact of religion on the going concern reporting decisions of local audit offices. Journal of Business Ethics 149: 811–31. [Google Scholar] [CrossRef]
- Prencipe, Annalisa, Garen Markarian, and Lorenzo Pozza. 2008. Earnings management in family firms: Evidence from R&D cost capitalization in Italy. Family Business Review 21: 71–88. [Google Scholar]
- Quttainah, Majdi, Liang Song, and Qiang Wu. 2013. Do Islamic Banks Employ Less Earnings Management. Journal of International Financial Management & Accounting 24: 203–33. [Google Scholar]
- Richardson, Scott, Irem Tuna, and Peter Wysocki. 2003. Accounting for taste: Board member preferences and corporate policy choices. MIT Sloan School of Management Working Paper. Available online: https://papers.ssrn.com/sol3/papers.cfm?abstract_id=405101 (accessed on 15 August 2023).
- Roychowdhury, Sugata. 2006. Earnings management through real activities manipulation. Journal of Accounting & Economics 42: 335–70. [Google Scholar]
- Skordoulis, Michalis, Stamatios Ntanos, Grigorios Kyriakopoulos, Garyfallos Arabatzis, Spyros Galatsidas, and Miltiadis Chalikias. 2020. Environmental innovation, open innovation dynamics and competitive advantage of medium and large.sized firms. Journal of Open Innovation: Technology, Market, and Complexity 6: 195. [Google Scholar] [CrossRef]
- Stark, Rodney, and Roger Finke. 2000. Acts of Faith: Explaining the Human Side of Religion. Berkeley: University of California Press. [Google Scholar]
- Stavrova, Olga, Detlef Fetchenhauer, and Thomas Schlösser. 2013. Why are religious people happy? The effect of the social norm of religiosity across countries. Social Science Research 42: 90–105. [Google Scholar] [CrossRef] [PubMed]
- Wang, Sean, and Julia D’Souza. 2006. Earnings management: The effect of accounting flexibility on R&D investment choices. Johnson School Research Paper Series No. 33-06. Available online: https://papers.ssrn.com/sol3/papers.cfm?abstract_id=878345 (accessed on 15 August 2023).
- Yan, Youliang, Xixiong Xu, and Jieji Lai. 2021. Does Confucian culture influence corporate R&D investment? Evidence from Chinese private firms. Finance Research Letters 40: 101719. [Google Scholar]
Figure 1.
Paths through which religion can affect real earnings management.

Table 1.
Key literature papers.
| Author(s) (Year) | Focus | Methodology | Setting and Year | Key Variables |
|---|---|---|---|---|
| McGuire et al. (2012) | The impact of religion on financial reporting. | Quantitative research | The sample period spans from 2006 to 2008, with 11,576 firm-year observations in U.S. | Accounting Risk, shareholder lawsuits, accounting restatements are proxies for dependent variables; religiosity is measure by MSA scores; demographic control variables include population, the median household income, political affiliation, average age, racial minorities; firm-level control variables include firm size, ROA, financial leverage, loss. |
| Dyreng et al. (2012) | Whether religion is associated with accrual choices managers make when generating corporate financial reports. | Quantitative research | 45,278 firm-year observations between 1990 and 2008 in U.S. | Discretionary accruals, accounting risk, restatement, and irregularity restatements are proxies for dependent variables; religious adherence (number of adherents in the county) is the independent variable; log of market value of equity, cash flow volatility, book-to-market ratio, ROA, leverage, sales volatility, and other variables are control variables. |
| Hilary and Hui (2009) | Whether the relation between individual risk aversion and religiosity influences organizational behavior. | Quantitative research | More than 5000 firms from 1971 to 2000 in U.S. | The main variable of interest is the degree of religiosity (REL) in the county where the firm is located; StdRet, ROA, Inv, RD, and Growth are dependent variables; control variables include population, educational attainment, the sex ratio, married population, average income, and others. |
| Callen et al. (2011) | Whether culture in general and religion in particular mitigate earnings management. | Quantitative research | A cross-country research data of 31 countries. | Aggregate earnings management score, percentage of population of different religious adherents, outside investor rights score, legal enforcement score, GDP per capita, and cultural dimension are key variables. |
| Roychowdhury (2006) | The management of operational activities. | Quantitative research | 21,758 firm-years over the period 1987–2001, including 36 industries and 4252 individual firms. | Cash flow from operations; the change in inventory; cost of goods sold; discretionary expenses. |
| Kumar et al. (2011) | Whether geographic variation in religion-induced gambling norms affects aggregate market outcomes. | Quantitative research | The sample period is from 1980 to 2005. The data set has 14,557 firm-year observations for 2172 unique U.S. firms. | Measure gambling propensity by using people’s religious beliefs; control variables include firm size, Tobin’s Q, R&D expenses, population, the median household income. |
| Ma et al. (2020) | Whether religiosity strongly influences a firm’s adoption of accounting conservatism. | Quantitative research | The sample period is 1971–2010. The valid sample contains more than 124,000 firm-year observations in U.S. | The main variable of interest is REL. REL denotes the degree of religiosity in the county where a firm is headquartered; this paper uses two measures of accounting conservatism, from Basu (1997) and Ball and Shivakumar (2006); the models control for firm size, market-to-book ratio, and leverage. |
| Adhikari and Agrawal (2016) | Whether the religious belief of entrepreneurs will play an influential role in the R&D investment decision making, and what is its mechanism? | Quantitative research | 1459 unique banks in the U.S.; year 1994–2010 | Bank risk is measured by total risk, tail risk, idiosyncratic risk, and a bank’s z-score; religiosity is measured as the number of religious adherents; control variables are bank size, profitability, the proportion of nonperforming assets, loans-to-assets ratio, deposit-to-assets ratio, tier 1 capital ratio, proportion of non-interest income, and a dummy variable for M&A activities. |
| Baxamusa and Jalal (2016) | Whether managers’ religious affiliations affect corporate decisions. | Quantitative research | 652 CEOs and 2406 firm-year observations from 1992 to 2010 in U.S. | Variables include capital structure, debt issue, amounts of investments, profit margin, CEO power. |
| Grullon et al. (2010) | Whether variation in this exogenous determinant of local culture (religiosity) affects corporate (mis)behavior. | Quantitative research | About 55,000 observations over the period 1996–2006 in the U.S. | Dependent variable is a dummy variable equal to 1 if the firm is accused of committing fraud in year t, 0 otherwise; control variables include population, firm size, the average stock return over the previous year, the book-to-market ratio, the annual standard deviation of monthly stock returns, ROA, the litigation risk score. |
| Choi (2020) | The possible link between national culture and R&D investments. | Quantitative research | 12,362 firms from 40 countries; 1990–2016 | Hofstede’s six culture variables; GDP per capita, GDP growth, and high-tech exports, sales, cash flows. |
| Du (2021) | The influence of an entrepreneur’s religious belief on R&D investment and the moderating effect of political connections. | Quantitative research | A sample of 4072 Chinese family firms; 2010 | Firm size, financial leverage, cash ratio, sales growth rate, return on sales, and firm age. |
Table 2.
Sample selection.
| Region | Firm-Year Observations in EU Countries |
|---|---|
| Original observations in the Compustat database (2010–2020) | 389,119 |
| - Financial industry and missing values | −103,391 |
| - Not matched with REM dataset | −262,219 |
| - Observations related to financial variables | 23,509 |
| - Not matched with country-level dataset | −1151 |
| - Not matched with religion dataset | −1599 |
| - Final number of observations | 20,759 |
Table 3.
Measurement of variables.
| Dependent variable | Real earnings management (REM) | Calculated by models in Roychowdhury (2006) | |
| R&D investment (R&D) | R&D expenditure/revenue in year t | ||
| Independent variable | The degree of religiosity (REL) | the proportion of people with religious beliefs in a country | |
| The degree of Christianity atmosphere | the proportion of Christians in a country | ||
| The degree of Islam atmosphere | the proportion of Muslims in a country | ||
| Control variable | Firm- specific | Company size (Size) | Natural logarithm of total asset at the end of year t |
| Return on assets (ROA) | Net income/total asset | ||
| Leverage (LEV) | Total liability/total asset | ||
| LOSS | indicator variable that equals 1 if net income was negative in the current or previous two fiscal years, and 0 otherwise | ||
| BIG4 | indicator variable that equals 1 if a Big 4 audit firm was the external auditor for a firm-year observation, and 0 otherwise | ||
| Country- specific | GDP | Natural logarithm of GDP in a country at the end of year t | |
| LAW | A country’s overall law index in year t | ||
| Others | Industry | Dummy variable as defined by each of the SIC codes used in the dataset | |
| Year | Dummy variable as defined by each of the years in the dataset | ||
Table 4.
Descriptive statistics.
| (1) | (2) | (3) | (4) | (5) | ||
|---|---|---|---|---|---|---|
| VARIABLES | N | Mean | sd | Min | Max | |
| (1) | REM | 20,761 | 0.0247 | 0.819 | −77.06 | 39.66 |
| (2) | R&D | 20,219 | 3.920 | 130.8 | −1.046 | 8108 |
| (3) | REL | 20,761 | 0.801 | 0.112 | 0.216 | 0.990 |
| (4) | Christianity | 20,761 | 0.746 | 0.137 | 0.209 | 0.995 |
| (5) | Islam | 20,761 | 0.0492 | 0.0289 | 0.0100 | 0.142 |
| (6) | SIZE | 20,761 | 5.169 | 2.381 | −6.215 | 15.52 |
| (7) | LEV | 20,761 | 0.531 | 0.321 | 0.00667 | 2.351 |
| (8) | ROA | 20,761 | −0.0465 | 0.249 | −1.463 | 0.281 |
| (9) | GDP | 20,761 | 13.41 | 1.129 | 9.801 | 15.05 |
| (10) | LAW | 20,761 | 0.750 | 0.0940 | 0.530 | 0.900 |
Table 5.
Pearson Correlation.
| REM | R&D | REL | Chris | Islam | SIZE | LEV | ROA | LOSS | BIG4 | GDP | ||
|---|---|---|---|---|---|---|---|---|---|---|---|---|
| 1 | 0.290 *** | GDP | ||||||||||
| 1 | 0.024 *** | 0.248 *** | BIG4 | |||||||||
| 1 | −0.145 *** | −0.029 *** | 0.013 * | LOSS | ||||||||
| 1 | −0.585 *** | 0.120 *** | −0.00900 | −0.098 *** | ROA | |||||||
| 1 | −0.236 *** | 0.141 *** | 0.0110 | 0.031 *** | −0.113 *** | LEV | ||||||
| 1 | 0.00200 | 0.342 *** | −0.333 *** | 0.447 *** | −0.018 ** | 0.119 *** | SIZA | |||||
| 1 | 0.037 *** | −0.037 *** | −0.040 *** | 0.043 *** | 0.00500 | 0.305 *** | 0.157 *** | islam | ||||
| 1 | −0.673 *** | −0.120 *** | 0.062 *** | 0.078 *** | −0.030 *** | −0.185 *** | −0.467 *** | −0.614 *** | chris | |||
| 1 | 0.977 *** | −0.504 *** | −0.125 *** | 0.065 *** | 0.077 *** | −0.020 *** | −0.210 *** | −0.454 *** | −0.666 *** | REL | ||
| 1 | −0.031 *** | −0.034 *** | 0.030 *** | −0.031 *** | 0.026 *** | −0.075 *** | 0.039 *** | −0.004 | 0.023 *** | 0.012 * | R&D | |
| 1 | 0.017 ** | −0.031 *** | −0.034 *** | 0.030 *** | −0.031 *** | 0.026 *** | −0.075 *** | 0.039 *** | −0.00400 | 0.023 *** | 0.012 * | REM |
Note: *** p < 0.01, ** p < 0.05, * p < 0.1.
Table 6.
Hypotheses 1 and 2 testing.
| (1) | (2) | |
|---|---|---|
| VARIABLES | REM | R&D |
| REL | −0.300 *** | −19.131 ** |
| (−4.42) | (−2.20) | |
| SIZE | 0.001 | 0.435 |
| (0.26) | (1.24) | |
| LEV | 0.021 | −15.597 *** |
| (0.76) | (−3.82) | |
| ROA | −0.257 *** | −44.021 *** |
| (−8.58) | (−3.16) | |
| LOSS | −0.005 | 0.834 |
| (−0.27) | (0.33) | |
| BIG4 | 0.009 | −1.037 |
| (0.89) | (−0.38) | |
| GDP | 0.009 *** | −1.601 ** |
| (2.61) | (−2.41) | |
| LAW | −0.227 *** | 10.163 |
| (−4.00) | (1.00) | |
| Constant | 0.212 ** | 29.558 ** |
| (2.15) | (2.04) | |
| Year fixed effect | Included | Included |
| Industry fixed effect | Included | Included |
| Observations | 20,038 | 19,501 |
| R-squared | 0.011 | 0.008 |
| adj_R2 | 0.00644 | 0.00644 |
| F | 1.687 | 1.687 |
Note: Robust t-statistics in parentheses. *** p < 0.01, ** p < 0.05.
Table 7.
Hypotheses 3 and 4 testing.
| (1) | (2) | |
|---|---|---|
| VARIABLES | REM | REM |
| Christianity | −0.264 *** | |
| (−4.07) | ||
| Islam | 0.857 *** | |
| (3.33) | ||
| SIZE | 0.000 | 0.001 |
| (0.17) | (0.33) | |
| LEV | 0.022 | 0.022 |
| (0.79) | (0.79) | |
| ROA | −0.256 *** | 0.259 *** |
| (−8.60) | (−8.64) | |
| LOSS | −0.007 | −0.006 |
| (−0.32) | (−0.30) | |
| BIG4 | 0.010 | 0.014 |
| (0.95) | (1.28) | |
| GDP | 0.007 ** | 0.012 *** |
| (1.99) | (3.35) | |
| LAW | −0.217 *** | −0.044 |
| (−4.02) | (−0.76) | |
| Constant | 0.182 * | 0.251 *** |
| (1.85) | (−5.41) | |
| Year fixed effect | Included | Included |
| Industry fixed effect | Included | Included |
| Observations | 20,038 | 20,038 |
| R-squared | 0.012 | 0.011 |
| adj_R2 | 0.00644 | 0.00644 |
| F | 1.687 | 1.687 |
Note: Robust t-statistics in parentheses. *** p < 0.01, ** p < 0.05, * p < 0.1.
Table 8.
Robustness testing—panel A.
| (1) | (2) | (3) | (4) | |
|---|---|---|---|---|
| Model 1 | Model 2 | Model 3 | Model 4 | |
| VARIABLES | REM | R&D | REM | REM |
| REL | −0.291 *** | −18.198 ** | ||
| (−4.38) | (−2.13) | |||
| Christianity | −0.256 *** | |||
| (−4.04) | ||||
| Islam | 0.836 *** | |||
| (3.30) | ||||
| SIZE | −0.001 | 0.612 | −0.001 | −0.000 |
| (−0.20) | (1.39) | (−0.28) | (−0.14) | |
| LEV | 0.086 ** | −17.446 *** | 0.086 ** | 0.086 ** |
| (2.25) | (−3.35) | (2.26) | (2.26) | |
| ROA | −0.467 *** | −76.966 *** | −0.465 *** | −0.471 *** |
| (−7.98) | (−3.56) | (−8.00) | (−8.04) | |
| LOSS | −0.044 * | −4.741 * | −0.045 * | −0.045 * |
| (−1.77) | (−1.69) | (−1.79) | (−1.79) | |
| BIG4 | 0.009 | −1.000 | 0.009 | 0.013 |
| (0.86) | (−0.37) | (0.92) | (1.24) | |
| GDP | 0.007 ** | −1.575 ** | 0.006 | 0.010 *** |
| (2.03) | (−2.36) | (1.48) | (2.72) | |
| LAW | −0.213 *** | 9.678 | −0.203 *** | −0.035 |
| (−3.75) | (0.92) | (−3.76) | (−0.61) | |
| Constant | 0.210 ** | 30.589 ** | 0.180 * | −0.239 *** |
| (2.14) | (2.08) | (1.84) | (−5.18) | |
| Observations | 20,036 | 19,500 | 20,036 | 20,036 |
| R-squared | 0.012 | 0.008 | 0.012 | 0.012 |
| adj_R2 | 0.00675 | 0.00675 | 0.00675 | 0.00675 |
| F | 1.675 | 1.675 | 1.675 | 1.675 |
Note: Robust t-statistics in parentheses. *** p < 0.01, ** p < 0.05, * p < 0.1.
Table 9.
Robustness testing—panel B.
| (1) | (2) | |
|---|---|---|
| test1 | test2 | |
| VARIABLES | REM | R&D |
| REL | −0.003 * | −0.090 |
| (−1.65) | (−0.65) | |
| SIZE | −0.004 | 0.735 ** |
| (−1.59) | (2.28) | |
| LEV | 0.051 * | −15.692 *** |
| (1.71) | (−3.60) | |
| ROA | −0.243 *** | −42.679 *** |
| (−7.78) | (−3.12) | |
| LOSS | −0.021 | −0.880 |
| (−0.95) | (−0.44) | |
| BIG4 | 0.011 | −2.032 |
| (1.01) | (−0.86) | |
| GDP | 0.011 *** | −0.868 * |
| (3.02) | (−1.72) | |
| LAW | −0.187 * | 15.726 |
| (−1.83) | (1.25) | |
| Constant | −0.067 | 3.011 |
| (−0.89) | (0.67) | |
| Observations | 18,831 | 18,318 |
| R-squared | 0.008 | 0.008 |
| adj_R2 | 0.00701 | 0.00701 |
| F | 2.579 | 2.579 |
Note: Robust t-statistics in parentheses. *** p < 0.01, ** p < 0.05, * p < 0.1.
Table 10.
Robustness testing—panel C.
| (1) | (2) | |
|---|---|---|
| BIG4 = 0 | BIG4 = 1 | |
| VARIABLES | REM | REM |
| REL | −0.312 ** | −0.148 *** |
| (0.146) | (0.0517) | |
| SIZE | 0.000208 | −0.0113 *** |
| (0.00521) | (0.00225) | |
| LEV | 0.116 *** | 0.0538 ** |
| (0.0393) | (0.0212) | |
| ROA | −0.393 *** | −0.532 *** |
| (0.0824) | (0.0465) | |
| LOSS | −0.0616 ** | −0.0375 *** |
| (0.0283) | (0.0142) | |
| GDP | 0.0144 | −0.00672 |
| (0.0112) | (0.00426) | |
| LAW | −0.164 | −0.220 *** |
| (0.164) | (0.0601) | |
| Constant | 0.159 | 0.448 *** |
| (0.288) | (0.107) | |
| Observations | 11,149 | 9610 |
| R-squared | 0.005 | 0.032 |
Note: Standard errors in parentheses. *** p < 0.01, ** p < 0.05.
Disclaimer/Publisher’s Note: The statements, opinions and data contained in all publications are solely those of the individual author(s) and contributor(s) and not of MDPI and/or the editor(s). MDPI and/or the editor(s) disclaim responsibility for any injury to people or property resulting from any ideas, methods, instructions or products referred to in the content. |
© 2023 by the authors. Licensee MDPI, Basel, Switzerland. This article is an open access article distributed under the terms and conditions of the Creative Commons Attribution (CC BY) license (https://creativecommons.org/licenses/by/4.0/).
Share and Cite
MDPI and ACS Style
Toudas, K.S.; Zhu, J. The Effect of Religion in European Financial Statement Disclosures: A Real Earnings’ Management Case. J. Risk Financial Manag. 2023, 16, 464. https://doi.org/10.3390/jrfm16110464
AMA Style
Toudas KS, Zhu J. The Effect of Religion in European Financial Statement Disclosures: A Real Earnings’ Management Case. Journal of Risk and Financial Management. 2023; 16(11):464. https://doi.org/10.3390/jrfm16110464
Chicago/Turabian StyleToudas, Kanellos S., and Jinxiu Zhu. 2023. "The Effect of Religion in European Financial Statement Disclosures: A Real Earnings’ Management Case" Journal of Risk and Financial Management 16, no. 11: 464. https://doi.org/10.3390/jrfm16110464