

On the Measurement of Hedging Effectiveness for Long-Term Investment Guarantees


1
Département de Mathématiques et de Statistique, Université de Montréal, P.O. Box 6128, Station Centre-Ville, Montreal, QC H3C 3J7, Canada
2
Quantact Actuarial and Financial Mathematics Laboratory, Centre de Recherches Mathématiques, Université de Montréal, P.O. Box 6128, Station Centre-Ville, Montreal, QC H3C 3J7, Canada
3
Department of Mathematics and Statistics, University of Calgary, 2500 University Drive NW, Calgary, AB T2N 1N4, Canada
4
Département de Mathématiques, Université du Québec à Montréal, P.O. Box 8888, Station Centre-Ville, Montreal, QC H3C 3P8, Canada
*
Author to whom correspondence should be addressed.
J. Risk Financial Manag. 2023, 16(2), 112; https://doi.org/10.3390/jrfm16020112
Submission received: 22 November 2022
/
Revised: 21 January 2023
/
Accepted: 6 February 2023
/
Published: 10 February 2023
(This article belongs to the Special Issue Risk Management and Forecasting Methods in Finance)
Abstract
:Although the finance literature has devoted a lot of research into the development of advanced models for improving the pricing and hedging performance, there has been much less emphasis on approaches to measure dynamic hedging effectiveness. This article discusses a statistical framework based on regression analysis to measure the effectiveness of dynamic hedges for long-term investment guarantees. The importance of taking model risk into account is emphasized. The difficulties in reducing hedging risk to an appropriately low level lead us to propose a new perspective on hedging, and recognize it as a tool to modify the risk–reward relationship of the unhedged position.
1. Introduction
Risk management practices in the financial industry were put to a test during the financial crisis of the late 2000s. Many corporations did not measure their risk exposures appropriately and numerous institutional failures occurred (e.g., Lehman Brothers). Some financial risks, such as market risk, have a systematic component that cannot be diversified. To avoid having a large exposure to these types of risks, the corporation can establish a hedging strategy by trading in financial derivatives. To correctly evaluate the residual risk that remains, it must assess the effectiveness of this strategy for mitigating the underlying risk exposure. Suppose that an institution has sold a derivative and established a hedging strategy to manage its risk. Assume that the value of this derivative and of the hedge portfolio at some time in the future is X and Y, respectively. The hedged loss, or equivalently the hedging error, of the institution then corresponds to (a positive value indicates a loss while a negative value indicates a profit). The standard approach to measure hedging effectiveness is to calculate a statistic on the distribution of .
While many studies have proposed to improve the pricing and hedging performance of asset return models by incorporating stochastic volatility, jumps and multiple factors, the measurement of hedging effectiveness has received considerably less attention. For example, Bakshi et al. (1997) develop models admitting stochastic volatility, stochastic interest rates, and random jumps and test empirically the features which improve dynamic hedging performance of plain vanilla options. To measure hedging effectiveness, they calculate the average absolute deviation from zero of hedging errors based on dynamic delta and delta-vega strategies. These hedging errors are calculated based on a single rebalancing of the hedge (usually daily or weekly) and do not reflect the cumulative hedging error from the sale of the option until maturity. Similar approaches are applied in many other articles (e.g., Alexander and Kaeck 2012; Alexander et al. 2009, 2012; Alexander and Nogueira 2007; Bakshi et al. 2000; Branger et al. 2012; Dumas et al. 1998; François and Stentoft 2021; Hull and White 2017; Kaeck 2013; Kim and Kim 2004; Nandi 1998).1
The studies mentioned in the previous paragraph have two weaknesses when it comes to measuring hedging effectiveness. First, they ignore the relationship between X and Y and do not examine its strength. For instance, why is the standard deviation of high? Is it due to a systematic deviation from the ideal hedging relationship , or is it the consequence of a high residual standard error around an average relationship of ? In this work, we propose a simple statistical framework based on regression analysis to more thoroughly examine the effectiveness of a dynamic hedging strategy. Statistics based on the distribution of are good indicators of relative hedging performance and allow us to discriminate between competing hedging strategies. However, they are not good indicators of absolute hedging performance as they ignore the relationship between X and Y. Regression analysis allows us to assess hedging effectiveness in absolute terms and understand the sources of hedging ineffectiveness. To our knowledge, the use of regression analysis to measure the effectiveness of dynamic hedges has not been investigated in the finance or actuarial science literature. On the other hand, the accounting literature (e.g., Charnes et al. 2003; Finnerty and Grant 2002; Hailer and Rump 2005) has investigated the use of regression tools to measure the strength of a hedging relationship, but only in the context of very simple hedges which are not dynamic and not model dependent (e.g., hedging a spot index with a futures contract).2
The second weakness of empirical studies measuring hedging effectiveness in the finance literature is that they examine hedging errors calculated based on a single rebalancing of the hedge (usually daily or weekly) and do not reflect the cumulative hedging error from the sale of the option until maturity. The rationale for following such an approach is that traders assess their profits and gains on a daily or weekly basis and do not always keep their positions open until maturity. Therefore, it is acceptable to measure hedging effectiveness based on intermediate, rather than cumulative, hedging errors. However, intermediate hedging errors are influenced by the time to maturity and the moneyness of the option. For example, the hedge may be less dependent on the chosen model far from maturity and when the option is deep out-the-money. Consequently, when we calculate statistics based on intermediate hedging errors, we are aggregating observations that are not identically distributed. To alleviate this problem, most of the studies display statistics across different moneyness ranges, but not all of them separate their results according to time to maturity. However, empirical studies in the finance literature aim to discriminate among competing hedging strategies, and their main objective is, thus, the evaluation of relative hedging effectiveness. For this purpose, it is not problematic to consider intermediate hedging errors. Nevertheless, these errors only provide partial information with respect to the capacity of the hedge to replicate the desired payoff exactly, until maturity. Therefore, absolute hedging effectiveness is best assessed by examining the cumulative hedging error until maturity. We remark that recent studies examining the hedging performance of discrete-time econometric models have followed this approach (see, e.g., Augustyniak and Badescu 2021; Augustyniak et al. 2017, 2021; Badescu et al. 2014; Lassance and Vrins 2018).
The cumulative performance of the hedge is especially important in the context of variable annuities, which are investment products sold by life insurance companies that offer insurance features and benefit from tax deferment (see Hardy 2003, for an overview, and Feng et al. 2022, for a recent survey of the literature). This is in strong contrast to maturities of derivatives considered in the finance literature which rarely are above one year. Moreover, insurers are not traders and cannot close their positions by transferring them to a third party. In other words, investment guarantees are illiquid securities. Accordingly, all studies on dynamic hedging effectiveness of long-term investment guarantees in the actuarial literature have considered the cumulative hedging error until maturity (e.g., Augustyniak and Boudreault 2012, 2017; Coleman et al. 2006, 2007; Hardy 2003; Kling et al. 2011).
This article discusses a statistical framework based on both, regression analysis and the standard practice of calculating risk measures, to measure the effectiveness of dynamic hedges on absolute as well as relative terms. This framework is presented with a case study examining the effectiveness of the Black–Scholes delta hedging strategy under return path scenarios generated with a regime-switching GARCH model (RS-GARCH) in a variable annuity setting. We consider this hedging strategy for simplicity, but also because the majority of insurers in Canada manage equity risk in variable annuities using dynamic delta hedging strategies.3 Although the focus here is on the measurement of hedging effectiveness, rather than model risk, this risk is an integral part of the analysis as dynamic hedging strategies depend on model assumptions. The performance of the hedge depends on how well these assumptions represent reality. We consider an extended definition of model risk and include parameter risk as a specific type of model uncertainty, see Cont (2006, Remark 4.1) for a discussion. Model uncertainty refers to the combined effects of model and parameter risks. The purpose is not to distinguish between these two types of risks, but to examine the impact of particular types of model uncertainty on hedging effectiveness. In our case study, the variable annuity product hedged is a Guaranteed Minimum Maturity Benefit (GMMB) which ensures that the policyholder’s initial invested capital is protected against a market downturn over a set period of time.
This article is structured as follows. Section 2 describes the GMMB variable annuity product, presents our modeling assumptions and defines the variables that must be considered when evaluating hedging effectiveness. Section 3 illustrates how regression techniques can be used to evaluate hedging performance and discusses our results. Concluding remarks are provided in Section 4.
2. Modeling Framework
Before describing the statistical framework for measuring the effectiveness of dynamic hedges, we review some concepts in relation to the GMMB, introduce our assumptions and models, and explain how to calculate the insurer’s unhedged and cumulative hedged losses at maturity.
2.1. GMMB Variable Annuity Product
Suppose that an insured invests an amount in a GMMB variable annuity product that must be held to maturity T. The performance of the GMMB is assumed to track an investment portfolio from time to T, denoted by . Without loss of generality, let . As compensation for the guarantee offered, the insurer deducts a constant fee in proportion to the account value of the insured at a continuous annual rate of . Therefore, the account value of the insured, , satisfies the relationship:
At maturity T, the insured is entitled to , where G denotes the amount of the guarantee. If , the guarantee matures in-the-money and the insurer is responsible for the shortfall between the guarantee and the account value, i.e., its liability is the payoff of a put option: . The value of this put option at any time t under the Black–Scholes model, denoted by , is obtained from the following formula:
where r is the constant risk-free rate, is the constant annual volatility of the investment portfolio returns and denotes the standard normal cumulative distribution function. Moreover, the fair value of fees that will be collected by the insurer between times t and T is given by
To see why, we can interpret the charge as a dividend rate. The fair value of dividends to be received between times t and T is the difference between the fund value at time t, , and the prepaid forward price for a claim paying at time T, .
The net liability of the insurer at time t, i.e., the net obligation of the insurer towards the policyholder, is
A fair value for can be determined by setting the net liability at inception of the contract to zero:
Solving Equation (1) is not a difficult problem since the net liability is strictly decreasing in :
Consequently, the solution is unique and easily computed numerically.
We can rewrite Equation (1) as
where is the price at of a put option on the investment portfolio with maturity T and strike . This illustrates that an investment of in a GMMB product is equivalent to buying shares of the investment portfolio and put options on that index with strike price .
2.2. Market Dynamics
To realistically model return dynamics on the investment portfolio , we use a RS-GARCH model (see, e.g., Augustyniak 2014b; Augustyniak et al. 2018; Bauwens et al. 2010; Francq et al. 2001). We denote the log-return from time to t by , where . The RS-GARCH dynamics of , for , are defined by the following equations:
where , , are independent and identically distributed normal innovations with zero mean and unit variance. The return dynamics depend on an unobserved discrete-time process, , which is an ergodic time-homogeneous Markov chain that can take integer values from 1 to M. The transition matrix of this Markov chain is defined by the transition probabilities . The processes and are assumed independent. The notations and are used to represent the vectors and , respectively. The symbols and denote measurable functions with respect to a -field generated by the random variable and the random vector , respectively. Therefore, symbolizes the conditional mean of the return , , and represents its conditional variance . The vector denotes the parameters of the model. To ensure positivity of the variance, the following constraints are required: , , and . Since for , contains () free parameters.
In addition to modeling volatility persistence with GARCH dynamics, this model generates jumps in returns and in volatility through the switching mean in the return equation and the switching intercept in the GARCH equation, respectively.4 Therefore, it contains the essential ingredients of a good financial model as the presence of stochastic volatility, jumps in returns and jumps in volatility is widely documented in the finance literature (e.g., Broadie et al. 2007; Eraker et al. 2003). Moreover, previous studies have shown that the GARCH class of models has the ability to reproduce reasonably well the cross-section of option prices (see, e.g., Babaoğlu et al. 2018; Badescu et al. 2017; Bégin et al. 2020; Christoffersen et al. 2006, 2008, 2010; Christoffersen and Jacobs 2004).
The parameters of our RS-GARCH model are set based on the study of Augustyniak (2014a), where the process is estimated by maximum likelihood with regimes on daily and weekly percentage log-returns from the S&P 500 index. The use of two return modeling frequencies allows us to evaluate the consistency of results obtained with daily and weekly models. Table 1 provides the parameter estimates for the daily and weekly RS-GARCH models.
2.3. Hedging Strategy
To obtain an ideal hedge, the objective function that needs to be hedged is the net liability of the insurer. We remark that Hardy (2003) suggests to hedge the GMMB by replicating a long position in the underlying put position. However, the GMMB is not a standard put option as no premium is paid at inception of the contract. Since there is uncertainty in both the payoff and the premium, both components need to be hedged to completely eliminate risk. The uncertainty with respect to the fees is even greater when the policyholder is allowed to surrender their policy before maturity.
We assume that the insurer uses the Black–Scholes model to price the GMMB (i.e., to determine the annual fee assumption ) and to delta hedge its risk. A delta hedge under the Black–Scholes framework can be established by holding a position of in the underlying investment portfolio5 at time t, where
This involves selling () more shares of the investment portfolio than if only the put position was hedged as the delta of the put position is . The intuition behind this result is the following: If the value of the investment portfolio falls, the fair value of fees will be reduced (since fees are charged in proportion to the account value) and the additional short position in the investment portfolio will provide a hedge against this decrease in premium. Since the hedging strategy is not derived from the market model, we are able to analyze the robustness of the Black–Scholes delta hedge under RS-GARCH dynamics. The following assumptions are used:
where is the volatility parameter used in the Black–Scholes model to determine the fair value of fees and to calculate the hedge position in the investment portfolio. The value of satisfies Equation (1) with these assumptions. The volatility assumption corresponds to the unconditional annualized volatility for the daily RS-GARCH model when parameter risk is taken into account (see Section 2.4).6
2.4. Projection of the Insurer’s Loss
There are three variables that must be considered when evaluating hedging effectiveness:
When the insurer does not use a hedging strategy, their net loss at maturity is X. When he employs a hedging strategy, their net loss is . The losses are net because they take into account the fee income received by the insurer. To assess hedging effectiveness, we are interested in the relationship between X and Y and in the dispersion of around zero. Consequently, we must project many realizations of these variables by simulating return path scenarios.
First, we generated 100,000 scenarios of daily returns over years with the Black–Scholes model. Log-returns under the Black–Scholes model are independent and identically distributed normal variables. We used an annualized mean return of 7.2% and an annualized volatility of %. This simulation allows us to assess the effectiveness of the Black–Scholes delta hedge under an ideal situation where the hedging strategy is derived from the market model. In this context, hedging ineffectiveness arises solely from discrete rebalancing of the hedge portfolio as there is no model uncertainty. This type of hedging ineffectiveness is referred to as the discretization error of the hedge. Results obtained for the return projection under the Black–Scholes model serve as a benchmark and allow us to properly evaluate the impact of model uncertainty on the Black–Scholes delta hedging strategy.
Second, we generated 100,000 scenarios of daily and weekly returns over years with the two RS-GARCH models presented in Table 1. To evaluate the impact of parameter risk, we generated one set of scenarios with maximum likelihood estimates and another set of scenarios by drawing parameter vectors from the asymptotic normal distribution of the maximum likelihood estimator.
For each of the return path scenarios, the values of the investment portfolio, , and the account value, , are easily calculated. The net unhedged loss at maturity is
where for daily scenarios and for weekly scenarios.
To calculate the net hedged loss at maturity, the cumulative mark-to-market gain on the hedge must be subtracted from the net unhedged loss. The mark-to-market gain at time of the delta hedge established at time t is
where h represents the rebalancing frequency of the hedge portfolio. The cumulative mark-to-market gain on the hedge corresponds to the accumulated values of these gains to maturity:
3. Statistical Framework for Measuring the Effectiveness of Dynamic Hedges
This section explains how regression techniques can be used to investigate hedging effectiveness. The analysis is conducted for scenarios projected on a daily frequency and the hedge portfolio is assumed to be rebalanced daily.
3.1. Relationship between Y and X
Figure 1 illustrates the regression relationship between the cumulative mark-to-market gain on the hedge, Y, (denoted by hedge performance on the vertical axis) and the net unhedged loss at maturity, X, for 100,000 scenarios projected under the Black–Scholes model, the RS-GARCH model and the RS-GARCH model with parameter risk. On each graph, we show (1) the fitted linear regression line of the form “”, (2) the residual standard error (), and (3) Pearson’s and Spearman’s correlation coefficients ( and , respectively). Spearman’s correlation coefficient measures the relationship between the ranks of variables. These values are calculated based on all observations and based on only the part of the distribution for the net unhedged loss (X) contained between the 50th and 95th percentiles (between red lines). The reason for considering this area of the distribution is the following. When a put option is deep in-the-money or deep out-of-the money, its delta is very close to or 0, respectively, regardless of the model for the underlying. In these situations, hedging the put option entails less model uncertainty as the delta under the true model is closer to the Black–Scholes delta. Hence, the Black–Scholes delta hedge is expected to be more effective in the lower half and the upper part of the distribution for the net unhedged loss.
For scenarios projected with the Black–Scholes model, the correlation coefficients between the hedge performance (Y) and the net unhedged loss (X) are close to one for all observations and between the red lines. The regression relationship corresponds almost exactly to the equation , which was to be expected as the hedging strategy is constructed from the market model.
For RS-GARCH scenarios, the correlation coefficients calculated on all observations misrepresent the strength of the relationship between the hedge performance and the net unhedged loss as they markedly decrease when we consider the area between the red lines. With parameter risk, Spearman’s correlation coefficient is approximately 0.85 which is a sizable decrease relative to the value of 0.99 observed for the Black–Scholes scenarios. Moreover, the slope of the regression line is below one which indicates that the hedge portfolio falls short in offsetting the insurer’s loss. This is one advantage of using regression analysis to investigate hedging effectiveness as it tells us what proportion of the risk is not replicated on average. With parameter risk, over 2% of the risk is not offset while in between red lines this value increases to 3%. The intercept in the regression is also informative as it can detect a structural loss for the insurer due to hedging. This can in turn suggest that the GMMB product is underpriced. For example, with parameter risk, the intercept term is negative indicating a structural loss. Finally, the residual standard error is magnified by a factor of almost six with respect to the Black–Scholes scenarios and parameter risk accounts for approximately 25% of that increase. Therefore, model uncertainty much more significantly impacts than the average hedging relationship, .
The signs of hedging ineffectiveness observed under model uncertainty can be important because by hedging the net liability, the insurer protects himself against losses at the cost of limiting their upside potential. In fact, hedging can be viewed as a tool to modify the risk–reward relationship of the product, while it is clear that hedging reduces the overall risk, the resulting risk–reward relationship may be less attractive to the insurer if the strategy employed has inefficiencies. Therefore, an effective hedging strategy should not only reduce the risk of the insurer’s position, but also offer a way to improve the risk–reward tradeoff for the product. For example, suppose that instead of hedging the net liability, the insurer only hedges its liability, i.e., the put option. Hence, the fee income is not hedged and the Black–Scholes delta at time t is . Figure 2 illustrates the hedging relationship for this situation under the RS-GARCH model with parameter risk. We observe that in the first half of the distribution for the net unhedged loss, i.e., in 50% of the scenarios, the insurer is able to take advantage of a sizable upside because the fee income is not hedged. The tradeoff for this benefit is a reduced hedging effectiveness in the upper half of the distribution. On average, the hedging strategy falls short in offsetting 17% of the risk in between red lines and the negative intercept indicates a structural loss due to hedging. In the right tail of the net unhedged loss, most of the scatter points fall below the blue line, , implying that the net hedged loss of the insurer is positive. This example demonstrates that the effectiveness of a hedge should also be evaluated with respect to the risk–reward relationship it offers because a perfect hedge is infeasible in a practical context.
3.2. Relationship between and X
Having studied the relationship between Y and X, we now examine the dependence between the net hedged loss, , and the net unhedged loss, X. These two variables inevitably exhibit a form of dependence because, as mentioned previously, hedging effectiveness tends to be higher in the lower half and the upper part of the distribution for X. However, they should ideally be uncorrelated since what is desired is a hedging strategy whose effectiveness is uniform under a wide variety of scenarios. This is simply because hedging must protect the insurer against an unknown return path scenario which is to occur in the real-world.
Figure 3 illustrates the relationship between the net hedged loss and the net unhedged loss for 100,000 scenarios projected under the Black–Scholes model, the RS-GARCH model and the RS-GARCH model with parameter risk. On each graph, we show (1) Pearson’s correlation coefficient between X and (), (2) the standard deviation of (), and (3) the standard deviation of in between red lines (). As before, the area in between red lines spans the 50th to 95th percentiles of the distribution for X.
As expected, hedging errors are less dispersed in the tails of the distribution for the net unhedged loss and the scatter plots are organized in a diamond. Figure 3 clearly illustrates the impact of model and parameter risks. Model risk has a considerable influence on hedging effectiveness as the dispersion of scatter points under RS-GARCH scenarios is much greater than that observed under Black–Scholes scenarios. The impact of parameter risk is less than model risk, but it is still significant. In particular, parameter risk considerably widens the right tail of the distribution for the net unhedged loss, which implies that extreme investment losses are more likely.
Furthermore, the correlation coefficient between the net hedged loss and the net unhedged loss based on Black–Scholes scenarios is close to zero. This was to be expected since scenarios generating the largest hedging errors are generally those associated with a high volatility. As there is no dependence between returns and volatility in the Black–Scholes model, there should be no linear relationship between the net hedged loss and the net unhedged loss. In contrast, the RS-GARCH model entails a leverage effect, i.e., a negative relationship between returns and future volatility, since it simultaneously generates negative returns and positive jumps in volatility when it enters the crisis regime (regime two). Consequently, we expect a positive correlation between the net hedged loss and the net unhedged loss which is what is observed.
3.3. Distributions of X and
The left panel in Figure 4 illustrates the empirical density of the net unhedged loss (X) based on 100,000 scenarios projected under the RS-GARCH model with and without parameter risk. The right panel shows the Q-Q plot of standardized quantiles between these two distributions. This figure confirms that parameter risk has a non-negligible effect on the tails of the net unhedged loss, and it should therefore not be ignored.
Figure 5 repeats the previous exercise for the net hedged loss (). This is analogous to examining the distribution of residuals from the perfect hedging relationship . As observed previously, the dispersion of hedging errors with model risk is much greater than without it (top-left panel), but the Q-Q plot (bottom-left panel) allows us to quantify the magnitude of this discrepancy. Similar to the net unhedged loss, parameter risk widens the tails of the net hedged loss (see bottom-right panel), but its impact on the right tail is even more pronounced here.
However, the most interesting result is perhaps derived from the Q-Q plot in the top-right panel. This plot compares standardized quantiles between the distribution of hedging errors under the Black–Scholes model and those of the standard normal distribution, denoted by . It clearly shows that hedging risk is a heavy-tailed risk, even in the absence of model uncertainty. In other words, the insurer is exposed to possibly large losses, five to 10 standard deviations away from the mean loss, when he employs the ideal hedging strategy in the context of a very simple data generating process (Black–Scholes model) that does not even allow for jumps or stochastic volatility. These extreme losses are due to the discretization error of the hedge. In theory, this type of error can be reduced by rebalancing the hedge portfolio more frequently, say many times a day. However, in practice, frequent rebalancing of the hedge portfolio entails large transaction costs and sudden price jumps can occur in between rebalancing times. Hedging at very high frequencies also implies additional model uncertainty (further deviations from the normal distribution) as the distribution of high frequency returns is more volatile and has heavier tails than the one associated with daily or weekly log-returns. This discussion emphasizes that the insurer should not aim for a perfect hedge, but for one that offers a desired risk–reward tradeoff. In practice, hedging significantly reduces the overall risk of loss, but a residual heavy-tailed hedging risk remains. For a hedging strategy to be effective, the insurer must be rewarded for taking this risk.
3.4. Risk Measures
The conventional approach to measuring hedging effectiveness and discriminating among competing strategies is based on measures of dispersion and risk measures calculated on the distribution for the net unhedged loss (). For example, we can consider the mean, standard deviation (StDev), average absolute deviation from zero (AAD),7 conditional tail expectation (CTE), and value at risk (VaR). The StDev and the AAD measure the dispersion of hedging errors around the mean and zero, respectively. The CTE and VaR measure the heaviness of the right tail of the distribution for . These statistics can offer a good way to summarize important elements of the distribution for and discriminate among competing hedging strategies. However, information about the relationship between X and Y is lost.
This section uses risk measures to determine how the rebalancing frequency of the hedge portfolio impacts hedging effectiveness. We also examine the consistency of results obtained with daily and weekly RS-GARCH models estimated in Table 1. Table 2 shows the results for the analysis of hedge rebalancing frequency based on 100,000 scenarios projected under the Black–Scholes model and the RS-GARCH model with parameter risk. First, we observe that increasing this frequency lowers risk measures and thus improves hedging effectiveness of the Black–Scholes delta hedge with or without model uncertainty. However, this improvement is not as significant in the context of model uncertainty. For example, from a monthly to a daily rebalancing frequency, the 95% CTE is reduced by a factor of five for the Black–Scholes model and by a factor of only 1.6 with model uncertainty. This implies that the reduction in the discretization error is greater than the increase in model error (at frequencies studied here), but model error accounts for a greater proportion of the total hedging error at higher rebalancing frequencies. For instance, daily rebalancing offers little improvement over weekly rebalancing and may even be less effective once transaction costs are taken into account.
Although daily rebalancing generates the lowest risk measures, the mean loss of the insurer is approximately zero. This implies that he is not rewarded for assuming hedging risk. In contrast, when he does not hedge, their mean loss is negative, implying a profit, but he is exposed to very large losses. Since market risk is not diversifiable, the insurer may not tolerate such an exposure and prefer to hedge. However, when a classic risk–neutral pricing approach is used to price the product, hedging risk is not considered and the hedging strategy may result in an unattractive risk–reward relationship. To address this issue, insurers generally perform pricing with conservative assumptions and include a margin for profit. However, this methodology does not consider hedging risk directly. It seems preferable to incorporate this risk into pricing and construct a hedging strategy that offers a desirable risk–reward tradeoff.
Table 3 examines the consistency of results obtained with daily and weekly RS-GARCH models estimated in Table 1. 100,000 return path scenarios are projected for each one of these models taking parameter risk into account. First, we observe that the 95% CTE and the 99% VaR of the net unhedged loss differ markedly, suggesting that long-term investment risk is difficult to measure accurately. This is in part due to the difficulty in estimating the average mean return, i.e., the drift dynamics of the underlying asset. For example, the daily RS-GARCH model generates an average annualized mean return of 7.1%. In contrast, we obtain an average annualized mean return of 4.6% for the weekly model. This explains, in part, why higher risk measures are computed for the net unhedged loss based on the weekly model. Moreover, the estimation period has an even greater influence on the drift assumption. Since future drift dynamics are difficult to infer from historical data, it is preferable to use a risk management strategy whose dependence on this assumption is weak. Fortunately, hedging generally provides such an outcome.
We observe that risk measures at different rebalancing frequencies generally fall in a comparable range for the daily and weekly models. However, they are a little higher for the weekly model. This is mainly due to increased parameter risk at a weekly frequency caused by a smaller historical sample. Although the choice of data frequency does influence results, it does not do so enough to alter conclusions.
4. Concluding Remarks
We have discussed a statistical framework based on regression analysis to measure the effectiveness of dynamic hedging strategies and evaluated how model uncertainties can impact this effectiveness in a variable annuity setting. We found that model uncertainty has a limited impact on the average proportion of the risk that is not replicated with the Black–Scholes delta hedge. However, this model uncertainty considerably increases the residual standard error of the hedging relationship, .
The difficulties in reducing hedging risk to an appropriately low level lead us to suggest a new perspective on the role of hedging. The traditionally accepted purpose of hedging is risk elimination, or maximum risk reduction. However, as a perfect hedge is unattainable and the capacity of risk reduction is limited in practice, hedging should be reinterpreted as a tool to modify the risk–reward relationship of the unhedged position. In this framework, the role of hedging is to reduce risk to an acceptable level (not necessarily to a maximum level), and offer the highest reward for bearing it. For instance, the risk–reward relationship of the insurer may improve if he decides not to hedge the fees in certain situations or hedge only a portion of the liability. Moreover, as long-term investment guarantees are complicated to hedge due to their exposure to a large variety of risks, the valuation of these guarantees could be more accurate if the effectiveness of the hedging strategy is taken into account in the pricing process. Although insurers can use conservative assumptions and demand large risk premiums for assuming the underlying risks when pricing investment guarantees, we find that hedging effectiveness should also be an important factor to consider for valuation purposes. Such an approach deviates from the traditional risk-neutral valuation framework by incorporating hedging risk directly into the pricing methodology, as opposed to indirectly with conservative assumptions. This new perspective on hedging constitutes an interesting avenue for future research in actuarial applications.
Author Contributions
Conceptualization, methodology, formal analysis, and investigation: M.A. and M.B. Software and writing: M.A. Project administration, review and editing, and validation: A.B. All authors have read and agreed to the published version of the manuscript.
Funding
Financial support from the Natural Sciences and Engineering Research Council of Canada (NSERC) is gratefully acknowledged by all authors.
Data Availability Statement
Not applicable.
Acknowledgments
The authors thank the anonymous referees for their helpful comments which improved the paper.
Conflicts of Interest
The authors declare no conflict of interest.
| 1 | Branger et al. (2012) and Kaeck (2013) improved on the methodology to measure hedging effectiveness by comparing the distributions of anticipated and realized hedging errors. Anticipated hedging errors are those obtained when the model used to determine the hedge coincides with the data generating process. Realized hedging errors correspond to those that are observed when the hedging strategy is implemented on empirical data or on simulated data based on a data generating process that is not consistent with the model used for hedging. If the distributions of anticipated and realized hedging errors differ significantly, this suggests some form of model misspecification in the hedge. |
| 2 | The interest of the accounting literature for measuring hedging effectiveness is due to Statements of Financial Accounting Standards No. 133, Accounting for Derivative Instruments and Hedging Activities, commonly known as FAS 133. FAS 133, which came into effect in the U.S. at the turn of the century, requires that all derivatives entered into by a corporation must be marked to market and changes in their values reported in the income statement. This accounting treatment can create earnings volatility when derivatives are used for risk management purposes as the timing of gains and losses on the hedged items may not be matched with those on the corresponding hedging derivatives. To remedy this problem, FAS 133 allows corporations to match the timing of these gains and losses, provided that they demonstrate and document that the hedge is highly effective in offsetting changes in fair value for the risks being hedged. FAS 133 does not endorse any specific testing methodology, but recommends the use of statistical tests. A good overview of approaches proposed in the accounting literature for measuring hedging effectiveness is given by Charnes et al. (2003), Finnerty and Grant (2002), and Hailer and Rump (2005). |
| 3 | The “Report of the Task Force on Segregated Fund Liability and Capital Methodologies” produced by the Canadian Institute of Actuaries states that “typically delta and rho are hedged while vega and gamma are only monitored” (see Canadian Institute of Actuaries 2010). A survey performed by Watson (2013) also indicates that U.S. insurers mainly hedge delta and rho risks from their variable annuity portfolio. Although we did not include interest rate risk in our modeling framework for simplicity, our approach to measure hedging effectiveness can be applied to more general modeling settings and hedging strategies. |
| 4 | The switching mean does not necessarily generate a jump in returns, but there is a high likelihood of observing a significant negative return when the model enters the crisis regime. When jump-diffusion models are discretized, the occurrence of a negative jump is equivalent to observing a large negative return in a given time interval. |
| 5 | In our study, we suppose for simplicity that one can buy and sell shares of the investment portfolio tracked by the variable annuity. In practice, variable annuities invest in mutual funds which are relatively illiquid and cannot be shorted. As a result, insurers must construct their hedging strategies using financial instruments that are both liquid and highly correlated with the mutual fund. This exposes the hedging strategy to basis risk: the risk that price fluctuations in the underlying asset cannot be perfectly replicated by trading in available instruments. Recent studies showed that basis risk significantly affects hedging effectiveness, notably in the context of variable annuities (see, e.g., Ankirchner et al. 2014; Bauer 2020; Li et al. 2022; Trottier et al. 2018). |
| 6 | Alternative approaches can be considered to determine the volatility parameter in the Black–Scholes model. For example, it can be set based on forward-looking measures of volatility such as the implied volatility surface extracted from option price data. Previous empirical studies have showed that the variance risk premium is typically negative (see, e.g., Bakshi and Kapadia 2003; Carr and Wu 2006, 2009; Clark and Dickson 2019; Israelov and Klein 2016), which implies that the risk–neutral volatility is expected to be larger than the real-world volatility. Although a higher volatility leads to higher option prices, it is unclear whether the use of a volatility assumption inferred from derivative prices is more effective in a variable annuity hedging context. For instance, Augustyniak and Boudreault (2017) compared hedging effectiveness using a historical volatility estimate to a calibration based on a measure of the VIX and found that “forward-looking measures of volatility may not lead to better volatility inputs than measures based on historical data.” We refer to Section 5.8 in Augustyniak and Boudreault (2017) for a detailed discussion on the calibration of the volatility parameter. |
| 7 | Given n sampled values from a random variable Z, denoted by , the AAD is given by
|
References
- Alexander, Carol, and Andreas Kaeck. 2012. Does model fit matter for hedging? Evidence from FTSE 100 options. Journal of Futures Markets 32: 609–38. [Google Scholar] [CrossRef]
- Alexander, Carol, Andreas Kaeck, and Leonardo M. Nogueira. 2009. Model risk adjusted hedge ratios. Journal of Futures Markets 29: 1021–49. [Google Scholar] [CrossRef]
- Alexander, Carol, and Leonardo M. Nogueira. 2007. Model-free hedge ratios and scale-invariant models. Journal of Banking & Finance 31: 1839–61. [Google Scholar] [CrossRef]
- Alexander, Carol, Alexander Rubinov, Markus Kalepky, and Stamatis Leontsinis. 2012. Regime-dependent smile-adjusted delta hedging. Journal of Futures Markets 32: 203–29. [Google Scholar] [CrossRef]
- Ankirchner, Stefan, Judith C. Schneider, and Nikolaus Schweizer. 2014. Cross-hedging minimum return guarantees: Basis and liquidity risks. Journal of Economic Dynamics and Control 41: 93–109. [Google Scholar] [CrossRef]
- Augustyniak, Maciej. 2014a. Estimation du modèle GARCH à changement de régimes et son utilité pour quantifier le risque de modèle dans les applications financières en actuariat. Ph.D. thesis, Université de Montréal, Montréal, QC, Canada. Available online: http://hdl.handle.net/1866/10826 (accessed on 22 November 2022).
- Augustyniak, Maciej. 2014b. Maximum likelihood estimation of the Markov-switching GARCH model. Computational Statistics & Data Analysis 76: 61–75. [Google Scholar] [CrossRef]
- Augustyniak, Maciej, and Alexandru Badescu. 2021. On the computation of hedging strategies in affine garch models. Journal of Futures Markets 41: 710–35. [Google Scholar] [CrossRef]
- Augustyniak, Maciej, Alexandru Badescu, and Jean-François Bégin. 2021. A discrete-time hedging framework with multiple factors and fat tails: On what matters. Journal of Econometrics 232: 416–44. [Google Scholar] [CrossRef]
- Augustyniak, Maciej, and Mathieu Boudreault. 2012. An out-of-sample analysis of investment guarantees for equity-linked products: Lessons from the financial crisis of the late 2000s. North American Actuarial Journal 16: 183–206. [Google Scholar] [CrossRef]
- Augustyniak, Maciej, and Mathieu Boudreault. 2017. Mitigating interest rate risk in variable annuities: An analysis of hedging effectiveness under model risk. North American Actuarial Journal 21: 502–25. [Google Scholar] [CrossRef]
- Augustyniak, Maciej, Mathieu Boudreault, and Manuel Morales. 2018. Maximum likelihood estimation of the Markov-switching GARCH model based on a general collapsing procedure. Methodology and Computing in Applied Probability 20: 165–88. [Google Scholar] [CrossRef]
- Augustyniak, Maciej, Frédéric Godin, and Clarence Simard. 2017. Assessing the effectiveness of local and global quadratic hedging under GARCH models. Quantitative Finance 17: 1305–18. [Google Scholar] [CrossRef]
- Babaoğlu, Kadir, Peter Christoffersen, Steven Heston, and Kris Jacobs. 2018. Option valuation with volatility components, fat tails, and nonmonotonic pricing kernels. Review of Asset Pricing Studies 8: 183–231. [Google Scholar] [CrossRef]
- Badescu, Alexandru, Zhenyu Cui, and Juan-Pablo Ortega. 2017. Non-affine GARCH option pricing models, variance-dependent kernels, and diffusion limits. Journal of Financial Econometrics 15: 602–48. [Google Scholar] [CrossRef]
- Badescu, Alexandru, Robert J. Elliott, and Juan-Pablo Ortega. 2014. Quadratic hedging schemes for non-Gaussian GARCH models. Journal of Economic Dynamics & Control 42: 13–32. [Google Scholar] [CrossRef]
- Bakshi, Gurdip, Charles Cao, and Zhiwu Chen. 1997. Empirical performance of alternative option pricing models. The Journal of Finance 52: 2003–49. [Google Scholar] [CrossRef]
- Bakshi, Gurdip, Charles Cao, and Zhiwu Chen. 2000. Pricing and hedging long-term options. Journal of Econometrics 94: 277–318. [Google Scholar] [CrossRef]
- Bakshi, Gurdip, and Nikunj Kapadia. 2003. Delta-hedged gains and the negative market volatility risk premium. Review of Financial Studies 16: 527–66. [Google Scholar] [CrossRef]
- Bauer, Jan. 2020. Hedging of variable annuities under basis risk. Asia-Pacific Journal of Risk and Insurance 14: 20190040. [Google Scholar] [CrossRef]
- Bauwens, Luc, Arie Preminger, and Jeroen V. K. Rombouts. 2010. Theory and inference for a Markov switching GARCH model. The Econometrics Journal 13: 218–44. [Google Scholar] [CrossRef] [Green Version]
- Bégin, Jean-François, Christian Dorion, and Geneviève Gauthier. 2020. Idiosyncratic jump risk matters: Evidence from equity returns and options. Review of Financial Studies 33: 155–211. [Google Scholar] [CrossRef]
- Branger, Nicole, Eva Krautheim, Christian Schlag, and Norman Seeger. 2012. Hedging under model misspecification: All risk factors are equal, but some are more equal than others. Journal of Futures Markets 32: 397–430. [Google Scholar] [CrossRef]
- Broadie, Mark, Mikhail Chernov, and Michael Johannes. 2007. Model specification and risk premia: Evidence from futures options. The Journal of Finance 62: 1453–90. [Google Scholar] [CrossRef]
- Canadian Institute of Actuaries. 2010. Report of the Task Force on Segregated Fund Liability and Capital Methodologies. Document 210053. Ottawa: Canadian Institute of Actuaries. [Google Scholar]
- Carr, Peter, and Liuren Wu. 2006. A tale of two indices. The Journal of Derivatives 13: 13–29. [Google Scholar] [CrossRef]
- Carr, Peter, and Liuren Wu. 2009. Variance risk premiums. Review of Financial Studies 22: 1311–41. [Google Scholar] [CrossRef]
- Charnes, John M., Paul Koch, and Henk Berkman. 2003. Measuring hedge effectiveness for FAS 133 compliance. Journal of Applied Corporate Finance 15: 95–103. [Google Scholar] [CrossRef]
- Christoffersen, Peter, Christian Dorion, Kris Jacobs, and Yintian Wang. 2010. Volatility components, affine restrictions, and nonnormal innovations. Journal of Business & Economic Statistics 28: 483–502. [Google Scholar] [CrossRef]
- Christoffersen, Peter, Steve Heston, and Kris Jacobs. 2006. Option valuation with conditional skewness. Journal of Econometrics 131: 253–84. [Google Scholar] [CrossRef]
- Christoffersen, Peter, and Kris Jacobs. 2004. Which GARCH model for option valuation? Management Science 50: 1204–21. [Google Scholar] [CrossRef]
- Christoffersen, Peter, Kris Jacobs, Chayawat Ornthanalai, and Yintian Wang. 2008. Option valuation with long-run and short-run volatility components. Journal of Financial Economics 90: 272–97. [Google Scholar] [CrossRef] [Green Version]
- Clark, Steven P., and Mike Dickson. 2019. Performance expectations of basic options strategies may be different than you think. Journal of Asset Management 20: 91–102. [Google Scholar] [CrossRef]
- Coleman, Thomas F., Yohan Kim, Yuying Li, and Maria-Cristina Patron. 2007. Robustly hedging variable annuities with guarantees under jumps and volatility risks. The Journal of Risk and Insurance 74: 347–76. [Google Scholar] [CrossRef]
- Coleman, Thomas F., Yuying Li, and Maria-Cristina Patron. 2006. Hedging guarantees in variable annuities under both equity and interest rate risks. Insurance: Mathematics & Economics 38: 215–28. [Google Scholar] [CrossRef]
- Cont, Rama. 2006. Model uncertainty and its impact on the pricing of derivative instruments. Mathematical Finance 16: 519–47. [Google Scholar] [CrossRef]
- Dumas, Bernard, Jeff Fleming, and Robert E. Whaley. 1998. Implied volatility functions: Empirical tests. The Journal of Finance 53: 2059–106. [Google Scholar] [CrossRef]
- Eraker, Bjorn, Michael Johannes, and Nicholas Polson. 2003. The impact of jumps in volatility and returns. The Journal of Finance 58: 1269–300. [Google Scholar] [CrossRef]
- Feng, Runhuan, Guojun Gan, and Ning Zhang. 2022. Variable annuity pricing, valuation, and risk management: A survey. Scandinavian Actuarial Journal 2022: 867–900. [Google Scholar] [CrossRef]
- Finnerty, John D., and Dwight Grant. 2002. Alternative approaches to testing hedge effectiveness under SFAS No. 133. Accounting Horizons 16: 95–108. [Google Scholar] [CrossRef]
- François, Pascal, and Lars Stentoft. 2021. Smile-implied hedging with volatility risk. Journal of Futures Markets 41: 1220–40. [Google Scholar] [CrossRef]
- Francq, Christian, Michel Roussignol, and Jean-Michel Zakoïan. 2001. Conditional heteroskedasticity driven by hidden Markov chains. Journal of Time Series Analysis 22: 197–220. [Google Scholar] [CrossRef]
- Hailer, Angelika C., and Siegfried M. Rump. 2005. Evaluation of hedge effectiveness tests. Journal of Derivatives Accounting 2: 31–51. [Google Scholar] [CrossRef]
- Hardy, Mary R. 2003. Investment Guarantees: Modeling and Risk Management for Equity-Linked Life Insurance. Hoboken: John Wiley & Sons. [Google Scholar]
- Hull, John, and Alan White. 2017. Optimal delta hedging for options. Journal of Banking & Finance 82: 180–90. [Google Scholar] [CrossRef]
- Israelov, Roni, and Matthew Klein. 2016. Risk and return of equity index collar strategies. The Journal of Alternative Investments 19: 41–54. [Google Scholar] [CrossRef]
- Kaeck, Andreas. 2013. Hedging surprises, jumps, and model misspecification: A risk management perspective on hedging S&P 500 options. Review of Finance 17: 1535–69. [Google Scholar] [CrossRef]
- Kim, In Joon, and Sol Kim. 2004. Empirical comparison of alternative stochastic volatility option pricing models: Evidence from Korean KOSPI 200 index options market. Pacific-Basin Finance Journal 12: 117–42. [Google Scholar] [CrossRef]
- Kling, Alexander, Frederik Ruez, and Jochen Ruß. 2011. The impact of stochastic volatility on pricing, hedging and hedge efficiency of withdrawal benefit guarantees in variable annuities. Astin Bulletin 41: 511–45. [Google Scholar]
- Lassance, Nathan, and Frédéric Vrins. 2018. A comparison of pricing and hedging performances of equity derivatives models. Applied Economics 50: 1122–37. [Google Scholar] [CrossRef]
- Li, Wenchu, Thorsten Moenig, and Maciej Augustyniak. 2022. Basis Risk in Variable Annuities. Working Paper, SSRN eLibrary. Available online: http://https://papers.ssrn.com/sol3/papers.cfm?abstract_id=3531307 (accessed on 22 November 2022).
- Nandi, Saikat. 1998. How important is the correlation between returns and volatility in a stochastic volatility model? Empirical evidence from pricing and hedging in the S&P 500 index options market. Journal of Banking & Finance 22: 589–610. [Google Scholar] [CrossRef]
- Trottier, Denis-Alexandre, Frédéric Godin, and Emmanuel Hamel. 2018. Local hedging of variable annuities in the presence of basis risk. Astin Bulletin 48: 611–46. [Google Scholar] [CrossRef]
- Watson, Towers. 2013. Variable Annuity Hedging Survey: Sophistication Gains, Challenges Remain. Insights, August. [Google Scholar]
Figure 1.
Relationship between the hedge performance and the net unhedged loss based on 100,000 daily scenarios projected with the Black–Scholes model (top panel), the RS-GARCH model (bottom-left panel) and the RS-GARCH model with parameter risk (bottom-right panel).
Figure 1.
Relationship between the hedge performance and the net unhedged loss based on 100,000 daily scenarios projected with the Black–Scholes model (top panel), the RS-GARCH model (bottom-left panel) and the RS-GARCH model with parameter risk (bottom-right panel).
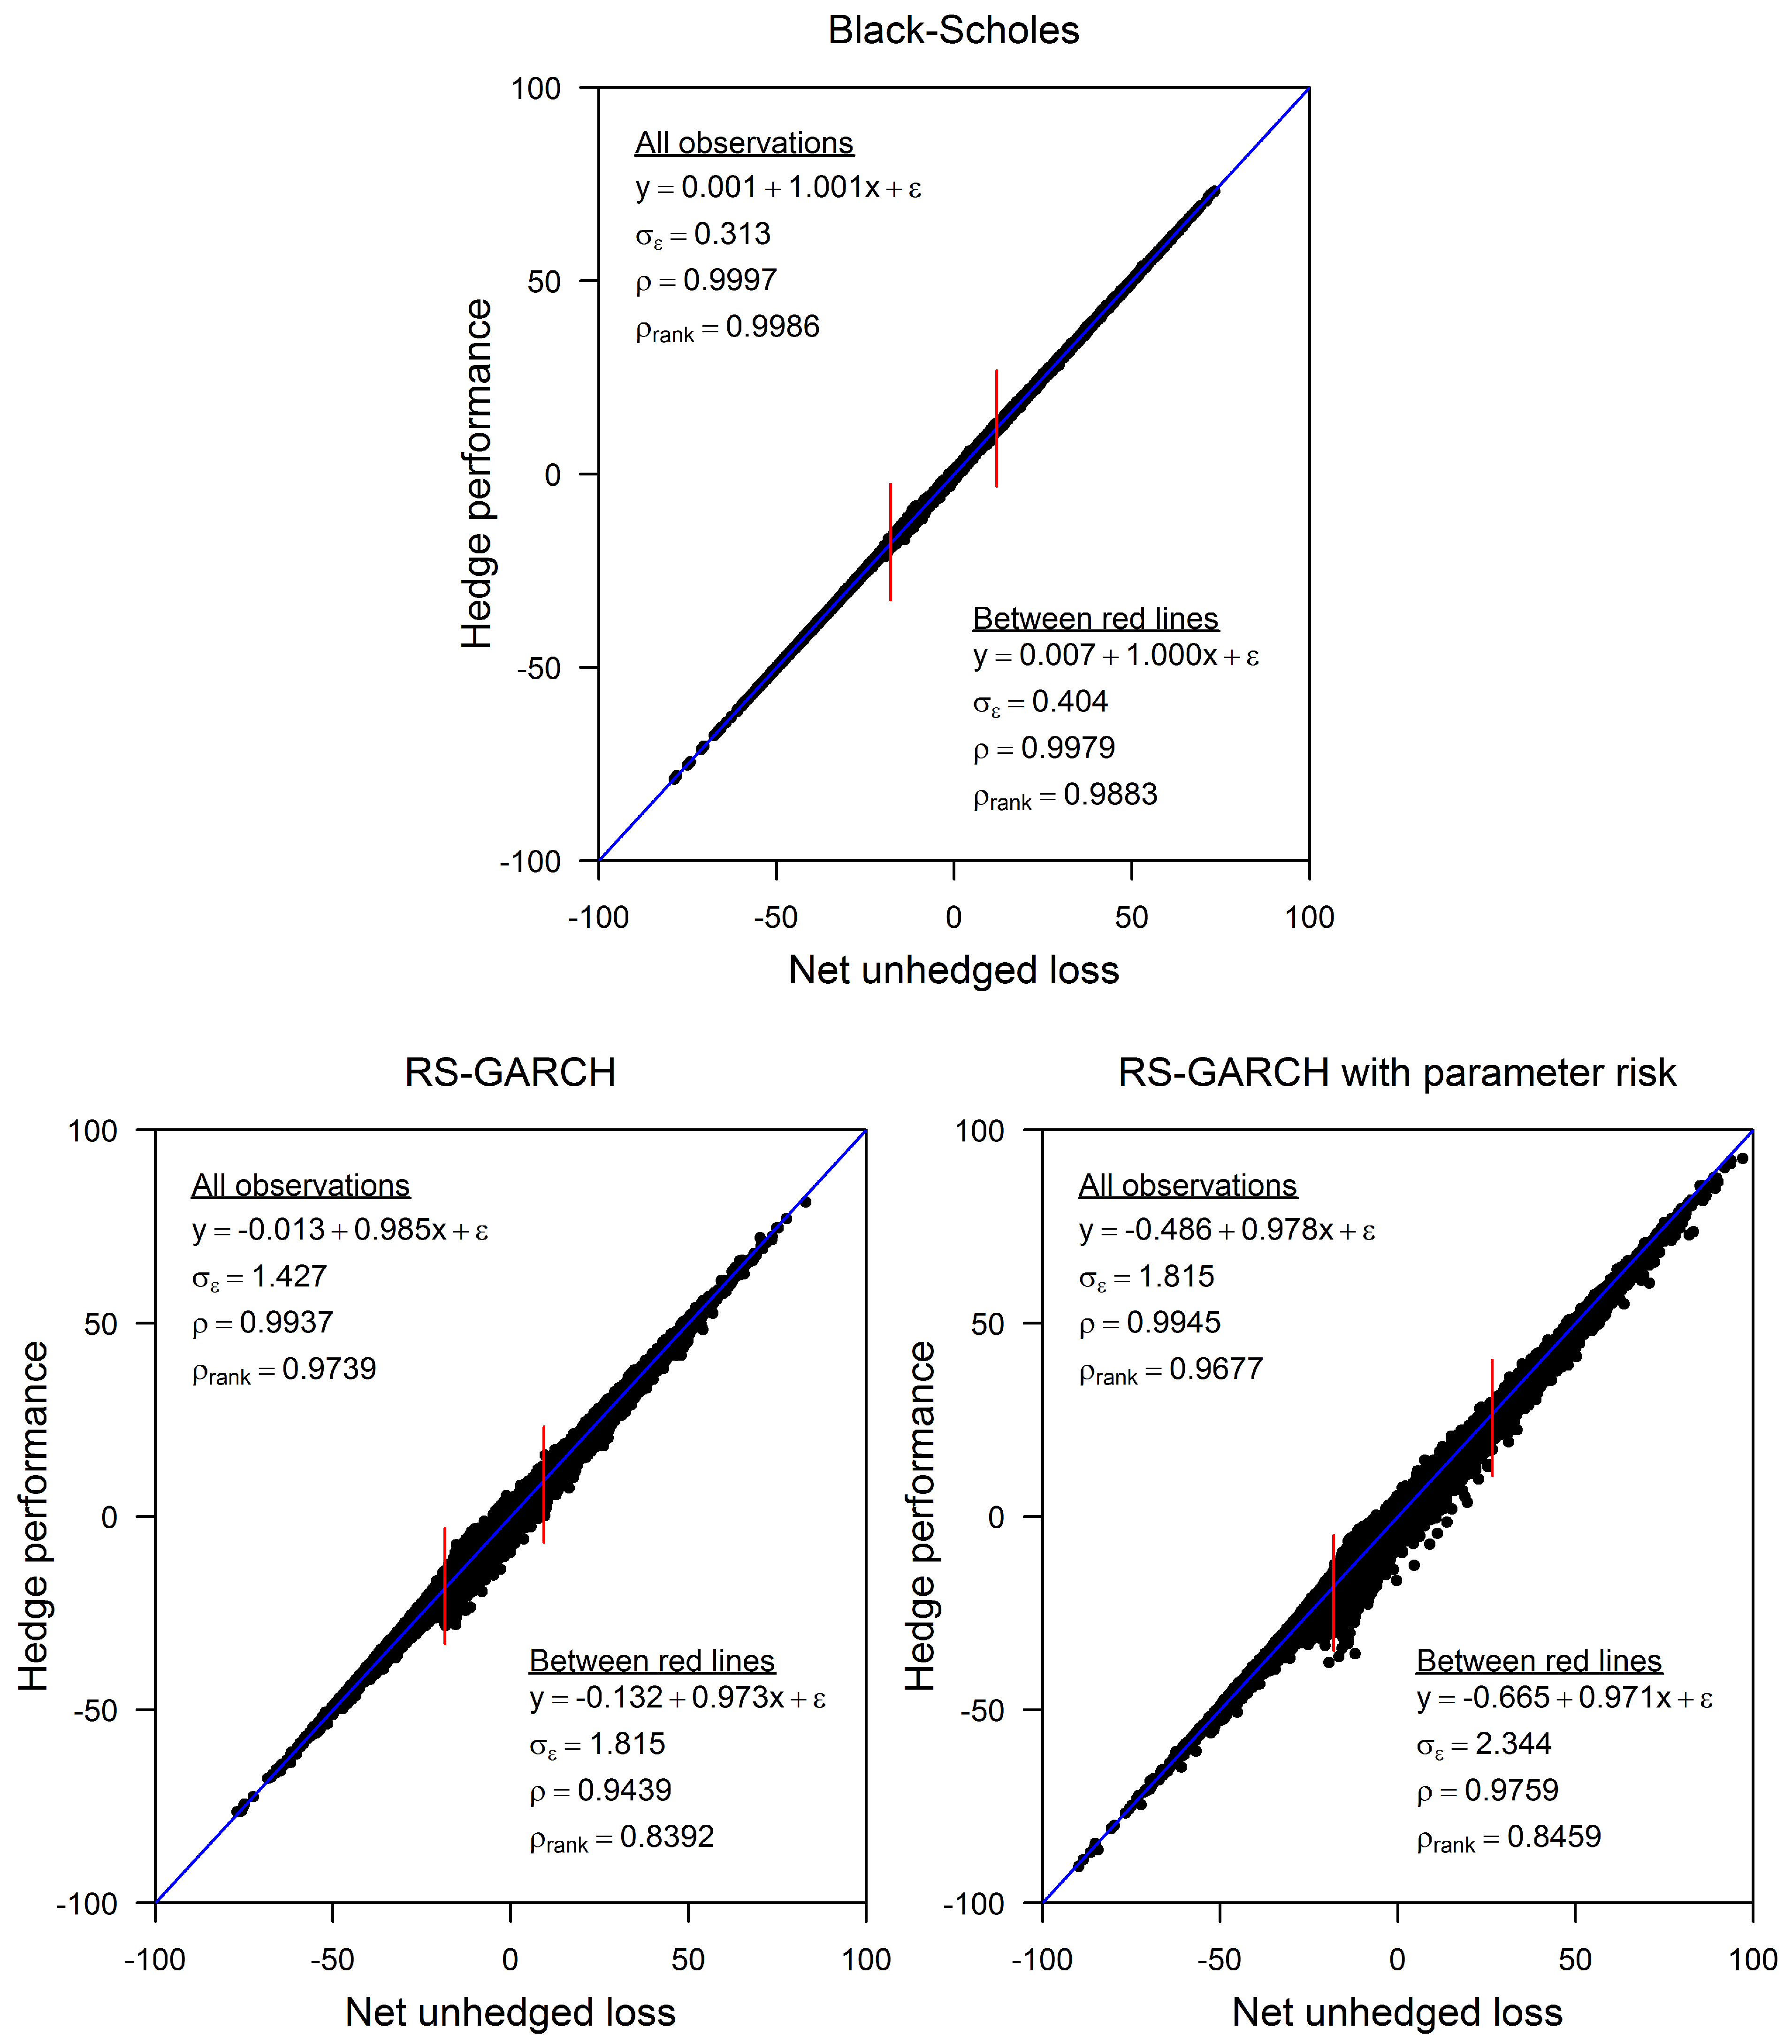
Figure 2.
Relationship between the hedge performance and the net unhedged loss based on 100,000 daily scenarios projected the RS-GARCH model with parameter risk. Only the underlying put option is delta hedged.
Figure 2.
Relationship between the hedge performance and the net unhedged loss based on 100,000 daily scenarios projected the RS-GARCH model with parameter risk. Only the underlying put option is delta hedged.
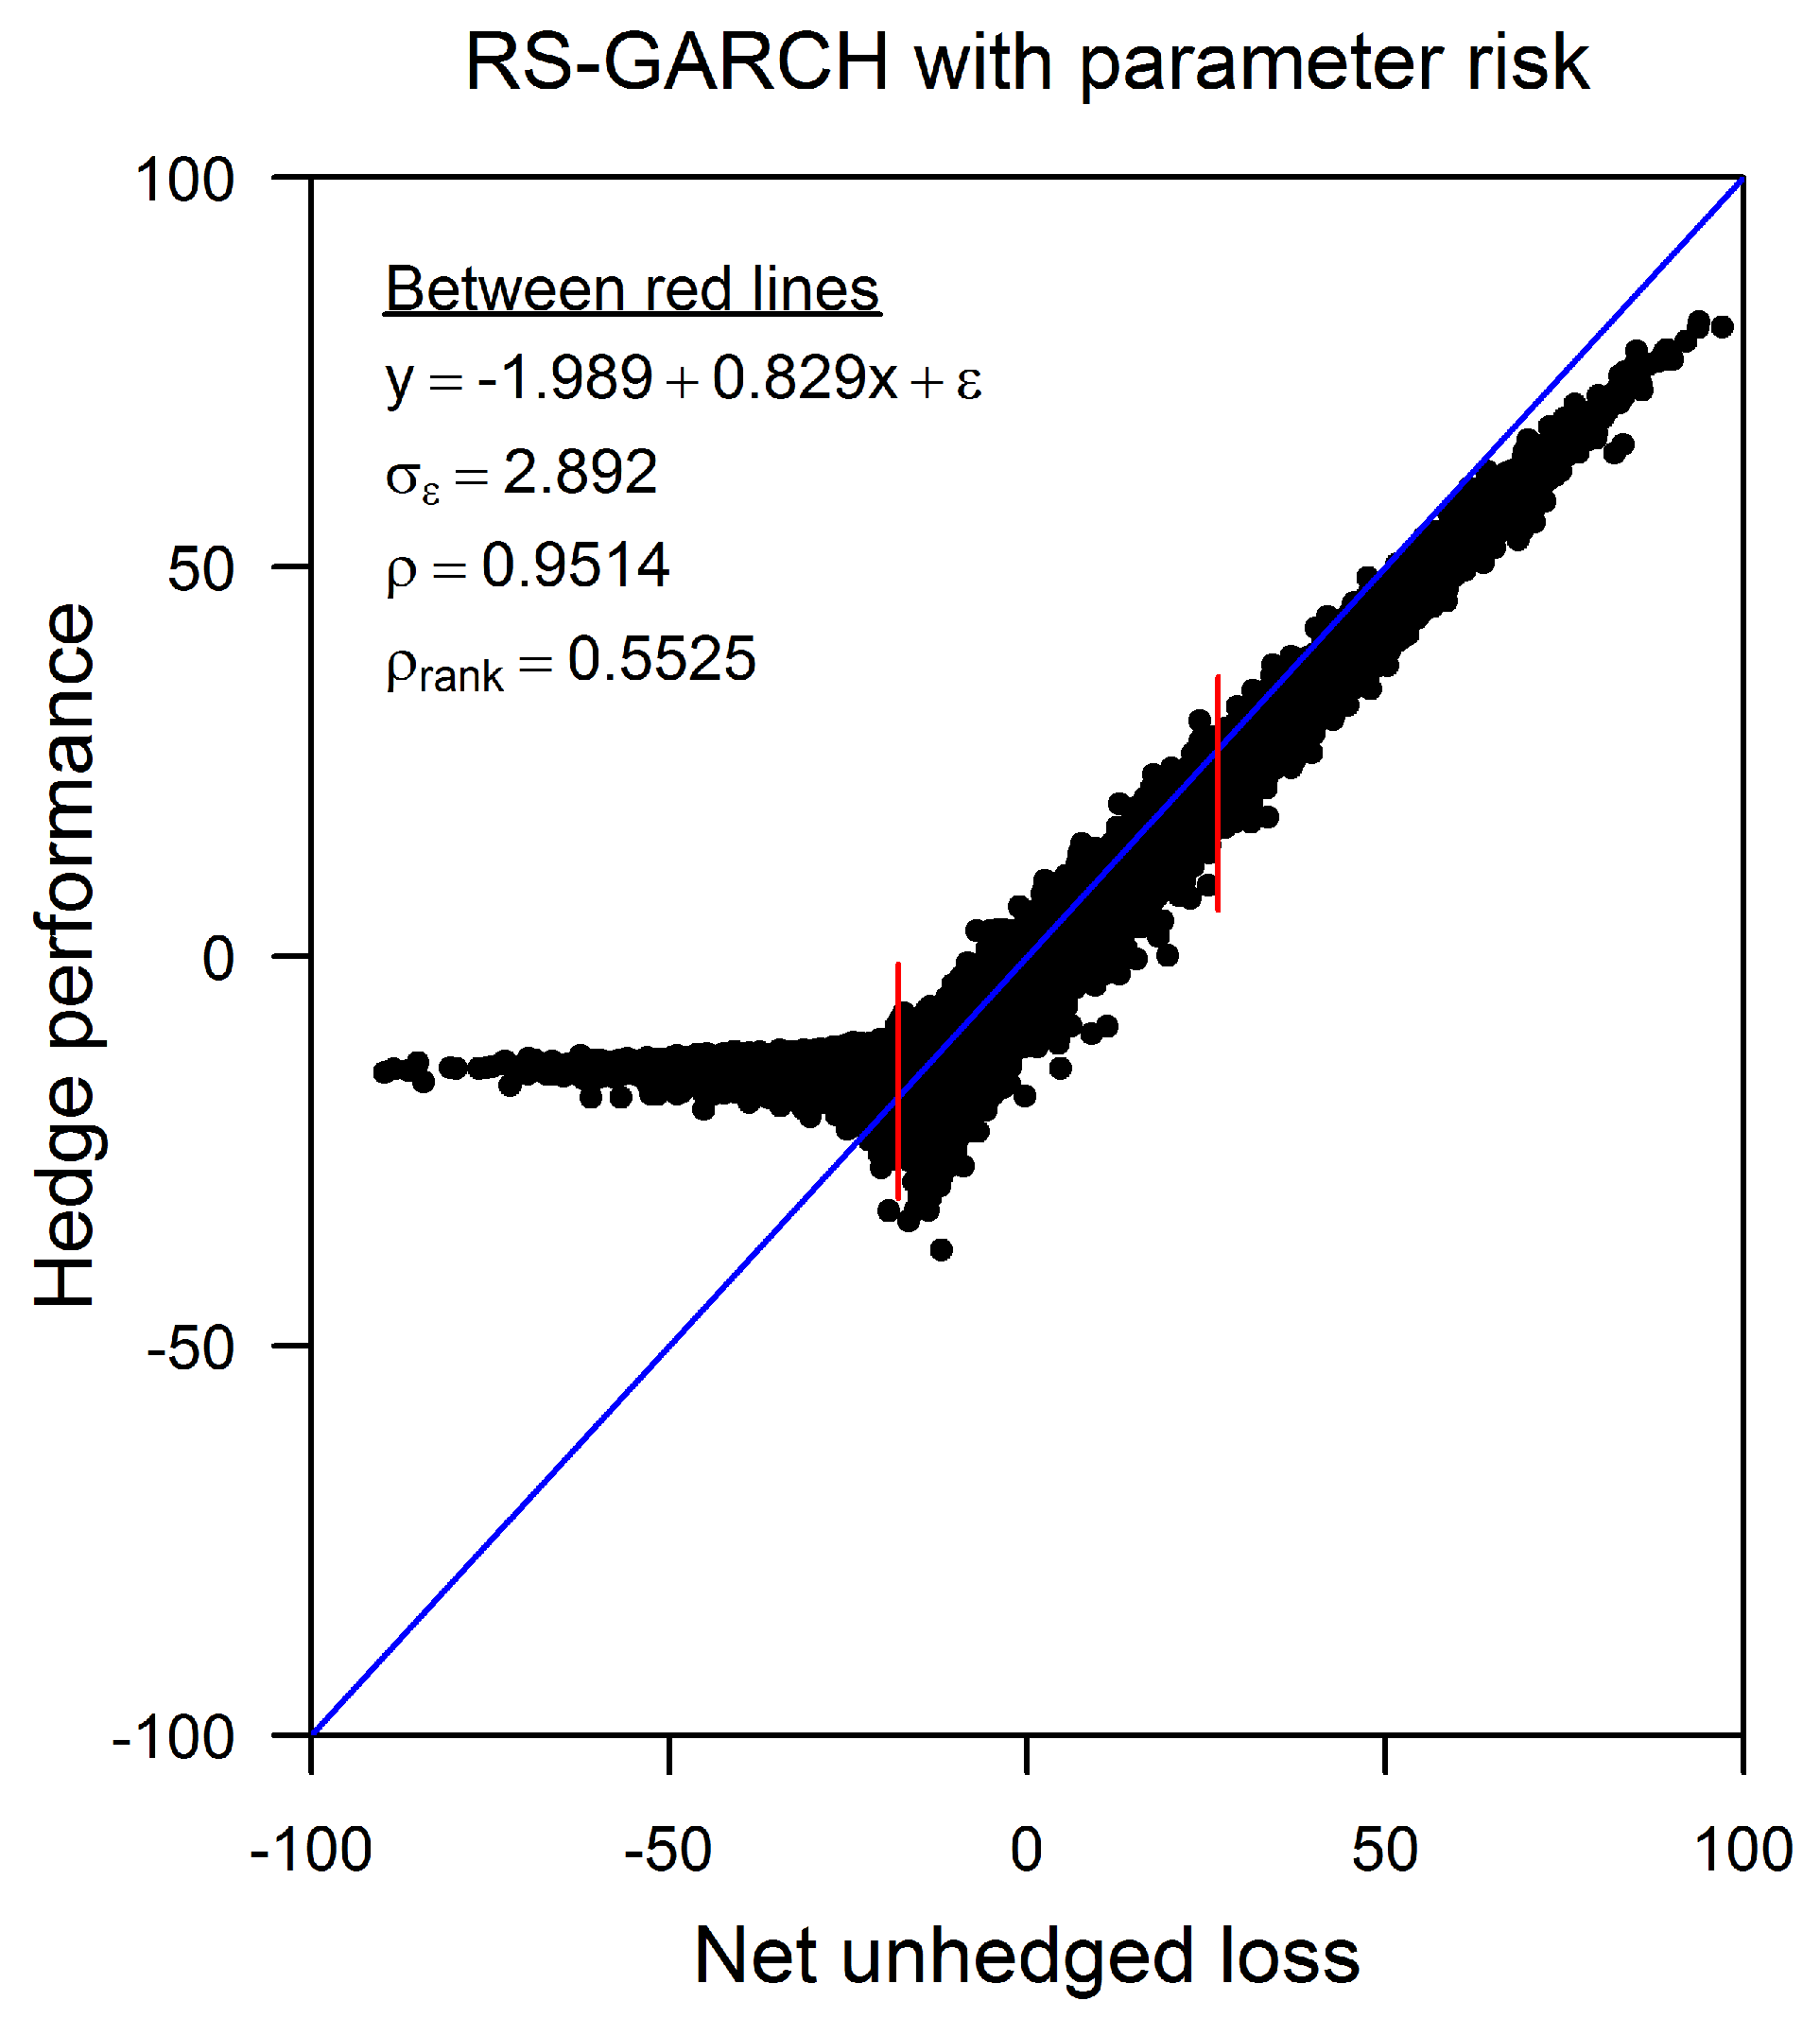
Figure 3.
Relationship between the net hedged loss and the net unhedged loss based on 100,000 daily scenarios projected with the Black–Scholes model (top panel), the RS-GARCH model (bottom-left panel) and the RS-GARCH model with parameter risk (bottom-right panel).
Figure 3.
Relationship between the net hedged loss and the net unhedged loss based on 100,000 daily scenarios projected with the Black–Scholes model (top panel), the RS-GARCH model (bottom-left panel) and the RS-GARCH model with parameter risk (bottom-right panel).

Figure 4.
(Left panel): Empirical density of the net unhedged loss (X) based on 100,000 daily scenarios projected under the RS-GARCH model with and without parameter risk. (Right panel): Q-Q plot of standardized quantiles between these two distributions.
Figure 4.
(Left panel): Empirical density of the net unhedged loss (X) based on 100,000 daily scenarios projected under the RS-GARCH model with and without parameter risk. (Right panel): Q-Q plot of standardized quantiles between these two distributions.
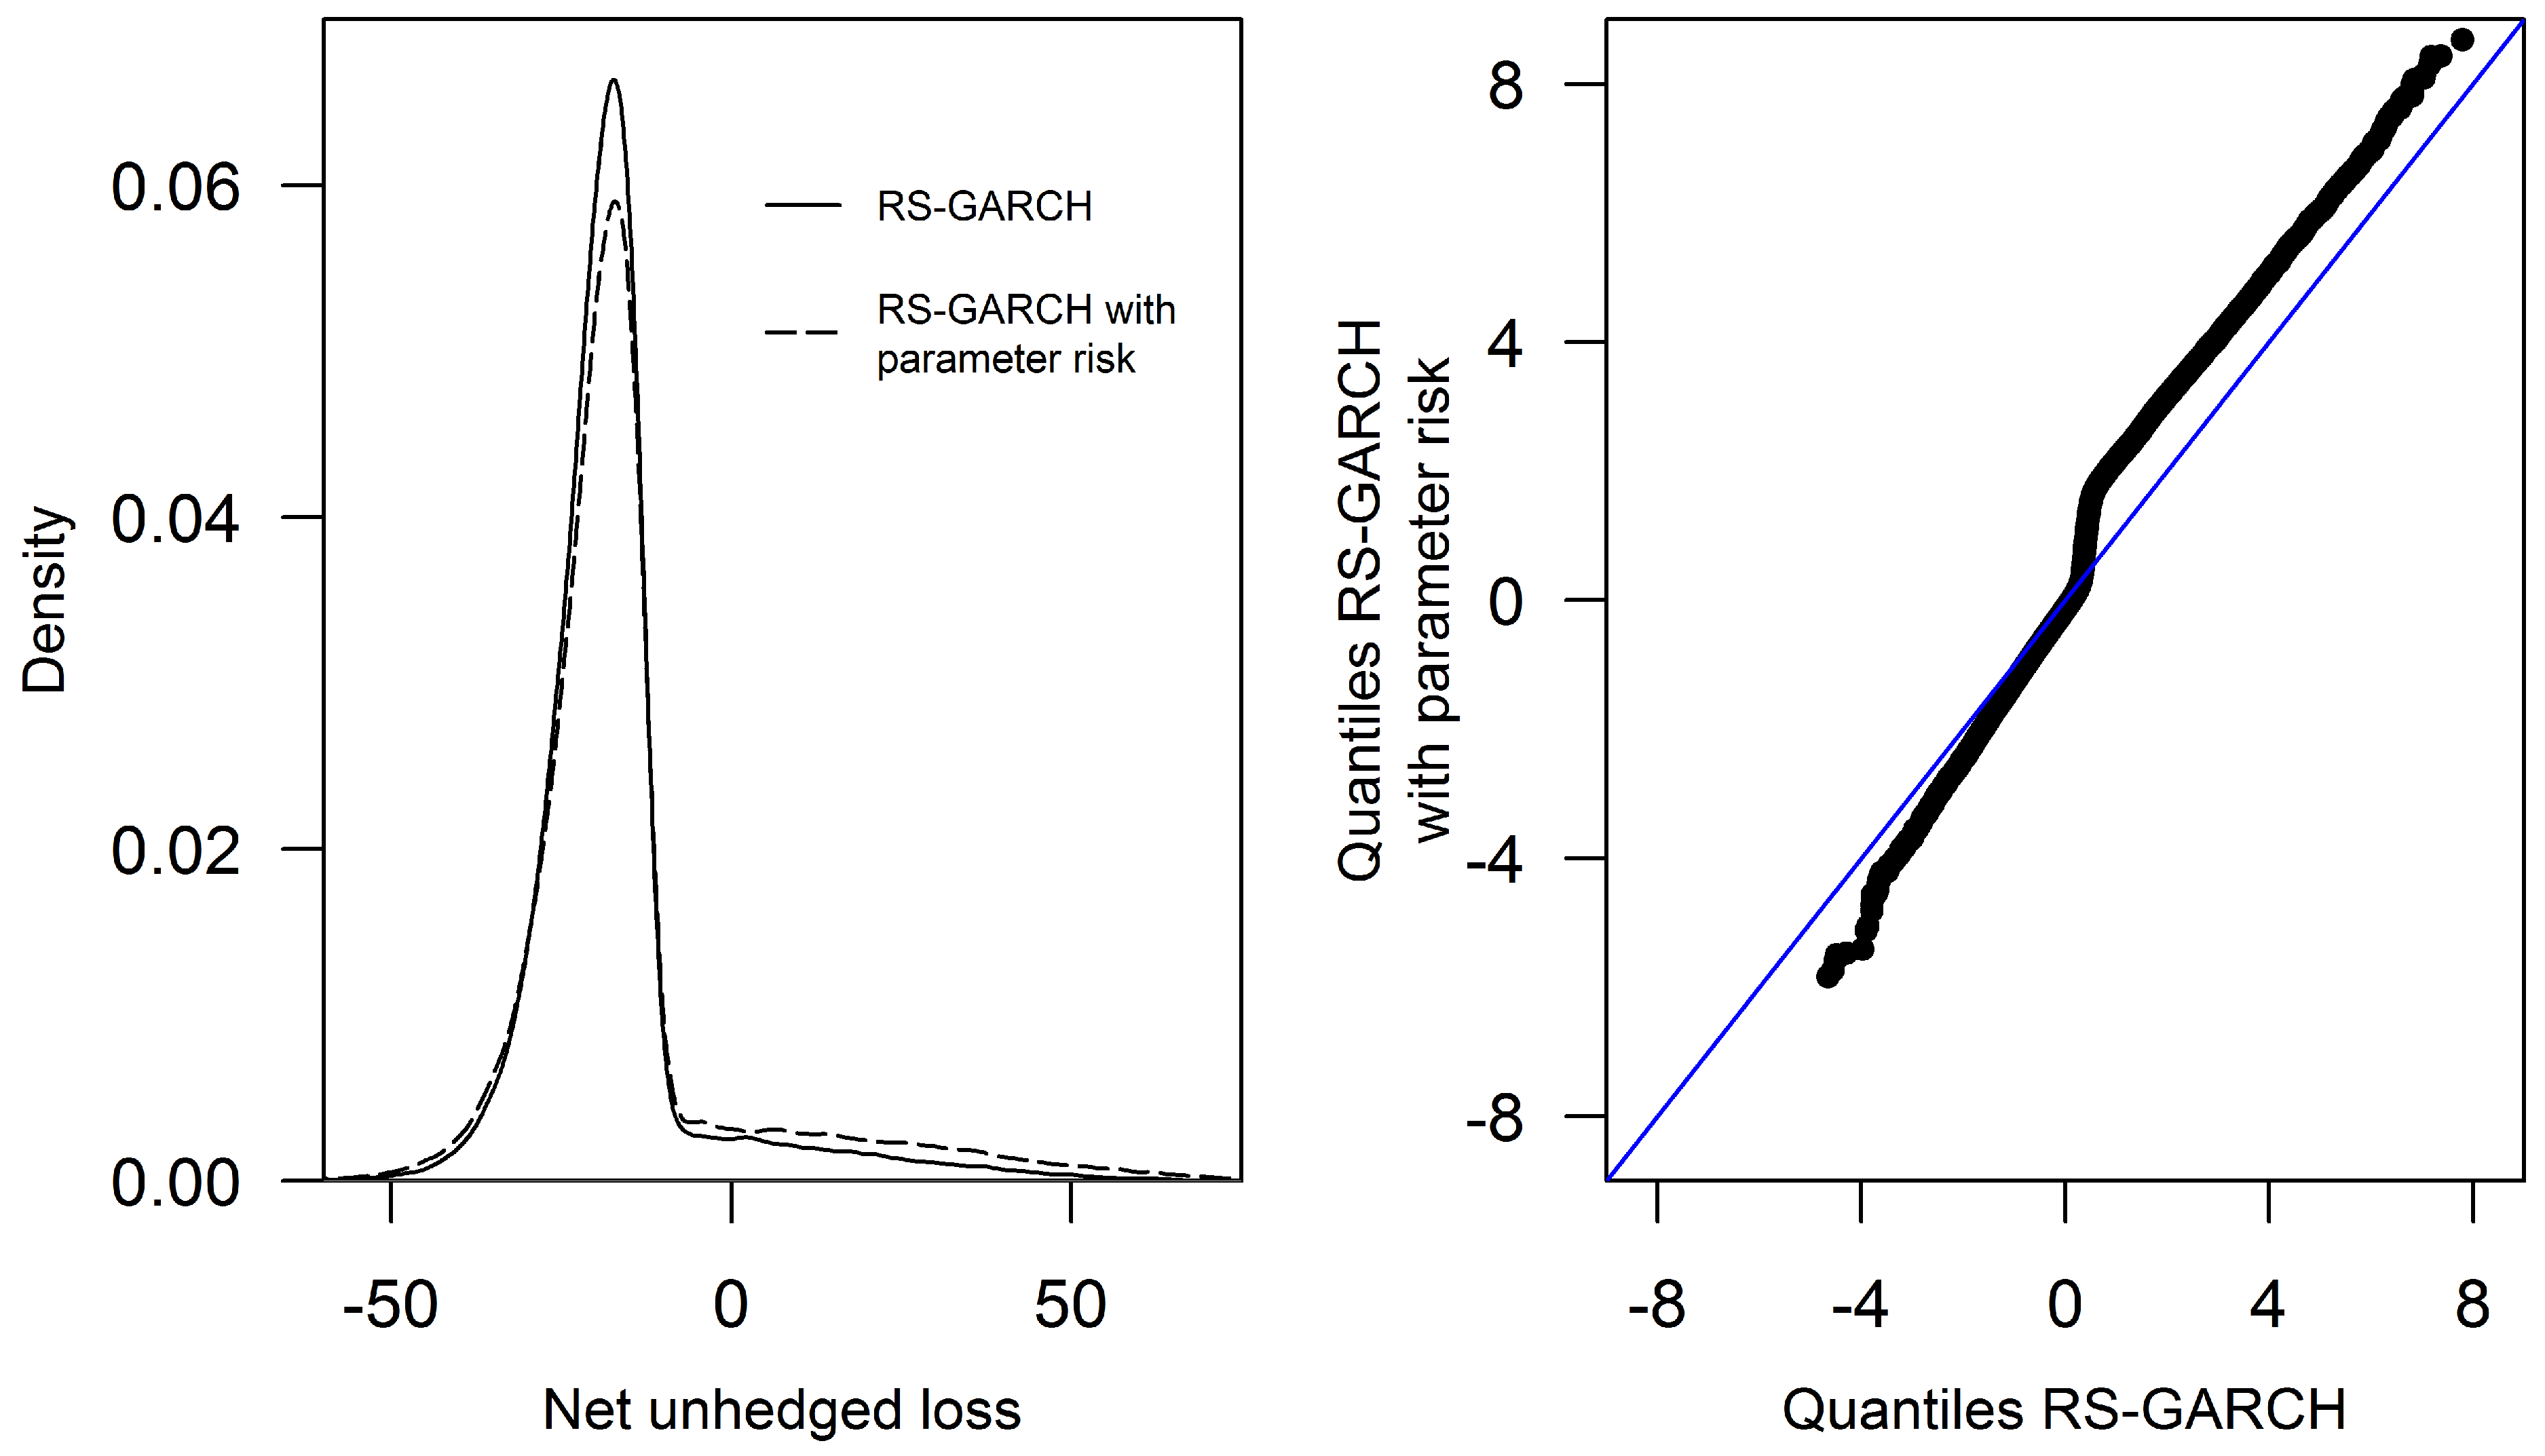
Figure 5.
(Top-left panel): Empirical density of the net hedged loss () based on 100,000 daily scenarios projected under the Black–Scholes model, the RS-GARCH model and the RS-GARCH model with parameter risk. (Other panels): Q-Q plots of standardized quantiles comparing distributions for the net hedged loss.


Table 1.
Parameter estimates for the daily and weekly RS-GARCH models.
| Daily RS-GARCH | |||||||
| 0.544 | 0.042 | 0.936 | 0.980 | 0.339 | |||
| (0.010) | (0.20) | (0.0013) | (0.087) | (0.006) | (0.006) | (0.004) | (0.083) |
| Weekly RS-GARCH | |||||||
| 0.0431 | 2.527 | 0.041 | 0.905 | 0.948 | 0.316 | ||
| (0.064) | (0.54) | (0.0185) | (0.518) | (0.018) | (0.024) | (0.022) | (0.105) |
Notes: Parameter estimates are based on the study of Augustyniak (2014a). Note that they are scaled for percentage log-returns. Asymptotic standard errors are provided in parentheses below the estimates.
Table 2.
Risk measures for the insurer’s net loss at maturity based on the Black–Scholes model and the RS-GARCH model with parameter risk.
Table 2.
Risk measures for the insurer’s net loss at maturity based on the Black–Scholes model and the RS-GARCH model with parameter risk.
| Rebalancing | Mean | StDev | AAD | 95% CTE | 99% VaR | |||||
|---|---|---|---|---|---|---|---|---|---|---|
| B-S | RSG | B-S | RSG | B-S | RSG | B-S | RSG | B-S | RSG | |
| Unhedged | 13.0 | 17.6 | 19.4 | 20.9 | 27.4 | 42.9 | 37.2 | 53.7 | ||
| Annual | 1.5 | 2.4 | 5.5 | 5.9 | 4.4 | 4.7 | 14.5 | 17.4 | 16.8 | 20.3 |
| Monthly | 0.1 | 0.9 | 1.5 | 2.8 | 1.1 | 2.0 | 3.4 | 8.6 | 4.0 | 10.2 |
| Weekly | 0.0 | 0.6 | 0.7 | 2.2 | 0.5 | 1.6 | 1.7 | 6.8 | 2.0 | 8.0 |
| Daily | 0.0 | 0.2 | 0.3 | 1.9 | 0.2 | 1.3 | 0.7 | 5.2 | 0.9 | 6.3 |
Notes: B-S and RSG denote the Black–Scholes and RS-GARCH models, respectively. StDev: standard deviation. AAD: average absolute deviation from zero. CTE: conditional tail expectation. VaR: value at risk.
Table 3.
Risk measures for the insurer’s net loss at maturity based on daily and weekly RS-GARCH models with parameter risk.
Table 3.
Risk measures for the insurer’s net loss at maturity based on daily and weekly RS-GARCH models with parameter risk.
| Rebalancing | Mean | StDev | B | 95% CTE | 99% VaR | |||||
|---|---|---|---|---|---|---|---|---|---|---|
| D | W | D | W | D | W | D | W | D | W | |
| Unhedged | 17.6 | 23.4 | 20.9 | 21.2 | 42.9 | 62.0 | 53.7 | 71.9 | ||
| Annual | 2.4 | 1.8 | 5.9 | 6.6 | 4.7 | 4.8 | 17.4 | 19.4 | 20.3 | 23.1 |
| Monthly | 0.9 | 0.7 | 2.8 | 3.5 | 2.0 | 2.4 | 8.6 | 10.7 | 10.2 | 12.7 |
| Weekly | 0.6 | 0.1 | 2.2 | 2.9 | 1.6 | 2.0 | 6.8 | 8.3 | 8.0 | 9.8 |
Notes: Daily and weekly rebalancing frequencies are abbreviated D and W, respectively. StDev: standard deviation. AAD: average absolute deviation from zero. CTE: conditional tail expectation. VaR: value at risk.
Disclaimer/Publisher’s Note: The statements, opinions and data contained in all publications are solely those of the individual author(s) and contributor(s) and not of MDPI and/or the editor(s). MDPI and/or the editor(s) disclaim responsibility for any injury to people or property resulting from any ideas, methods, instructions or products referred to in the content. |
© 2023 by the authors. Licensee MDPI, Basel, Switzerland. This article is an open access article distributed under the terms and conditions of the Creative Commons Attribution (CC BY) license (https://creativecommons.org/licenses/by/4.0/).
Share and Cite
MDPI and ACS Style
Augustyniak, M.; Badescu, A.; Boudreault, M. On the Measurement of Hedging Effectiveness for Long-Term Investment Guarantees. J. Risk Financial Manag. 2023, 16, 112. https://doi.org/10.3390/jrfm16020112
AMA Style
Augustyniak M, Badescu A, Boudreault M. On the Measurement of Hedging Effectiveness for Long-Term Investment Guarantees. Journal of Risk and Financial Management. 2023; 16(2):112. https://doi.org/10.3390/jrfm16020112
Chicago/Turabian StyleAugustyniak, Maciej, Alexandru Badescu, and Mathieu Boudreault. 2023. "On the Measurement of Hedging Effectiveness for Long-Term Investment Guarantees" Journal of Risk and Financial Management 16, no. 2: 112. https://doi.org/10.3390/jrfm16020112