
Credit Risk Management and the Financial Performance of Deposit Money Banks: Some New Evidence

Both of the Department of Banking and Finance, Faculty of Management Sciences, Ugbowo Campus, University of Benin, Benin City 300103, Edo State, Nigeria
*
Author to whom correspondence should be addressed.
J. Risk Financial Manag. 2023, 16(7), 302; https://doi.org/10.3390/jrfm16070302
Submission received: 26 March 2023
/
Revised: 20 May 2023
/
Accepted: 30 May 2023
/
Published: 21 June 2023
(This article belongs to the Special Issue Bank Lending and Monetary Policy)
Abstract
:This study examined credit risk management and return on equity of Nigerian deposit money banks (DMBs) twelve (12) years (2010–2021) post-adoption of the common accounting year-end as mandated by the Central Bank of Nigeria (CBN) in 2009. Our data set comprises independent variables of capital adequacy ratio (CAR), liquidity ratio (LQR), loan-to-deposit ratio (LDR), risk asset ratio (RAR), non-performing loans ratio (NPLR), loan loss provision ratio (LLP), and size (SZ). Our dependent variable is the return on equity (ROE). Using a panel data regression analysis, we found that CAR, RAR, NPLR, and SZ are the significant determinants of ROE. We also found that Nigerian DMBs now significantly rely on offshore borrowings in Eurobonds to create risk assets to overcome CBN’s constriction on using local depositors’ funds to create risk assets. Furthermore, we found that shareholders of DMBs with international banking licenses in Nigeria within the study period were not significantly more compensated for their risk exposure than investors in risk-free assets (treasury bills). Therefore, the CBN should continue strengthening its regulatory functions with regular reviews that would compel improvements of the DMBs’ credit risk management systems to mitigate the likely failure of the credit life cycle of granted loans. Additionally, a review of its current regulatory cash reserve ratio of 37.5% is imperative to reduce DMBs’ dependence on offshore funding and its associated foreign exchange risk.
1. Introduction
Financial intermediation remains the core object clause of financial institutions (Jenkinson 2008; Suyanto 2021), and it is also one of their primary sources of risk (Hassan et al. 2019; Nguyen 2022) besides capital adequacy, liquidity risk, market risk, interest rate risk, country risk, foreign exchange risk, environmental risk, and operational risks (Bhatt et al. 2023; Mendoza and Rivera 2017). Poor credit risk management spells doom for banks’ performance and returns to equity investors (Khalid et al. 2021; Uwalomwa et al. 2015) and could lead to the collapse of the banking industry when there is a preponderance of credit defaulters (Accornero et al. 2018; Kwashie et al. 2022; Malik et al. 2014). This propelled the Federal Government of Nigeria to create the Asset Management Corporation of Nigeria (AMCON) in July 2010 to solve the recurring problems of non-performing loans that confront Nigerian banks, especially loan recovery from delinquent customers. The recapitalization policy of Nigerian banks by the Central Bank of Nigeria (CBN) in July 2004 and the regulatory releases of Prudential Guidelines by the CBN are part of the remedies to curtail the incidences of poor credit risk management.
1.1. Banks’ Financial Performance
The financial performance of banks is linked with risk and performance parameters (Abubakar et al. 2019; Afolabi et al. 2020; Cheng et al. 2020; Soyemi et al. 2014), and DMBs are in business to make a profit and maximize their shareholders’ wealth. Nevertheless, there are various measures to capture the financial performance of DMBs, such as gross profit margin—this is a profitability ratio that measures what is left from revenue after deducting direct costs (cost of goods sold) incurred in generating the revenue usually expressed in percentage; net profit margin—this is also another profitability ratio that measures the deduction of all direct and indirect (operating expenses, interest, taxes, etc.) costs from revenue to arrive at a net value which is expressed over the reported revenue, and it is expressed in percentage; return on equity (ROE)—how well a business utilized funds of its equity investors to generate returns for them (shareholders) within a reporting period (Hagel et al. 2010); and return on assets (ROA)—a profitability ratio that is slightly similar to ROE but has a broader scope of providers of funds other than equity investors, as it shows what is earned by all providers of funds for a given period. ROE is subsumed in ROA through the Equity Multiplier (EM), which is total assets divided by shareholders’ equity (Clark et al. 2007; Lopez 1999). Interestingly, empirical evidence shows that ROE and ROA are the most widely used metrics for examining the financial performance of banks (Barros and Borges 2011; Kosmidou 2008)
1.2. Credit Risk
However, what is risk in the first place? Risk is the likelihood or probability of the occurrence of an unfortunate event. Risk in financial discussions is uncertainty due to variations in expected returns. The inclusion of the word “probability” in the definition of risk suggests that risk can be estimated or calculated using methods suitable for the type of risk anticipated. Consequently, risk management in financial institutions is a unique feature, owing to the colossal adverse effects the implosion of financial institutions will cause on any economy due to the interlinkages and integrated nature between financial systems and global economies. It can be adduced that the emergence of the Basel Committee in 1974 on Banking Supervision was in direct response to the bankruptcy of Herstatt Bank on 26 June 1974 (a privately owned bank that was headquartered in Cologne, German), underscoring the overarching preeminence of confirmed efforts to forestall bank failures (Lehman Brothers’ bankruptcy in 2008, despite being an investment bank for 158 years, is still a reverberating discuss) and the collapse of financial and settlement systems.
There is no gainsaying that effective banking systems with well-capitalized banks are catalysts for economic growth and development due to the expected availability of funding for various business ventures, enabling the actualization of dreams and aspirations across value chains—birthing the creation of emerging global economic institutions and giant business empires in the process. This intermediation role of banks through credit creation has continued to be the prime source of credit risk (Basel Committee on Banking Supervision 1999) and woes of banks (Saunders and Cornett 2007; Ugoani 2020; Nwaze 2006) arising from borrowers’ defaults on terms of loans which require regular reviews of the credit life cycle.
The credit life cycle refers to the entire credit process from credit application to disbursement to complete liquidation of credit. The process involves an application for credit and a preliminary review of the credit request by the bank’s relationship team or account officer. The credit then moves through various stages depending on the sum involved as banks have their various thresholds to determine whether the credit would be presented at their management credit committee (MCC) or their board credit committee (BCC) level for final critical review and approval. Upon approval, the bank’s collateral management and legal team will check to ensure that all conditions precedent to the credit disbursement are met and all requisite documentations are signed-off and submitted, and then disbursement of the credit is made. Afterward, the bank releases a repayment schedule with or without a moratorium period, and the customer commences scheduled repayment of the credit. In the event of an impairment with the repayment, partial repayment is made with likely rescheduling, i.e., restructuring of the credit to make repayment of the credit feasible to complete liquidation due to the customer’s present and future cash flow realities vis-à-vis the dynamics of the credit portfolio of the bank and its development (Yanenkova et al. 2021).
The outcome of the various reviews of credit life cycles of financial institutions across countries no doubt triggered the release of various Capital Accords’ risk framework by the Basel Committee, such as BASEL I (Basel Committee on Banking Supervision 1998), BASEL II (Basel Committee on Banking Supervision 2004), BASEL II (Basel Committee on Banking Supervision 2006), and BASEL III (Basel Committee on Banking Supervision 2010), with different implementation dates. However, the prime objective of the Capital Accords is to regulate banks to ensure they remain sound, safe, and healthy enough to absorb unexpected losses, essentially in the areas of capital risk, market risk (the risk of losses in trading positions when prices change unfavorably), and operational risk (the risk of direct or indirect loss resulting from poor or failed internal processes, people, and systems; or from external events such as the risk of loss from computer failures, poor documentation, or fraud). However, central to all the risks described above is credit risk. Bakpo and Kabari (2009) emphasized that one of the essential decision difficulties that call for serious consideration is the granting of loans by a financial institution.
According to the Basel Committee on Banking Supervision (2001, p. 10), credit risk is “the risk of loss arising from default by a creditor or counterparty”. In simple terms, credit risk is the loss a lender may experience arising from the failure of a borrower to pay scheduled interest or principal (where a loan has bullet-repayment terms, interests are paid periodically, while the principal amount is paid once at the end of the loan tenure) or failure to pay a combination of both interest and principal in defiance to the terms of the loan covenant. Prior to the default of a borrower on the contractual terms of a loan, there are combinations of factors that would have precipitated the default, which we like to christen “risk transmitters”.
A successful credit life cycle is one in which, at its peak, the disbursed loan is fully liquidated (repaid), while a partially successful credit life cycle is one in which the disbursed loan was partially impaired (interest was paid, while the due principal amount was either partly paid or not paid) but was promptly reclassified to avoid its complete impairment. An unsuccessful credit life cycle is one where the credit processes are compromised through insider dealings, weak internal control, and compliance failure, culminating in the eventual impairment of the credit process and disbursed loan.
The objective of this study is to empirically examine the impact of credit risk on the financial performance of Nigeria’s deposit money banks (DMBs) twelve (12) years (2010–2021) after the adoption of the uniform accounting year-end, as mandated by the Central Bank of Nigeria (CBN) in 2009, in its circulars to all banks and discount houses on common accounting year-end (Central Bank of Nigeria 2009). Return on equity (ROE) is taken as our measure of financial performance, while our measure of credit risk is proxied by the risk transformers of capital adequacy ratio (CAR), liquidity ratio (LQR), loan-to-deposit ratio (LDR), risk asset ratio (RAR), non-performing loans ratio (NPLR), loan loss provision (LLP), and size (SZ).
1.3. Risk Transmitters
We use the word “transmitters” because of the contagious nature of credit default when it eventually crystalizes (for example, the bankruptcy of Lehman Brothers), for which the aftermath includes loss of revenue, reduction in the ability of lenders (banks) to lend, erosion of shareholders’ wealth, impending loss of jobs on the heels of a potential bankruptcy of lenders, etc. Risk transmitters are events precedent to loan default and are endogenous and exogenous to a lending institution. Endogenous risk transmitters are the lenders’ weaknesses, such as poor credit evaluation system, systematic breach of single obligor limit, ineffective credit risk management structure that begets lax credit administration, and poor corporate governance (Nguyen 2022; Nguyen and Dang 2022), poor selection of accounting firms for the conduct of external audit, and others. While the exogenous risk transmitters are precipitants that could have been well forecasted by the lenders’ credit risk architecture before proceeding with the approval and disbursement of a loan—such as current and future regulatory requirements, interest rate, foreign exchange volatilities, the borrower’s sectoral challenges, and likely changes in the sector that could adversely impact the borrower’s ability to repay the potential disbursed loan, and also an environmental market risk (Weber 2012). If risk transmitters’ contagious effects become manifest, they lead to a failed credit life cycle.
1.4. Risk Transformers
To avert a failed credit life cycle, we have what we term “risk transformers”, which are various measures and strategies open to banks to mitigate the probable manifestation of risk transmitters’ contagion. We shall now examine some salient risk transformers.
The ubiquitous evidence of well-aligned risk transformers is a good financial performance which is traceable to improvement in a lender’s quality of risk assets, otherwise known as “credit quality”. Credit quality is the ratio of non-performing loans to total loans and advances (NPLR). A reduction of this ratio, for instance, from ten percent (10%) to five percent (5%) will mean a fifty percent (50%) deflation in non-performing loans and indicates that the bank’s quality of risk assets is at ninety-five percent (95%) level, which, of course, will cause improvement in the revenue of the bank and enhancement of its financial performance. Interestingly, Bikker (1999) and Kosmidou (2008) opine that banks’ performance can be measured in different ways, which include competition, concentration, efficiency, productivity, and profitability.
A well-structured risk administration that does only concentrate on credit risk but also on liquidity risk, capital risk, market risk, operational risk, and compliance risks is a crucial risk transformer. Another important risk transformer is strict adherence to the single obligor limit. This limit usually stipulates the amount a bank can lend to a single borrower or an individual vis-à-vis its total shareholders’ fund. However, a single obligor limit can be manipulated within two accounting year-ends in favor of a single borrower or groups of single borrowers, mainly when a loan is disbursed in the last quarter of the first accounting year-end and if there is an improvement in the lender’s reported shareholders’ fund in the second accounting year-end.
Another risk transformer is loan loss provision (LLP), which is the ratio of loan loss provision to non-performing loans, and it is expected that this would be carefully monitored for improvement in the quality of risk assets to improve the profitability of banks (Kargi 2011; Nwanna and Oguezue 2017; Yang 2012).
Monitoring risk asset ratio (RAR)—the ratio of loans and advances to total assets, is also a vital risk transformer. This ratio measures a bank’s exposure to credit risk, and the higher this is, the more exposed a bank is to credit default. However, a bank with a huge size in terms of its total assets will be able to withstand shocks arising from credit default because of an excessive loan-to-asset ratio above its internal guidance. However, when a bank sticks to its internal guidance of what the maximum ceiling should be irrespective of the negotiation power of its chief executive officer (Nguyen 2022), it transforms the expected credit risk by providing appropriate financial advisory services to its customers that could forestall default risk.
The loan-to-deposit ratio (LDR) is another risk transformer. It shows how much of depositors’ funds are loaned by banks. Although the customers’ deposit is not the only source of loanable funds for banks, banks are expected to strongly follow their internal guidance and their central banks’ restrictions on how much can be loaned from depositors’ funds.
The liquidity ratio (LQR), which is cash and cash equivalent to deposit liabilities, indicates the strength of a bank in protecting itself from a liquidity risk that may occur from credit risk and its ability to overcome any likelihood of a bank run by meeting short-term obligations as they fall due, is also considered a critical risk transformer.
Another risk transformer is the capital adequacy ratio (CAR). It is an imperative measure of a bank’s financial soundness, and it shows the total capital of a bank to its risk-weighted assets. The stronger this ratio, the stronger a bank can withstand financial storms from credit risk (Abba et al. 2013; Umoru and Osemwegie 2016; Ukinamemen and Ozekhome 2019; Ugwuka and Ajuzie 2019).
Further measures to mitigate the eventuality of risk transmitters are a valuation certificate of collaterals from credible property and estate valuers with a proviso for annual validation of issued certificates; the buying of hedging instruments, credit securitization, proactive loan restructuring immediately the borrower’s business fundamentals, and indeed, the anticipated income (Afriyie and Akotey 2011; Kolapo et al. 2012) become severely threatened to forestall asphyxiation of the business’ going concern; syndication of large loans that have the potential of crumbling a bank if the borrower’s business fundamentals become vulnerable; and the use of credible rating agency or appropriate technology to safeguard against the likelihood of moral hazards and adverse selection that may arise from information asymmetry about the borrowers’ underlying risks (Edwards and Turnbull 1994).
The remainder of this paper is organized as follows: Section 2 presents the literature review. Section 3 describes the data, variables’ selection, and research model. Section 4 presents the empirical results and discussions. Lastly, Section 5 presents the conclusion and recommendations of the study.
2. Literature Review
2.1. Theoretical Review
2.1.1. Credit Risk Theory
The credit intermediation role of banks is fraught with a prime challenge of a credit default—borrowers not able to repay the loans obtained from their banks (Coyle 2000). The Merton (1977) default model introduced credit risk theory, which relates a firm’s credit risk to its capital structure in terms of its equity and debt obligation. There is no doubt that the failure of borrowers to meet their obligations to their banks will affect the capital structure of the banks. Central banks are also faced with the challenge of ensuring that banks have adequate processes and procedures to safeguard them against delinquent loans through the periodic issuance of guidelines to banks and imposition and implementation of sanctions when the guidelines are breached. These actions by central banks are all geared to avoid chaos in the financial system and for terms and conditions of financial covenants to be mutually respected between banks and their customers.
Nonetheless, banks are poised to charge higher interest rates for credits with probable higher default risks (Owojori et al. 2011). The financial performance of banks must be balanced with how well their credit risk exposures are managed. Moreover, it is expected that banks’ management teams will seek and deploy appropriate methodologies to manage their credit risk exposures, albeit within the boundaries of their respective central banks’ prudential guidelines and code of corporate governance (Almustafa et al. 2023).
2.1.2. Financial Distress Theory
Baldwin and Scott’s (1983) theory of financial distress is pivotal to the financial performance of banks, as banks need to stay healthy to continue their business of financial intermediation. However, according to this theory, financial distress lurks at the corner when banks begin to show signs of inability to meet their financial obligations at due dates. It is imperative for banks to ring-fence their financial health from vulnerable circumstances such as systemic shocks from the incidence of COVID-19 and poor monitoring of risks and financial performance (Berger and Pukthuanthong 2012, 2016; Proag 2014; Wruck 1990). Arguably, the biggest challenge of a bank is not much of credit default but the ebbing aftermaths of credit defaults, such as not being able to honor depositors’ withdrawal due to poor liquidity, which may culminate in a bank run (this is a situation when a bank’s depositors make unusual cash withdrawals due to suspicion that the bank is going to go bankrupt or insolvent). If this occurred, it could cripple a bank’s liquidity, cash reserve ratio, and capital adequacy ratio and eventually cause its collapse. The recent and unfortunate collapse of the Silicon Valley Bank (SVB) amplifies the overarching importance of this theory to banks’ credit risk management, financial performance, and, indeed, their going concern.
2.2. Empirical Literature Review
Credit risk management in financial institutions is a continuum that will perpetually attract research from scholars to provide more understanding of its various dimensions and impacts on financial performance due to the very significant roles of financial institutions in economies. Dauda and Terzungwe (2018) investigated the effect of credit risk on shareholders’ value in Nigerian DMBs, using a sample of nine (9) banks, covering the period 2004 to 2016, and with the use of panel multiple regression techniques and by applying the Generalized Least Square (GLS) estimators, they found that non-performing loans and loan loss provision had a significant negative effect on shareholders’ value (proxied by market capitalization). They also found that size had a significant positive impact on shareholders’ value, but the capital adequacy ratio did not corroborate with size because the study revealed that the capital adequacy ratio hurts shareholders’ value.
Abubakar et al. (2019) examined the effect of credit risk management on the financial performance of ten (10) DBMs listed on the Nigeria Stock Exchange (NSE) for the period 2010–2016. Using return on equity (ROE) as a proxy for financial performance with a regression method of fixed effects panel estimator, they found that CAR, return on asset (ROA), and LDR had significant positive impacts on ROE while NPLR, cost-to-income ratio (CIR), and LQR had no significant impact on ROE. The findings here are contrary to Dauda and Terzungwe’s (2018) findings regarding the impact of CAR and NPLR on ROE. Perhaps, their proxies for performance may be the reason for the contrary results; for instance, Abubakar et al. (2019) used book value data for shareholders’ value, while Dauda and Terzungwe (2018) used market-value data for shareholders’ value.
Harcourt (2017) and Nwanna (2019) explored the impact of credit risk management on the performance of deposit money banks in Nigeria, using the overparameterized and parsimonious Error Correction Model (ECM) and Granger causality between 1989 and 2014 and between 1998 and 2016, respectively. Their chosen variables for representations of performance are ROA and ROE. At the same time, credit risk was represented by total loans and advances to total deposit ratio (LDR), non-performing loans to total loans ratio (NLTL), and total loans and advances to total assets ratio (TLTA). The results of their parsimonious ECMs with ROA as the dependent variable showed that it was only the current year’s NLTL and its one lag period that had a significant negative impact on ROA, while the parsimonious ECMs with ROE as the dependent variable indicated that the current-period TLTA had a significant positive impact on ROE, and its one lag period also had a significant but negative impact on ROE. It seems quite interesting to note that, just like Abubakar et al. (2019), Harcourt (2017) and Nwanna (2019) found no significant impact of NLTL on ROE. However, the study of Akinselure and Akinola (2019) on the impact of credit risk management on the profitability of selected deposit money banks in Nigeria for the period 2003–2018, with the use of multiple regression models wherein ROA and ROE are proxies for profitability and the loan losses ratio is a proxy for credit management, they found that credit risk management had a significant direct relationship with profitability.
Jonathan and Michael (2018) studied the relationship between credit risk management and bank performance in Nigeria from 2010 to 2016, using Fidelity Bank Nigeria PLC as a case study. They found that ROE and ROA performance measures had no statistically significant relationship with the risk measures of non-performing loans to total loans, total loans to total deposits, and capital adequacy ratio. Nevertheless, the findings from the investigation of Kolapo et al. (2012) on the relationship between bank performance and credit risk management of Nigerian DMBs covering 2000–2010 demonstrated that ROE and ROA are inversely related to the ratio of non-performing loans to total loan, leading to a decline in profitability. Contrarily, the study of Nwude and Okeke (2018) on the impact of credit risk management on the performance of deposit money banks in Nigeria used five banks with the highest asset base during 2000–2014. Findings from their ordinary least square regression models showed that the non-performing loans ratio risk variable positively impacted ROA and ROE, while size measured by the natural log of total assets revealed a statistically significant impact on ROA and ROE.
Kajola et al. (2018) examined the effect of credit management on the financial performance of ten (10) listed DMBs in Nigeria for the period 2005–2016, with ROA and ROE as proxies for bank performance, non-performing loans to total loan ratio (NPLLR), non-performing loans to total deposit (NPLDR), and capital adequacy ratio (CAR) as measures of credit risk management, and they found that the credit risk management measures had a statistically significant impact on ROA and ROE, respectively. Similarly, Adegbie and Otitolaiye (2020) investigated credit risk and financial performance of DMBs in Nigeria for 2006–2018, using return on capital employed (ROCE) as a surrogate for financial performance, while non-performing loans, capital adequacy ratio, loan loss provisions, and loan-to-deposit ratio were used as surrogates for credit risk management, with bank size as a control variable. Their random-effect generalized least-square model showed that credit risk management had a significant positive effect on ROCE, except for non-performing loans, which had a significant negative effect on ROCE. They also found that size had a stronger effect on ROCE than the surrogates of credit risk management.
Siddique et al. (2021) examined the effect of credit risk management and bank-specific factors on the financial performance of South Asian commercial banks for the period 2009 to 2018. The secondary data collected from ten commercial banks in Pakistan and nine commercial banks in India were analyzed with a generalized method of moment (GMM). They found that non-performing loans (NPLs), cost-efficiency ratio (CER), and liquidity ratio (LR) negatively and significantly impacted both return on equity (ROE) and return on asset (ROA). Furthermore, the capital adequacy ratio (CAR) and average lending rate (ALR) positively and significantly influenced the ROE and ROA of Asian commercial banks.
Haile and Joshi (2022) studied of the effect of credit risk management on the financial performance of commercial banks in Ethiopia for the period 2008 to 2018, using return on asset (ROA) as the measure of profitability, and they found, from their regression analysis, that the capital adequacy ratio, the loan-to-deposit ratio, and the provision for loan loss to total loan ratio had a positive and statistically significant effect on profitability. Meanwhile, non-performing loans, loan-to-total asset ratio, and cost-per-loan ratio (total operating cost/total amount of loans) had negative and statistically significant effect on the profitability of Ethiopian banks.
Mudanya et al. (2022) investigated credit risk management practices and financial performance of commercial banks in Kenya, a case of banks in Vihiga County. Secondary data from the banks’ financial statements from 2016 to 2021 and data from the self-administered questionnaire were collated and analyzed. Their regression analysis showed that credit risk management practices represented by loan default monitoring, credit scoring, and credit policies and procedures significantly affect the financial performance represented by the return on asset (ROA) of commercial banks in Kenya. Similarly, Bhatt et al. (2023) examined the determinants of credit risk management and their relationship with the performance of commercial banks in Nepal. Their findings are multifaceted, with partial-least-squares structural equation modeling (PLS-SEM) to analyze data collated from a self-administered questionnaire. They found that, firstly, there is a positive relationship between environmental risk and credit risk; secondly, credit appraisal measurements have a significant effect on credit risk; thirdly, market risk analysis has a significant effect on credit risk management; and lastly, credit risk management intermediates the relationship between environmental risk, credit appraisal measurements, market risk analysis, and the performance of commercial banks in Nepal.
Majani (2022) examined the relationship between credit risk management and the financial performance of commercial banks listed at the Nairobi securities exchange, Kenya, from 2016 to 2019. From the application of trend analysis, correlation analysis, and regression analysis to analyze collated data, the findings from the study revealed that non-performing loans ratio (NPLR) and loan loss provisions ratios (LLPRs) had no statistically significant relationship with ROE. However, capital adequacy ratio (CAR) had a statistically significant negative effect on ROE, while there was a statistically significant positive relationship between loan to assets ratio (LAR) and ROE. Kwashie et al. (2022) explored the impact of credit risk on the financial performance of commercial banks in Ghana from 2013 to 2018. They used two measures of financial performance of return on assets (ROA) and economic value added (EVA). Their measures for risk are non-performing loans (NPL), loans and advances ratio (LAR), capital adequacy ratio (CAR), size and age of the banks, inflation, gross domestic product (GDP), inflation (INF), and monetary policy rate (MPR). The results from the analysis of their regression models showed that NPL had a negative impact on both ROA and EVA but was only statistically significant on EVA. LAR had an insignificant positive influence on ROA and EVA. CAR also had an insignificant positive effect on ROA but a statistically significant negative effect on LAR. Size had a positive effect on both ROA and EVA but was statistically significant on EVA. Age, GDP, and INF had a positive statistically significant impact on ROE but an insignificant positive impact on EVA. MPR had a negative effect on ROA and EVA but was only statistically significant on ROA.
Yimka et al. (2015) investigated credit risk management and the financial performance of selected DMBs in Nigeria between 2006 and 2010, using panel least squares regression analysis. They found that the ratio of non-performing loans to provisions for loans and advances losses had a significant positive effect on ROE, while the ratio of non-performing loans and advances to total loans and advances had no significant effect on ROE.
From the preceding literature reviews, it is evident that none of the authors had consciously considered examining the impact of credit risk management on the financial performance of Nigerian DMBs using return on equity as the measure of financial performance post the adoption of the uniform financial reporting date of 31 December 2009. Most of the prior studies concentrated on return on assets and other measures to proxy the financial performance of DMBs in Nigeria, with a limited concentration on return on equity. This study fills that gap with a twelve-year (12) study from 2010 to 2021.
3. Methodology
3.1. Research Design
This study adopted the longitudinal research designs and used panel data regression methodology to analyze the impact of credit risk management proxies by CAR, LQR, LDR, RAR, NPLR, LLP, and SZ on the financial performance of DMBs in Nigeria proxies by ROE. The population for this study is all listed Nigerian DMBs, while our sample size is listed Nigerian DMBs with international banking licenses: Access Bank Plc, Zenith Bank Plc, Guaranty Trust Bank Plc, United Bank of Africa Plc, First Bank Nigeria Plc, Fidelity Bank Plc, First City Monument Bank Plc, and Union Bank of Nigeria Plc. Data sources are from the full-year published financial statements of the DMBs mentioned above for a twelve-year (12) period (2010–2021) after the adoption of uniform financial reporting date.
3.2. Variable Description and Measurement
We present, in Table 1 below, the study’s variables, measurement, and type (dependent or independent variable) for our regression model.
3.3. Model Specification
The empirical model for this study is derived from our concept of risk transformers and from the recurring variables in our empirical review, and it is in the form of panel methodology, specified functionally as follows:
ROE = F(CAR, LDR, LLP, LQR, NPLR, RAR, SZ)
Econometrically, the regression model is transformed as follows:
where Β0 = intercept of the regression model; Β1, β2, β3, β4, β5, β6, and β7 = the coefficients of the parameters; it = represent variables for the ith bank in period t; and µ = the error or disturbance term.
ROE = β0it + β1CARit + β2LDRit + β3LLPit + β4LQRit + β5NPLRit + β6RARit + β7SZit + µ
The a priori expectations of the regression model (Equation (2)) are such that the coefficients of the explanatory variables, that is, β1, β2, β6, and β7, are expected to be >0, while β3, β4, and β5 are expected to be <0. These are so because CAR and SZ both influence the creation of risk assets, which LDR and RAR do reflect, and are all expected to impact positively on ROE, but loan loss provisions and non-performing loans both reduce banks’ liquidity, which will invariably impact ROE negatively and would expectedly cause a reduction of ROE.
4. Empirical Results and Discussion
4.1. Descriptive Statistics
We present the results of our descriptive statistics in Table 2 of the regression model’s variables.
As seen in Table 2, above, the mean ROE for banks with international banking licenses in Nigeria for the last twelve (12) years (2010–2021) is 13.34%, but the standard deviation of 16.80% implies a high volatility of ROE, as can be seen from the spread between its maximum value of 59.84% and minimum value of −91.95%.
The mean value of CAR is 20.88%, which is 5.88% above the CBN’s CAR requirements of 15% for banks with international banking licenses and in conformity with Basel II requirements. It shows the financial strength and capability of the banks to withstand headwinds that may arise from non-performing loans and advances, save for one of the banks in our dataset that had a one-off negative CAR of −9.51% and another one that also had a one-off CAR of 44%, but the CAR’s moderate deviation from the mean of 5.66% indicates the strong capital base of the DMBs.
LDR had maximum and minimum values of 109.33% and 33.79%, respectively, but a mean value of 68.01%, meaning that customers’ deposits financed 68.01% of loans granted by the DMBs. This mean value of 68.01% exceeds the CBN’s 30 September 2019, directive of 65% target by 31 December 2019, but less than its prescribed maximum of 80%. However, its standard deviation of 16.59% indicates more than moderate variations, suggesting the DMBs’ latitude of creating risk assets.
The LLP has maximum and minimum values of 260.34% and 39.26%, respectively, but a mean value of 105.61%, indicating a powerful bulwark against non-performing loans and advances, but the standard deviation of 37% indicates significant volatilities and the unpredictability of loan loss provisioning by the DMBs, which, indeed, would be in response to changes in non-performing loans.
The LQR varies from 0.70% (maximum) to 0.07% (minimum), with a mean value of 0.24% and a standard deviation of 0.10%, suggesting moderate volatility of the DMBs’ financial capacity to meet short-term obligations without the threats of a bank run. It is, therefore, incumbent upon every bank to avoid any signaling effect that could lead to the domino effect of a bank run. However, the DMBs seem overly aggressive in managing liquid assets given that the mean value of LQR (0.24%), which is 24%, is less than the 30% of CBN’s minimum regulatory requirement.
NPLR had maximum and minimum values of 40.42% and 1.19%, respectively, with a mean value of 5.82% and a standard deviation of 5.97%, which indicates moderate volatility in the management of risk transmitters by the DMBs. The RAR ranges from 88.48 to 17.77%, with a mean value of 46.12% and a standard deviation of 11.20%, indicating significant volatility of exposure to risk assets. The size ranges from 30.09 to 26.93%, with a mean value of 28.52% and a standard deviation of 0.73%, indicating very stable and strong DMBs for the sampled period.
4.2. Correlation Analysis and Test Results of Endogeneity of Independent Variables
Table 3 below shows the correlation results of the regression model’s variables. The results indicate that our DMBs’ performance proxy (ROE) positively correlated with all the explanatory variables, except LQR and NPLR, which are negatively correlated with ROE. The LQR probability value (p-value) of 0.037 shows that its negative relationship with ROE is statistically significant at 5%, while the NPLR p-value of 0.000 is statistically significant at 1%, indicating a robust inverse relationship between ROE and NPLR. These conform with our a priori expectations of the negative impacts of both LQR and NPLR on ROE. It is, however, acknowledged that a correlation analysis, which shows the degree and direction of the relationship between and among variables, cannot reveal and confirm causation between and among variables; this is where the superiority of the regression model lies.
To ensure that the results of our regression model is free from causation errors, the below Table 4 shows the test results of endogeneity of our independent (explanatory) variables. It is evident from the below presented results that our explanatory variables are not endogenous, as their respective p-values are all greater than 0.05 (Duncan et al. 2004; Sheikhi et al. 2022) and there would be no correlation of the explanatory variables with the error term of our regression model.
4.3. Test of Stationarity
In Table 5, we present the results of the test of stationarity of our variables.
In Table 5, above, using three (3) different types of tests (LLC; ADF—Fisher; and PP—Fisher) to test the null hypothesis (Ho) of the presence of the unit root, at the second difference, the results show that our variables are stationary at the 1% level of statistical significance. Accordingly, we reject the null hypothesis that our variables have a unit root (are not stationary) and accept the alternate hypothesis that our variables have no unit root (are stationary).
4.4. Hausman’s Test
The dependent variable (ROE) is regressed on the explanatory variables by using both the Fixed Effects Model (FEM) and Random Effects Model (REM). However, we conducted Hausman’s (1978) specification test to determine which model best fitted our study to enable us to make valid deductions from our regression results.
The below Table 5, displays the results of Hausman’s test for best model selection between FEM and REM—the null hypothesis is that REM is more appropriate than FEM, while the alternate hypothesis is that FEM is more appropriate than REM. According to Gujarati and Porter (2009), the decision rule is that, when the p-value is significant at the 5% level, the FEM is more appropriate for valid deductions to be made. However, if the p-value is insignificant at a 5% level, more significant than 0.05, the REM becomes more suitable for inference. The p-value in the below Table 6, shows that it is significant even at the 1% statistically level. We, therefore, reject the null hypothesis and accept the alternate hypothesis that the FEM is more appropriate for our study than the REM. Consequently, our regression model employed the use of the FEM.
4.5. Regression Results’ Analysis and Discussion
The results of our regression model in Table 7, below, show that the coefficient of determination (R-square) is 0.718168 (71.82%), while the Adjusted R-square is 0.669457 (66.95%), indicating that the 66.95% variation in the dependent variable (ROE) is explained by the explanatory variables (CAR, LDR, LQR, LLP, NPLR, RAR, and SZ). The Durbin–Watson value of 1.775105 (this falls within the acceptable region) indicates the absence of auto-serial correlation and confirms the statistical reliability of the model. More so, the VIF (variance inflation factor) values are all less than five (<5), implying that there is no threat of multicollinearity to the results of our model irrespective of the correlation value of 0.856 between the independent variables of RAR and LDR (Ahmad et al. 2021; Akinwande et al. 2015; Marcoulides and Raykov 2019; O’brien 2007). Additionally, the F-statistic value of 14.74326, which is statistically significant at a 1% level (p-value = 0.0000), confirms that our model is jointly fit, indicating that the combined influence of the explanatory variables on ROE is statistically significant and that there is a significant linear relationship between credit risk management and financial performance of Nigerian DMBs.
From the below regression results in Table 7, the relationship between CAR and ROE is positive and statistically significant at a 1% level, and this is consistent with our correlation result in presented earlier presented in Table 3 and our a priori expectation of B1 > 0.
This is so because banks with a consistently strong capital base above the required regulatory threshold are usually poised to withstand financial shocks that may arise from unfavorable business environments or conditions and are more likely to achieve a positive ROE for their shareholders. This finding has re-echoed the ever-important need for DMBs to continue to have a strong capital base to enable them to support economies cum businesses and the need for their risk management architecture to bootstrap risk transmitters. This finding is consistent with the findings of Kajola et al. (2018), Akinselure and Akinola (2019), Abubakar et al. (2019), Elshaday et al. (2018), Ernest and Fredrick (2017), and Siddique et al. (2021) but contrary to the findings of Dauda and Terzungwe (2018), Jonathan and Michael (2018), Rajkumar and Hanitha (2015), Ravi (2012), and Majani (2022).
The above results also show that LDR has a negative impact on ROE, although not statistically significant at both 5% and 10% levels. This is contrary to our a priori expectation of a positive (β2 > 0) relationship between LDR and ROE, which implies that ROE of Nigerian DMBs is not mainly driven by loans and advances but by other income-generating activities such as bills for collections; bank charges; investment in fixed income securities—especially government securities; trading in forex; financial advisory services, etc.
Perhaps, when loans and advances are given out, they seem to be cash-backed facilities (this is a situation where a bank lends to a customer and holds the customer’s investment certificates in marketable instruments such as investment in fixed deposit, treasury bills, treasury bonds, commercial paper, and corporate bond and are all expectedly qualified by the banks’ acceptable risk criteria; or cash held in another bank account of the customer’s related party, such as a subsidiary or parent company within the same bank which would be held as collateral), which, in practical terms, is lending the same customer’s money to the customer with interest, and this, indeed, can be argued to be bills for collections in disguise with nil impact on the cash and cash equivalent position of the bank. Our finding of an inverse causation between LDR and ROE is contrary to the findings of Harcourt (2017) and Nwanna (2019). However, the findings of Harcourt (2017) and Nwanna (2019) are based on two lag periods’ {D(LDR(-2))} results of their Parsimonious ECM models, while the unlagged {D(LDR)} results of their Parsimonious ECM models are in congruence with our finding.
From our regression results in Table 7, above, we see that LLP has a negative influence on ROE, and this is in conformity with our a priori expectation of β3 < 0, and it is statistically significant at the 1% level. This significant impact of LLP on ROE suggests that the DMBs would have to drastically take measures to better understand their risk transformers to cause improvement in their quality or risks. Such actions are expected to lead to a systemic reduction in LLP to the extent that it no longer negatively impacts their ROEs. Our finding is consistent with Dauda and Terzungwe’s (2018) finding but contrary to Yimka et al. (2015), who found a positive relationship between LLP and ROE.
Similarly, LQR has a negative but statistically significant impact on ROE, consistent with the correlation results in the earlier Table 3, and it is also in congruence with our a priori expectation of a negative (β4 < 0) relationship between ROE and LQR. It, therefore, shows that the aggressive liquidity management by the DMBs reflected in their LQR mean value of 0.24%, as presented earlier in Table 2, is less than the prescribed 30% minimum statutory requirement by the CBN in meeting short-term obligations to avoid bank runs and that creating risk assets failed to positively impact on their ROE. However, a circumspect look again at the results in Table 2 shows LQR’s maximum and minimum values to be 0.70 and 0.07, such that LQR’s range of 0.63 (0.70 − 0.07), which literally is 63% (70.00 − 7.00), is far above the regulatory limit of 30% set by the CBN, implying that the DMBs are holding idle funds, and, as such, the negative impact on ROE is not surprising. However, there seems to be an overarching concentration in maintaining more than required capital adequacy, as Table 2 shows a mean value of 5.88% more than the required minimum of 15%. The below graph depicts the overshadowing power of capital adequacy over the DMBs’ liquidity ratio.
Figure 1 below shows that the liquidity ratio (LQR), which is represented by green dots, is subdued by the red dots of capital adequacy (CAR), save in 2010, when we had a bank with an unusual negative capital adequacy ratio that was lower than its LQR.
The thick and coagulated interwoven lines of capital adequacy through the years 2010–2021 re-emphasize its very significant impact on ROE. Nonetheless, our findings here of the negative relationship between LQR and ROE and the significant impact of LQR on ROE are in congruence with that of Siddique et al. (2021) but contrary to the findings of Majani (2022), Ajao and Oseyomon (2019), and Abubakar et al. (2019), who found no significant link between LQR and ROE.
However, it should be noted that Ajao and Oseyomon’s (2019) parameter for bank performance is the return on assets (ROA), measured by net operating profit (profit after tax) to total assets, while their parameter for liquidity (LQR) is the ratio of total cash to total assets and is, indeed, unseemly, as the liquidity ratio is a metric that measures a liability to an asset and not a measure of an asset to another asset. More so, notwithstanding the less than total of Ajao and Oseyomon (2019) in their definition of cash, which we undeniably defined as cash and cash equivalents, their finding and ours here remain incongruent, but we suspect that if their parameter for LQR were redefined as ours, our finding and theirs would be analogous.
NPLR has a negative relationship with ROE, and it is statistically significant at the 1% level and consistent with both our a priori expectation and correlation analysis, which is also statistically significant at the 1% level. Table 2, described above, shows that NPLR could go as high as 40.42%, which indicates a massive loan default, and as low as 1.19%, with a wide range of 39.23% (40.42% − 1.19%), suggesting that NPLR remains a major challenge of Nigerian DMBs, but the mean value of 5.82% and standard deviation of 5.97% provide some assurances that risk transformers are yielding some positive results in bringing the NPLR southward.
To aid apt visualizations of the likely major sources of NPLR, we took the top three (3) sectors across the years 2010–2021, where the Nigerian DMBs concentrated their loans and advances annually. A sector may have been on the list one year and then failed to have been on the list the following year but later resurfaced after two years. The below pie chart (Figure 2) is a compendium of such changes and the respective positions of each sector thereafter. From the Figure 2, below, it is evident that the likely principal source of NPLR is the oil and gas sector, accounting for 35.151% of the top three (3) annual loans and advances by the DMBs. This huge concentration of loans and advances is not unconnected with the fact that the Nigerian economy mainly depends on revenue from the oil and gas sector.
Below, we present a bar chart (Figure 3) to demonstrate the fact that none of the DMBs exceeded the CBN’s prescribed maximum loan-to-deposit ratio of 80% during the period of our study, and there is indeed a decline in the last five (5) years of the loan-to-deposit ratio by the DMBs. This implies that risk transformers should be the preoccupation of the management of the DMBs to improve ROE, as the mean return on treasury bills computed from CBN’s 2021 statistical bulletin within the same period of this study (2010–2021) is 11.42%, which is marginally lower than the ROE’s mean of 13.34% by 1.92%, thus indicating suboptimal returns to the shareholders of the DBMs, as a higher risk did not significantly translate to higher returns.
Furthermore, Table 2, which was presented far above Figure 2 and Figure 3, indicates that the impact of NPLR on ROE is somewhat palpable, given the wide absolute negative range of ROE: −32.11%, which is between the minimum ROE value of −91.95% and its maximum value of 59.84% during the period of our investigation. Consequently, to erode this huge negative range and cause improvement in ROE, appropriate risk transformers are necessary requisites to reduce the incidence of rising NPLR. This finding is in concordance with the findings of Adegbie and Otitolaiye (2020), Dauda and Terzungwe (2018), Kolapo et al. (2012), Elshaday et al. (2018), Ernest and Fredrick (2017), Rajkumar and Hanitha (2015), and Siddique et al. (2021) but contrary to the findings of Abubakar et al. (2019), Harcourt (2017), Nwanna (2019), Kajola et al. (2018), Jonathan and Michael (2018), Nwude and Okeke (2018), Majani (2022), and Yimka et al. (2015), who all either found positive or no significant relationship between NPLR and ROE.
RAR has a positive relationship with ROE, which is consistent with our a priori expectation. RAR is a more inclusive credit risk parameter, as it measures the DMBs’ total exposure to risk transmitters, as compared to the LDR, which concentrates only on the risk exposures of depositors’ funds to risk assets, ignoring the risk exposures of other stakeholders, such as ordinary shareholders, preference shareholders, bondholders, etc. Nigerian DMBs can only lend what remains of customers’ deposits after the deduction of CBN’s regulatory cash reserve and liquidity ratios, which may vary from one period to another depending on the monetary policy targets of the CBN. Below, Table 8 shows the rates for our study’s coverage period.
From the below Table 8, Nigerian DMBs can only lend, for example, 74% (100% − 26%) of customers’ deposits in 2010, 62% (100% − 38%) in 2011, 58% (100% − 42%) in 2012–2013, 50% (100% − 50%) in 2014–2015, 47.5% (100% − 52.5%) in 2016–2019, and 42.5% (100% − 57.5%). These declining percentages of the DMBs’ utilization of customers’ deposits in creating risk assets imply decreasing the exposure of customers’ deposits to default risk, as regulated by the apex bank (CBN). Consequently, the DMBs need other funding sources for their ever-expanding intermediation roles, such as more injections of funds by ordinary and preference shareholders, an increase in retained earnings, local and foreign institutional borrowings in the form of bonds, etc.
On the strength of the foregoing, we present the below bar chart (Figure 4a) to show the level of credit risk exposures between the DMBs’ cash depositors and other fund providers.
From Figure 4a, below, it is obvious that the DMBs’ credit risk exposures are now more on other fund providers wherefrom the DMBs create risk assets than from traditional cash depositors. In fact, contrary to Figure 3 above, which shows the statutory limit and actual loan-to-deposit ratio of the DMBs for the period 2010–2021, interpreting the amount available for loans and advances (lending) in Table 8 above, we present below what the actual position is regarding the use of depositors’ fund for loans and advances by the DMBs.
The above Figure 4b shows how the DMBs exceeded the prescribed maximum percentage of depositors’ funds for loans and advances, thereby suggesting the creation of risk assets from other funding sources besides depositors’ funds. It is obvious that the DMBs are now relying more heavily on offshore funding, such as Euro bonds, to create risk assets than local depositors’ funds.
How this lending which is above the prescribed maximum limit of depositors’ funds is engineered by the DMBs is depicted in Figure 4c, above. From Figure 4c, we can see that DBMs began aggressive funding of their risk assets from 2014 onward, where the sources of funding of loans and advances beyond CBN’s prescribed statutory limit of depositors’ fund is below equity, which means not funded from equity, as was the case between 2010 and 2013. The aggressiveness in seeking other funding sources by the DMBs is not unconnected with the increasing restrictions by the CBN on funds available to the DMBs from local depositors’ funds for lending. In fact, in 2014, the fund available for lending was reduced from 58% of depositors’ fund to 50%, a massive constriction of eight hundred (800) basis points (see Table 8). Liquidity in the financial sector will continue to be constrained due to the CBN’s continual upward review of the cash reserve ratio (CRR), as banks would not be able to significantly fund businesses that have no link with receipts of foreign currency. Moreover, this is detrimental to the Nigerian economy compared to countries such as China (CRR: 10.75%), India (CRR: 4.5%), Indonesia (CRR: 9%), Malaysia (CRR: 2%), USA (CRR: 10%), UK (CRR: 10%), Germany (CRR: 1%), and France (CRR: 1%), which all have low cash reserve ratios to boost the injection of liquidity into their economies to stimulate growth. With a higher CRR, there would be less funds available to banks for lending, which is a significant challenge for their core lending business and would invariably affect their financial performance.
The imaginative reality is that the DMBs have found a better way of insulating their lending businesses from distortions and restrictions of using local depositors’ funds by the CBN as they turn to the continuous issuance of foreign bonds, especially regarding United States Dollars. Without this, the DMBs would not be able to create significant risk assets in the oil and gas cum manufacturing sectors of the Nigerian economy, as these two (2) sectors accounted for circa 53.29% of the total loans and advances shown in Figure 2 above. This 53.29% is more than the percentage prescribed by the CBN statutory limit of depositors’ funds of 50% in 2014–2015, 47.5% in 2016–2020, and 37.5% in 2021, respectively. It is therefore not startling that the DBMs’ ROE did not tower significantly above returns on treasury bills, as they would have to pay offshore interest to the foreign bondholders compared to little interest on savings to local depositors had the fund available for lending from local depositors’ fund were not as restricted by the CBN.
Consequently, it is not astonishing that our regression results in Table 6 report that RAR had a positive and significant impact on ROE at the 5% statistical level. It is also not surprising that LDR has a negative and no significant impact on ROE because the higher the combined statutory ratios of cash reserve ratio and liquidity ratio, the less local depositors’ funds would be available for the creation of risk assets by the DMBs and would invariably cause a negative impact on the DMBs’ ROE. Our finding is consistent with the finding of Yimka et al. (2015).
Our variable for size (SZ) conforms with our a priori expectation due to its positive relationship with ROE. It seems that size is now the core fortress against risk transmitters, as our hitherto presented Table 7 not only shows SZ as having a very significant impact on ROE at a 1% statistical level—the same with CAR—but also that the value of its coefficient is 10.20536 greater than the combined coefficients of all the other variables. The advantage the sampled DMBs have by reason of their international banking licenses to access international markets for cheap funds is a significant discriminant against national and regional banks that may have to pay more for such access due to their perceived low credit rating, except they have affiliation with a foreign parent company. It should be noted that the size effect here does not propagate the ideology of ‘too-big-to-fail’; otherwise, Lehman Brothers, after 156 years in existence, given its sheer size, would not have collapsed. Improper management of risk transmitters will continue to have unsavory effects on DMBs, irrespective of size. Our finding is analogous to the findings of Nwanna (2019) and Kajola et al. (2018) of a positive relationship between ROE and SZ, save that theirs was not statistically significant.
5. Conclusions and Recommendations
This study examined credit risk management and the financial performance of DMBs in Nigeria for a twelve (12)-year period (2010–2021) after the implementation of uniform financial reporting date by the Central Bank of Nigeria. The selected banks for our study are the eight (8) Nigerian deposit money banks with international banking licenses due to their perceived adherence to international best practices and comparable financial reports.
Our findings show that credit risk management significantly affects the performance of Nigerian DMBs. Moreover, our findings indicate that size plays a dominant role in determining the potential profitability of the DMBs and their capacity to withstand the unfavorable storms of non-performing loans and advances, which are the repercussions of an unsuccessful credit life cycle. We also find that Nigerian DMBs now significantly rely on offshore borrowings in the form of bonds to create risk assets to overcome the CBN’s constriction on using local depositors’ funds to create risk assets. This restriction affected the DMBs’ equity shareholders not earning returns significantly above returns from risk-free investment (Nigerian treasury bills), given their level of risk exposures within the study’s period.
Therefore, we recommend that the CBN continues to strengthen its regulatory functions with regular review and improvement of the DMBs’ credit risk management systems to mitigate a likely failure of the credit life cycle. Additionally, a review of its current regulatory cash reserve ratio of 37.5% is imperative, as DMBs funding their credit creation business with offshore borrowing due to constrained use of domestic depositors’ funds may expose their CAR to foreign exchange risk and, by extension, cause contraction of RAR due to selection of few customers, albeit circumspectly, to access such credit. Furthermore, if the DMBs continue to have the ability to access foreign borrowings and increase use of local depositors’ funds, these would invariably increase the size of credit available to local customers and indeed increase the SZ of the banks. More profit would expectedly be earned that could be used for expansion or retained to further strengthen the DMBs’ CAR. Nevertheless, this should be accompanied with tight internal control on both risk assets’ creation and NPLR to ensure that the DMBs’ internal guidance on credit creation is not breached.
Author Contributions
Conceptualization, O.K.N.; methodology, O.K.N.; software, O.K.N.; validation, O.K.N.; formal analysis, O.K.N.; investigation, O.K.N.; resources, O.K.N.; data curation, O.K.N.; writing—original draft preparation, O.K.N.; writing—review and editing, O.K.N.; visualization, O.K.N.; supervision, E.I.E.-O.; project administration, O.K.N., and E.I.E.-O.; funding acquisition, O.K.N., and E.I.E.-O. All authors have read and agreed to the published version of the manuscript.
Funding
This research received no external funding. The APC was funded by the authors.
Data Availability Statement
Financial statements of the selected Nigerian DMBs wherefrom financial data were extracted, are available at the Nigerian Exchange Group (NGX) website: https://ngxgroup.com/exchange/trade/equities/listed-companies/?filter=Main%20Board (accessed on 1 August 2022). While data from the Central Bank of Nigeria statistical bulletin can be accessed at: https://www.cbn.gov.ng/documents/Statbulletin.asp (accessed on 1 August 2022).
Conflicts of Interest
The authors declare no conflict of interest.
References
- Abba, Gabriel Ogere, Peter Zachariah, and Ernest E. Inyang. 2013. Capital adequacy ratio and banking risks in the Nigeria money deposit banks. Research Journal of Finance and Accounting 4: 17–25. [Google Scholar]
- Abubakar, Ahmadu, Sulaiman AAbdulwahab Sulaiman, Bello Usman, and Mohammed Umar Mijinyawa. 2019. Credit risk management and financial performance of quoted deposit money banks in Nigeria. University of Port Harcourt Journal of Management 1: 178–92. [Google Scholar]
- Accornero, Matteo, Giuseppe Cascarino, Roberto Felici, Fabio Parlapiano, and Alberto Maria Sorrentino. 2018. Credit risk in banks’ exposures to non-financial firms. European Financial Management 24: 775–91. [Google Scholar] [CrossRef]
- Adegbie, Folajimi F., and Emmanuel Dare Otitolaiye. 2020. Credit risk and financial performance: An empirical study of deposit money banks in Nigeria. European Journal of Accounting, Auditing and Finance Research 8: 38–58. [Google Scholar]
- Afolabi, Taofeek Sola, Tomola M. Obamuyi, and Tajudeen Egbetunde. 2020. Credit risk and financial performance: Evidence from microfinance banks in Nigeria. IOSR Journal of Economics and Finance 11: 8–15. [Google Scholar]
- Afriyie, Harrison Owusu, and Joseph Oscar Akotey. 2011. Credit Risk Management and Profitability of Selected Rural Banks in Ghana. Sunyani: Faculty of Economics and Business Administration, Catholic University College of Ghana, pp. 1–18. [Google Scholar]
- Ahmad, Alhassan Umar, Uckath Variyath Balakrishnan, and Prem Shankar Jha. 2021. A study of multicollinearity detection and rectification under missing values. Turkish Journal of Computer and Mathematics Education 12: 399–418. [Google Scholar]
- Ajao, Mayowa Gabriel, and Ehi Patrick Oseyomon. 2019. Credit risk management and performance of deposit money banks in Nigeria. African Review of Economics and Finance 11: 157–77. [Google Scholar]
- Akinselure, Oluwafemi Philip, and Abisola T. Akinola. 2019. Impact of credit risk management on profitability of selected deposit money banks in Nigeria. International Journal of Economics, Commerce and Management 7: 254–68. [Google Scholar]
- Akinwande, Michael Olusegun, Hussaini Garba Dikko, and Agboola Samson. 2015. Variance inflation factor: As a condition for the inclusion of suppressor variable(s) in regression analysis. Open Journal of Statistics 5: 754–67. [Google Scholar] [CrossRef] [Green Version]
- Almustafa, Hamza, Quang Khai Nguyen, Jia Liu, and Van Cuong Dang. 2023. The impact of COVID-19 on firm risk and performance in MENA countries: Does national governance quality matter? PLoS ONE 18: e0281148. [Google Scholar] [CrossRef]
- Bakpo, Francis, and Ledisi G. Kabari. 2009. Credit risk evaluation system: An artificial neural network approach. Nigerian Journal of Technology 28: 36–45. [Google Scholar]
- Baldwin, Carliss. Y., and Mason P. Scott. 1983. The resolution of claims in financial distress: The case of Massey Ferguson. The Journal of Finance 38: 505–16. [Google Scholar] [CrossRef]
- Barros, Carlos Pestana, and Maria Rosa Borges. 2011. Measuring performance in the Portuguese banking industry with a Fourier Regression Model. Applied Economics Letters 18: 21–28. [Google Scholar] [CrossRef] [Green Version]
- Basel Committee on Banking Supervision. 1998. Basel I: The Basel Capital Accord. Basel: Bank for International Settlements. [Google Scholar]
- Basel Committee on Banking Supervision. 1999. Principles for the Management of Credit Risk. Basel: Bank for International Settlements. [Google Scholar]
- Basel Committee on Banking Supervision. 2001. The New Basel Capital Accord: An Explanatory Note. Basel: Bank for International Settlements. [Google Scholar]
- Basel Committee on Banking Supervision. 2004. Basel II: The Revised Framework. Basel: Bank for International Settlements. [Google Scholar]
- Basel Committee on Banking Supervision. 2006. Basel II: Basel II: International Convergence of Capital Measurement and Capital Standards: A Revised Framework–Comprehensive Version. Basel: Bank for International Settlements. [Google Scholar]
- Basel Committee on Banking Supervision. 2010. Basel III: International Framework for Liquidity Risk Measurement, Standards and Monitoring: A Global Regulatory Framework for More Resilient Banks and Banking Systems. Basel: Bank for International Settlements. [Google Scholar]
- Berger, Dave, and Kuntara Pukthuanthong. 2012. Market fragility and international market crashes. Journal of Financial Economics 105: 565–80. [Google Scholar] [CrossRef]
- Berger, Dave, and Kuntara Pukthuanthong. 2016. Fragility, stress, and market returns. Journal of Banking and Finance 62: 152–63. [Google Scholar] [CrossRef]
- Bhatt, Tribhuwan Kumar, Naveed Ahmed, Muhammad Babar Iqbal, and Mehfooz Ullah. 2023. Examining the determinants of credit risk management and their relationship with the performance of commercial banks in Nepal. Journal of Risk and Financial Management 16: 1–23. [Google Scholar]
- Bikker, Jacob Antoon. 1999. Efficiency in the European Banking Industry: An Exploratory Analysis to Rank Countries. Research Series Supervision No. 18; Amsterdam: De Nederlandsche Bank, pp. 55–69. [Google Scholar]
- Central Bank of Nigeria. 2021. Statistical Bulletin Financial Sector. Available online: www.cbn.gov.ng (accessed on 5 May 2022).
- Central Bank of Nigeria. 2009. Circulars to All Banks and Discount Houses on Common Accounting Year-End. Abuja: Central Bank of Nigeria. [Google Scholar]
- Cheng, Limei, Takyi Kwabena Nsiah, Charles Ofori, and Abraham Lincoln Ayisid. 2020. Credit risk, operational risk, liquidity risk on profitability. A study on South Africa commercial banks: A PLS-SEM analysis. Revista Argentina de Clínica Psicológica 29: 5. [Google Scholar]
- Clark, Timothy, Astrid Dick, Beverly Hitle, Kevin J. Strioh, and Robard William. 2007. The role of retail banking in the U.S. banking industry: Risk, return, and industry structure. Economic Policy Review 13: 1–18. [Google Scholar]
- Coyle, Brian. 2000. Credit Risk Management: Framework for Credit Risk Management. London: Fitzroy Dearborn Publishers. [Google Scholar]
- Dauda, Isuwa, and Nyor Terzungwe. 2018. Credit risk and shareholders’ value in Nigerian deposit money banks. Journal of Business and Management 20: 36–46. [Google Scholar]
- Duncan, Greg J., Katherine A. Magnuson, and Jens Ludwig. 2004. The endogeneity problem in developmental studies. Research in Human Development 1: 59–80. [Google Scholar] [CrossRef] [PubMed]
- Edwards, Pamela, and Peter Turnbull. 1994. Finance for small and medium sized enterprises, information and the income gearing challenge. International Journal of Marketing 12: 3–9. [Google Scholar]
- Elshaday, Teshome, Debela Kenenisa, and Sultan Mohammed. 2018. Determinant of financial performance of commercial banks in Ethiopia: Special emphasis on private commercial banks. African Journal of Business Management 12: 1–10. [Google Scholar] [CrossRef] [Green Version]
- Ernest, Somuah Annor, and Somuah Obeng Fredrick. 2017. Impact of credit risk management on the profitability of selected commercial banks listed on the Ghana stock exchange. Journal of Economics, Management and Trade 20: 1–10. [Google Scholar]
- Gujarati, Damodar N., and Dawn C. Porter. 2009. Basic Econometrics. New York: McGraw-Hill/Irwin. [Google Scholar]
- Hagel, John, John Seely Brown, and Lang Davison. 2010. The Best Way to Measure Company Performance. Available online: https://www.hbr.org/2010/03/the-best-way-tomeasure-compan.html (accessed on 5 December 2022).
- Haile, Dereje Mekoya, and Dviyang Joshi. 2022. The effect of credit risk management on financial performance of commercial banks in Ethiopia. International Journal of Creative Research Thoughts 10: 301–13. [Google Scholar]
- Harcourt, Edwin E. 2017. Credit risk management and performance of deposit money banks in Nigeria. International Journal of Managerial Studies and Research (IJMSR) 5: 47–56. [Google Scholar]
- Hassan, Mohammad Kabir, Ashraf Khan, and Andrea Paltrinieri. 2019. Liquidity risk, credit risk and stability in Islamic and conventional banks. Research in International Business and Finance 48: 17–31. [Google Scholar]
- Hausman, Jerry Allen. 1978. Specification tests in econometrics. Econometrica 46: 1215–71. [Google Scholar] [CrossRef] [Green Version]
- Jenkinson, Nigel. 2008. Strengthening regimes for controlling liquidity risk. Paper presented at the Euro Money Conference on Liquidity and Funding Risk Management, Bank of England, London, UK, April 9–23. [Google Scholar]
- Jonathan, Ndubuisi Chinedu, and Amedu Jimoh Michael. 2018. An analysis of the relationship between credit risk management and bank performance in Nigeria: A case study of Fidelity Bank Nigeria PLC. International Journal of Research and Review 5: 202–13. [Google Scholar]
- Kajola, Sunday Olugboyega, Adedeji Samuel Babatunji, Jayeola Olabisi, and Ayorinde Tobi Babatolu. 2018. Effect of credit risk management on financial performance of Nigerian listed deposit money banks. Scholedge International Journal of Business Policy & Governance 5: 53–62. [Google Scholar]
- Kargi, Hamisu Suleiman. 2011. Credit risk and the performance of Nigerian banks. A study of GTB PLC (1991–2010). Journal of Business Research Administration 3: 112–19. [Google Scholar]
- Khalid, Azam Abdelhakeem, Wala Abdelmunem Mohamed Hassan, Neimat AbdAlla Ibrahim, Yousif Abdelbagi Abdalla, Ibrahim Elsiddig Ahmed, and Adel M. Sarea. 2021. The impact of credit risk management on the financial performance of banking sector in Sudan. Academy of Accounting and Financial Studies Journal 25: 1–11. [Google Scholar]
- Kolapo, Funso T., Raphael Kolade Ayeni, and Michael Ojo Oke. 2012. Credit and deposit money banks performances in Nigeria: A panel model approach. Australian Journal of Business and Management Research 2: 31–38. [Google Scholar]
- Kosmidou, Kyriaki. 2008. The determinants of banks’ profits in Greece during the period of EU financial integration. Managerial Finance 34: 146–59. [Google Scholar]
- Kwashie, Angela Akpemada, Samuel Tawiah Baidoo, and Enock Kojo Ayesu. 2022. Investigating the impact of credit risk on financial performance of commercial banks in Ghana. Cogent Economics & Finance 10: 1–15. [Google Scholar]
- Lopez, Jose A. 1999. Methods for evaluating value-at-risk estimate. Economic Review, Federal Reserve Bank of San Francisco 2: 3–17. [Google Scholar] [CrossRef] [Green Version]
- Majani, Sally Imbuhira. 2022. The relationship between credit risk management and financial performance of commercial banks listed at the Nairobi Securities Exchange, Kenya. International Journal of Managerial Studies and Research 10: 88–126. [Google Scholar] [CrossRef]
- Malik, Faizan, Shehzad Khan, Muhammad Ibrahim Khan, and Faisal Khan. 2014. Interest rate and its effects on Bank’s profitability. Journal of Applied Environment and Biological Sciences 4: 41–52. [Google Scholar]
- Marcoulides, Katerina M., and Tenko Raykov. 2019. Evaluation of variance inflation factors in regression models using latent variable modelling methods. Educational and Psychological Measurement 79: 874–82. [Google Scholar]
- Mendoza, Rufo R., and John Paolo R. Rivera. 2017. The Effect of credit risk and capital adequacy on the profitability of rural banks in the Philippines. Scientific Annals of Economics and Business 64: 83–96. [Google Scholar]
- Merton, Robert C. 1977. An analytic derivation of the cost of deposit insurance and loan guarantees. Journal of Banking and Finance 1: 512–20. [Google Scholar] [CrossRef]
- Mudanya, Erickson, John Murunga Kadima, and Julius Miroga. 2022. Credit risk management practices and financial performance of commercial banks in Kenya: A case of banks in Vihiga County. The Strategic Journal of Business & Change Management 9: 305–16. [Google Scholar]
- Nguyen, Quang Khai. 2022. Determinants of bank risk governance structure: A cross-country analysis. Research in International Business and Finance 60: 101575. [Google Scholar]
- Nguyen, Quang Khai, and Van Cuong Dang. 2022. The impact of risk governance structure on bank risk management effectiveness: Evidence from ASEAN countries. Heliyon 8: E11192. [Google Scholar]
- Nwanna, Ifeanyi Onyenwe. 2019. Risk management implications on performance of deposit money banks in Nigeria (1998–2016). Journal of Banking and Finance Management 2: 1–15. [Google Scholar]
- Nwanna, Ifeanyi Onyenwe, and Francis Chinedu Oguezue. 2017. Effect of credit management on profitability of deposit money banks in Nigeria. International Institute of Academic Research and Development 3: 137–60. [Google Scholar]
- Nwaze, Chuks. 2006. Bank Fraud Exposed with Cases and Preventive Measures. Lagos: Control and Surveillance Associates Ltd. [Google Scholar]
- Nwude, Chuke E., and Chinedu Okeke. 2018. Impact of credit risk management on the performance of selected Nigerian banks. Inter-national Journal of Economics and Financial Issues 8: 287–97. [Google Scholar]
- O’brien, Robert M. 2007. A caution regarding rules of thumb for variance inflation factors. Quality & Quantity 41: 673–90. [Google Scholar]
- Owojori, Adekunle A., Ishola R. Akintoye, and Felix A. Adidu. 2011. The challenge of risk management in Nigerian banks in the post consolidation era. Journal of Accounting and Taxation 3: 23–31. [Google Scholar]
- Proag, Virendra. 2014. The concept of vulnerability and resilience. Procedia Economics and Finance 18: 369–76. [Google Scholar]
- Rajkumar, Perinpanathan, and Vijeyaratnam Hanitha. 2015. The impact of credit risk management on financial performance: A study of state commercial banks in Sri Lanka. Paper presented at the International Conference on Contemporary Management (ICCM-2015), Jaffna, Sri Lanka, June 1–12; pp. 206–12. [Google Scholar]
- Ravi, Prakash Sharma Poudel. 2012. The impact of credit risk management on financial performance of commercial banks in Nepal. International Journal of Arts and Commerce 1: 9–15. [Google Scholar]
- Saunders, Anthony, and Marcia Millon Cornett. 2007. Financial Markets and Institutions: An Introduction to the Risk Management Approach. New York: McGraw Hill Pub. [Google Scholar]
- Sheikhi, Ayyub, Fatemeh Bahador, and Mohammad Arashi. 2022. On a generalization of the test of endogeneity in a two stage least squares estimation. Journal of Applied Statistics 49: 709–21. [Google Scholar] [CrossRef] [PubMed]
- Siddique, Asima, Muhammad Asif Khan, and Zeeshan Khan. 2021. The effect of credit risk management and bank-specific factors on the financial performance of the South Asian commercial banks. Asian Journal of Accounting Research 7: 182–94. [Google Scholar]
- Soyemi, Kenny Adedapo, Omowunmi Jumoke Ogunleye, and Faderera Oluwatoyin Ashogbon. 2014. Risk management practices and financial performance: Evidence from the Nigerian deposit money banks (DMBs). The Business and Management Review 4: 1–37. [Google Scholar]
- Suyanto, Suyanto. 2021. The effect of bad credit and liquidity on bank performance in Indonesia. The Journal of Asian Finance, Economics and Business 8: 451–58. [Google Scholar]
- Ugoani, John Nkeobuna Nnah. 2020. Credit risk management evaluation and bank management effectiveness: 1995 – 2015 dimensionality. Sumerianz Journal of Economics and Finance 3: 178–88. [Google Scholar] [CrossRef]
- Ugwuka, Nkechi, and Oluchi Ajuzie. 2019. Capital adequacy and banks performance: Evidence from deposit money banks in Nigeria. International Journal of Research and Innovation in Social Science III: 237–43. [Google Scholar]
- Ukinamemen, Arekhandia Alfred, and Hassan O. Ozekhome. 2019. Does capital adequacy influence the financial performance of listed banks in Nigeria? Oradea Journal of Business and Economics IV: 69–80. [Google Scholar]
- Umoru, David, and Joy O. Osemwegie. 2016. Capital adequacy and financial performance of banks in Nigeria: Empirical evidence based on the Fgls estimator. European Scientific Journal 12: 295–305. [Google Scholar]
- Uwalomwa, Uwuigbe, Olubukunola Ranti Uwuigbe, and Babajide Oyewo. 2015. Credit management and bank performance of listed banks in Nigeria. Journal of Economics and Sustainable Development 6: 27–32. [Google Scholar]
- Weber, Olaf. 2012. Environmental credit risk management in banks and financial service institutions. Business Strategy and the Environment 21: 248–63. [Google Scholar]
- Wruck, Karen Hopper. 1990. Financial distress, reorganization, and organizational efficiency. Journal of Financial Economics 27: 419–44. [Google Scholar]
- Yanenkova, Iryna, Yuliia Nehoda, Svetlana Drobyazko, Andrii Zavhorodnii, and L. Berezovska. 2021. Modeling of bank credit risk management using the cost risk model. Journal of Risk and Financial Management 14: 211. [Google Scholar]
- Yang, Chih-Ching. 2012. Service, investment, and risk management performance in commercial banks. The Service Industries Journal 32: 2005–25. [Google Scholar]
- Yimka, Alalade Samson, Agbatogun Taofeekb, Cole Abimbola, and Adekunle Olusegun. 2015. Credit risk management and financial performance of selected commercial banks in Nigeria. Journal of Economic and Financial Studies 3: 1–9. [Google Scholar]
Figure 1.
CAR and LQR for the years 2010–2021.

Figure 2.
Percentage of loan concentration.

Figure 3.
Statutory limit and loan-to-deposit ratio for the period 2010–2021.

Figure 4.
(a) Nigerian DMBs % of risk holders for the period 2010–2021. (b) Actual statutory limit and actual loan-to-deposit ratios for the period 2010–2021. (c) Funding of loans and advances (LA) beyond statutory limit of depositors’ fund for the period 2010–2021.
Figure 4.
(a) Nigerian DMBs % of risk holders for the period 2010–2021. (b) Actual statutory limit and actual loan-to-deposit ratios for the period 2010–2021. (c) Funding of loans and advances (LA) beyond statutory limit of depositors’ fund for the period 2010–2021.


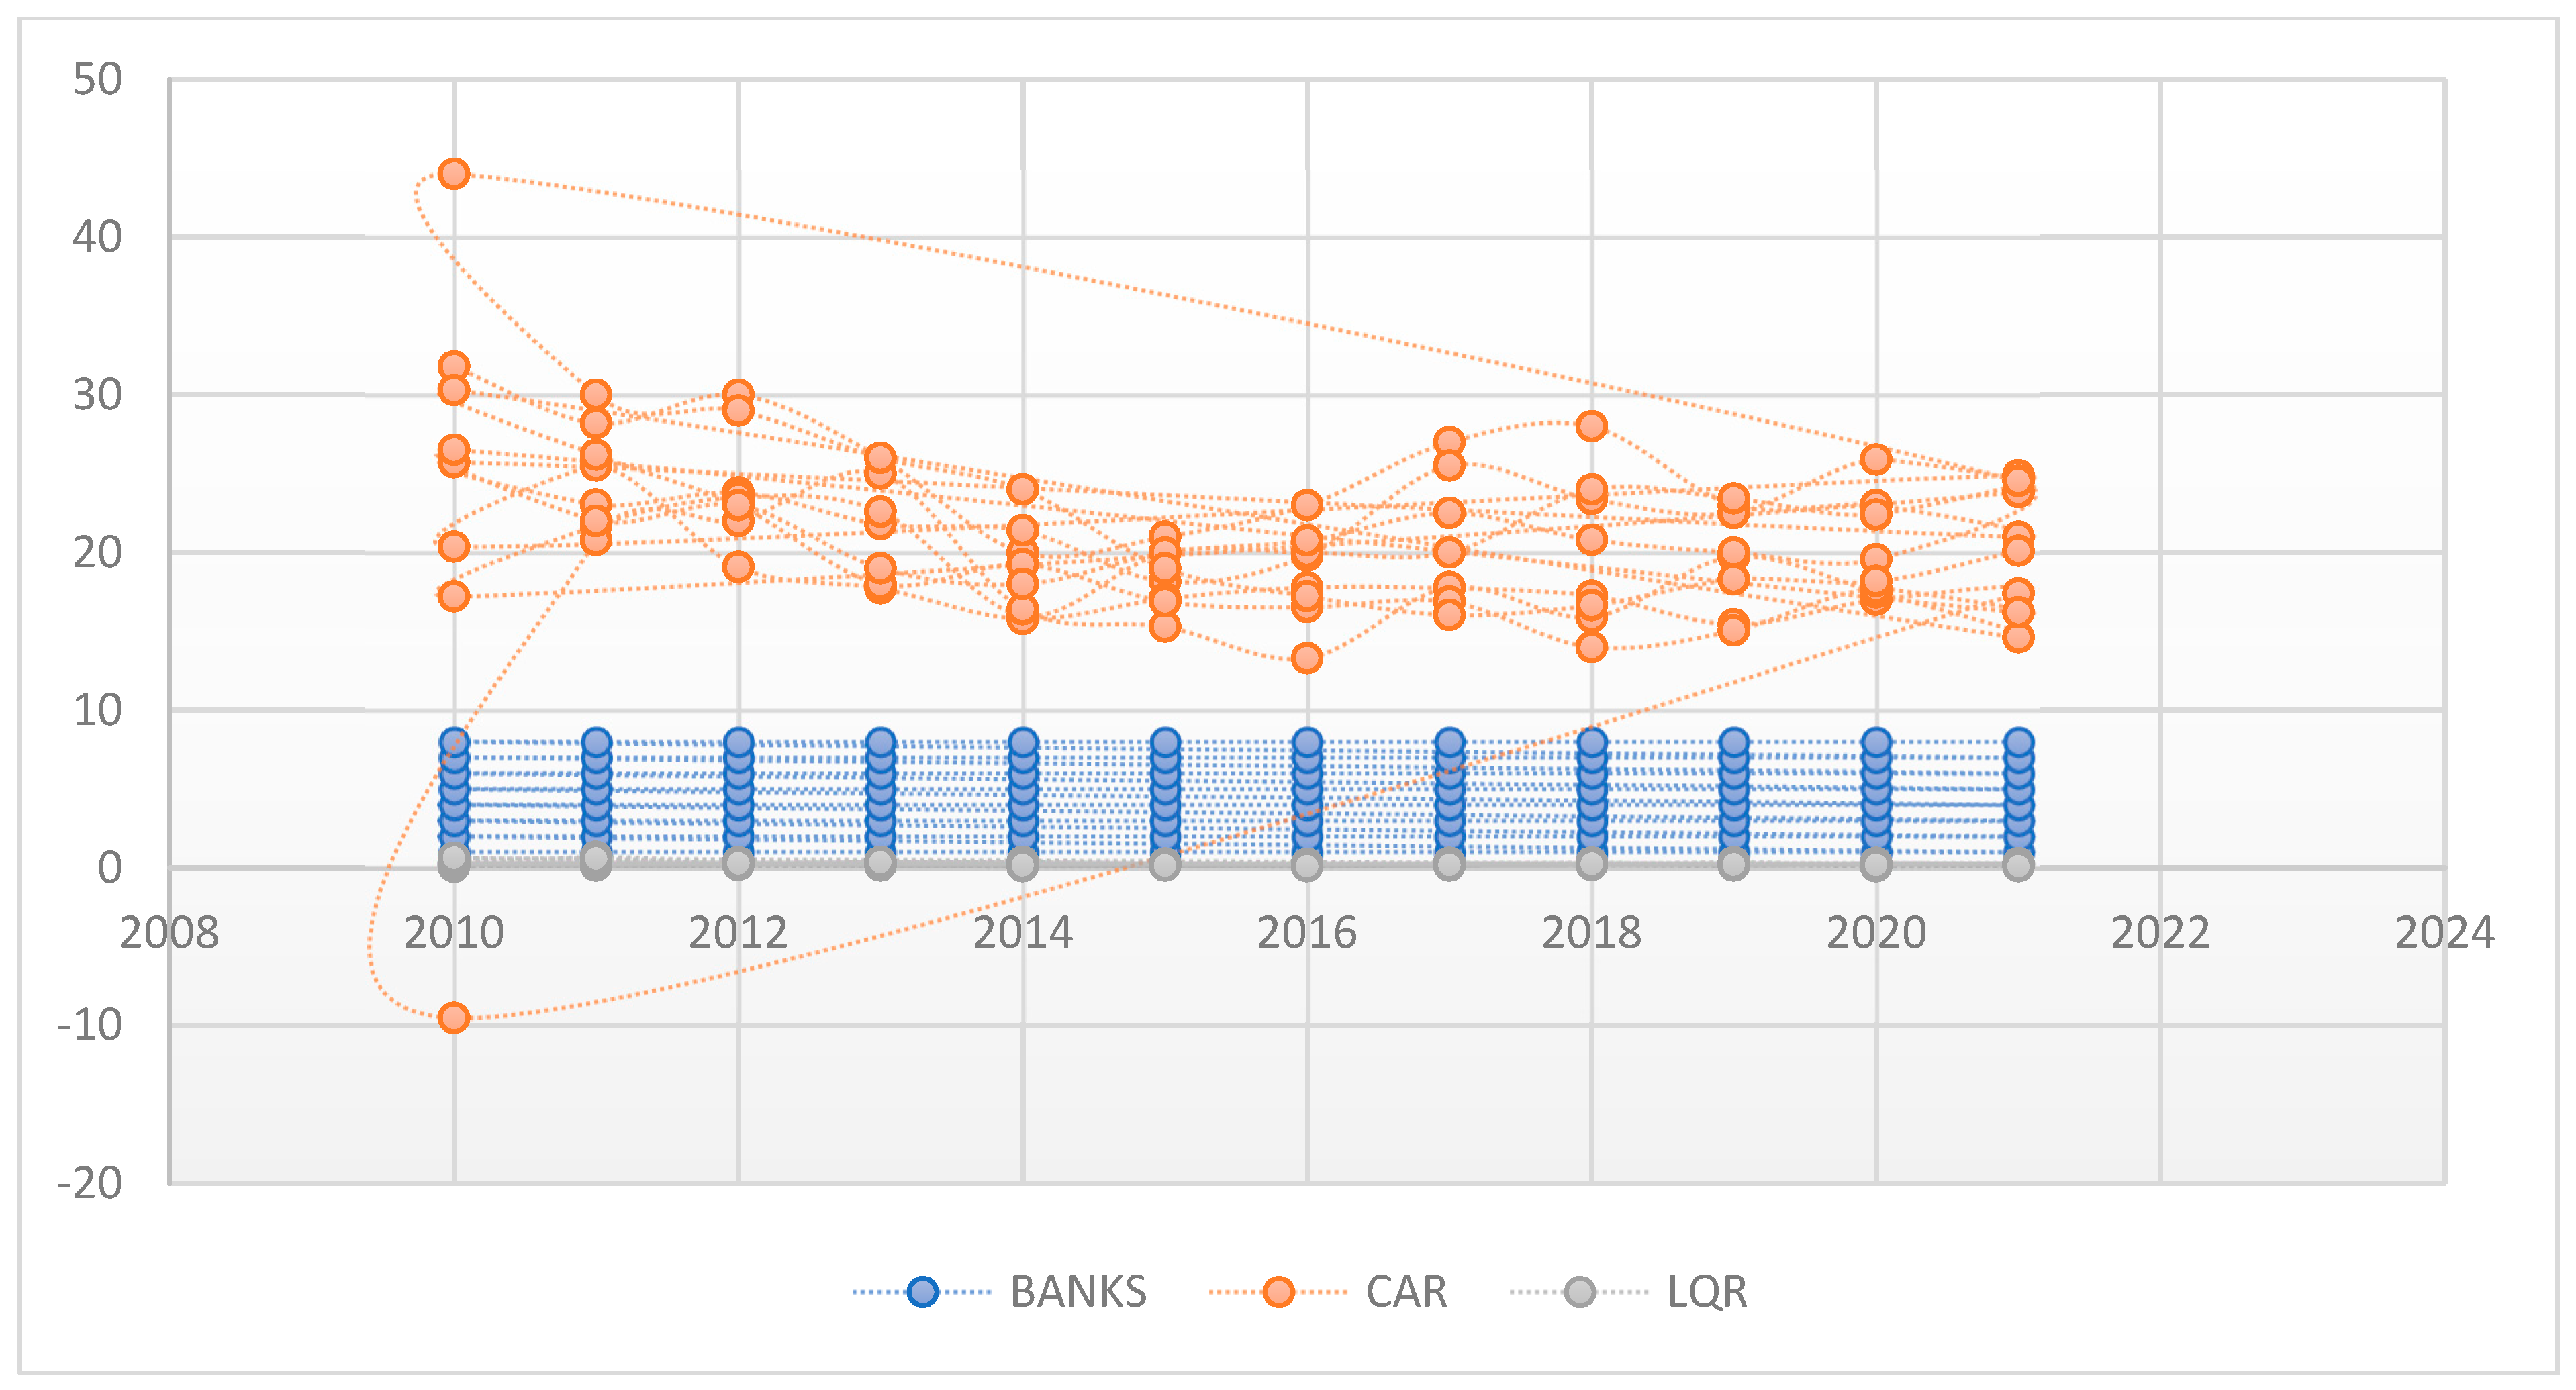
Table 1.
Variable description and measurement.
| S/N | VARIABLE | ABRREVIATION | TYPE | MEASUREMENT |
|---|---|---|---|---|
| 1 | Return on Equity | ROE | Dependent | Profit after tax Shareholders’ Fund |
| 2 | Capital Adequacy Ratio | CAR | Independent | Shareholders’ Fund Risk Weighted Assets |
| 3 | Loan to Deposit Ratio | LDR | Independent | Total Loans & Advances Total Deposits |
| 4 | Loan Loss Provision | LLP | Independent | Loan Loss Provision Non-Performing Loans |
| 5 | Liquidity Ratio | LQR | Independent | Cash & Cash Equivalents Total Assets |
| 6 | Non-Performing Loan Ratio | NPLR | Independent | Non-Performing Loans Total Loans & Advances |
| 7 | Risk Asset Ratio | RAR | Independent | Total Loans & Advance Total Assets |
| 8 | Size | SZ | Independent | Log of Total Assets |
Table 2.
Descriptive statistics.
| ROE | CAR | LDR | LLP | LQR | NPLR | RAR | SZ | |
|---|---|---|---|---|---|---|---|---|
| Mean | 13.34 | 20.88 | 68.01 | 105.61 | 0.24 | 5.82 | 46.12 | 28.52 |
| Median | 12.25 | 20.23 | 65.05 | 97.75 | 0.22 | 4.10 | 45.02 | 28.52 |
| Maximum | 59.84 | 44.00 | 109.33 | 260.34 | 0.70 | 40.42 | 88.48 | 30.09 |
| Minimum | −91.95 | −9.51 | 33.79 | 39.26 | 0.07 | 1.19 | 17.77 | 26.93 |
| Std. Dev. | 16.80 | 5.66 | 16.43 | 41.27 | 0.10 | 5.97 | 11.20 | 0.73 |
| Observations | 96 | 96 | 96 | 96 | 96 | 96 | 96 | 96 |
Computed with the use of EView 8.0.
Table 3.
Correlation results.
| Correlation | ||||||||
| t-Statistic | ||||||||
| Probability | ROE | CAR | LDR | LLP | LQR | NPLR | RAR | SZ |
| ROE | 1 | |||||||
| CAR | 0.404 | 1 | ||||||
| p-value | 0.000 | ----- | ||||||
| LDR | 0.088 | −0.046 | 1 | |||||
| p-value | 0.393 | 0.658 | ----- | |||||
| LLP | 0.114 | 0.003 | −0.285 | 1 | ||||
| p-value | 0.270 | 0.980 | 0.005 | ----- | ||||
| LQR | −0.214 | 0.365 | −0.244 | −0.130 | 1 | |||
| p-value | 0.037 | 0.000 | 0.017 | 0.207 | ----- | |||
| NPLR | −0.609 | −0.183 | −0.191 | −0.277 | 0.323 | 1 | ||
| p-value | 0.000 | 0.074 | 0.063 | 0.006 | 0.001 | ----- | ||
| RAR | 0.188 | −0.014 | 0.856 | −0.280 | −0.248 | −0.226 | 1 | |
| p-value | 0.066 | 0.893 | 0.000 | 0.006 | 0.015 | 0.027 | ----- | |
| SZ | 0.414 | −0.035 | −0.245 | 0.341 | −0.153 | −0.215 | −0.071 | 1 |
| p-value | 0.000 | 0.737 | 0.016 | 0.001 | 0.137 | 0.035 | 0.490 | ----- |
Computed with the use of EView 8.0.
Table 4.
Test results of endogeneity of independent variables.
| Independent Variables | Coefficient | Std. Error | t-Statistic | Prob. |
|---|---|---|---|---|
| RESID01_CAR | −0.28026 | 0.19731 | −1.42039 | 0.15550 |
| RESID01_LDR | −0.03628 | 0.14681 | −0.24710 | 0.80550 |
| RESID01_LLP | −0.06703 | 0.03697 | −1.81338 | 0.07350 |
| RESID01_LQR | −11.86035 | 13.18938 | −0.89924 | 0.37120 |
| RESID01_NPLR | −1.27231 | 0.20911 | −6.08443 | 0.06101 |
| RESID01_RAR | 0.18221 | 0.22182 | 0.82146 | 0.41380 |
| RESID01_SZ | −4.21999 | 9.93175 | −0.42490 | 0.67220 |
Computed with the use of EViews 8.0.
Table 5.
Test of stationarity of the variables.
| VARIABLES | TEST | LLC | ADS-Fisher | PP-Fisher |
|---|---|---|---|---|
| ROE | SECOND DIFF | −19.3386 | 105.8670 | 140.6920 |
| CAR | SECOND DIFF | −8.8047 | 79.0755 | 156.4580 |
| LDR | SECOND DIFF | −7.7432 | 67.0334 | 122.7150 |
| LLP | SECOND DIFF | −9.7680 | 83.6458 | 148.6460 |
| LQR | SECOND DIFF | −12.4160 | 102.4800 | 145.8130 |
| NPLR | SECOND DIFF | −9.6029 | 84.0210 | 143.0050 |
| RAR | SECOND DIFF | −9.6233 | 84.1663 | 130.2030 |
| SZ | SECOND DIFF | −7.9411 | 74.8139 | 143.4430 |
Computed with the use of EViews 8.0. All the variables are at the 1% level of statistical significance. LLC: Levin, Lin & Chu test, ADS–Fisher Chi-square, PP–Fisher Chi-square. Computed with the use of EViews 8.0.
Table 6.
Hausman’s test results.
| Model | Dependent | Chi-Square | Chi-Squared | Probability |
|---|---|---|---|---|
| 1 | Variable | Statistic | d.f | p-value |
| ROE | 33.109584 | 7 | 0.0000 |
Computed with the use of EView 8.0.
Table 7.
Regression results for panel data—fixed effect model.
| Dependent Variable: ROE | |||||
|---|---|---|---|---|---|
| Variable | Coefficient | Std. Error | t-Statistic | Prob. | VIF |
| CAR | 1.15170 | 0.24748 | 4.65365 | 0.00000 | 1.99351 |
| LDR | −0.03628 | 0.14681 | −0.24710 | 0.80550 | 4.40585 |
| LLP | −0.06703 | 0.03049 | −2.19886 | 0.03070 | 1.61080 |
| LQR | −11.86035 | 13.18938 | −0.89924 | 0.37120 | 1.79171 |
| NPLR | −1.27231 | 0.20911 | −6.08443 | 0.00000 | 1.58734 |
| RAR | 0.18221 | 0.22182 | 0.82146 | 0.41380 | 4.24207 |
| SZ | 10.20536 | 2.61176 | 3.90747 | 0.00020 | 3.65881 |
| C | −290.44610 | 78.28885 | −3.70993 | 0.00040 | |
| R-squared | 0.71817 | Mean dependent var | 13.33931 | ||
| Adjusted R-squared | 0.66946 | S.D. dependent var | 16.80466 | ||
| S.E. of regression | 9.66149 | Akaike info criterion | 7.51677 | ||
| Sum squared resid | 7560.89000 | Schwarz criterion | 7.91745 | ||
| Log likelihood | −345.80510 | Hannan−Quinn criter. | 7.67873 | ||
| F-statistic | 14.74326 | Durbin−Watson stat | 1.77511 | ||
| Prob(F-statistic) | 0.00000 | ||||
Computed with the use of EViews 8.0.
Table 8.
CBN statutory ratios on customers’ deposits.
| YEAR | LIQUIDITY RATIO–LQR (%) | CASH RESERVE RATIO–CRR (%) | TOTAL (LQR + CRR) = A | % AMOUNT AVAILABLE FOR LENDING (100–A) |
|---|---|---|---|---|
| 2010 | 25.0 | 1.0 | 26.0 | 74.0 |
| 2011 | 30.0 | 8.0 | 38.0 | 62.0 |
| 2012 | 30.0 | 12.0 | 42.0 | 58.0 |
| 2013 | 30.0 | 12.0 | 42.0 | 58.0 |
| 2014 | 30.0 | 20.0 | 50.0 | 50.0 |
| 2015 | 30.0 | 20.0 | 50.0 | 50.0 |
| 2016 | 30.0 | 22.5 | 52.5 | 47.5 |
| 2017 | 30.0 | 22.5 | 52.5 | 47.5 |
| 2018 | 30.0 | 22.5 | 52.5 | 47.5 |
| 2019 | 30.0 | 22.5 | 52.5 | 47.5 |
| 2020 | 30.0 | 27.5 | 57.5 | 42.5 |
| 2021 | 30.0 | 32.5 | 62.5 | 37.5 |
Disclaimer/Publisher’s Note: The statements, opinions and data contained in all publications are solely those of the individual author(s) and contributor(s) and not of MDPI and/or the editor(s). MDPI and/or the editor(s) disclaim responsibility for any injury to people or property resulting from any ideas, methods, instructions or products referred to in the content. |
© 2023 by the authors. Licensee MDPI, Basel, Switzerland. This article is an open access article distributed under the terms and conditions of the Creative Commons Attribution (CC BY) license (https://creativecommons.org/licenses/by/4.0/).
Share and Cite
MDPI and ACS Style
Natufe, O.K.; Evbayiro-Osagie, E.I. Credit Risk Management and the Financial Performance of Deposit Money Banks: Some New Evidence. J. Risk Financial Manag. 2023, 16, 302. https://doi.org/10.3390/jrfm16070302
AMA Style
Natufe OK, Evbayiro-Osagie EI. Credit Risk Management and the Financial Performance of Deposit Money Banks: Some New Evidence. Journal of Risk and Financial Management. 2023; 16(7):302. https://doi.org/10.3390/jrfm16070302
Chicago/Turabian StyleNatufe, Oritsegbubemi Kehinde, and Esther Ikavbo Evbayiro-Osagie. 2023. "Credit Risk Management and the Financial Performance of Deposit Money Banks: Some New Evidence" Journal of Risk and Financial Management 16, no. 7: 302. https://doi.org/10.3390/jrfm16070302