
Modeling Funding for Industrial Projects Using Machine Learning: Evidence from Morocco


Laboratory of Research and Studies in Management, Entrepreneurship and Finance (LAREMEF), National School of Commerce and Management of Fez, Sidi Mohamed Ben Abdellah University, Fes 30050, Morocco
*
Author to whom correspondence should be addressed.
J. Risk Financial Manag. 2024, 17(4), 173; https://doi.org/10.3390/jrfm17040173
Submission received: 11 March 2024
/
Revised: 10 April 2024
/
Accepted: 13 April 2024
/
Published: 22 April 2024
(This article belongs to the Section Financial Technology and Innovation)
Abstract
:Moroccan manufacturing companies investing in the metallurgical, mechanical, and electromechanical industries sector are among the contributors to the growth of the national economy. The projects they are awarded do not have the same specific features as those of operating activities within other companies. They share several common features, making them particularly complex to fund. In such circumstances, supervised machine learning seems to be a suitable instrument to help such enterprises in their funding decisions, especially given that linear regression methods are inadequate for predicting human decision making as human thinking is a complicated system and not linear. Based on 5198 industrial projects of 53 firms operating in the said sector, four machine learning models are used to predict the funding method for some industrial projects, including are decision tree, random forest, gradient boosting, and K-nearest neighbors (KNN). Among the four machine learning methods, the gradient boosting method appears to be most effective overall, with an accuracy of 99%.
1. Introduction
Based on findings confirmed by the Moroccan macroeconomic context, it is characterized by growing difficulty in accessing funding for small and medium-sized enterprises and for large ones, and the banking market is characterized by under-liquidity and significant funding needs following the launch of structuring national projects. Furthermore, the microeconomic context, represented by the metallurgical, mechanical, and electromechanical industries sector, is of vital importance to all industrial and agricultural activities. In recent years, it has seen significant growth, with promising prospects for the future. The particularity of Moroccan companies investing in this sector is that the projects they are awarded generally require massive investment in the initial phase, and they only generate sufficient cash flow in the long term to cover costs and debt servicing, especially when they operate for the benefit of public-sector customers, who are notorious for their late payments to suppliers. As a result, the loans granted have to be long-maturity, with longer grace periods than conventional loans. These projects do not have the same specific features as those of operating activities within other companies. They share several common features, making them particularly complex to fund. Aside from the funding of these projects, which is a difficult headache to solve, industrial project requirements call for the mobilization of significant financial resources, which, in the majority of cases, exceed the possibilities of the entities responsible for carrying out these investments, resulting in difficulties in managing the activity.
As mentioned above, our motivation is to identify an efficient model that can help these enterprises in their decision to fund industrial projects.
Multiple studies have focused on this particular topic of funding in Morocco, as shown in Table 1. However, researchers mainly rely on correlation analysis or regression analysis to test attributes’ influence on evaluation results. However, linear regression methods are inappropriate for predicting human decision making as human thinking is a complicated system and not linear. Under such circumstances, traditional linear statistical methods may fall short of expectations in providing effective prediction results (Kuzey et al. 2014). As an interdisciplinary tool, machine learning seems to be efficient in solving this problem. In essence, machine learning is a model to find the unknown function, dependency, or structure between inputs and outputs, which cannot be represented by explicit algorithms, through an automatic learning process (Voyant et al. 2017).
Machine learning models have been used in many cases, such as, for example, in pattern recognition, classification problems, spam filtering, and in data mining and forecasting problems (Voyant et al. 2017). Additionally, the majority of studies carried out in the Moroccan context focus on financing for small and medium-sized enterprises, rather than industrial companies. Also, right now, no research has been carried out with such an extensive sample.
2. Literature Review
The application of machine learning algorithms in corporate funding has been examined by a number of researchers.
As every member state in the EU has a different system in place for classifying and categorizing its funding projects, ONDŘEJ ZAMAZAL looked into the possibility of automating this process based on the descriptions of the projects (Zamazal 2019).
This is because there is a harmonization issue with the categorization of funding projects within the EU. The length of the description, its quality (raw data or lexical descriptions), and the language used to describe the project were among the factors the author examined to determine how accurate the SVM algorithm was in classifying funding projects. The data examined included the 123 types of funding initiatives that EU funds have stepped in to support between 2014 and 20+. The study’s findings demonstrated that the machine learning SVM method provides more precise classification when the projects are described more thoroughly than when they are briefly described, both in English and other languages.
Markus Bauer, Clemens van Dinther, and Daniel Kiefer investigated the variables that influence the adoption of machine learning by businesses, encompassing large, medium, and small enterprises across several industries (Bauer et al. 2020).
They carried out a qualitative empirical study on eighteen businesses comprising large, small, and medium-sized enterprises across several industry sectors. The study concentrated on 18 businesses in various industries that employed more than 500 people in 2019 and fewer than 500 people in 2019.
The findings showed that while large companies (those with more than 500 employees) have incorporated machine learning (ML) into their organizational structures and use it extensively in their daily operations, the majority of small and medium-sized businesses have not done so yet. This is primarily because these businesses are still largely unaware of the value and applications of ML in the workplace.
To assist creative businesses in obtaining government funding more readily, Chuqing Zhang, Han Zhang, and Xiaoting Hu discuss which algorithm—logistic regression, decision tree, KNN, SVM, or ANN—is more pertinent (Zhang et al. 2019).
In total, 28% of the 4900 creative start-up initiatives in Beijing, China that were the subject of the study received funding. In order to determine the predictive accuracy of machine learning algorithms for predicting the likelihood of securing funding from Beijing Innofund, a Chinese government fund for innovative companies, they considered one output variable and fourteen input variables that met Beijing Innofund’s validation and scoring criteria.
The analysis covers all innovative start-up ventures from Beijing Innofund’s inception to the present. The results showed that all ML algorithms can forecast with an accuracy of more than 80%, and that based on the outcomes of the different ML algorithms’ predictions, the SVM provides the most precision.
Chuqing Zhang, Jiangyuan Yao, Guangwu Hu, and Xingcan Cao investigated the possibilities of enhancing budget distribution criteria among decision makers in order to prevent psychological biases among evaluators in decision making (Zhang et al. 2023).
They conducted a study on 8150 projects, 1395 of which received money, and attempted to anticipate the responses of evaluators based on their ages, gender, religion, marital status, and so on to see if there was a relationship between the evaluator and their judgement of the financing project. The analysis covered the period from 2015 and includes all projects submitted to Beijing Innofund for financing.
The findings of the study revealed that the evaluator plays a significant role in project evaluation, and that ML algorithms using the same input can rectify psychological bias and improve decision making.
Jinwook Chung and Kyumin Lee investigated the possibility of using ML algorithms to improve entrepreneurs’ chances of raising funds on crowdfunding platforms (Chung and Lee 2015). The success rate of fundraising has clearly declined over the years due to entrepreneurs’ lack of preparation and knowledge of the types of projects likely to interest donors on crowdfunding platforms.
They examined 168,851 project pages on Kickstarter and their Twitter profiles to verify the success criteria that enabled these businesses to raise funding from contributors. The study looked at all projects submitted to Kickstarter between 2009 and 2014, as well as entrepreneurs’ Twitter profiles from 2013 to 2014.
The study’s findings demonstrated that the algorithms can anticipate fundraising success rates with an accuracy of more than 80% after analyzing all of the data accessible on the platform.
3. Data
Our study consists of six input variables and one output variable, as show in Table 2.
Data were collected through an online survey of 53 companies operating in the metallurgical, mechanical, and electromechanical industries sector based on the economic capital of the Kingdom, with the assistance of a regional investment center located in Casablanca.
We identified the characteristics of industrial projects that determine the funding method used by conducting semi-structured interviews with the managers of the companies. After that, the questionnaire link on Google Forms was sent to them. We received 5198 valid responses.
The collected data were used in this research to train machine learning algorithms to predict the funding method for some industrial projects.
“Funding method adopted” is the dependent variable; it can have as modalities the different sources of funding, such as factoring, leasing, financial leasing, initial public offering, advance on established entitlements, private equity, discount, securitization, bond issue, insurance credit, crowdfunding, etc.
4. Methodology
4.1. Machine Learning Methods to Predict Funding Method
- Decision tree
Decision trees (DTs) as it is shown in Figure 1, are used to predict a quantitative variable from independent variables using recursive partitioning. Trees consist of decision nodes and leaves. DT regression is built by considering standard deviation reduction to determine how to split a node into branches, either a leaf or another node. The nodes in the graph represent an event or choice and the edges of the graph represent the decision rules or conditions (Mahesh 2018). The root node is the first decision node divided based on the most relevant independent variable. Nodes are split again by considering the variable with the lowest sum of the squared estimate of errors (SSE) as the decision node. The dataset is divided based on the values of the selected variable. The process ends when a termination criterion is satisfied. The last leaves, or nodes, provide the dependent variable prediction, corresponding to the mean of the values associated with leaves.
- 2.
- Random forest
It is a machine learning algorithm introduced by (Breiman 2001) representing a modification of the bagging technique as it is shown in Figure 2. It innovatively incorporates random sub-sampling or the selection of m variables during the tree-building process. Unlike traditional tree-building methods, the random forest algorithm does not involve pruning, allowing for increased robustness and diversity in the ensemble of decision trees.
The random forest method is fundamentally based on generating multiple decision trees. The predictive outcome is determined by averaging the predictions provided by these distinct trees. In the construction of each decision tree within the random forest, a data sample is deliberately chosen from the training dataset, while the remaining data are utilized to estimate the decision tree error. Notably, the subset of independent variables used for splitting each node is randomly selected, contributing to the algorithm’s adaptability and resilience to overfitting. Additionally, an adapted version known as Extremely Randomized Trees (ERT) introduces slight modifications to the random forest algorithm.
- 3.
- KNN
It stands for K-nearest neighbors regression. It is a versatile method as it is shown in Figure 3. used for both classification and regression. This algorithm calculates the distance between a data point and training dataset points using a specified distance metric (e.g., Euclidean or Mahalanobis distance) and a chosen value k. The k nearest points are selected, and their average serves as the prediction. An enhanced version, weighted k-nearest neighbors (WKNN), predicts based on a weighted arithmetic mean. KNN is widely used in various domains, including pattern recognition, data mining, and intrusion detection (Xiong and Yao 2021).
- 4.
- Gradient boosting
Gradient boosting was introduced by (Friedman 2001). It is a supervised learning method that sequentially combines weak learners in an additive ensemble (Duan et al. 2020). The model is learned sequentially, where the next base learner is fit against the training objective residual of the current ensemble. The output of the fitted base learner is then scaled by a learning rate and added to the ensemble. Shallow decision trees are often preferred. When fitting a tree to the gradient, the algorithm minimizes variance in slices, and the leaf node’s prediction value minimizes the loss effectively. This approach is now considered for predicting parameters θ in probabilistic regression.
4.2. Evaluation of the Model’s Performance
Metrics in machine learning have a crucial role in evaluating the performance of models, especially in the context of classification. They make it possible to quantify to what extent a model is capable of making correct decisions about the predictions it generates.
First of all, the evaluation metrics are used to evaluate the generalization capacity of the trained classifier. In this case, the evaluation metric is used to measure and summarize the quality of trained classifiers when tested with the invisible data (Hossin and Sulaiman 2015).
Secondly, the evaluation metrics are used as evaluators for the selection of the suitable model (Hossin and Sulaiman 2015).
Thirdly, the evaluation metrics are used as a discriminator to discriminate and select the optimal solution (best solution) among all of the solutions generated during the training classification (Hossin and Sulaiman 2015).
The metrics used in this article are the following.
- Confusion Matrix
The confusion matrix as it is shown in Figure 4. is a fundamental tool in the world of machine learning used to evaluate the performance of a classification model. This is a square matrix that displays the number of correct and incorrect predictions made by the model on a dataset. It predicts results that must be compared to reality to measure the degree of performance.
We usually use the confusion matrix, also called the contingency table. To calculate a confusion matrix, we need a set of test data and another set of validation data, which contains the values of the results obtained. The matrix is organized into four main components.
True Positives (TPs): The number of instances that were correctly predicted as positive by the model.
True Negatives (TNs): The number of instances that were correctly predicted as negative by the model.
False Positives (FPs): The number of instances that were mistakenly predicted as positive when they were negative.
False Negatives (FNs): The number of instances that were wrongly predicted as negative when they were positive.
The confusion matrix provides a complete summary of the performance of a model, allowing for the calculation of various evaluation measures such as accuracy, precision, recall, and F1 score. It is particularly useful in scenarios where the distribution of classes may be unbalanced, which makes it possible to better understand the extent to which the model distinguishes between different classes.
- 2.
- Accuracy
It represents the ratio of correctly predicted instances to the total number of samples in the dataset. It serves as a fundamental measure to evaluate the performance of a model. However, caution should be exercised when interpreting accuracy, especially in scenarios where the distribution of classes is very unbalanced. In such cases, accuracy alone may not provide a complete understanding of the effectiveness of the model. Put differently, accuracy refers to the proportion of correctly identified cases in relation to the total number of cases, while the error rate refers to cases that have been identified in error in relation to the total number of cases. To calculate it, we use this equation (Ciciana et al. 2023):
- 3.
- F1 score
The F1 score is a metric that serves as a harmonic average between recall and accuracy. It provides a balanced measure when it is necessary to take into account both recall and accuracy in the evaluation of a classification model. To calculate the F1 score, we use this formula (Ciciana et al. 2023):
It aggregates the precision and recall measurements under the concept of the harmonic mean. It is useful when there is a desire to find a balanced compromise between accuracy and recall. The formula ensures that the relative contributions of accuracy and recall are equal, and the F1 score reaches its best value at 1 and its worst score at 0.
The harmonic average used in the F1 score tends to give more weight to smaller classes and rewards models that present similar accuracy and recall values. This is illustrated by the fact that the F1 score penalizes models with imbalances between accuracy and recall.
- 4.
- Precision
Precision is a metric that measures the proportion of correctly identified positive instances among all of the instances identified as positive by the model. It expresses the proportion of units that our model says are positive and that are positive. In other words, the accuracy tells us how much we can trust the model when it predicts that an individual is positive (Grandini et al. 2020).
It is calculated as the ratio of True Positives (TPs) to the sum of True Positives (TPs) and False Positives (FPs). It is a precision formula:
Put differently, it evaluates the accuracy of the model when it predicts a positive class. It indicates the extent to which the model distinguishes between actual positive predictions and instances that have been incorrectly classified as positive (False Positives). A higher accuracy score reflects a lower rate of False Positives and, consequently, a higher level of confidence in the positive predictions made by the model.
- 5.
- Recall
Recall is also another metric that measures the proportion of correctly identified positive instances among all truly positive instances. This is the ratio of True Positives (TPs) to the sum of True Positives (TPs) and False Negatives (FNs).
The recall is the fraction of True Positive elements divided by the total number of positively classified units (row sum of the actual positives). In particular, False Negatives are the elements that have been labeled as negative by the model but are positive (Grandini et al. 2020).
The recall measures the model’s predictive accuracy for the positive class; intuitively, it measures the ability of the model to find all of the Positive units in the dataset (Grandini et al. 2020).
We use the following formula (Grandini et al. 2020) to calculate it:
It is used to evaluate the ability of a classification model to correctly classify all positive instances. This is especially important in situations where the consequences of the absence of positive instances (False Negatives) are significant and it is necessary to minimize these errors. A higher recall indicates better performance in the correct identification of positive patterns.
5. Results and Discussion
5.1. Comparison of Prediction Results of Classifiers
Table 3 compares four classifiers—random forest, KNN, decision tree, and gradient boosting—in a finance classification task. Random forest, decision tree, and gradient boosting exhibit excellent performance, with 0.93 in accuracy, recall, and the F1 score and 0.94 in precision. This indicates a strong, balanced classification ability across all 13 classes. KNN, however, shows a notably lower performance (accuracy: 0.64; precision: 0.61; recall: 0.64; F1 score: 0.61), suggesting it is less effective for this specific task. The high consistency in the top three models’ scores across all metrics indicates their robustness and suitability for complex financial data classification.
This confusion matrix in Figure 5. represents the performance of a random forest classifier on a dataset with 13 financial classes. Here are some observations.
The diagonal values represent correct predictions, with high numbers indicating strong performance for classes like “initial public offering”, “financial leasing”, and “private equity”.
The classes “securitization” and “insurance credit/EULER HERMES” have significant misclassifications, as indicated by the non-diagonal values in their rows.
“Advance on established entitlements” and “leasing” are perfectly classified, with no confusion with other classes.
“Maroc factoring” seems to be frequently misclassified as “advance on established entitlements”, suggesting a possible overlap or similarity in features used for these classes.
“Securitization” is often confused with “leasing”, which might indicate a similarity in their characteristics or insufficient distinctive features in the dataset.
“Insurance credit/COFACE” and “insurance credit/EULER HERMES” have some confusion, likely due to their similar nature, which the model struggles to distinguish.
Overall, the model performs well for some classes but poorly for others, suggesting that it could benefit from more discriminative features or class-specific tuning.
This confusion matrix in Figure 6. displays the performance of a K-nearest neighbors (KNN) classifier on the same dataset.
The KNN model has perfect predictions for “advance on established entitlements”, “initial public offering”, “financial leasing”, and “private equity”.
“Securitization” has notable confusion with “leasing” and “insurance credit/EULER HERMES”, suggesting potential feature overlap or mislabeling.
“Insurance credit/EULER HERMES” is correctly predicted but has misclassifications with “leasing” and “securitization”, which could be due to the similarity of the financial products.
The off-diagonal values for “maroc factoring” indicate that this class is challenging for the KNN model to predict accurately, as it shows many misclassifications with “advance on established entitlements”.
Similarly to the random forest model, the KNN classifier performs well for some classes, but it struggles with others, which might be improved with more training data or feature engineering.
This confusion matrix in Figure 7. shows the results of a decision tree classifier.
High accuracy is evident for “advance on established entitlements”, “initial public offering”, “financial leasing”, and “private equity”, with perfect classification.
“Maroc factoring” is frequently confused with “advance on established entitlements”, indicating potential feature similarity or mislabeling issues.
“Securitization” shows confusion with “leasing”, a trend consistent across different models, which could suggest that these classes share similar characteristics or that the model lacks distinguishing features.
“Securitization” and “insurance credit/EULER HERMES” show some misclassification, reflecting the challenge in differentiating these similar classes.
Unlike the random forest and KNN models, the decision tree has one instance where “discount” is misclassified as “bond issue”.
The decision tree shows a balanced performance across most classes, with some challenges in differentiating between closely related financial products.
Improvement of this model could involve addressing the misclassifications by refining features or providing more granular data to help distinguish between the challenging classes.
This confusion matrix in Figure 8. represents the results from a gradient boosting classifier.
The classifier performs exceptionally well for “advance on established entitlements”, “leasing”, “initial public offering”, “financial leasing”, and “private equity”, with 100% correct predictions.
“Discount” and “insurance credit/COFACE” classes have very few misclassifications, suggesting the model handles them well but with room for a slight improvement.
“Maroc factoring” is often confused with “advance on established entitlements”, and “securitization” is misclassified as “leasing”, similarly to previous models, indicating a consistent challenge in distinguishing these classes.
“Insurance credit/EULER HERMES” has a significant number of instances misclassified as “leasing and securitization “, which is a common issue across all models, pointing to intrinsic similarities between these classes.
The gradient boosting model shows a strong overall performance, with most classes having high True Positive rates and only a few instances of confusion between classes.
To enhance the model, strategies could include improving the feature set or employing techniques to better differentiate between the classes that are currently being confused.
This confusion matrix in Figure 9. appears to be a combined visualization representing the aggregated results of multiple classifiers over a larger dataset.
The matrix shows very high correct classification rates for “advance on established entitlements”, “leasing”, “initial public offering”, “financial leasing”, and “private equity”, with counts in the hundreds.
“Maroc factoring” has a considerable number of instances (60) misclassified as “advance on established entitlements”, the highest misclassification in the matrix.
“Securitization” has 104 instances misclassified as “leasing”, and there are 27 instances where “insurance credit/EULER HERMERS” is misclassified as “securitization”, indicating a bidirectional confusion between these two classes.
“Insurance credit/COFACE” has some instances (8) misclassified as “financial leasing”.
The off-diagonal entries for “discount” show a slight confusion with “initial public offering” and “bond issue”, although the numbers are relatively low.
Overall, the combined matrix suggests that the models are performing well for most classes, with high accuracy, but they are facing challenges with a few classes that have similar features or are perhaps not well-represented in the training data.
5.2. Robust Check of Classifiers
Table 4 compares the performance metrics of four machine learning models (random forest, KNN, decision tree, and gradient boosting) across different train sizes.
Gradient boosting consistently outperforms other models across all train sizes, achieving perfect precision, recall, F1 score, and accuracy at a train size of 0.8.
Random forest shows strong performance, with metrics above 0.998 across all train sizes.
Decision tree performance is slightly lower than random forest but remains high, with metrics above 0.996.
KNN has the most variable performance, with precision, recall, F1 score, and accuracy significantly lower than the other models.
Performance generally improves for all models as the train size increases, indicating that more training data contribute to better model accuracy.
The high metrics suggest that the models are very well-tuned to the dataset, potentially to the point of overfitting given the near-perfect scores across multiple models.
The line graph (Figure 10) displays the accuracy of four different machine learning models as a function of data size.
Gradient boosting exhibits perfect accuracy across all data sizes, suggesting an excellent fit to the data.
Random forest and decision tree models show a very high and stable accuracy, close to 1.00, regardless of the data size.
KNN significantly underperforms compared to the other models, with accuracy remaining below 0.7 across all data sizes.
The accuracy of KNN does not improve with increased data size, indicating potential issues with its parameter settings or the nature of the data not suiting the KNN algorithm well.
The graph indicates that gradient boosting, random forest, and decision tree models are likely robust to variations in data size, maintaining high accuracy throughout.
The consistently high accuracy across data sizes for the top-performing models may suggest that they are not sensitive to the amount of data, which can be an indicator of good generalization; however, the potential for overfitting should also be considered.
Figure 11 illustrates the recall metric for four different models across various data sizes.
Gradient boosting maintains a perfect recall score of 1.00 across all data sizes, indicating that it consistently identifies all relevant instances.
Random forest also maintains a high recall score, close to 1.00, which does not fluctuate with changes in data size.
Decision tree performance in terms of recall is stable and remains high, though not quite perfect, across the different data sizes.
KNN performs significantly less well in recall compared to the other models, with no apparent improvement as data size increases.
The graph suggests that both random forest and gradient boosting are robust to changes in data size regarding recall, while KNN’s recall score is notably poor regardless of data size.
The consistent performance of gradient boosting and random forest across data sizes might indicate strong generalization capabilities, particularly for gradient boosting.
The graph (Figure 12) shows the F1 scores for four machine learning models across different data sizes.
Gradient boosting achieves a perfect F1 score of 1.00 at all data sizes, indicating a balance between precision and recall.
Random forest and decision tree models have very high and stable F1 scores, close to 1.00, across all data sizes.
KNN has a significantly lower F1 score, which does not improve with increased data size, indicating that the model may not be well-suited for the dataset or requires parameter optimization.
The consistent F1 scores for the top three models suggest that they are robust and that they may have a good balance between precision and recall, with gradient boosting being the most balanced.
The graph underlines the potential issue with KNN’s performance, which could be due to the nature of the data or the distance metric used within the KNN algorithm.
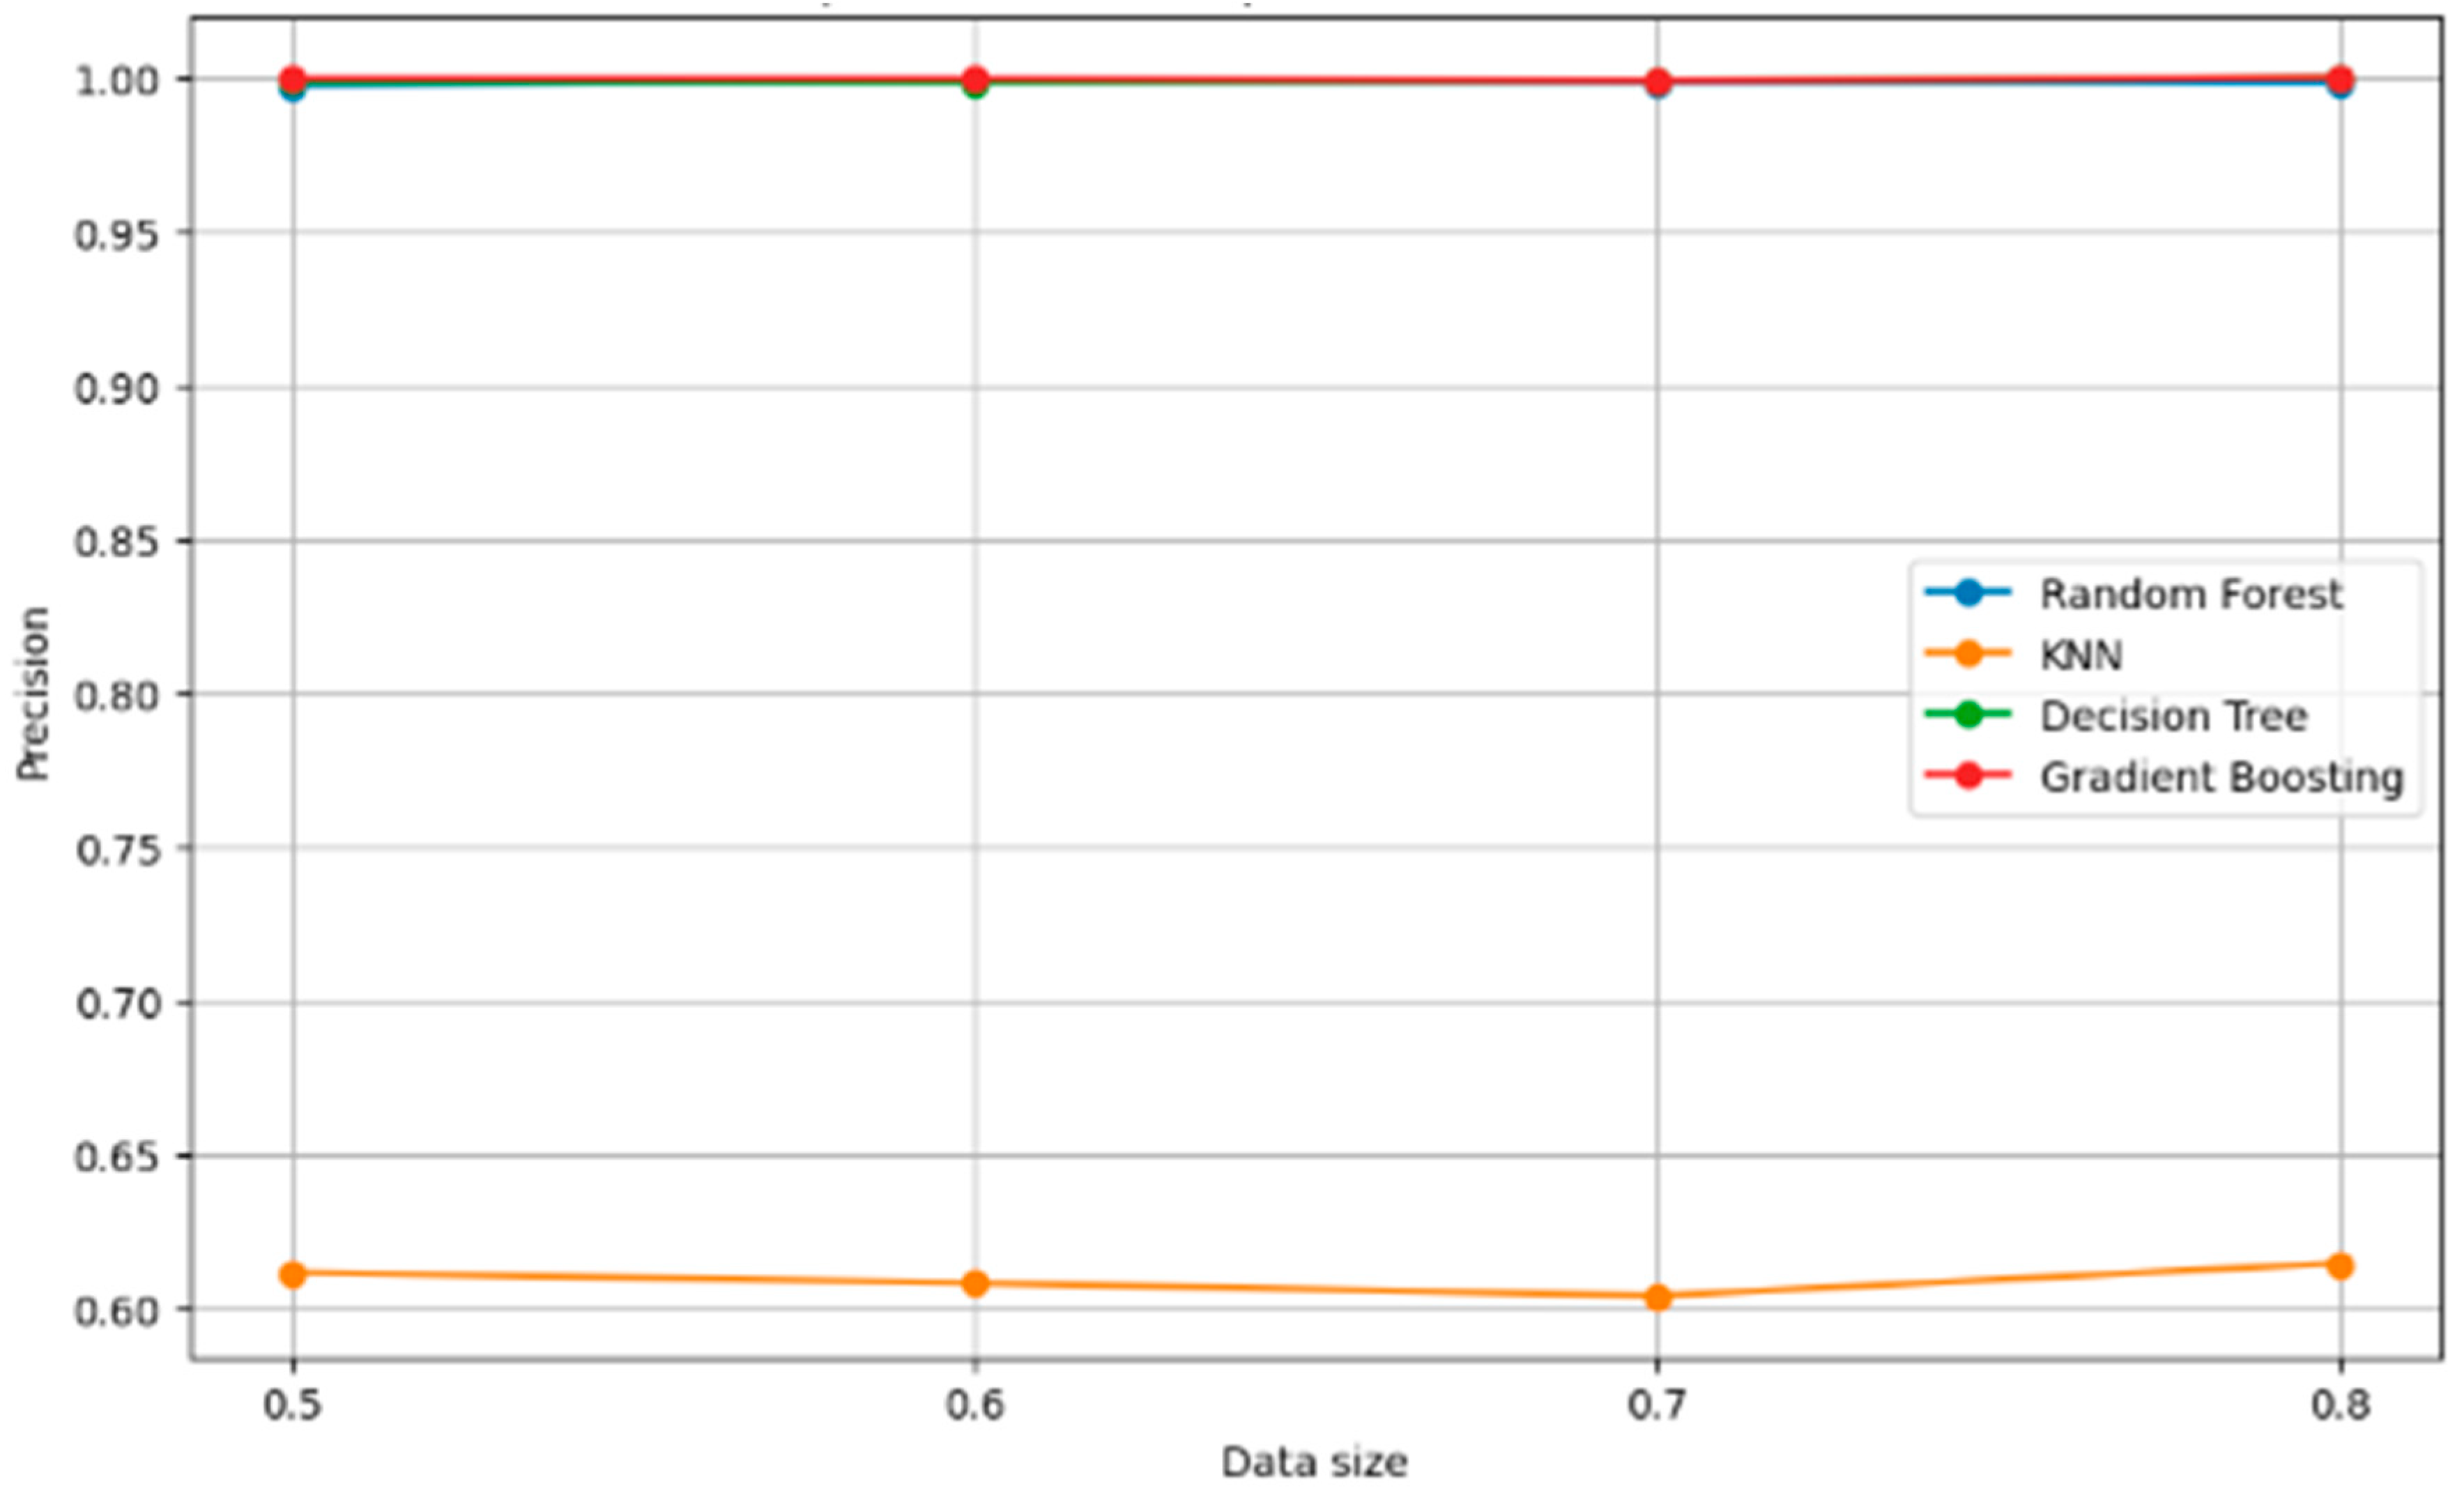
Figure 13 compares the precision of four different models across varying data sizes.
Gradient boosting maintains perfect precision (1.00) across all data sizes, indicating that all positive predictions are correct.
Random forest and decision tree models also show high precision, which is nearly perfect and constant across different data sizes.
KNN’s precision is significantly lower compared to the other models and remains consistent across data sizes, suggesting it may have difficulty accurately identifying positive instances.
The unchanging precision for KNN suggests that increasing the data size does not necessarily improve its performance, possibly due to the nature of the data or the need for hyperparameter tuning.
High precision across the board for the other models could indicate that they are particularly effective at avoiding False Positives.
The stability of precision for random forest and decision tree with increasing data size suggests that these models are robust in terms of making precise predictions, regardless of the amount of training data.
6. Conclusions
The objective of our study was to identify the most efficient model that can help these enterprises in their decision to fund industrial projects.
The findings from our investigation into the application of machine learning algorithms for financial classification are noteworthy. Our research meticulously evaluated and compared the efficacy of random forest, KNN, decision tree, and gradient boosting models, underscoring their potential in accurately categorizing financial data, a task of paramount importance in finance. Specifically, the random forest, decision tree, and gradient boosting models displayed remarkable precision and robustness, achieving high scores across various performance metrics. This demonstrates their strong capability to capture the intricate patterns in financial datasets, which is essential for informed decision making in finance. The comprehensive nature of our evaluation, including a range of metrics, such as accuracy, precision, recall, and F1 score, provides a multifaceted understanding of each model’s strengths, offering a significant contribution to both academic research and industry practices.
The application of these algorithms to the financial domain not only contributes to the theoretical advancement of machine learning applications in finance but also paves the way for practical tools capable of supporting real-world financial analysis. By rigorously assessing these models, our study provides a foundation for future developments in financial predictive analytics, positioning our research as a cornerstone upon which subsequent studies can build.
Despite the encouraging results, there are limitations inherent in the current research. The advanced algorithms, while accurate, present challenges in terms of interpretability. Their “black-box” nature may deter stakeholders who prioritize understanding the rationale behind predictive decisions. This is particularly salient in financial contexts where transparency is paramount.
The static nature of the dataset used is another limitation, given the dynamic and evolving landscape of financial markets. The models may not adapt well to new data or changing market conditions, potentially limiting their practicality for forecasting future trends.
Moreover, the KNN algorithm’s performance indicates a need for improved feature selection and dimensionality reduction to enhance its scalability and effectiveness in financial applications.
Looking forward, the exploration of additional sophisticated algorithms, such as LGBMClassifier, XGBClassifier, BaggingClassifier, and ExtraTreesClassifier, offers an avenue for addressing these limitations. These algorithms could potentially offer improvements in both predictive performance and operational efficiency.
As part of future work, we plan to apply these new models to the financial classification tasks, comparing their interpretability and adaptability to changing data. This subsequent research will seek to bridge the gap between high predictive accuracy and the need for transparency and dynamic learning in financial applications. By integrating these newer algorithms, we aim to not only expand the predictive toolkit available for financial analysts but also to enhance the robustness and interpretability of the models, catering to the real-world demands of financial data analysis.
In doing so, we also anticipate exploring hybrid models that combine machine learning with traditional econometric methods, which may yield a more nuanced understanding of the data and better inform strategic decision making. Ultimately, our goal is to contribute to a financial analytics framework that is both high-performing and user-friendly, offering actionable insights with a clear explanatory component.
Author Contributions
Conceptualization, S.L. and M.B.; methodology, S.L. and M.B.; software, S.L. and M.B.; validation, S.L. and M.B.; formal analysis S.L. and M.B.; investigation, S.L. and M.B.; resources, S.L. and M.B.; data curation, S.L. and M.B.; writing—original draft preparation, S.L. and M.B.; writing—review and editing, S.L. and M.B.; visualization, S.L. and M.B.; supervision, S.L. and M.B.; project administration, S.L. and M.B.; funding acquisition, S.L. and M.B. All authors have read and agreed to the published version of the manuscript.
Funding
This research received no external funding.
Data Availability Statement
Data sharing is not applicable to this article.
Conflicts of Interest
The authors declare no conflict of interest.
References
- Alami, Najia. 2022. Investment financing. Revue Internationale du Chercheur 3: 862–80. [Google Scholar]
- Amraoui, Mouna, Ye Jianmu, and Kenza Bouarara. 2018. Firm’s Capital Structure Determinants and Financing Choice by Industry in Morocco. International Journal of Management Science and Business Administration 4: 41–50. [Google Scholar] [CrossRef]
- Bauer, Markus, Clemens van Dinther, and Daniel Kiefer. 2020. Machine Learning in SME: An Empirical Study on Enablers and Success Factors. Paper presented at Americas Conference on Information Systems (AMCIS 2020), Online, August 10–14. [Google Scholar]
- Boushib, Kaoutar. 2020. Corporate Finance in Morocco: Econometrical Verification Tests based on data on Moroccan small and medium—Sized enterprises. Revue CCA 12: 180–91. [Google Scholar]
- Breiman, Leo. 2001. Random Forests. Machine Learning 45: 5–32. [Google Scholar] [CrossRef]
- Chung, Jinwook, and Kyumin Lee. 2015. A Long-Term Study of a Crowdfunding Platform: Predicting Project Success and Fundraising Amount. Paper presented at the 26th ACM Conference on Hypertext & Social Media, HT ‘15, Guzelyurt, Cyprus, September 1–4; New York: Association for Computing Machinery, pp. 211–20. [Google Scholar]
- Ciciana, Ciciana, Rahmawati Rahmawati, and Laila Qadrini. 2023. The Utilization of Resampling Techniques and the Random Forest Method in Data Classification. TIN: Terapan Informatika Nusantara 4: 252–59. [Google Scholar] [CrossRef]
- Duan, Tony, Anand Avati, Daisy Yi Ding, Khanh K. Thai, Sanjay Basu, Andrew Ng, and Alejandro Schuler. 2020. NGBoost: Natural Gradient Boosting for Probabilistic Prediction. Paper presented at the 37th International Conference on Machine Learning, Virtual Event, July 13–18. [Google Scholar]
- Fnitiz, Yassine. 2023. The contribution of participative banks to financing Moroccan SMEs. Research and Applications in Islamic Finance 7: 179–95. [Google Scholar]
- Friedman, Jerome H. 2001. Greedy Function Approximation: A Gradient Boosting Machine. The Annals of Statistics 29: 1189–232. [Google Scholar] [CrossRef]
- Grandini, Margherita, Enrico Bagli, and Giorgio Visani. 2020. Metrics for Multi-Class Classification: An Overview. Available online: http://arxiv.org/abs/2008.05756 (accessed on 18 January 2024).
- Hefnaoui, Ahmed, and Zakaria Ben Darkawi. 2020. Moroccan SMEs and the difficulties in accessing external funding. The International Journal of the Researcher 1: 686–708. [Google Scholar]
- Hind, Tadjousti, and Zahi Jamal. 2023. Financing Constraints and Prospects for Innovative SMEs in Morocco. African Journal of Business and Economic Research 18: 299–312. [Google Scholar]
- Hossin, Mohammad, and Md Nasir Sulaiman. 2015. A Review on Evaluation Metrics for Data Classification Evaluations. International Journal of Data Mining & Knowledge Management Process 5: 1–11. [Google Scholar]
- Jalila, Bouanani El Idrissi, and Ladraa Salwa. 2020. Economic recovery during the state of health crisis COVID-19: Impact study on the activity of industrial companies in Morocco. French Journal of Economics and Management 1: 46–60. [Google Scholar]
- Kaoutar, Boushib. 2019. Financing of small and medium-sized enterprises in Morocco. International Journal of Social Sciences 2: 144–53. [Google Scholar]
- Kuzey, Cemil, Ali Uyar, and Dursun Delen. 2014. The impact of multinationality on firm value: A comparative analysis of machine learning techniques. Decision Support Systems 59: 127–42. [Google Scholar] [CrossRef]
- Laaouina, Soukaina, Sara El Aoufi, and Mimoun Benali. 2024. How Does Age Moderate the Determinants of Crowdfunding Adoption by SMEs’s: Evidences from Morocco? Journal of Risk and Financial Management 17: 18. [Google Scholar] [CrossRef]
- Lahmini, Hajar Mouatassim, and Abdelamajid Ibenrissoul. 2015. Impact of the financing decision on the performance of the Moroccan company: Case listed companies in the Real Estate and Construction materials. Paper presented at 4th International Conference and Doctoral Seminar on Research Methods, University of Jean Moulin Lyon 3, Lyon, France, June 10–11. [Google Scholar]
- Mahesh, Batta. 2018. Machine Learning Algorithms—A Review. International Journal of Science and Research 9: 381–86. [Google Scholar]
- Méndez, Manuel, Mercedes Merayo, and Manuel Núñez. 2023. Machine learning algorithms to forecast air quality: A survey. Artificial Intelligence Review 56: 10031–66. [Google Scholar] [CrossRef]
- Mohamed, Habachi, Abdelilah Jebbari, and Salim EL Haddad. 2021. Impact of digitalization on the financing performance of Moroccan companies. International Journal of Economic Studies and Management (IJESM) 1: 338–53. [Google Scholar] [CrossRef]
- Ouafy, Sakina EL Ouafy, and Ahmed Chakir. 2015. Financing Micro Businesses in Morocco: Case Studies. European Journal of Business and Social Sciences 4: 170–79. [Google Scholar]
- Oudgou, Mohamed, and Mohamed Zeamari. 2018. The Contribution of Capital Markets to the Financing of Moroccan SMEs. European Scientific Journal 14: 350–72. [Google Scholar]
- Voyant, Cyril, Gilles Notton, Soteris Kalogirou, Marie-Laure Nivet, Christophe Paoli, Fabrice Motte, and Alexis Fouilloy. 2017. Machine Learning Methods for Solar Radiation Forecasting: A Review. Renewable Energy 105: 569–82. [Google Scholar] [CrossRef]
- Xiong, Lei, and Ye Yao. 2021. Study on an Adaptive Thermal Comfort Model with K-Nearest-Neighbors (KNN) Algorithm. Building and Environment 202: 108026. [Google Scholar] [CrossRef]
- Zamazal, Ondřej. 2019. Machine Learning Support for EU Funding Project Categorization. The Computer Journal 62: 1684–94. [Google Scholar] [CrossRef]
- Zhang, Chuqing, Han Zhang, and Xiaoting Hu. 2019. A Contrastive Study of Machine Learning on Funding Evaluation Prediction. IEEE Access 7: 106307–15. [Google Scholar] [CrossRef]
- Zhang, Chuqing, Jiangyuan Yao, Guangwu Hu, and Xingcan Cao. 2023. A Machine Learning Based Funding Project Evaluation Decision Prediction. Computer Systems Science and Engineering 45: 2111–24. [Google Scholar] [CrossRef]
Figure 1.
The architecture of the decision tree model (Méndez et al. 2023).
Figure 1.
The architecture of the decision tree model (Méndez et al. 2023).
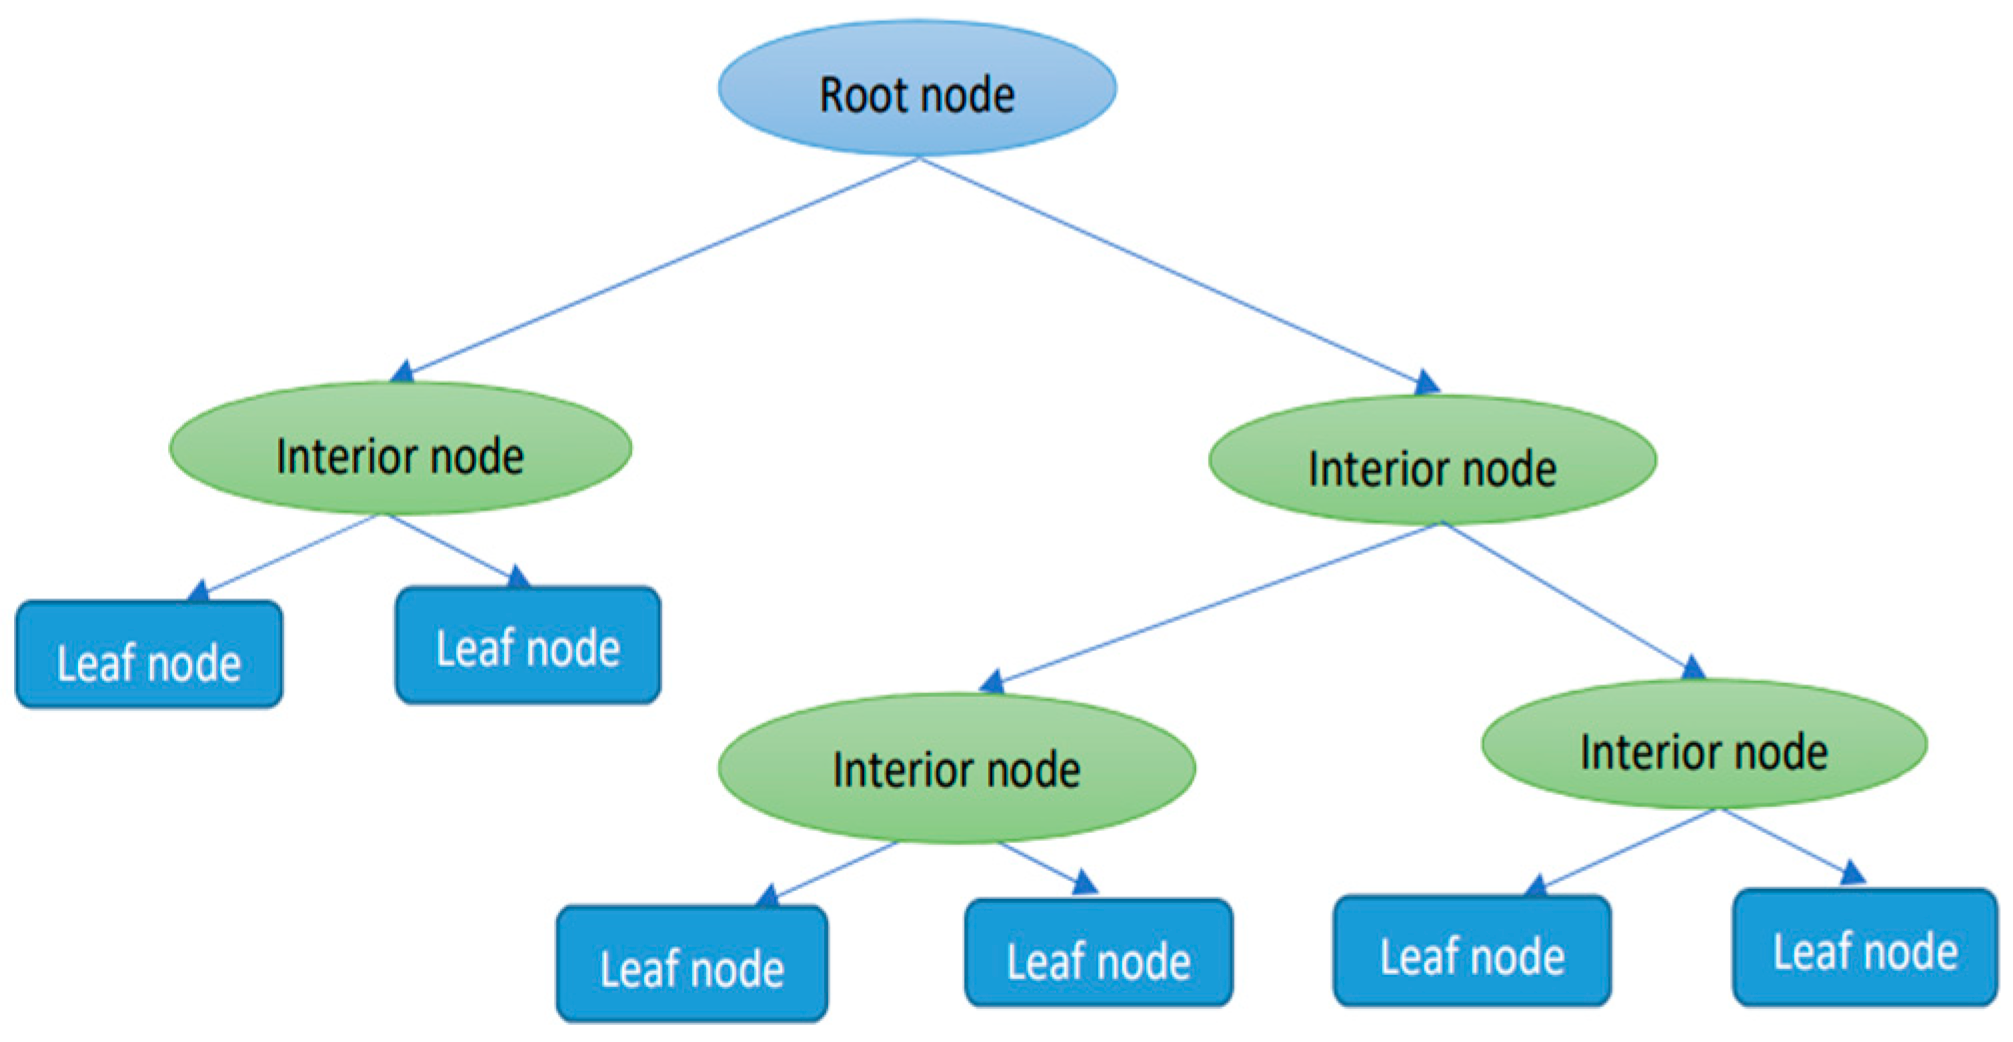
Figure 2.
Random forest model architecture (Méndez et al. 2023).
Figure 2.
Random forest model architecture (Méndez et al. 2023).
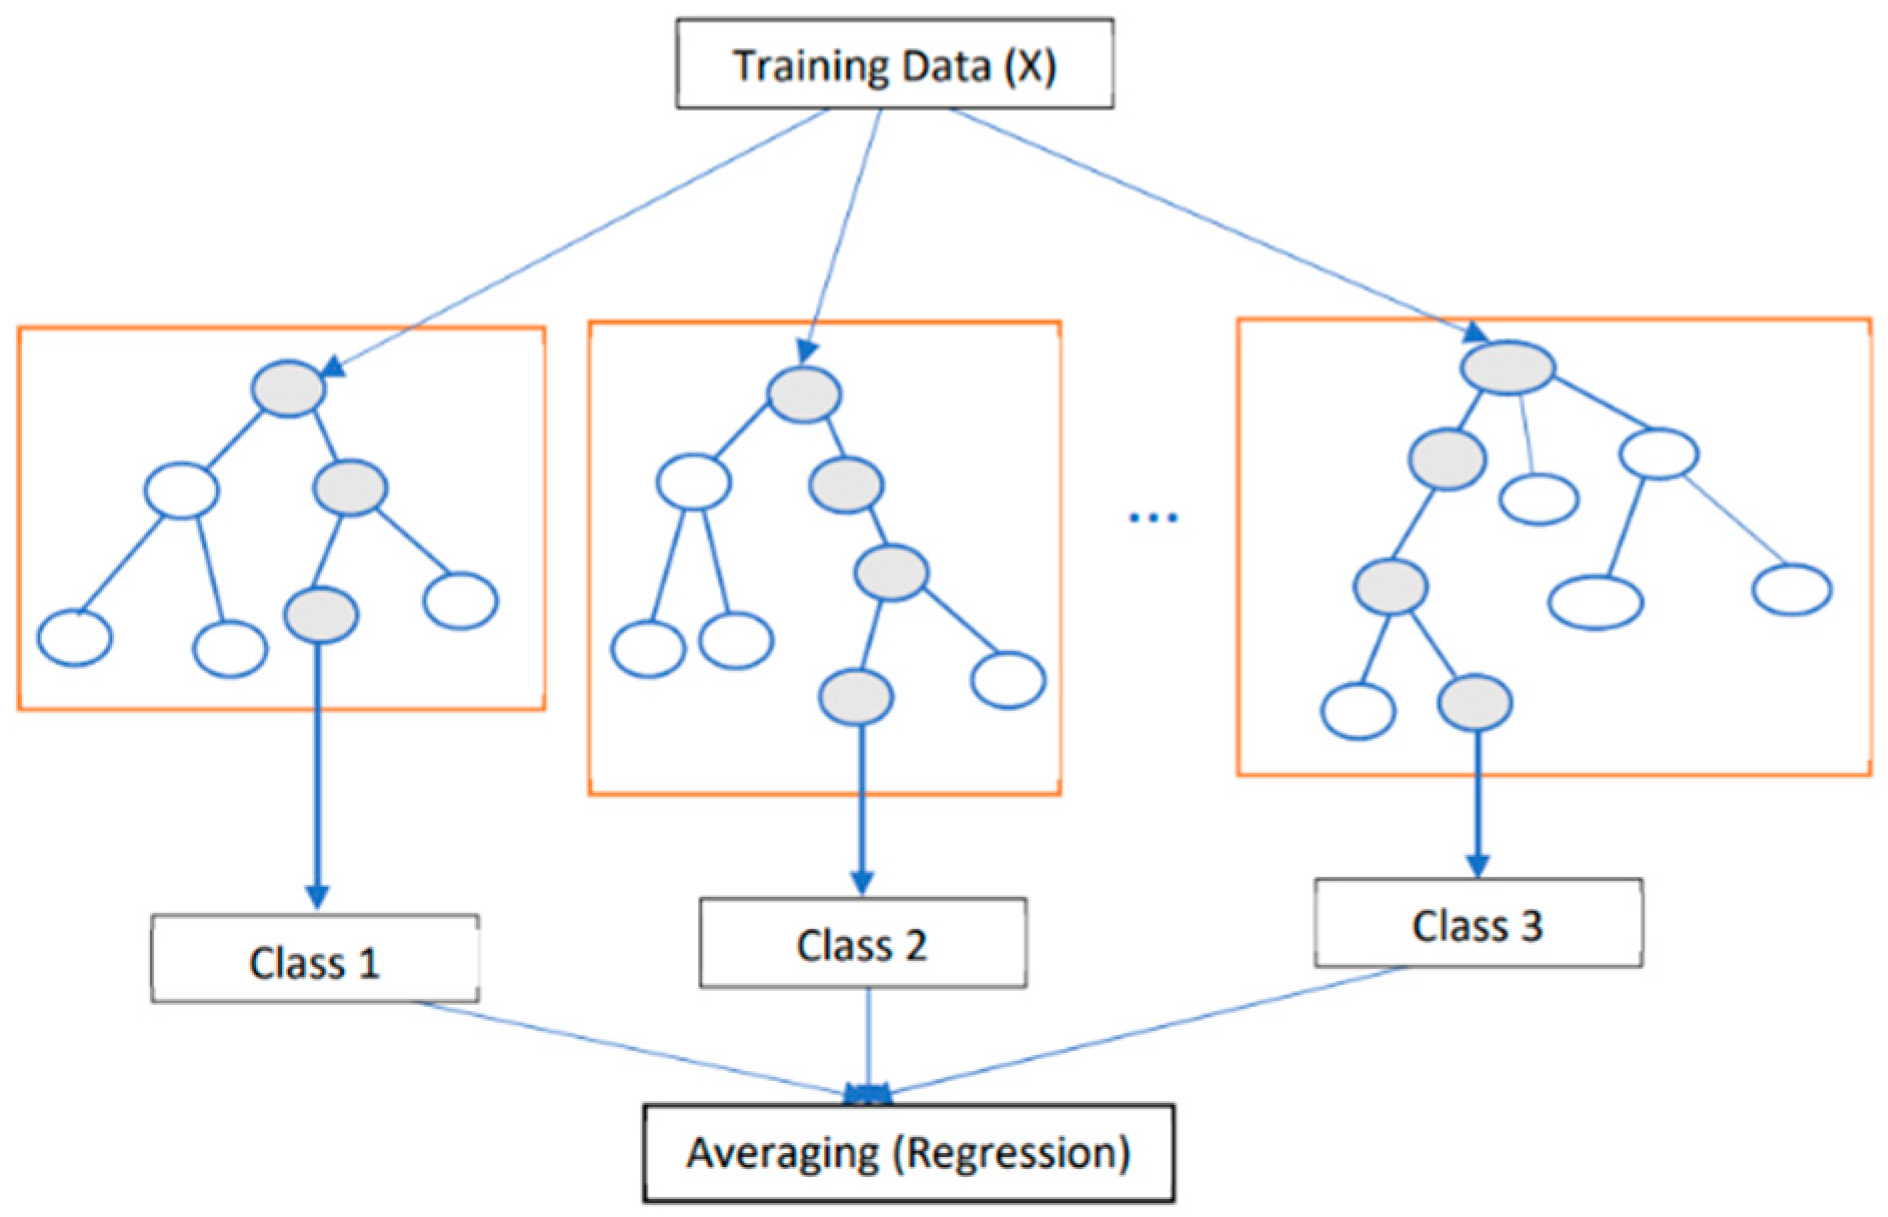
Figure 3.
KNN general structure (Méndez et al. 2023).
Figure 3.
KNN general structure (Méndez et al. 2023).
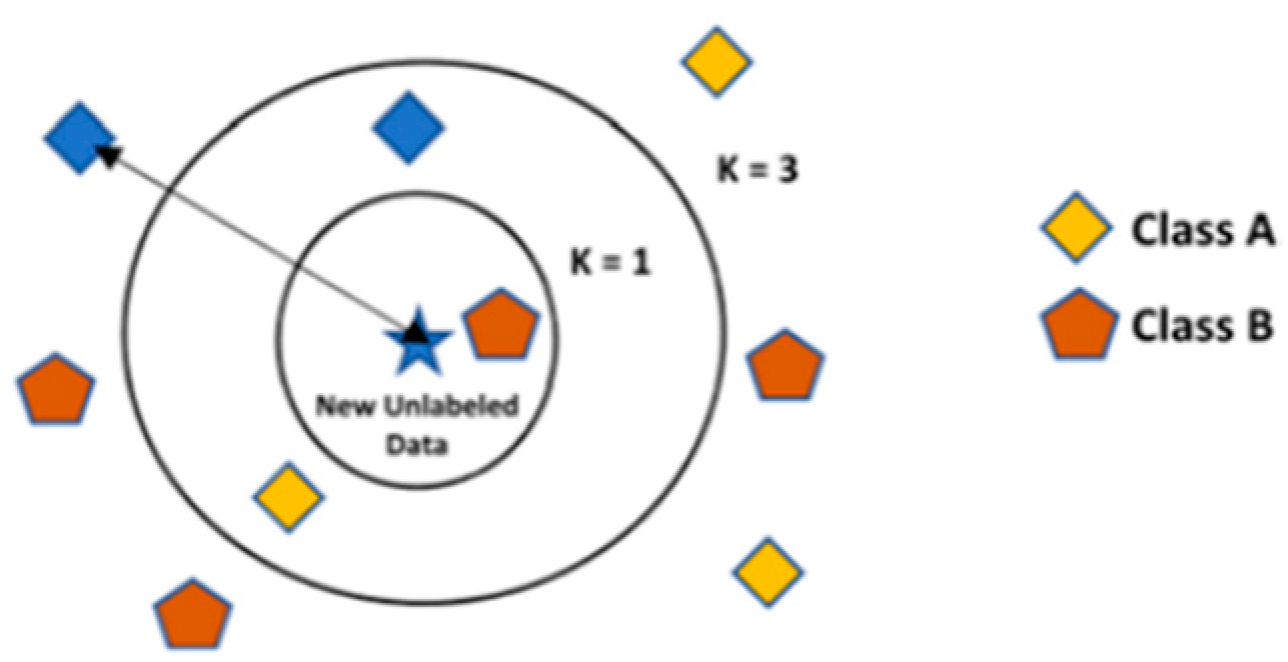
Figure 4.
Confusion matrix (Ciciana et al. 2023).
Figure 4.
Confusion matrix (Ciciana et al. 2023).

Figure 5.
Confusion matrix—random forest.

Figure 6.
Confusion matrix—KNN.
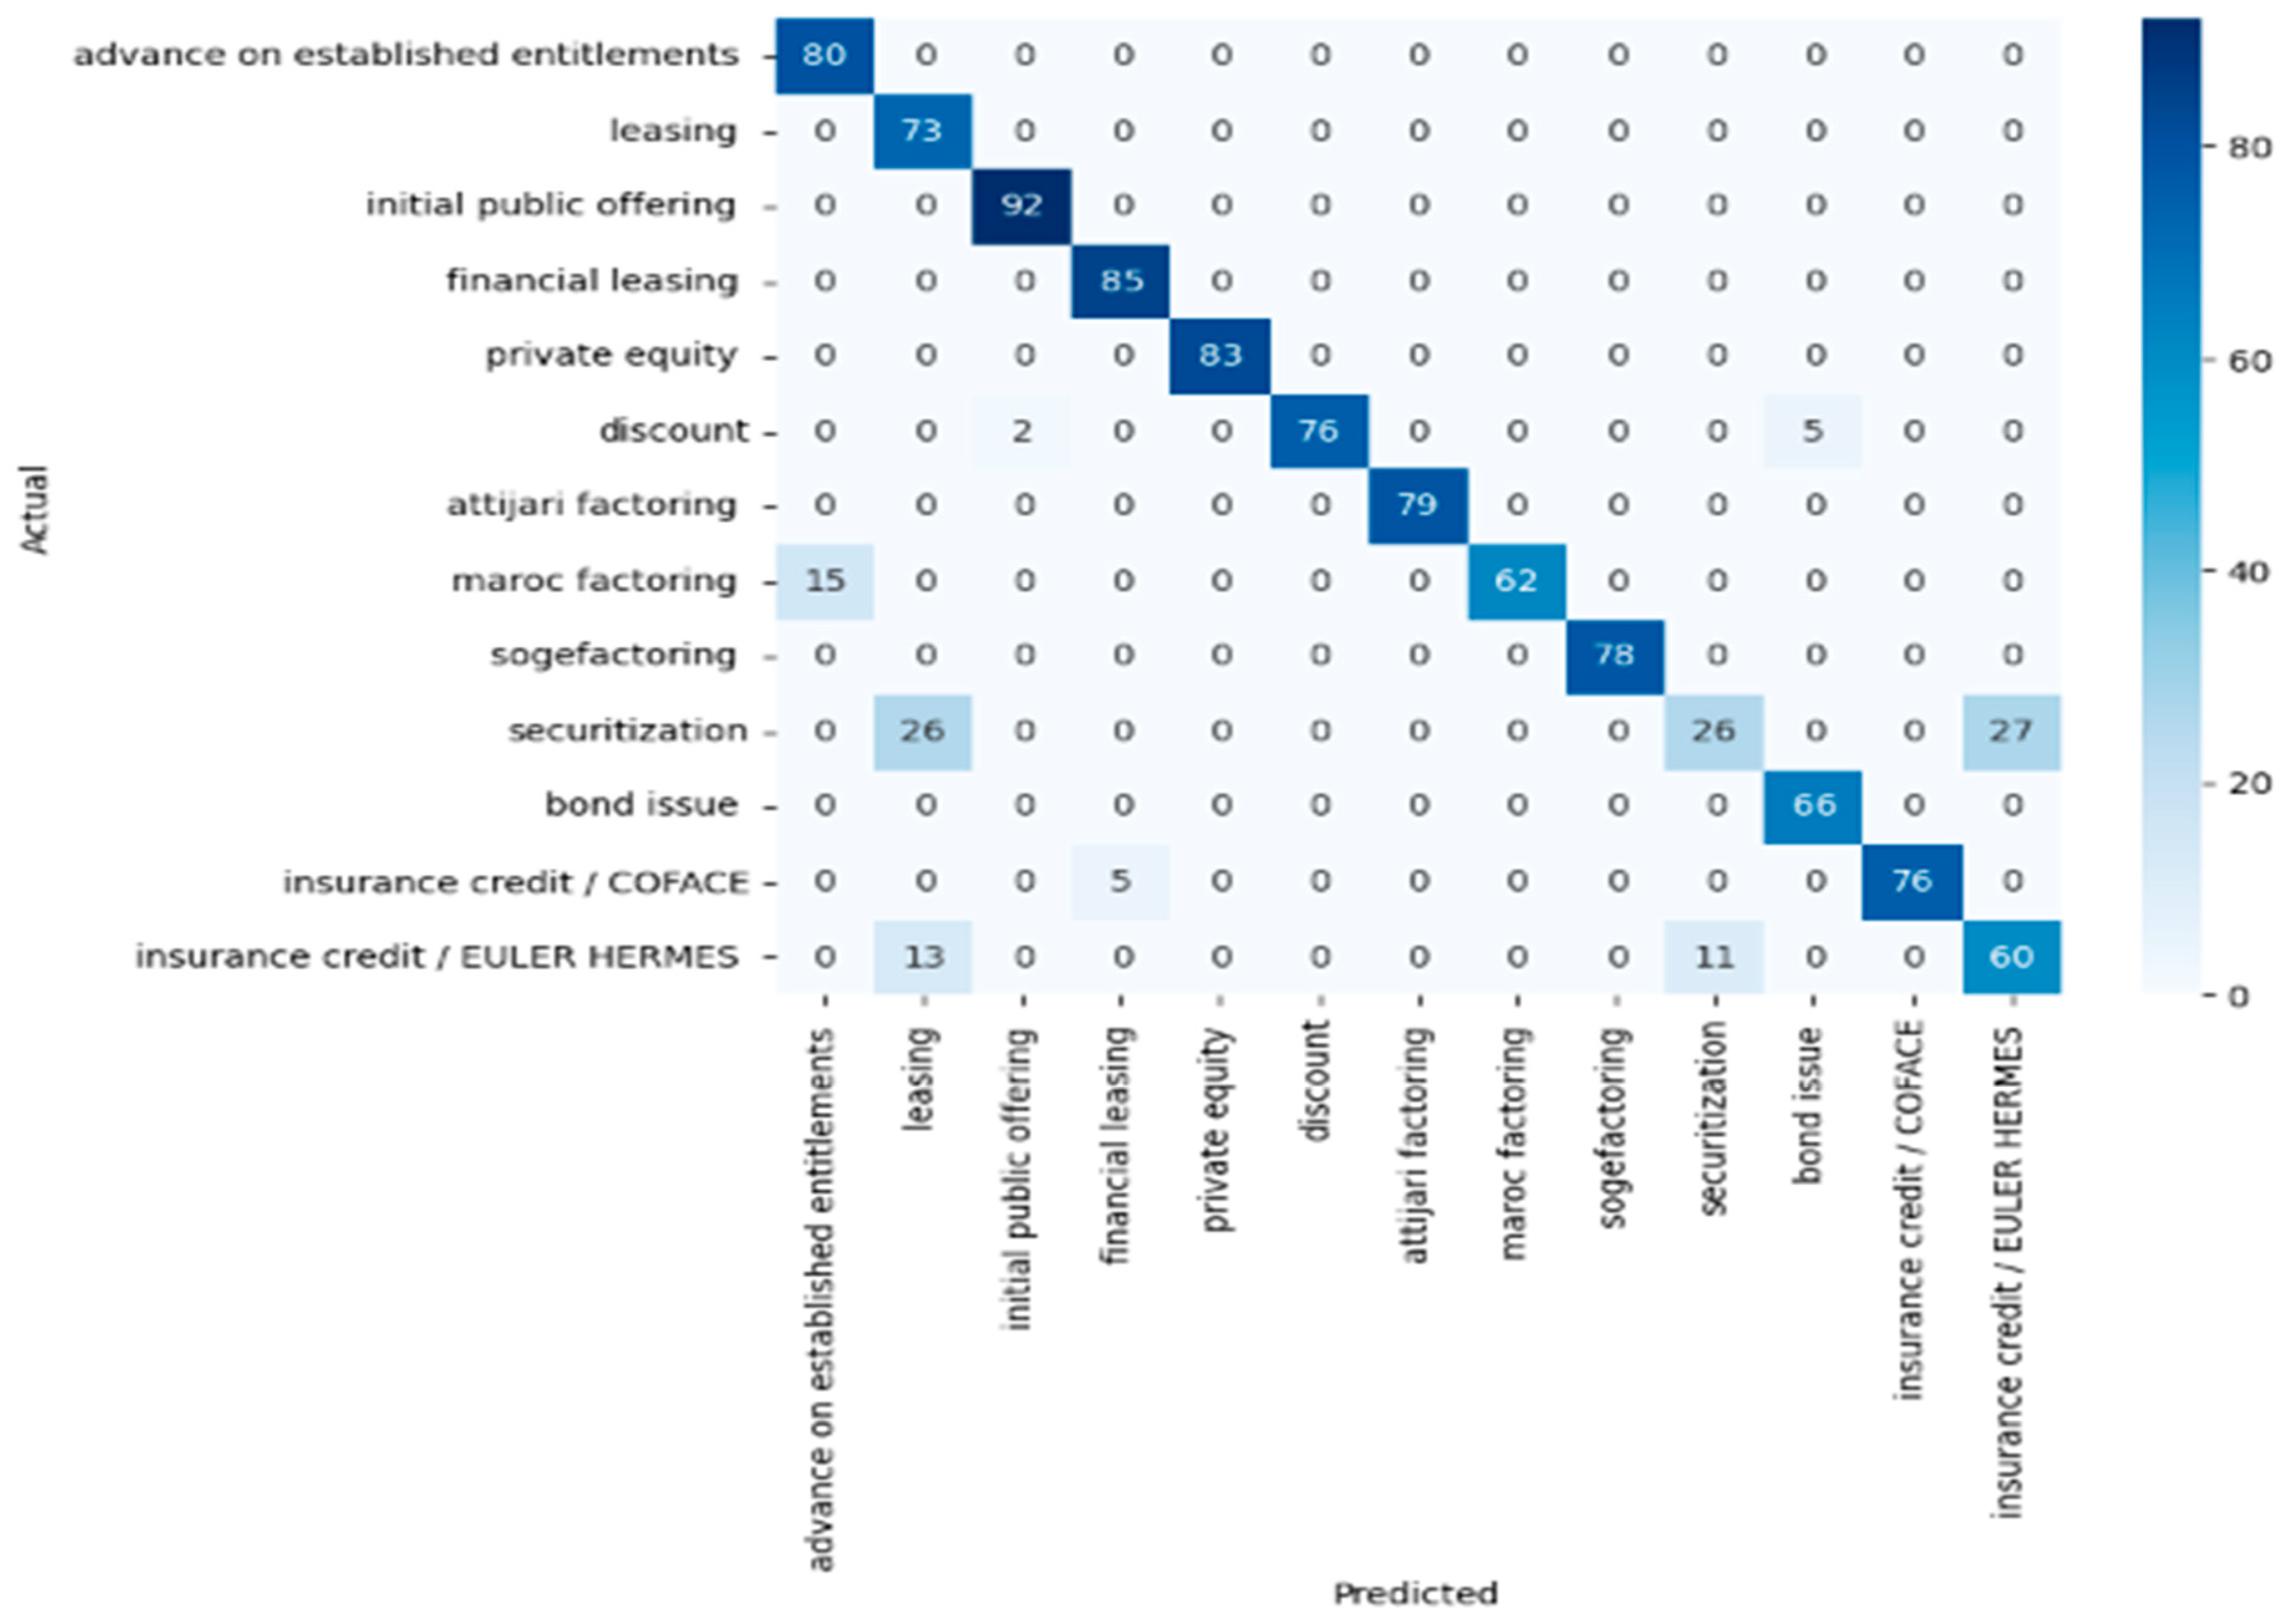
Figure 7.
Confusion matrix—decision tree.

Figure 8.
Confusion matrix—gradient boosting.
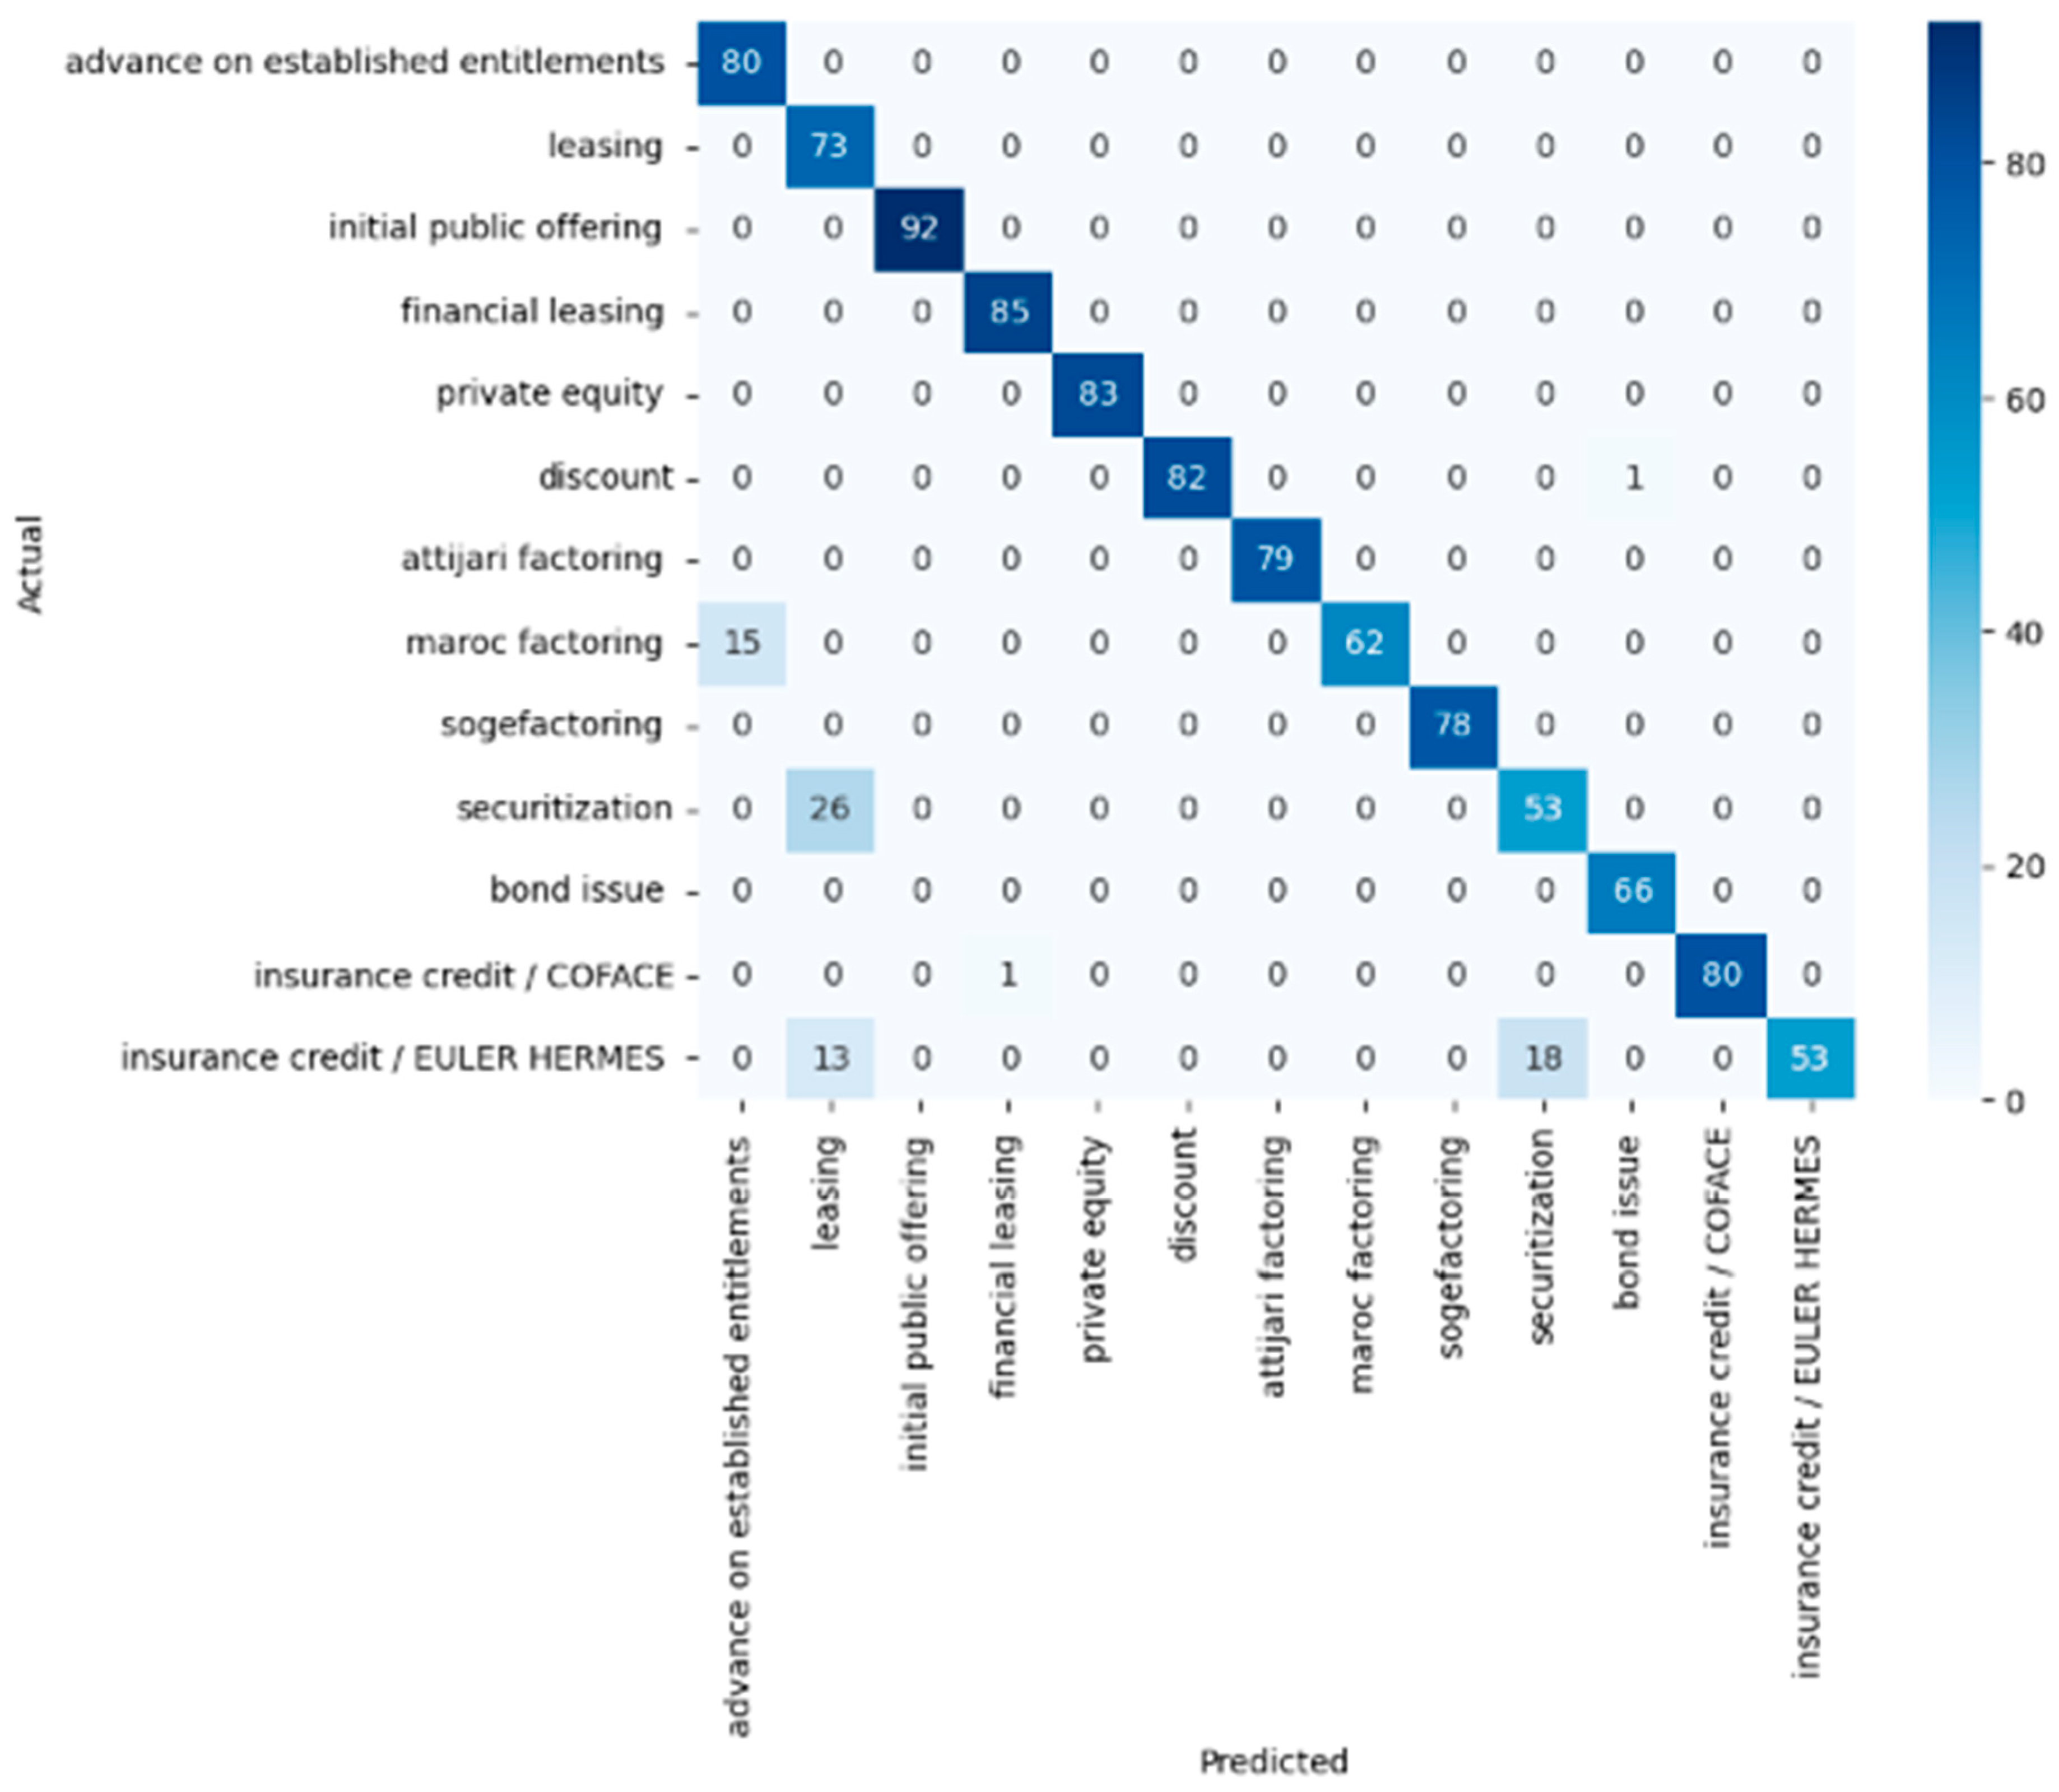
Figure 9.
Combined confusion matrix.

Figure 10.
Comparison of model accuracy for each data size.
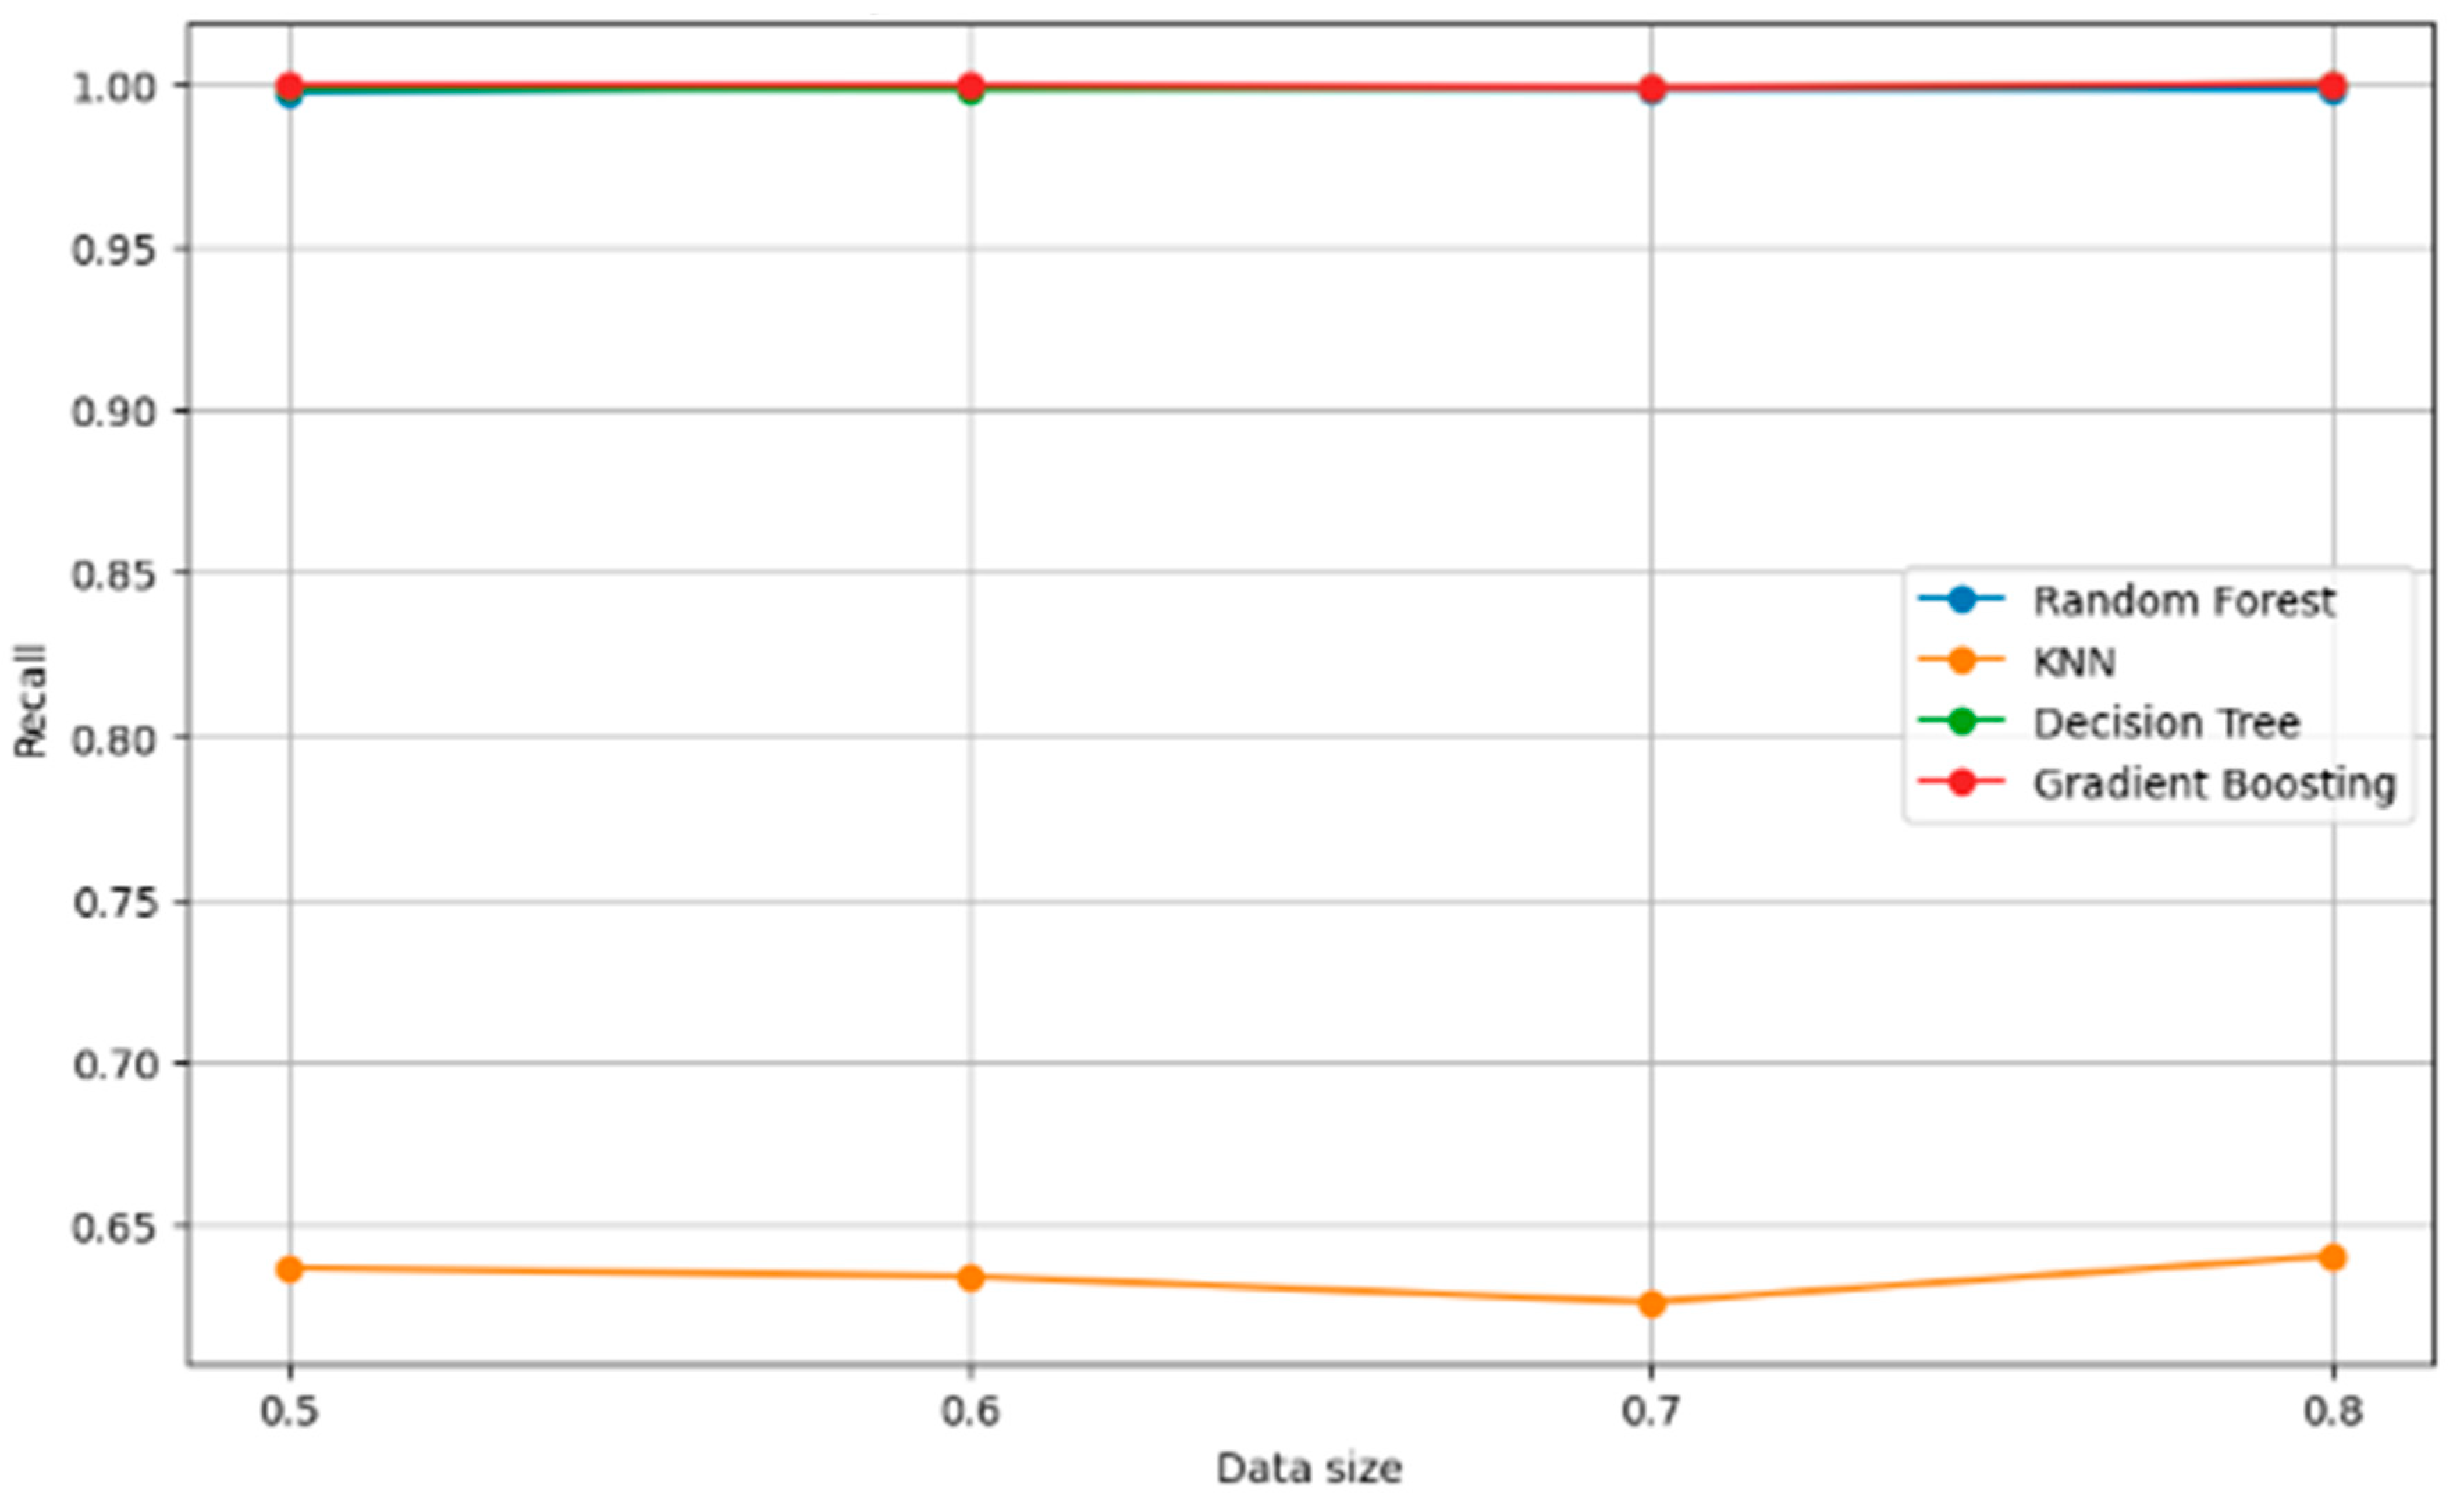
Figure 11.
Comparison of model recall for each data size.
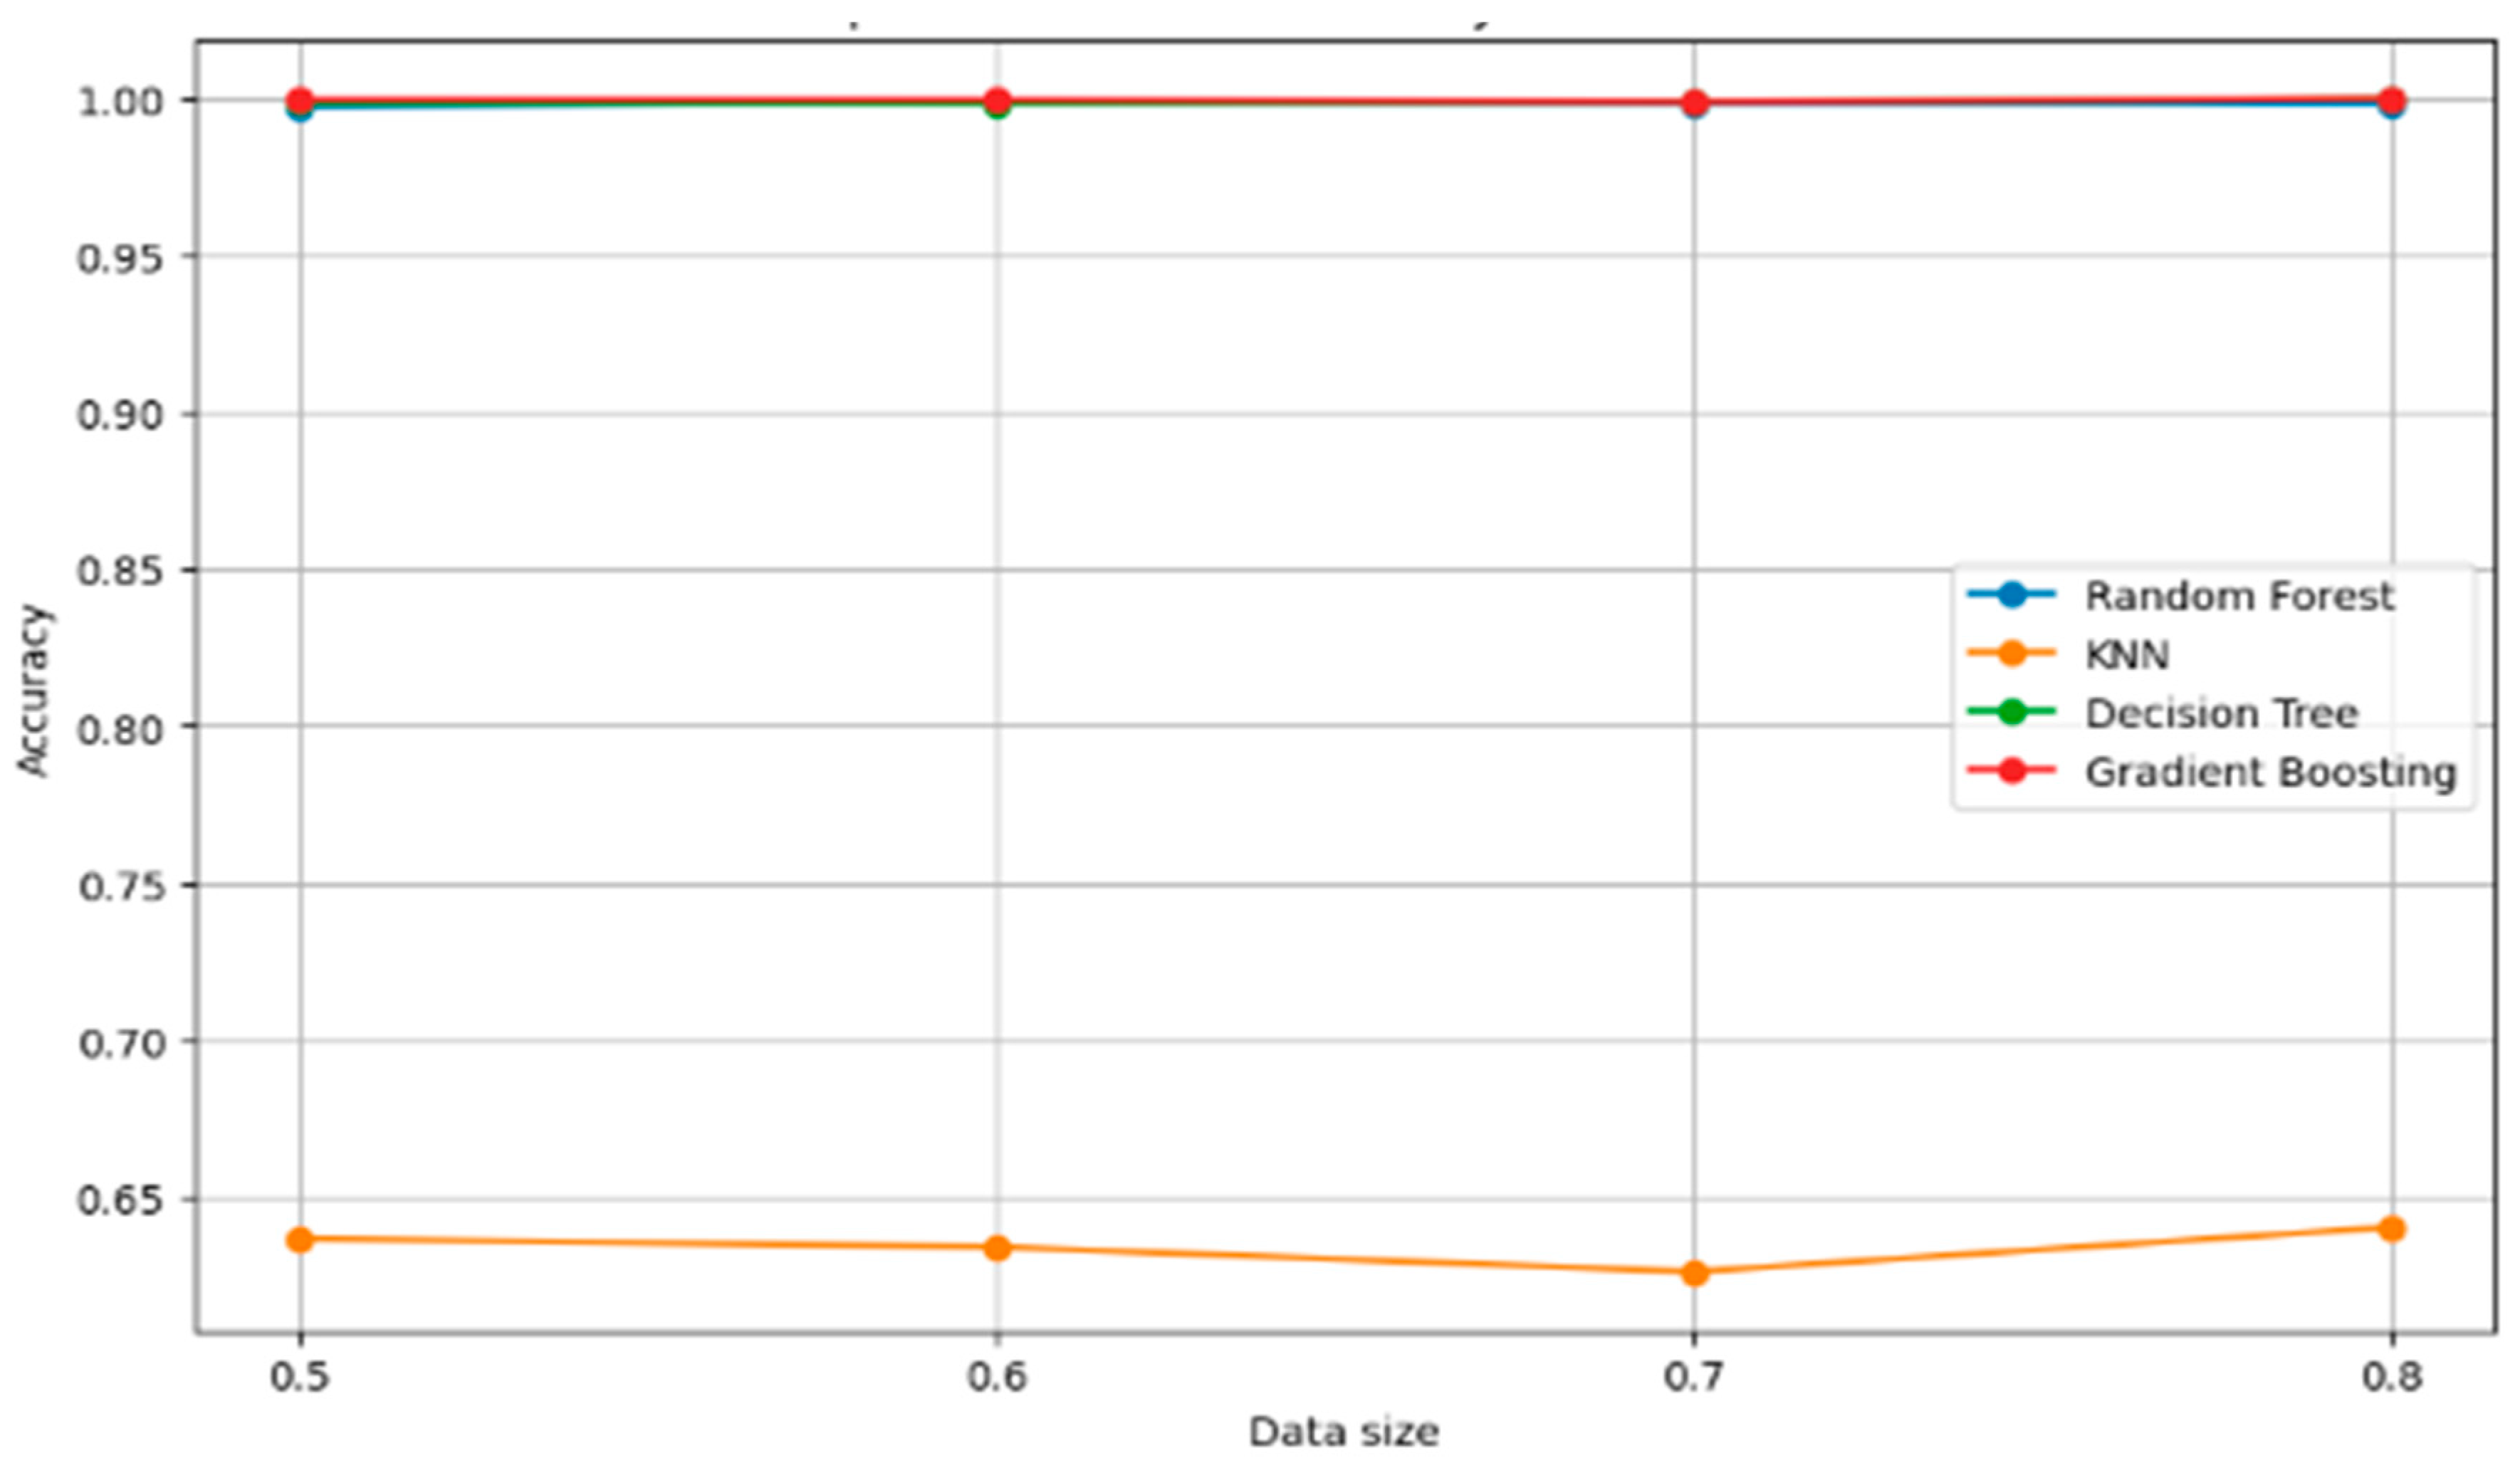
Figure 12.
Comparison of models’ F1 score for each data size.
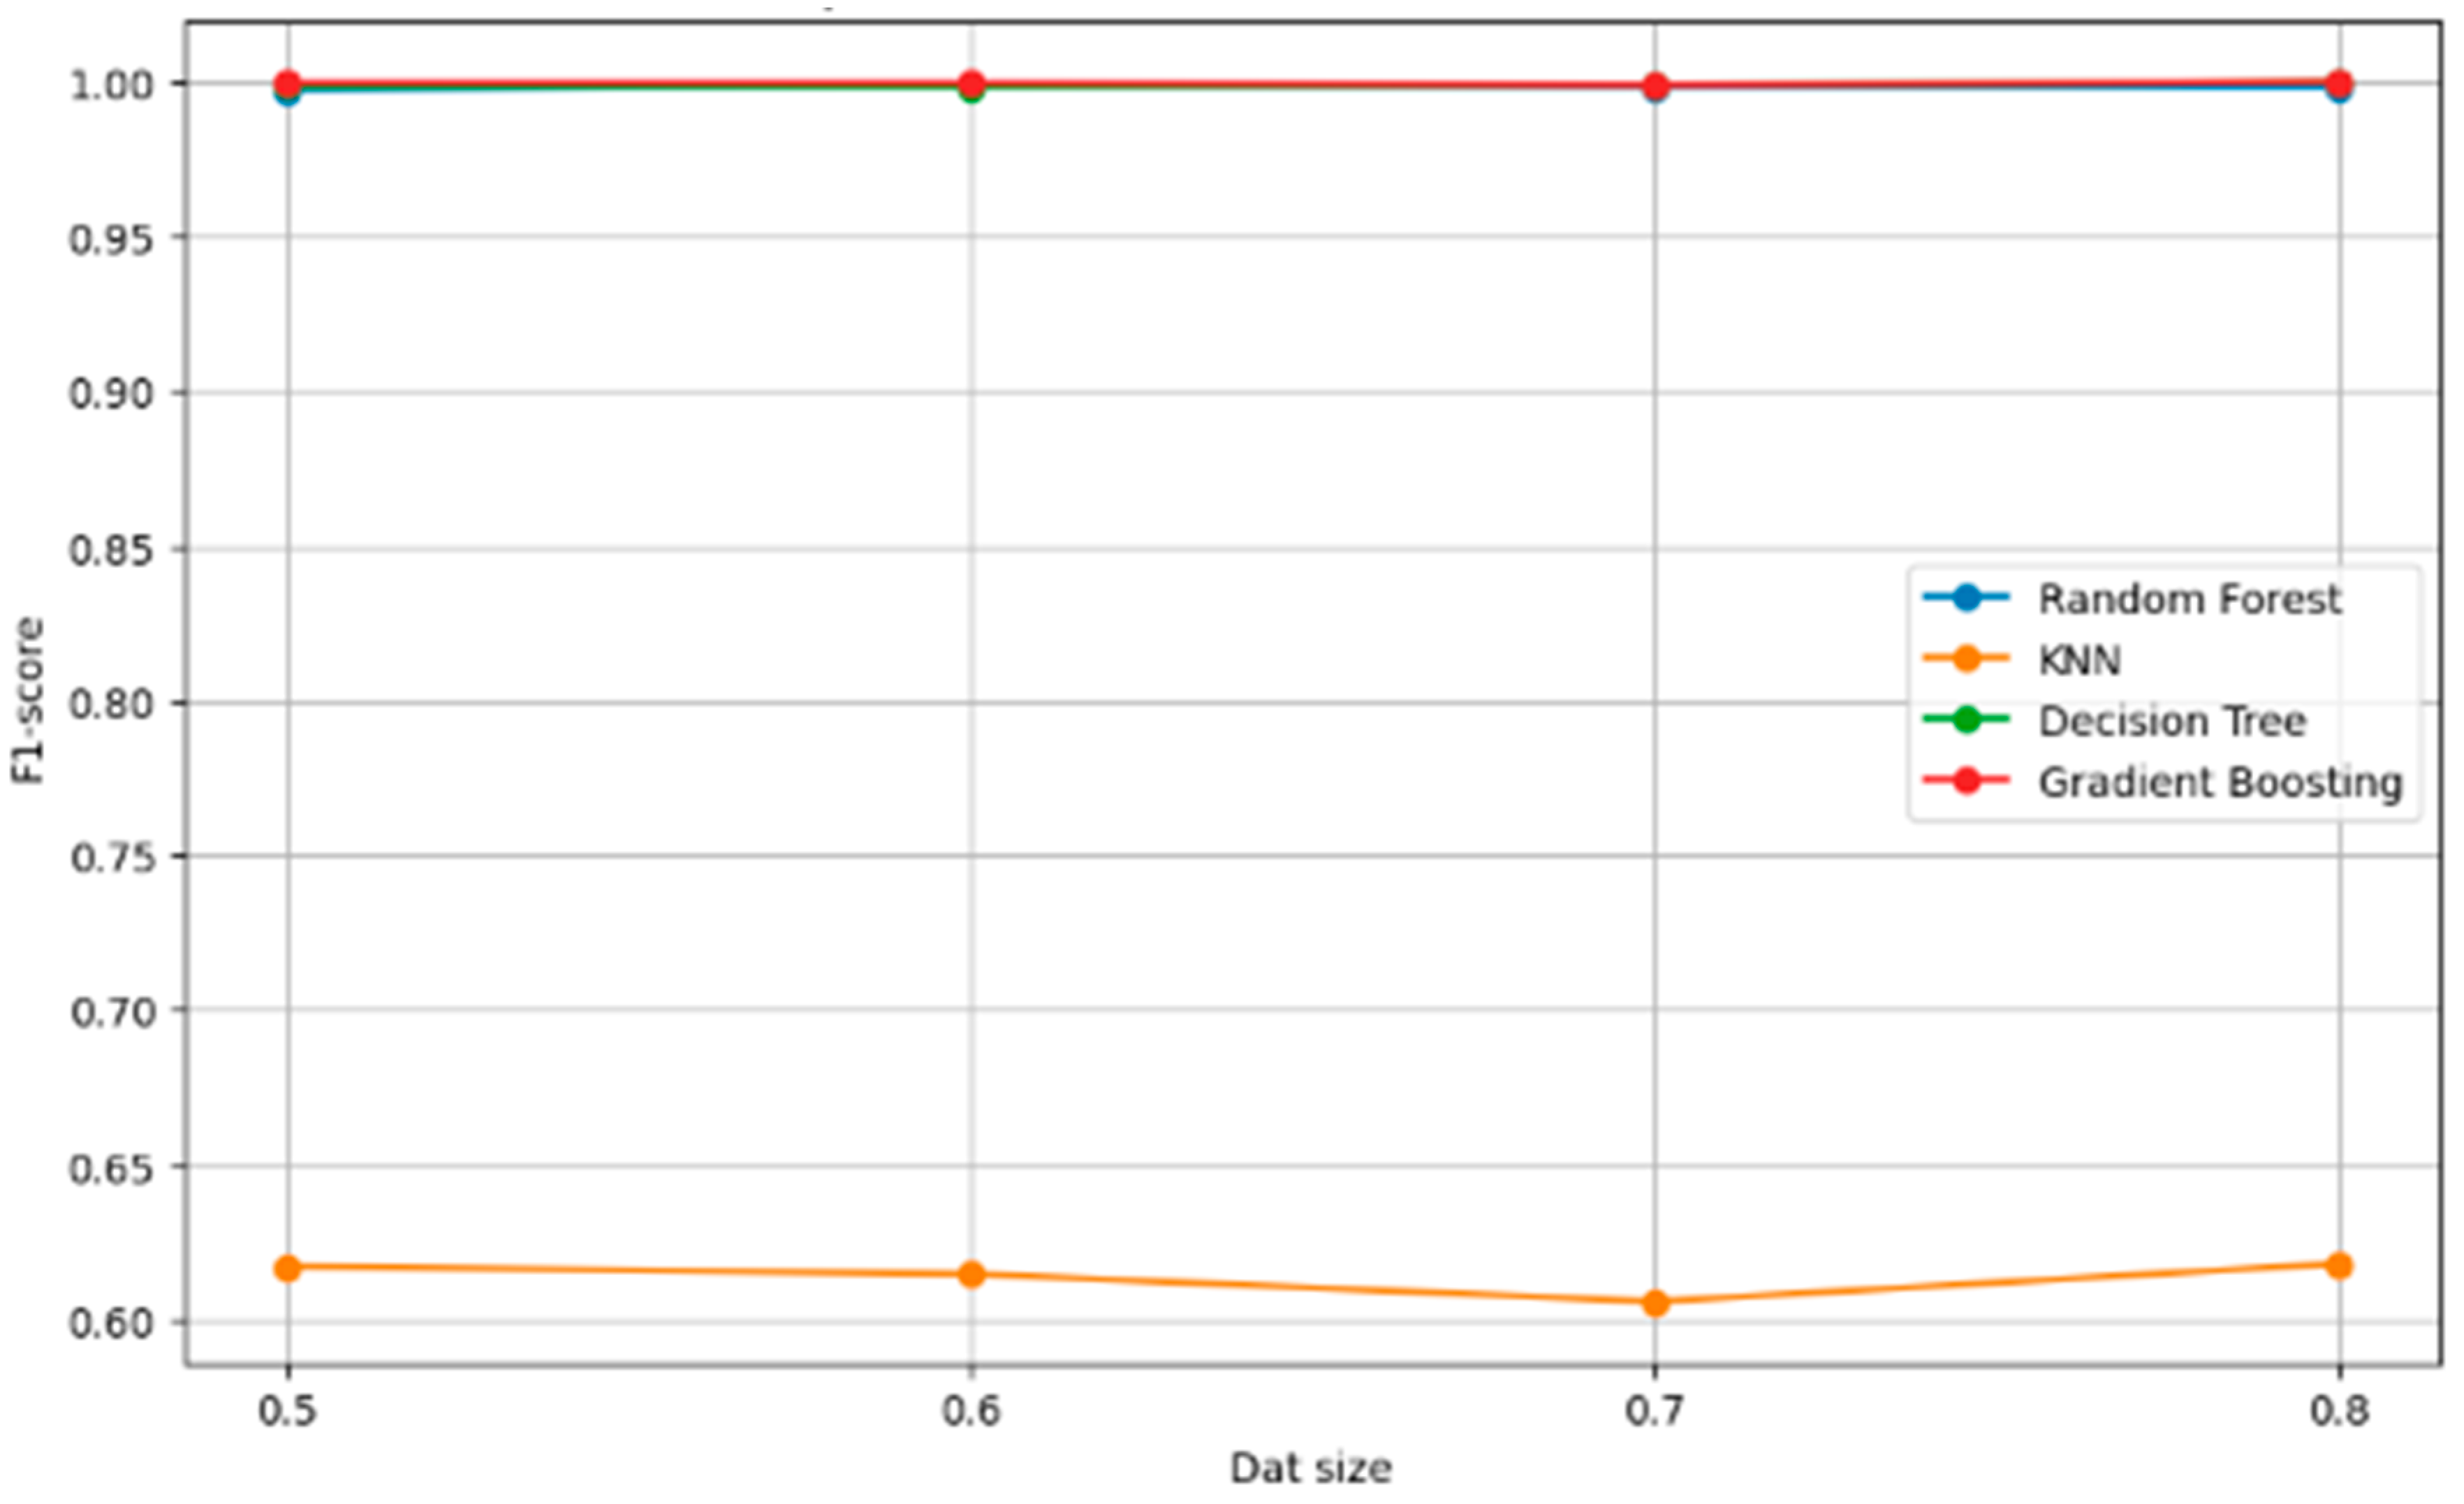
Figure 13.
Comparison of model precision for each data size.

Table 1.
Literature review related to funding in Morocco.
| Article | Year of Publication | Journal | Authors | Methodology | Sample |
|---|---|---|---|---|---|
| How Does Age Moderate the Determinants of Crowdfunding Adoption by SMEs’s: Evidences from Morocco? (Laaouina et al. 2024) | 2024 | Journal of risk and financial management | Soukaina Laaouina, Sara el Aoufi, Mimoun Benali | Qualitative study based on structural equation modelling | 241 respondents |
| Financing Constraints and Prospects for Innovative SMEs in Morocco (Hind and Jamal 2023) | 2023 | African Journal of Business and Economic Research | Tadjousti Hind and Zahi Jamal | A literature review and qualitative analysis | 12 case studies through interviews |
| The contribution of participative banks to financing Moroccan SMEs (Fnitiz 2023) | 2023 | Research and Applications in Islamic Finance | Yassine Fnitiz | Quantitative study | 392 Moroccan SMEs |
| Investment financing (Alami 2022) | 2022 | The International Journal of the Researcher | Najia Alami | Literature review | |
| Impact of digitalization on the financing performance of Moroccan companies (Mohamed et al. 2021) | 2021 | International Journal of Economic Studies and Management | Mohamed Habachi, Abdelilah Jebbari, Salim El Haddad | Structural equation models estimated using the PLS approach | 74 companies |
| Moroccan SMEs and the difficulties in accessing external funding (Hefnaoui and Darkawi 2020) | 2020 | The International Journal of the Researcher | Ahmed Hefnaoui, Zakaria Ben Darkawi | Literature review | |
| Corporate Finance in Morocco: Econometrical Verification Tests based on data on Moroccan small and medium-sized enterprises (Boushib 2020) | 2020 | Journal of Control, Accounting and Auditing | Kaoutar Boushib | Multivariate analysis: logistic regression | 50 SMEs |
| Economic recovery during the state of health crisis COVID-19: Impact study on the activity of industrial companies in Morocco (Jalila and Salwa 2020) | 2020 | French Journal of Economics and Management | Jalila Bouanani El Idrissi, Salwa Ladraa | An exploratory study | 5 industrial companies |
| Financing of small and medium-sized enterprises in Morocco (Kaoutar 2019) | 2019 | International Journal of Social Sciences | Kaoutar Boushib | An empirical survey | 418 SMEs |
| The Contribution of Capital Markets to the Financing of Moroccan SMEs (Oudgou and Zeamari 2018) | 2018 | European Scientific Journal | Mohamed Oudgou, Mohamed Zeamari | Literature review | |
| Firm’s Capital Structure Determinants and Financing Choice by Industry in Morocco (Amraoui et al. 2018) | 2018 | International Journal of Management Science and Business Administration | Mouna Amraoui, Ye Jianmu, Kenza Bouarara | Panel regression approach | 52 Moroccan companies |
| Financing micro businesses in Morocco: case studies (Ouafy and Chakir 2015) | 2015 | European Journal of Business and Social Sciences | Sakina EL Ouafy, Ahmed Chakir | Multiple case studies | A total of 8 very micro businesses |
| Impact of the financing decision on the performance of the Moroccan company: Case listed companies in the Real Estate and Construction materials (Lahmini and Ibenrissoul 2015) | 2015 | Conference paper, 4th International Conference and Doctoral Seminar on Research Methods, University of Jean Moulin Lyon 3, France | Hajar Mouatassim Lahmini, Abdelamajid Ibenrissoul | Multiple linear regression | 8 companies |
Table 2.
Description of the dataset.
| Columns/Variable Name | Type | Predictor/Response |
|---|---|---|
| Activity Nature Strategic business area Country Client Amount Funding method adopted | Categorical Categorical Categorical Categorical Categorical Numeric Categorical | Predictor Predictor Predictor Predictor Predictor Predictor Response |
Table 3.
Comparison of prediction results of classifiers.
| Algorithms | Accuracy | Precision | Recall | F1 Score |
|---|---|---|---|---|
| Random forest | 0.93 | 0.94 | 0.93 | 0.93 |
| KNN | 0.64 | 0.61 | 0.64 | 0.61 |
| Decision tree | 0.93 | 0.94 | 0.93 | 0.94 |
| Gradient boosting | 0.93 | 0.94 | 0.93 | 0.93 |
Table 4.
Comparison of the performance metrics of 4 machine learning models.
| Train Size | Model | Precision | Recall | F1 Score | Accuracy |
|---|---|---|---|---|---|
| 0.5 | Random forest | 0.997718 | 0.997691 | 0.99769 | 0.997691 |
| 0.5 | KNN | 0.611504 | 0.636783 | 0.617148 | 0.636783 |
| 0.5 | Decision tree | 0.99848 | 0.998461 | 0.998461 | 0.998461 |
| 0.5 | Gradient boosting | 0.999617 | 0.999615 | 0.999615 | 0.999615 |
| 0.6 | Random forest | 0.998573 | 0.998558 | 0.998555 | 0.998558 |
| 0.6 | KNN | 0.608065 | 0.634135 | 0.614706 | 0.634135 |
| 0.6 | Decision tree | 0.998107 | 0.998077 | 0.998077 | 0.998077 |
| 0.6 | Gradient boosting | 0.999522 | 0.999519 | 0.999519 | 0.999519 |
| 0.7 | Random forest | 0.998104 | 0.998077 | 0.998071 | 0.998077 |
| 0.7 | KNN | 0.603909 | 0.626282 | 0.605805 | 0.626282 |
| 0.7 | Decision tree | 0.998729 | 0.998718 | 0.998718 | 0.998718 |
| 0.7 | Gradient boosting | 0.998729 | 0.998718 | 0.998718 | 0.998718 |
| 0.8 | Random forest | 0.998101 | 0.998077 | 0.998071 | 0.998077 |
| 0.8 | KNN | 0.614476 | 0.640385 | 0.617979 | 0.640385 |
| 0.8 | Decision tree | 1.0 | 1.0 | 1.0 | 1.0 |
| 0.8 | Gradient boosting | 1.0 | 1.0 | 1.0 | 1.0 |
Disclaimer/Publisher’s Note: The statements, opinions and data contained in all publications are solely those of the individual author(s) and contributor(s) and not of MDPI and/or the editor(s). MDPI and/or the editor(s) disclaim responsibility for any injury to people or property resulting from any ideas, methods, instructions or products referred to in the content. |
© 2024 by the authors. Licensee MDPI, Basel, Switzerland. This article is an open access article distributed under the terms and conditions of the Creative Commons Attribution (CC BY) license (https://creativecommons.org/licenses/by/4.0/).
Share and Cite
MDPI and ACS Style
Laaouina, S.; Benali, M. Modeling Funding for Industrial Projects Using Machine Learning: Evidence from Morocco. J. Risk Financial Manag. 2024, 17, 173. https://doi.org/10.3390/jrfm17040173
AMA Style
Laaouina S, Benali M. Modeling Funding for Industrial Projects Using Machine Learning: Evidence from Morocco. Journal of Risk and Financial Management. 2024; 17(4):173. https://doi.org/10.3390/jrfm17040173
Chicago/Turabian StyleLaaouina, Soukaina, and Mimoun Benali. 2024. "Modeling Funding for Industrial Projects Using Machine Learning: Evidence from Morocco" Journal of Risk and Financial Management 17, no. 4: 173. https://doi.org/10.3390/jrfm17040173