1. Introduction
Since the entry into force of the Kyoto Protocol in early 2005, carbon trading has been expanding continuously and thus the interest in studying this new nascent commodity market [
1]. Several previous experiences with emission allowance trading had taken place around the world before the start of the European Union Emission Trading Scheme (EU ETS: for reader convenience, abbreviations are also listed with brief explanations in a glossary at the end of this text). However, the EU ETS is, at the present, the largest emission trading scheme, not only in terms of installations (around 11,000) but also in terms of real emissions considered (2,298.5 million tonnes of CO
2 per year for the 2005-2007 period), consequently, it is important to understand how it is organized. Furthermore, it is also interesting to consider how it is linked with the rest of the international carbon market and with the other flexibility mechanisms of the Kyoto Protocol (the Joint Implementation and the Clean Development Mechanism) that lead to other types of tradable assets (Emission Reduction Units and Certificate Emission Reductions, respectively). The objective of this paper is to deconstruct all the particularities of carbon trading and, specifically, to analyse the details of carbon trading in Europe, which could be considered the laboratory for other carbon markets.
The remainder of the paper is organized as follows. In
Section 2, we present the origins of carbon trading. First of all, we introduce the Kyoto Protocol and emission trading as one of the three flexibility mechanisms established to facilitate the accomplishment of the emission reduction objectives, and thus we explain, for those countries that have ratified the Kyoto Protocol, what the possibilities are for reaching their reduction targets. We also show the state of compliance of Annex B countries and particularly the compliance of the European countries. Finally, we present the allowance trading experiences prior to the launch of the EU ETS. In
Section 3, the EU ETS is described in depth.
Section 4 gives a detailed idea of carbon trading. After we present carbon trading in Europe, we explain OTC, spot, futures and options trading. In
Section 5, the linking of the European carbon markets with the rest of the international carbon market and the trading of Kyoto credits is taken into account. Finally,
Section 6 concludes and provides some final remarks.
2. Carbon trading origins
2.1. The Kyoto Protocol
The Kyoto Protocol is the international response to climate change. It was approved in the 3
rd Conference of the Parties of the United Nations Framework Convention on Climate Change (UNFCCC) in December 1997, but it did not come into force until February 2005. The reason for such a delay was that the Kyoto Protocol had to be ratified by at least 55 Parties to the Convention, including the developed countries representing 55% of their total emissions in 1990. This condition was accomplished when Russia decided to ratify the Protocol and consequently, the Kyoto Protocol finally came into force with the agreement of 141 countries. In addition to those countries, others have studied, approved or will study the Protocol. It should be noted that the largest greenhouse gas emitter, the USA, which represents 25% of total emissions and 40% of developed countries’ emissions, has not yet ratified the Kyoto Protocol [
2].
By ratifying the Kyoto Protocol, Annex I countries (those countries in Annex I of the UNFCCC and thus, that have signed the convention) make the commitment to reduce their global greenhouse gases emissions by at least 5% of the emissions in 1990 in the commitment period from 2008 to 2012 (Art. 3 of the Kyoto Protocol). The greenhouse gases, listed in the Annex A of the Protocol, are carbon dioxide (CO
2), methane (CH
4), nitrous oxide (N
2O), hydrofluorocarbons (HFCs), perfluorocarbons (PFCs) and sulphur hexafluoride (SF
6). Nevertheless, a measure unit, CO
2-equivalent tonnes (CO
2-e), has been constructed in order to indicate the global warming potential of the different greenhouse gases. CO
2 is then, the reference gas against which other greenhouse gases’ warming potential is measured. Additionally, the Kyoto Protocol emission reduction of 5% is distributed among the Kyoto Protocol Annex B countries and thus it contains legally binding emissions targets for them. The percentage of reduction targets for those countries for 2008-2012 is shown in
Table 1. Note that the European Union-15 is considered as a whole in the Kyoto Protocol. European countries have distributed their reduction targets in a burden sharing agreement. The greenhouse gas emission reduction targets for the European Countries are also shown in
Table 1.
Table 1.
Annex B Countries Emission Targets.
Table 1.
Annex B Countries Emission Targets.
| Country | Target |
|---|
| Iceland | 10% |
| US | -7% |
| Canada, Hungary, Japan, Poland | -6% |
| Croatia | -5% |
| New Zealand, Russian Federation, Ukraine | 0% |
| Norway | 1% |
| Australia | 8% |
| Bulgaria, Czech Republic, Estonia, Latvia, Liechtenstein, Lithuania, Monaco, Romania, Slovakia, Slovenia, Switzerland, | -8% |
| Total European Union | -8% |
| Germany | -21% |
| Austria | -13% |
| Belgium | -8% |
| Denmark | -21% |
| Spain | 15% |
| France, Finland | 0% |
| Greece | 25% |
| The Netherlands | -6% |
| Ireland | 13% |
| Italy | -6.5% |
| Luxembourg | -28% |
| Portugal | 27% |
| United Kingdom | -12.5% |
| Sweden | 4% |
Note that although the Kyoto Protocol considers only a single commitment phase, in the 11
th Conference of the Parties of the Convention, which took place in Montreal in December 2005, a new working group “
was established to discuss future commitments for developed countries for the period after 2012” [
3]. Additionally, in the United Nations Climate Change Conference in Bali that took place from the 3
rd to the 14
th December 2007, a roadmap was established in order to deal with climate change. Among other things, this meeting launched a new negotiation process with the purpose of establishing a post-Kyoto agreement to reduce greenhouse gas emissions around the world. This negotiation process will last until 2009 [
4].
2.1.a. Kyoto Protocol Flexibility Mechanisms: the JI, CDM and Emissions Trading
With the intention of facilitating the accomplishment of the emission reduction objectives, the Kyoto Protocol establishes three flexibility mechanisms that allow for the diminishment of the overall cost of achieving emission targets. These three mechanisms are the Joint Implementation mechanism (under art. 6), the Clean Development mechanism (under art. 12), and Emissions Trading (under art. 17). The first two mechanisms consist of the execution of emission reduction projects that lead to different types of units. Those units make the holder eligible for compliance with the reduction obligations. Each unit allows for the emission of one metric tonne in CO2-e terms.
Specifically, the Join Implementation mechanism (JI) consists of the realization, by an Annex I country, of emissions reduction projects in another Annex I country. In return JI projects lead to Emission Reduction Units (ERUs) that can be used by the Annex I country promoting the project to meet its emissions targets under the Kyoto Protocol.
The purpose of the Clean Development Mechanism (CDM), as explained in the Kyoto Protocol,
shall be to assist Parties not included in Annex I in achieving sustainable development and in contributing to the ultimate objective of the Convention, and to assist Parties included in Annex I in achieving compliance. The idea is the same as JI but instead of implementing the project in an Annex I country it is implemented in a developing country. In this case, units called Certified Emission Reductions (CERs) are generated and will be used by the Annex I country to achieve compliance. In the CDM projects the achievement of sustainable development for non Annex I countries is as important as the reduction units generated by the projects. The CDM projects have to be approved by the Executive Committee of the CDM Board for projects (which is the institution that issues the CERs). It is important to note that although the Kyoto Protocol does not impose emission reduction commitments on developing countries, those countries play a crucial role in global emission reductions by means of the Clean Development Mechanism of the Kyoto Protocol. As Lecocq and Ambrosi pointed out [
5], the development of this mechanism in terms of countries involved and volumes of emission reductions is very important and it is in constant expansion. As a result, the purpose of this mechanism is largely attained for both types of countries. However, those projects that allows for significant gains in terms of emission reductions are not always those that allow for higher growth in the regions where the project is undertaken.
The third flexibility mechanism, the Emission Trading mechanism, offers the possibility to trade all different units among countries. The main advantage of this mechanism is to reduce the cost of emission reductions by allowing those installations with lower abatement costs to sell the allowances to the rest of the installations. In addition to ERUs and CERs, other types of units can be used in order to achieve compliance with the Kyoto Protocol. Among those units we find on the one hand, Assigned Amount Units (AAUs) that are received by the governments of each country depending on its fixed target, and on the other hand, there also exist Removal Units (RMUs).
Figure 1.
Kyoto Protocol Flexibility Mechanisms.
Figure 1.
Kyoto Protocol Flexibility Mechanisms.
This Figure shows schematically the relationship between the EU ETS and the Kyoto Protocol flexibility mechanisms. CDM is the Clean Development Mechanism, JI is the Joint Implementation Mechanism, EU ETS is the European Union Emission Trading Scheme, EUAs are the European Union Allowances, ERUs are the Emission Reduction Units, CERs are the Certificate Emission Reductions, CITL is the Community Independent Transaction Log, and ITL is the International Transaction Log. Note that the ITL has been operational from November 2007. In the squares with small dots we find the European Companies and Member States compliance possibilities. Source: Own elaboration.
These types of units are issued on the basis of land use, land-use change and forestry activities, they are often referred to as “sinks” and, although they are also eligible for compliance, they are not traded even in the case where they are issued from a project. Finally, there exists another type of tradable allowance. We are talking about Verified Emissions Reductions (VER). The particularity of those units is that they cannot be used by the countries to achieve compliance with their Kyoto Protocol targets. These units are issued from projects that may or not follow the CDM projects requirements and they are traded in the voluntary market. Following Taiyab [
6], the voluntary market consists of companies, governments, organisations, organizers of international events, and individuals taking responsibility for their carbon emissions by voluntarily purchasing carbon credits. This is generally done through companies that invest in projects (not necessarily CDM projects) and that sell small amounts of VER. In this case, the project developers have more freedom to invest in small-scale community based projects, lending for important benefits in terms of, for example, local economic development or biodiversity.
In
Figure 1, the relationship among the flexibility mechanisms of the Kyoto Protocol is presented. Additionally, in the squares with small dots, we find the description of the European Union Emission Trading Scheme (EU ETS) integration under the emissions trading mechanism of the Kyoto Protocol. This picture shows that all units can be used for compliance or traded among countries and/or companies.
2.1.b. The Registry Role
The main condition for an Annex I country to be able to trade the different tradable units is to be eligible. The exact meaning of being eligible is that the specific country is able to use international emissions trading under Article 17 of the Kyoto Protocol. Once fully eligible, an Annex B country can transfer, acquire or use ERUs, CERs, and AAUs in order to achieve its targets. One of the requirements to be eligible is to establish a registry where the Assigned Amount Units, the net position in the emissions markets and the units achieved by means of CDM and JI projects are registered. The balance of this registry will be compared to the real emissions of the country in order to determine if there has or has not been commitment of the Kyoto objectives. At the end of the period, each country would surrender and cancel the number of permits that equals its real emissions. Note that banking allowances (the transfer of allowances from one year to the year after) between the years of the commitment period (2008-2012) is allowed by the Kyoto Protocol. Thus, the Kyoto inventory system for each country can be mathematically expressed as follows:
Where R is the balance of the allowances register, P represents the Purchases in the allowance market, S is the Sales, B is the result of banking, and E is the verified emissions. A government’s possibilities to have allowances are reflected by the variables in the left hand side of the equation. On the right hand side of the equation we find the real emissions. Consequently, there is commitment with the Kyoto Protocol only in the case where R > E. If there is no-commitment with the Kyoto Protocol, the country will have to pay a penalty for each extra CO2-e tonne emitted. All trades are supervised by the International Transaction Log (ITL) which is the central administrator and guarantees the realization of all trades under certain criteria. The ITL went live on 14th November 2007 and thus, it has been ready since the beginning of the Kyoto compliance period.
Figure 2.
Annex B CO2-e emissions for the period 1990-2005. (A). Annex B Countries Verified Emissions 2004. B. European Countries Verified Emissions 2005.
Figure 2.
Annex B CO2-e emissions for the period 1990-2005. (A). Annex B Countries Verified Emissions 2004. B. European Countries Verified Emissions 2005.
Figure 2-A shows Annex B countries’ Kyoto target, real emissions change in 1990-2005 without Land-Use, Land-Use Change and Forestry (LULUCF), and the excess of emissions from its targets.
Figure 2-B shows the same variables for European Countries. The base year is in all cases 1990 except for Bulgaria and Poland, whose base year is 1988, for Hungary, whose base year is the average of the years between 1985 and 1987, for Romania, whose base year is 1987, and for Slovenia whose base year is 1986. Source: United Nations Framework on Climate Change and EEA.
The UNFCCC publishes actualized data on the Greenhouse Gas inventories for Annex I countries. The latest report consists of the inventories for the year 2005. In
Figure 2-A the Kyoto Target for Annex B countries, the change in real emissions between 1990 and 2005 in percentage terms and the distance to the Kyoto Protocol Target, also as a percentage, are shown. In
Figure 2-B the same variables are shown for the European countries Note that the real emissions of Turkey are not presented as they are included in Annex I countries but not in Annex B countries. In all cases we present the greenhouse gas inventories without considering land-use, land-use change and forestry [
7].
The situation of the different non-European Annex B countries with regards to the challenges of the Kyoto Protocol is very different (
Figure 2-A). On one hand, there are some countries such as Canada, New Zealand and Liechtenstein that have increased their emissions by more than 20% within the period 1990-2005. At the other extreme, Ukraine has reduced its emissions by more than 50% compared to its base year. If we look to the European Countries (see
Figure 2-B), we see that countries such as Spain, Portugal, Greece, and Ireland have increased their emissions by more than 20%. On the other side, countries such as Rumania, Bulgaria, Estonia, Lithuania and Latvia have reduced their emissions by more than 40%.
The main conclusion is that the Annex B countries with economies in transition had drastically reduced their emissions while the rest of countries had increased them. The case of Spain is particularly complex. Its target was to increase its emissions by a maximum of 15% of 1990 emissions but the increase was already 52.3% in 2005. Although the difference between the Spanish verified emissions and its target is one of the largest ones, Spain is not one of the biggest polluters in the world. Countries such as the USA, Russia, Germany, Japan, among others, emit more CO2-e per capita than Spain.
Another possible analysis consists of comparing the change in the real emissions with the Kyoto Protocol target of each country. We have created a new variable called “Distance to commitment of Kyoto Protocol” which is the difference between the increase in the real emissions and the Kyoto target. A negative result in this variable means that the country has emitted less greenhouse gas during the period 1990-2005 than its Kyoto objective. This type of country is a potential seller of CO
2-e allowances. On the other hand, a positive result of the subtraction must be interpreted as the country having exceeded its target. The countries in that situation, such as Spain, Austria, and Luxemburg, are potential buyers of CO
2-e allowances. In
Figure 2-A and
Figure 2-B, we can see clearly that the countries that have drastically reduced their emissions (on the left hand side of the graph) are those that have better fulfilled their commitments and even have a wide margin to participate in the international emissions trade as sellers of allowances. On the other hand there are other countries, such as Spain, that have considerably increased their emissions from 1990 to 2005 leading to a deficit of allowances for these countries.
2.2. Previous Allowances Trading Experiences
Before the implementation of the Kyoto Protocol and the first use of the trading allowances mechanism, there have been many other experiences with trading different types of allowances.
In the United States, there have been programs to reduce the use of lead in petrol (inter-refinery trading was allowed and also banking), to control Acid Rain (the main objective of the program was to reduce sulphur emissions from power plants in the United States), and to help control emissions of SO
2 and NO
x (the regional clean air incentives market program known as
Reclaim was established in Los Angeles). Finally, California’s South Coast Air Quality Management District’s objective is to reduce emissions from business and industries [
8,
9,
10].
There are also trading schemes related to the emissions of acid precursors in Europe. For example, The Netherlands and Slovakia have legally binding emission caps of acid rain precursors and, in order to help them to meet their targets, they have introduced trading schemes. For example, in the case of Slovakia, the tradable allowances market started in January 2002. The objective of the program is to reduce the SO2 emissions in 2010 to 36% of the emissions in 1999. The permits are grandfathered (the allocation is based on the historic emissions of each concerned company) from the central government (Environmental Ministry) to the districts and then to the companies. The penalty in case of polluting more than assigned is about 140 euros per excess tonne. In the UK, there is a trading system on the packaging waste. To fulfil the European legislation, the UK Government has created the packaging recovery note (PRN) to verify that companies do packaging. In fact, the PRNs are traded as a form of evidence of having met packaging obligations and are presented to the relevant agency.
Additionally, due to the interest in promoting renewable energies in Europe, the White Paper for a Community Strategy and Action Plan, published in November 1997, established that a percentage of the energy produced might come from renewable sources. In that context, some countries, including Italy, the Netherlands, Sweden, the United Kingdom, Finland, and Denmark have created tradable renewable energy certificates. The objective is that a plant that produces a bigger percentage of renewable energy can sell to another plant a part of that percentage to allow the latter to meet its commitments [
11].
Trading has also been used in other contexts where resources are vulnerable to human activity. An example of this is the individual transferable quotas in fisheries, which are used in New Zealand, Canada, Iceland, the Netherlands, the UK, Denmark, Portugal and Italy.
Related to climate change and before the creation of the EU ETS, the UK created a trading scheme, the UK greenhouse gas emission trading scheme, which is part of the UK climate change programme. The UK emissions trading scheme was launched in March 2002 and ran until December 2006, with final reconciliation in March 2007. Thirty-three organisations ("direct participants" in the scheme) voluntarily took on emission reduction targets to reduce their emissions against 1998-2000 levels. They committed to reducing their emissions by 3.96 million tonnes of CO2-e by the end of the scheme.
The Danish CO2-e emission allowance scheme, a cap and trade system designed and operated by the Danish Energy Agency, started in 1999 and covered the large electricity producers in Denmark. The nine largest emitters in the electricity-generating sector represent more than 90% of the total CO2-e emissions from that sector, and approximately 30% of total Danish GHG emissions. The initial permits were allocated to firms according to their historical GHG emission levels between 1994 and 1998 and a penalty of DKK 40 (~EUR 5.30) was applied for every metric tonne of CO2-e that was emitted beyond a given firm’s individual cap. The scheme has been superseded by the new European greenhouse gas emission allowance trading scheme from January 2005.
In Australia, under the New South Wales Greenhouse Gas Abatement Scheme, from 1
st January 2003 and with the objective of reducing greenhouse gas emissions to 7.27 tonnes of CO
2-e per capita by 2007, electricity retailers and other parties were required, by legislation, to meet mandatory targets for reducing the emission of greenhouse gases associated with the production and use of electricity. To achieve the required reduction in emissions, eligible parties purchase and surrender tradable certificates called New South Wales Greenhouse Abatement Certificates. Each year, the Scheme sets individual benchmark reductions of greenhouse gas emissions for each participant based on their contribution to the supply of electricity. In the case that the participant emits more CO
2-e than its objective a penalty of AUD 10.50 per tonne of CO
2-e above its benchmark must be paid [
12].
Most of the programs commented above are widely studied in the European Environment Agency (EEA) Technical Report nº 8/2005: “Market-based instruments for environmental policy in Europe” [
13], the EEA Technical Report nº 1/2006: “Using the market for cost-effective environmental policy” [
14] and they are also analysed by Boemare and Quirion [
15]. Specifically, these authors comment on some similarities and differences among programs and try to find out which are the lessons to be applied in the EU ETS. For example, they confirm that most of the programs work with registration transfers and allow the banking of allowances, they consider monitoring and effective sanctions as crucial mechanisms in the success of a program and they underline that the US Acid rain program had lower costs than the most optimistic forecast. The authors also study the case of two companies, BP and Shell that had established trading systems to reduce their emissions. Further information on the BP trading system is also reported by Victor and House [
16].
As commented before, apart from the schemes created in order to facilitate the achieving of the objectives of reducing greenhouse gas emissions under the Kyoto Protocol, another phenomenon related to carbon credits has started recently. We are talking about the voluntary market. The Chicago Climate Exchange (CCX) has organized a voluntary trading scheme in the USA. CCX emitting members make a voluntary, but legally binding, commitment to meet annual emission reduction targets of all six major greenhouse gases. The trading of CCX Carbon Financial Instrument (CFI) contracts facilitates the compliance.
3. The European Union emission trading scheme
Through the EU ETS, EU Member States pass part of the effort towards their Kyoto commitments to the private sector (mostly utilities). The scheme officially started 1st January 2005 and it is divided in two Phases. Phase I corresponds to the period starting 1st January 2005 and finishing 31st December 2007, and Phase II coincides with the Kyoto Protocol commitment period and consequently goes from 1st January 2008 to 31st December 2012. The Phase III will probably start on 1st January 2013 and finish in 2020. The EU ETS is one of the most important policies at the European Union level to achieve compliance with the Kyoto Protocol. The EU ETS is the largest emission trading scheme not only in terms of allowances distributed but also in terms of the number of installations covered.
The EU ETS is a Cap and Trade system, in the sense that total emissions are limited or 'capped' and the excess allowances can be traded. However, as it will be linked to the United Nations carbon markets, the EU ETS will allow for more permits (ERUs and CERs) to enter into the system. It is regulated by the 2003/87/EC Directive [
17], amended by the Directive 2004/101/EC [
18].
As pointed out by Kruger
et al. [
19], it is halfway between a wholly centralized and a completely decentralized system. On the one hand, the central administrator, the European Commission, decides the structure of the scheme, the participants in the market, and the gases whose emissions should be reduced. On the other hand, the Member States fix, through the National Allocation Plans (NAPs) approved by the European Commission, the national cap, and they allocate the emissions cap among the installations covered by the 2003/87/EC Directive [
20]. Additionally, the monitoring, the verifying of real emissions and the reporting of the national compliance of the Kyoto Protocol is also done by Member States who must punctually inform the European Commission. Member States also decide about the way the allowances are distributed and the possibility of banking allowances among Phases.
Not all the sectors in the economy producing CO2 emissions are regulated by the 2003/87/EC Directive and thus, not all of them participate in emission trading. In fact, the Directive only applies to those companies belonging to the following industries: combustion plants, oil refineries, coke ovens, iron and steel plants, and factories making cement, glass, lime, brick, ceramics, pulp and paper. Those sectors are called trading sectors and are different from the non-trading sectors (such as the residential and transports sectors). The distribution of the different sectors in the economy into trading and non-trading sectors is susceptible to changes. For example, at the moment, discussions are taking place in order to decide if aviation will be included in the trading sector and if so, how it would be regulated. Note that in all cases, even if the compliance of the trading sectors is assured by companies and the compliance of the non-trading sector by Member States, the final parties responsible for meeting the obligations are the Member States. As the Member States are responsible for all the emissions in the country, and the Kyoto objective is considered in global terms, they should allocate only a part of their total Assigned Amount Units.
If we come back to
Figure 1, we are now in a condition to understand the compliance of the Kyoto Protocol by the European Union countries. As we can appreciate in this figure, the companies under the Directive only used, in order to achieve compliance of their target reduction during 2005-2007, the EU ETS. This is explained by the fact that Phase I of the EU ETS was over-allocated and thus EUA prices were very low, making inefficient the use of other units of the Kyoto Protocol (ERUs and CERs) to achieve compliance in Phase I. However, from January 2008, it will probably be efficient to use CERs and ERUs for compliance. Note that both the ERUs and CERs can be obtained by the companies either through the realisation of projects or via the secondary market.
3.1. The National Allocation Plans
Following the 2003/87/CE Directive, the allocation of allowances is done through the NAPs and thus this is the “cap” part of the EU ETS. Each Member State in the EU has to submit its NAP to the European Commission for each of the Phases considered in the Directive. The elaboration of the NAP requires that each Member State must decide ex-ante how many allowances to allocate in total for a trading period. It has also to decide how many allowances each plant covered by the Emissions Trading Scheme will receive per year of the compliance period. The 2003/87/CE covers over 11.500 energy-intensive installations across the EU, which represent close to half of Europe’s emissions of CO2. The allowances distributed to the companies covered by the 2003/87/EC in the EU ETS are called European Union Allowances (EUA). Each EUA allows for one tonne of CO2–equivalent to be emitted.
The Directive establishes that a minimum of 95% of the total allowances allocated must be freely allocated for Phase I. This percentage is reduced to 90% for Phase II. A maximum of 5% (10%) could be auctioned. Nevertheless this is only an upper limit and it is incumbent on each Member State to determine the exact amount of allowances freely allocated and how it proposes to allocate them [
21].
The NAPs has to be presented to the European Commission at least 18 months before the start of the Phase. Upon receipt of a complete plan, the Commission has 3 months for its assessment. All Phase I NAPs were submitted to the European Commission during 2004 and 2005 by all Member States. The European Commission adopted decisions on all countries’ plans. Member States had to submit their Phase II NAPs to the Commission by 30 June 2006, including the limitation in percentage terms of the surrender limit for JI/CDM credits.
By early September 2007, all Phase II NAPs had been provided to the European Commission and on October 2007 all the European Commission Decisions were already published. Only in the cases of Denmark, France, Slovakia and the United Kingdom did the Commission respect the cap proposed by the countries. In all other cases the cap was reduced. In the case of 11 countries (Austria, Belgium, Finland, Germany, Greece, Ireland, Italy, The Netherlands, Portugal, Spain, and Sweden) the cap was reduced by less than 10%. However, there are countries such as Lithuania, Latvia, and Estonia where the cap was reduced by around 50% from the amount proposed by the country. The rest of the countries’ caps were reduced by between 60 and 85% (see
Table 2).
All figures are annual, in million tonnes of CO
2.
- (1)
The figures indicated in this column comprise emissions in installations that come under the coverage of the scheme in 2008 to 2012 due to an extended scope applied by the Member State and do not include new installations entering the scheme in sectors already covered in the first trading period.
- (2)
The JI/CDM limit is expressed as a percentage of the member state’s cap and indicates the maximum extent to which companies may surrender JI or CDM credits instead of EU ETS allowances to cover their emissions. These credits are generated by emission-saving projects carried out in third countries under the Kyoto Protocol’s project-based flexible mechanisms, known as Joint Implementation (JI) and the Clean Development Mechanism (CDM).
- (3)
Including installations which Belgium opted to exclude temporarily from the scheme in 2005
- (4)
Due to Bulgaria's recent accession to the EU, this figure is not independently verified.
- (5)
n.a. means data not available.
- (6)
The German national allocation law contains a figure of 22 %, which relates to the allowances allocated free of charge, rather than the total cap.
- (7)
Italy has to include further installations. The amount of additional emissions is not known (n.k.) at this stage.
- (8)
Due to Romania's recent accession to the EU, this figure is not independently verified.
- (9)
Additional installations and emissions of over 6 million tonnes are already included as of 2006.
- (10)
Verified emissions for 2005 do not include installations which the UK opted to exclude temporarily from the scheme in 2005 but which will be covered in 2008 to 2012 and are estimated to amount to some 30 Mt.
- (11)
The sum of verified emissions for 2005 does not include installations which the UK opted to exclude temporarily from the scheme in 2005 but which will be covered in 2008 to 2012 and are estimated to amount to some 30 Mt. Furthermore, the emissions figures for Bulgaria and Romania are not independently verified.
The total allowed cap is around 11% less than initially proposed by the countries. Note that in the case of Phase II NAPs, the European Commission takes into account the 2005 real emissions when deciding about the national caps. The sum is 74.3 million tonnes of CO
2-e per year less than 2005 verified emissions. To show the interest of the European Commission in reducing European greenhouse gas emissions, we point out that the European Commission has allocated for Phase II 216.67 million tonnes of CO
2-e per year less than the allocations for Phase I. In order to make the amount allocated in Phase I and Phase II comparable, 216.67 does not take into account the Phase II caps for Romania and Bulgaria. The reason for such choice is that those countries did not have Phase I NAPs. Finally, column 4 in
Table 2 presents the proposed cap for the period 2008-2012. Updated projections of European emissions for the year 2010 are available on the European Environmental Agency website (
http://dataservice.eea.europa.eu/). In order to present a graphical idea of which countries represent the largest part of the allowances distributed, we have elaborated
Figure 3.
Table 2.
Final Commission decision on NAPs.
Table 2.
Final Commission decision on NAPs.
| Member State | 1st period cap (2005-2007) | 2005 verified emissions | Proposed cap 2008-2012 | Cap allowed 2008-2012 (in relation to proposed) | Additional emissions in 2008-2012(1) | JI/CDM limit 2008-2012 in %(2) |
|---|
| Austria | 33.0 | 33.4 | 32.8 | 30.7 | (93.6%) | 0.35 | 10 |
| Belgium | 62.1 | 55.58(3) | 63.3 | 58.5 | (92.4%) | 5.0 | 8.4 |
| Bulgaria | 42.3 | 40.6(4) | 67.6 | 42.3 | (62.6%) | n.a(5) | 12.55 |
| Cyprus | 5.7 | 5.1 | 7.12 | 5.48 | (77%) | n.a. | 10 |
| Czech Rep. | 97.6 | 82.5 | 101.9 | 86.8 | (85.2%) | n.a. | 10 |
| Denmark | 33.5 | 26.5 | 24.5 | 24.5 | (100%) | 0 | 17.01 |
| Estonia | 19 | 12.62 | 24.38 | 12.72 | (52.2%) | 0.31 | 0 |
| Finland | 45.5 | 33.1 | 39.6 | 37.6 | (94.8%) | 0.4 | 10 |
| France | 156.5 | 131.3 | 132.8 | 132.8 | (100%) | 5.1 | 13.5 |
| Germany | 499 | 474 | 482 | 453.1 | (94%) | 11.0 | 20(6) |
| Greece | 74.4 | 71.3 | 75.5 | 69.1 | (91.5%) | n.a. | 9 |
| Hungary | 31.3 | 26.0 | 30.7 | 26.9 | (87.6%) | 1.43 | 10 |
| Ireland | 22.3 | 22.4 | 22.6 | 22.3 | (98.6%) | n.a. | 10 |
| Italy | 223.1 | 225.5 | 209 | 195.8 | (93.7%) | n.k. (7) | 14.99 |
| Latvia | 4.6 | 2.9 | 7.7 | 3.43 | (44.5%) | n.a. | 10 |
| Lithuania | 12.3 | 6.6 | 16.6 | 8.8 | (53%) | 0.05 | 20 |
| Luxembourg | 3.4 | 2.6 | 3.95 | 2.5 | (63%) | n.a. | 10 |
| Malta | 2.9 | 1.98 | 2.96 | 2.1 | (71%) | n.a. | n.a. |
| Netherlands | 95.3 | 80.35 | 90.4 | 85.8 | (94.9%) | 4.0 | 10 |
| Poland | 239.1 | 203.1 | 284.6 | 208.5 | (73.3%) | 6.3 | 10 |
| Portugal | 38.9 | 36.4 | 35.9 | 34.8 | (96.9%) | 0.77 | 10 |
| Romania | 74.8 | 70.8(8) | 95.7 | 75.9 | (79.3%) | n.a | 10 |
| Slovakia | 30.5 | 25.2 | 41.3 | 32.6 | (78.9%) | 1.78 | 7 |
| Slovenia | 8.8 | 8.7 | 8.3 | 8.3 | (100%) | n.a. | 15.76 |
| Spain | 174.4 | 182.9 | 152.7 | 152.3 | (99.7%) | 6.7(9) | 20 |
| Sweden | 22.9 | 19.3 | 25.2 | 22.8 | (90.5%) | 2.0 | 10 |
| UK | 245.3 | 242.4(10) | 246.2 | 246.2 | (100%) | 9.5 | 8 |
| SUM | 2298.5 | 2122.16(11) | 2325.34 | 2082.68 | (89.56%) | 54.69 | - |
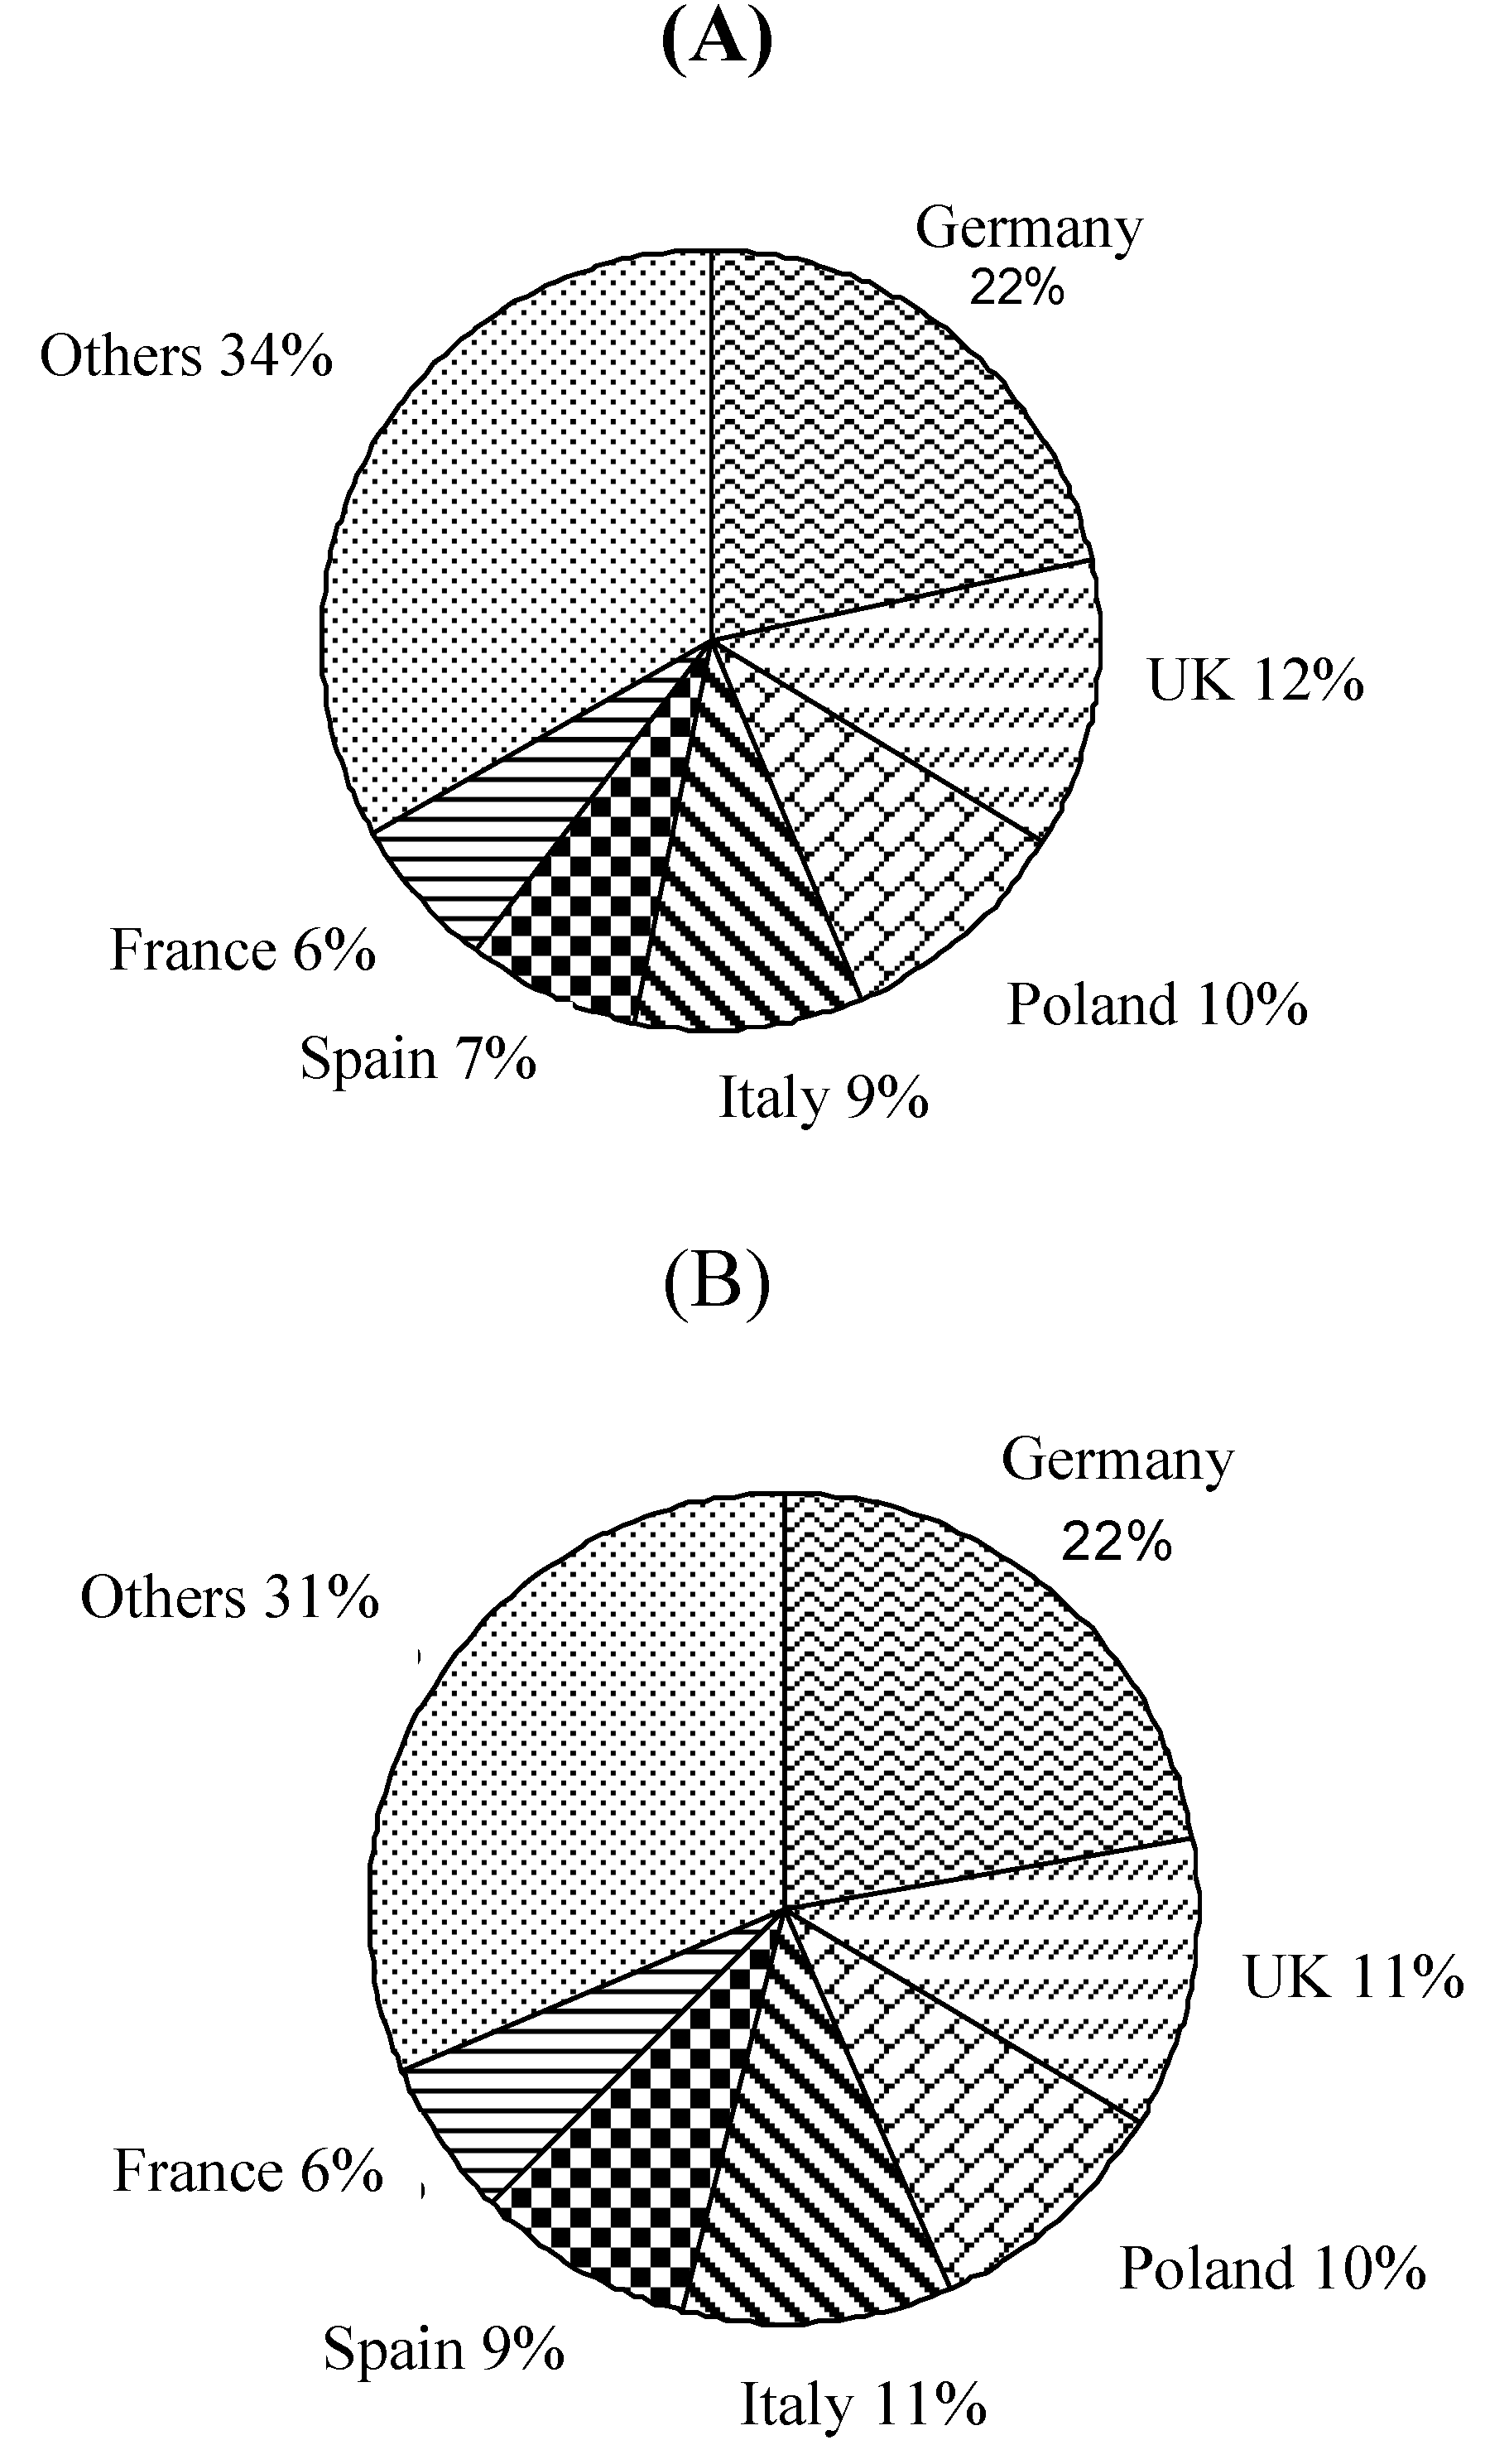
Figure 3.
Percentages of the Allocations of Large European Countries. (A). Percentages of Total Allowances Distribution by Countries for Phase I. (B) Percentages of Total Allowances Distribution by Countries for Phase II
Figure 3.
Percentages of the Allocations of Large European Countries. (A). Percentages of Total Allowances Distribution by Countries for Phase I. (B) Percentages of Total Allowances Distribution by Countries for Phase II
In
Figure 3-A (B) the percentage of total allowances distributed in Europe for Phase I (II) is presented. Only the countries representing more than 5% of total emissions are considered. The countries that represent less than 5% are grouped in Others. Source: European Commission.
As we can appreciate in
Figure 3, six European countries represent more than 65% of the total allowances distributed in Europe. The most important country in this sense is Germany (22%), followed by the UK (12%). Poland, Italy, Spain, and France are the countries that follow. As we may expect, those are also the countries with the highest verified emissions for the year 2005.
Additionally, Trotignon and Delbosc [
22] point out that electricity production represents around 50 % of Phase I allocations and bears most of the total constraint. In what concerns the market players, concentration, the authors also underline that more than half of the allowances are held by only 30 companies.
3.2. The Trading System
As in the case of the Emission Trading mechanism under the Kyoto Protocol, the EU ETS is organized into accounts transactions. Each Member State has its own registry where the balance of the allowances of each company is captured [
23]. For the moment the different registries are linked to the Community Independent Transaction Log (CITL). The CITL oversees the European registry systems that are standardized under European legislation. Its mission is to verify each deal done in the European market. If it finds an irregularity, the trade will not take place until the irregularity has been solved. Nevertheless, all registries will be linked to the United Nations carbon markets and will be integrated in the international registry system under the Kyoto Protocol (the ITL). The European Commission has established April 2009 as the deadline for the European registries to be linked to the ITL. However, the European Commission, Member States and the UNFCCC Secretariat completed the live connection between the CITL, the UNFCCC International Transaction Log (ITL) and Member State registries on 16 October 2008. Now all Member State registries are operational, with the exception of Romania which will remain offline for several more days in order to allocate allowances to its installations. At this moment, the European countries are eligible to use the credits from the JI and CDM in order to achieve compliance. Additionally, the registries from Japan, New Zealand, and Switzerland are also linked to the ITL [
24]. As the trading is a purely electronic system and as allowances are reflected in accounts, in order to participate in the organized emissions allowance market it is necessary to have an account in the market where the transaction will take place. In that market register, the purchases and sales for each participant are shown. It is important to note that not only the companies covered by the 2003/87/EC Directive are able to participate in the organized market. Every natural and legal person is authorized to open an account and participate in the emissions market.
3.3. Monitoring of Compliance
To supervise the commitment of the objectives, the European Community has established that each Member State must supervise the submission of a satisfactory emissions report of the previous year’s verified emissions by each operator not later than 31
st March of the following year. For example, the 2005 verified emissions report must be presented by 31
st March 2006. If this report is not presented or if it is not considered satisfactory, the company will not be able to proceed to new trades until this condition is satisfied. Additionally, each company must surrender the allowances of the previous year not later than 30
th April of the following year so that they are cancelled. For example, 30
th April 2006 was the deadline to surrender the allowances of the year 2005.
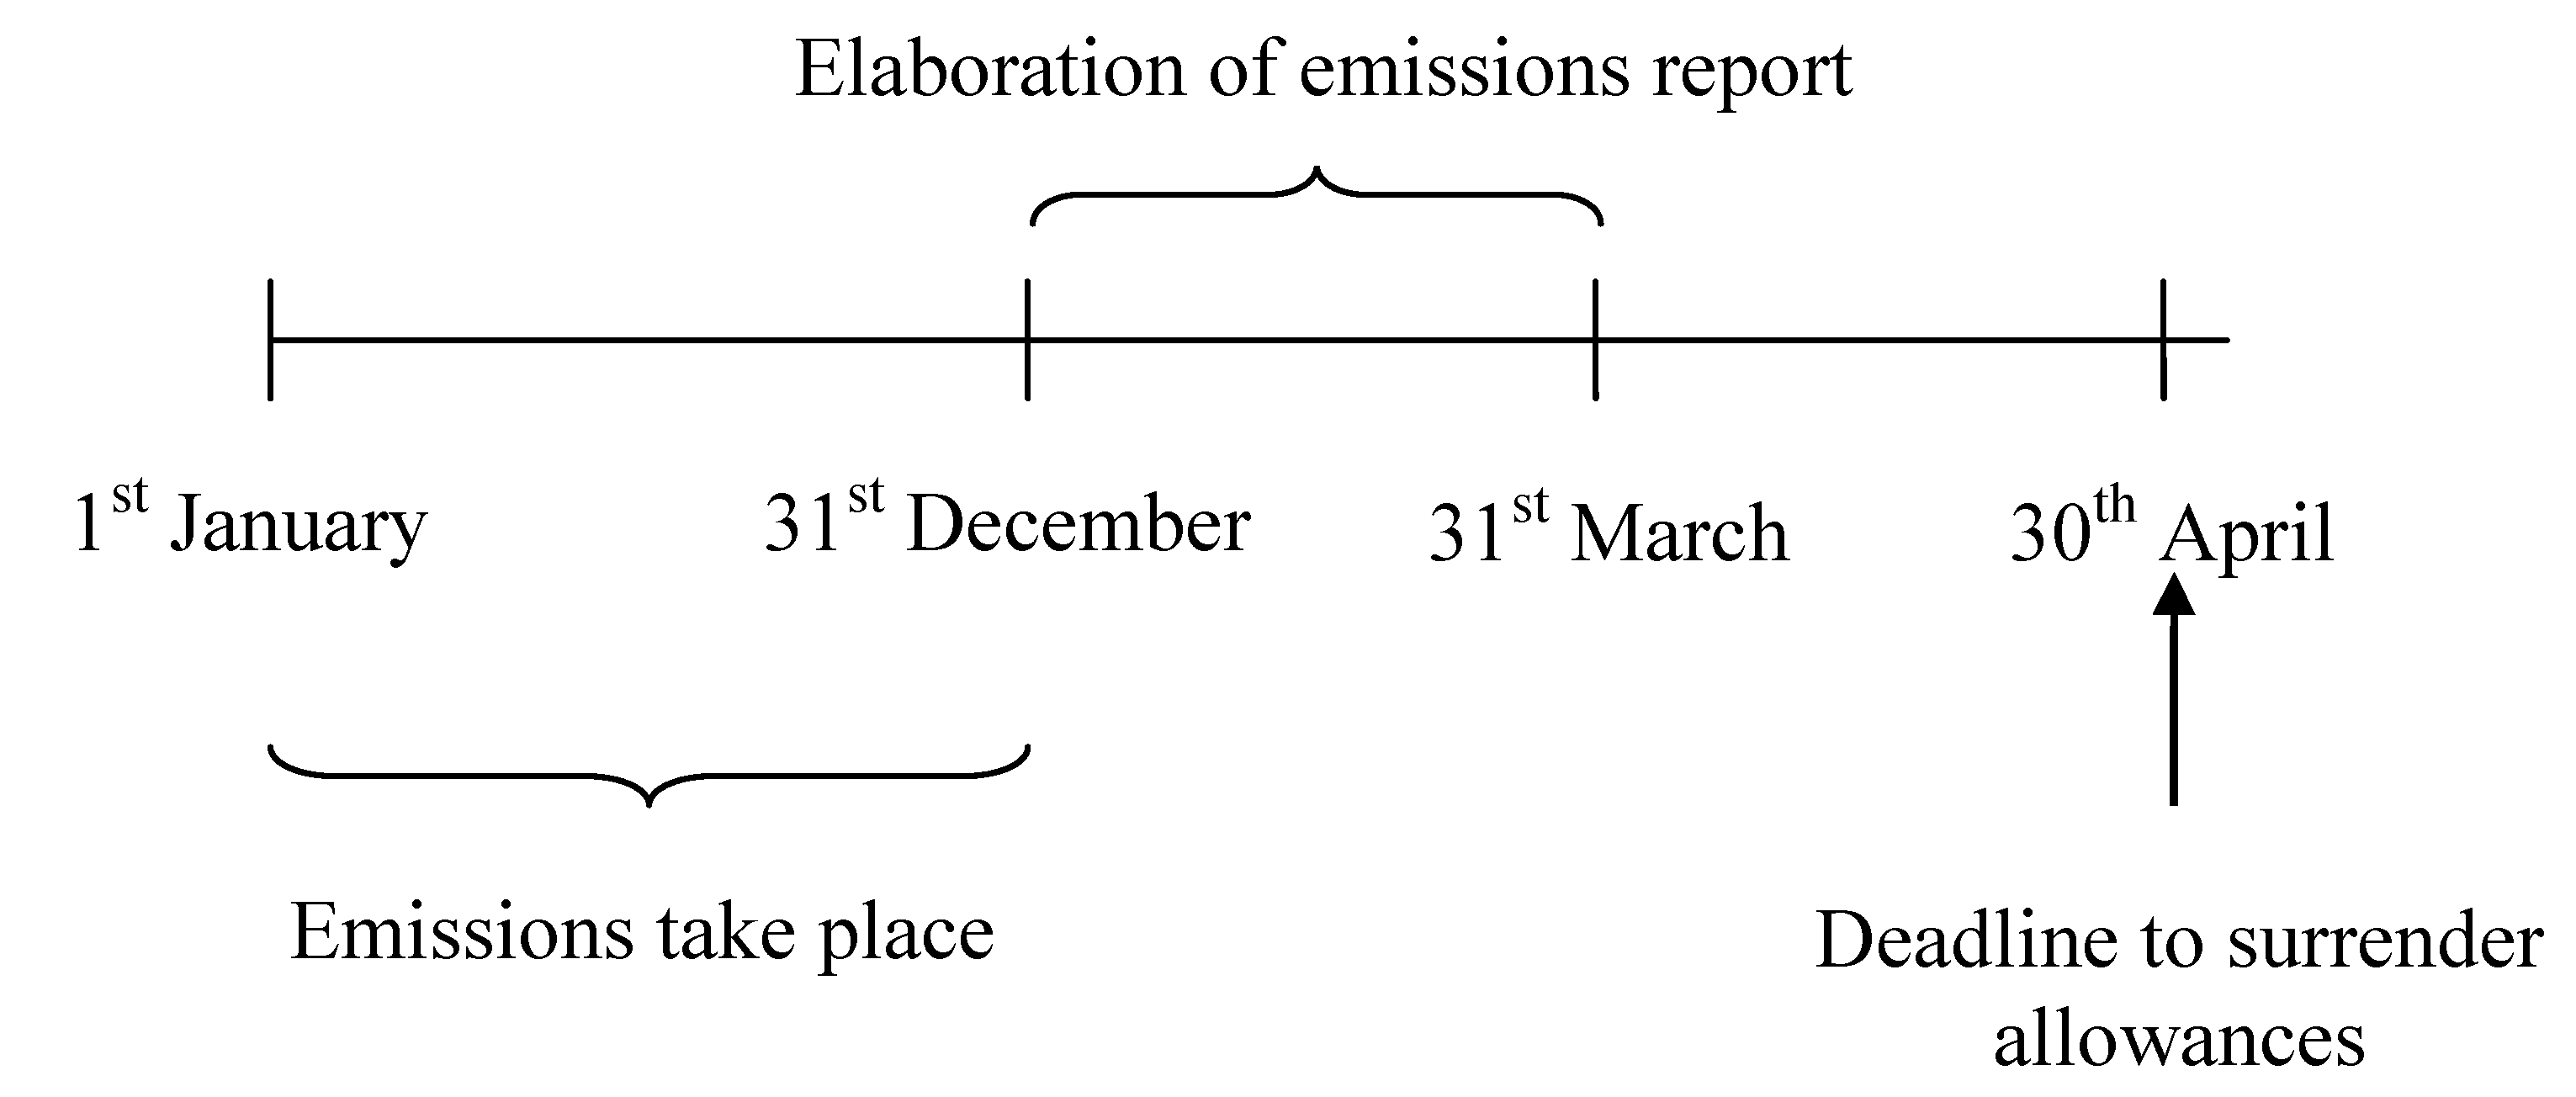
Figure 4 depicts this process graphically.
As indicated in the 2003/87/EC Directive (art. 13), the member state must cancel the allowances that are no longer valid and that have not been surrendered and cancelled. The Phase I allowances are no longer valid four months after the beginning of the first five-year period (the Phase II of the EU ETS), which means that they are cancelled 30th April 2008 and they are no longer valid in May 2008. The Directive allows the Member States to replace those cancelled allowances with valid allowances. That is, the Directive allows banking between periods and gives the Member States the responsibility to decide if banking is possible in practice. Among all Member States only France and Poland decided to allow banking at the beginning, although they later renounced it. Therefore the companies cannot do banking between Phase I and Phase II of the EU ETS (between the years 2007 and 2008).
Figure 4.
Deadlines of the EU ETS.
Figure 4.
Deadlines of the EU ETS.
![Energies 01 00120 g004]()
This Figure shows how the deadlines are organised in the EU ETS. First of all, the real emissions take place, then a verified report has to be presented by each Member State to the European Commission before 31
st March of the following year and before 30
th April the companies should surrender the allowances that correspond to their real emissions. In the case they do not have enough allowances, they must pay a penalty but that does not release them from the responsibility of presenting the allowances.
Source: Own elaboration from 2003/87/EC Directive. In the case the allowances are not surrendered a penalty of €40 (€100) would be applied in Phase I (Phase II) to the company for each extra CO
2-e tonne emitted. In order to differentiate the emissions trading from a tax on CO
2-e emissions, the penalty of €40 (€100) is a penalty with restitution, which means that the payment of the penalty does not release the company from presenting the allowances corresponding to its emissions. The “
payment of the excess emissions penalty shall not release the company from the obligation to surrender an amount of allowances equal to those excess emissions when surrendering allowances in relation to the following calendar year” [
25].
Related to borrowing between Phases, it is generally not allowed, even though we have seen that it depends on Member States. However, the structure of the EU ETS and particularly the penalty with restitution leads to the existence of implicit borrowing between these two Phases. The implicit borrowing is produced if there is no compliance in the last year of Phase I (2007). That is, the number of allowances surrendered in 2008 that corresponds to the real emissions in 2007 is smaller than the verified emissions. In this case, the company has the obligation to pay the penalty and make restitution of the right number of allowances. As this information is known after 30
th April 2008, and thus, after the allowances of the Phase I have been cancelled, the only possibility is that the restitution of the allowances after the penalty is done with allowances from the next Phase [
26]. Consequently, in this case there exists implicit borrowing between Phases. Nevertheless, as we will see in the next section, Phase I allowances finished the Phase I period at a price around zero and thus there was no interest in borrowing between Phase I and Phase II of the EU ETS (note that Phase II EUAs prices were around 20 euros in March 2008).
3.4. Post 2012 EU ETS
Before finishing with this part of the paper, we should just add that the European Commission has made a proposal for a Directive of the European Parliament and of the Council amending Directive 2003/87/EC in order to improve and extend the greenhouse gas emission allowance trading system of the Community. The main amendments concern, on the one hand, the emissions reduction objectives of the Community, and on the other hand, the methodology to distribute the allowances among the installations. Related to the first group the objective reductions are at least 20% below the 1990 levels by 2020, and 30% provided that other developed countries commit themselves to comparable emission reductions and economically more advanced developing countries contribute adequately according to their responsibilities and respective capabilities. With respect to the method for distributing the allowances, auctioning will probably be used the most.
In contrast to Phase I and Phase II of the EU ETS, from 2013 onwards, the basic principle for allocation should be auctioning, which is the most economically efficient system. Finally, the allowances issued from 1 January 2013 onwards shall be valid for emissions during periods of eight years beginning on 1 January 2013. Thus we may expect that the EU ETS will continue in Phase III from 2013 to 2020.
4. Carbon trading in Europe
In this section, we focus our attention on the different possibilities of trading EUAs in Europe. The possibilities vary from Over-The-Counter (OTC) to organized markets trades. In both cases a wide variety of contracts are used. Note that as has already been said, banking is not allowed between Phase I and Phase II of the EU ETS and, consequently, there exist in Europe two differentiated assets that can be traded in the EU ETS: EUAs Phase I and EUAs Phase II. As we will illustrate, this difference is significant.
It is important to highlight that in these markets there are a wide variety of participants. Thus, there are industrial agents that are directly concerned with the CO2 emission reductions, as well as brokers and financial institutions.
4.1. Over-the-Counter trading
The first carbon trades in Europe were OTC trades that took place even before the start of the EU ETS. The European Energy Exchange (EEX) soon calculated an index of OTC forward carbon prices, called CO2 Index or European Carbon Index. This index was published on each trading day from 25th October 2004 to 30th November 2005. The index was a volume-weighted average price of OTC forward trading activities of market participants with delivery until 30th April 2006. Additionally, other OTC carbon indexes have been created by the London Energy Brokers’ Association (LEBA). The LEBA is comprised of 10 members who provide coverage for all key product groups in the energy sector: oil, gas, power, coal and emissions.
Specifically LEBA also calculates three indices. The first one, the
LEBA Carbon Index, is calculated every trading day using the volume weighted average of EUAs trades transacted by LEBA member firms and takes into account all carbon deals transacted with delivery on 1
st December 2007, 1
st December 2008, and 1
st December 2009. The second one is the
LEBA 0800-1000 Carbon Index which takes into account all carbon deals transacted with delivery on 1
st December 2007, 1
st December 2008, and 1st December 2009 between 8 a.m. and 10 a.m. Finally, the
LEBA Carbon Index Spot takes into account all carbon deals transacted with delivery on spot 1
st December 2006, 1
st December 2007, and 1
st December 2008. The
LEBA Carbon Index, the
LEBA 0800-1000 Carbon Index, and the
LEBA Carbon Index Spot have been published since 30
th May 2005, 1
st November 2005 and 18
th January 2006, respectively [
27]. We have compared in
Figure 5-A the European
CO2 Index from EEX with the
LEBA Carbon Index Spot (LEBA(I)), and the
LEBA Carbon Index (LEBA(II)).
If we compare the EEX Carbon Index, which refers to prices traded for Phase I of the EU ETS, with the LEBA (I), which also represents Phase I prices, we can appreciate that both prices behave similarly. The prices started at about €6 before the beginning of the EU ETS and in January 2005, when the EU ETS was launched, they were around 8 €/tCO2. They stayed relatively stable until February 2005. Then the prices increased reaching a peak (29.10 €/tCO2) on 11th July 2005. The prices decreased and stayed in the 20-25 €/tCO2 range until December 2005 when a bullish period started. Another peak was reached on 19th April 2006 when OTC Phase I forward prices were above 30 €/tCO2. Successive decreases brought the carbon prices to the range 15-20 €/tCO2. On 15th September 2006 a decreasing tendency started that would not stop until the end of the publication of the Carbon Index (30th November 2006). On 7th November 2006 the OTC Phase I forward prices definitively dropped below the 10 €/tCO2 barrier and on 3rd April 2007 the barrier of 1 €/tCO2 for the first time by the LEBA (I), which was traded until 30th November 2007 at 0.04 €/tCO2.
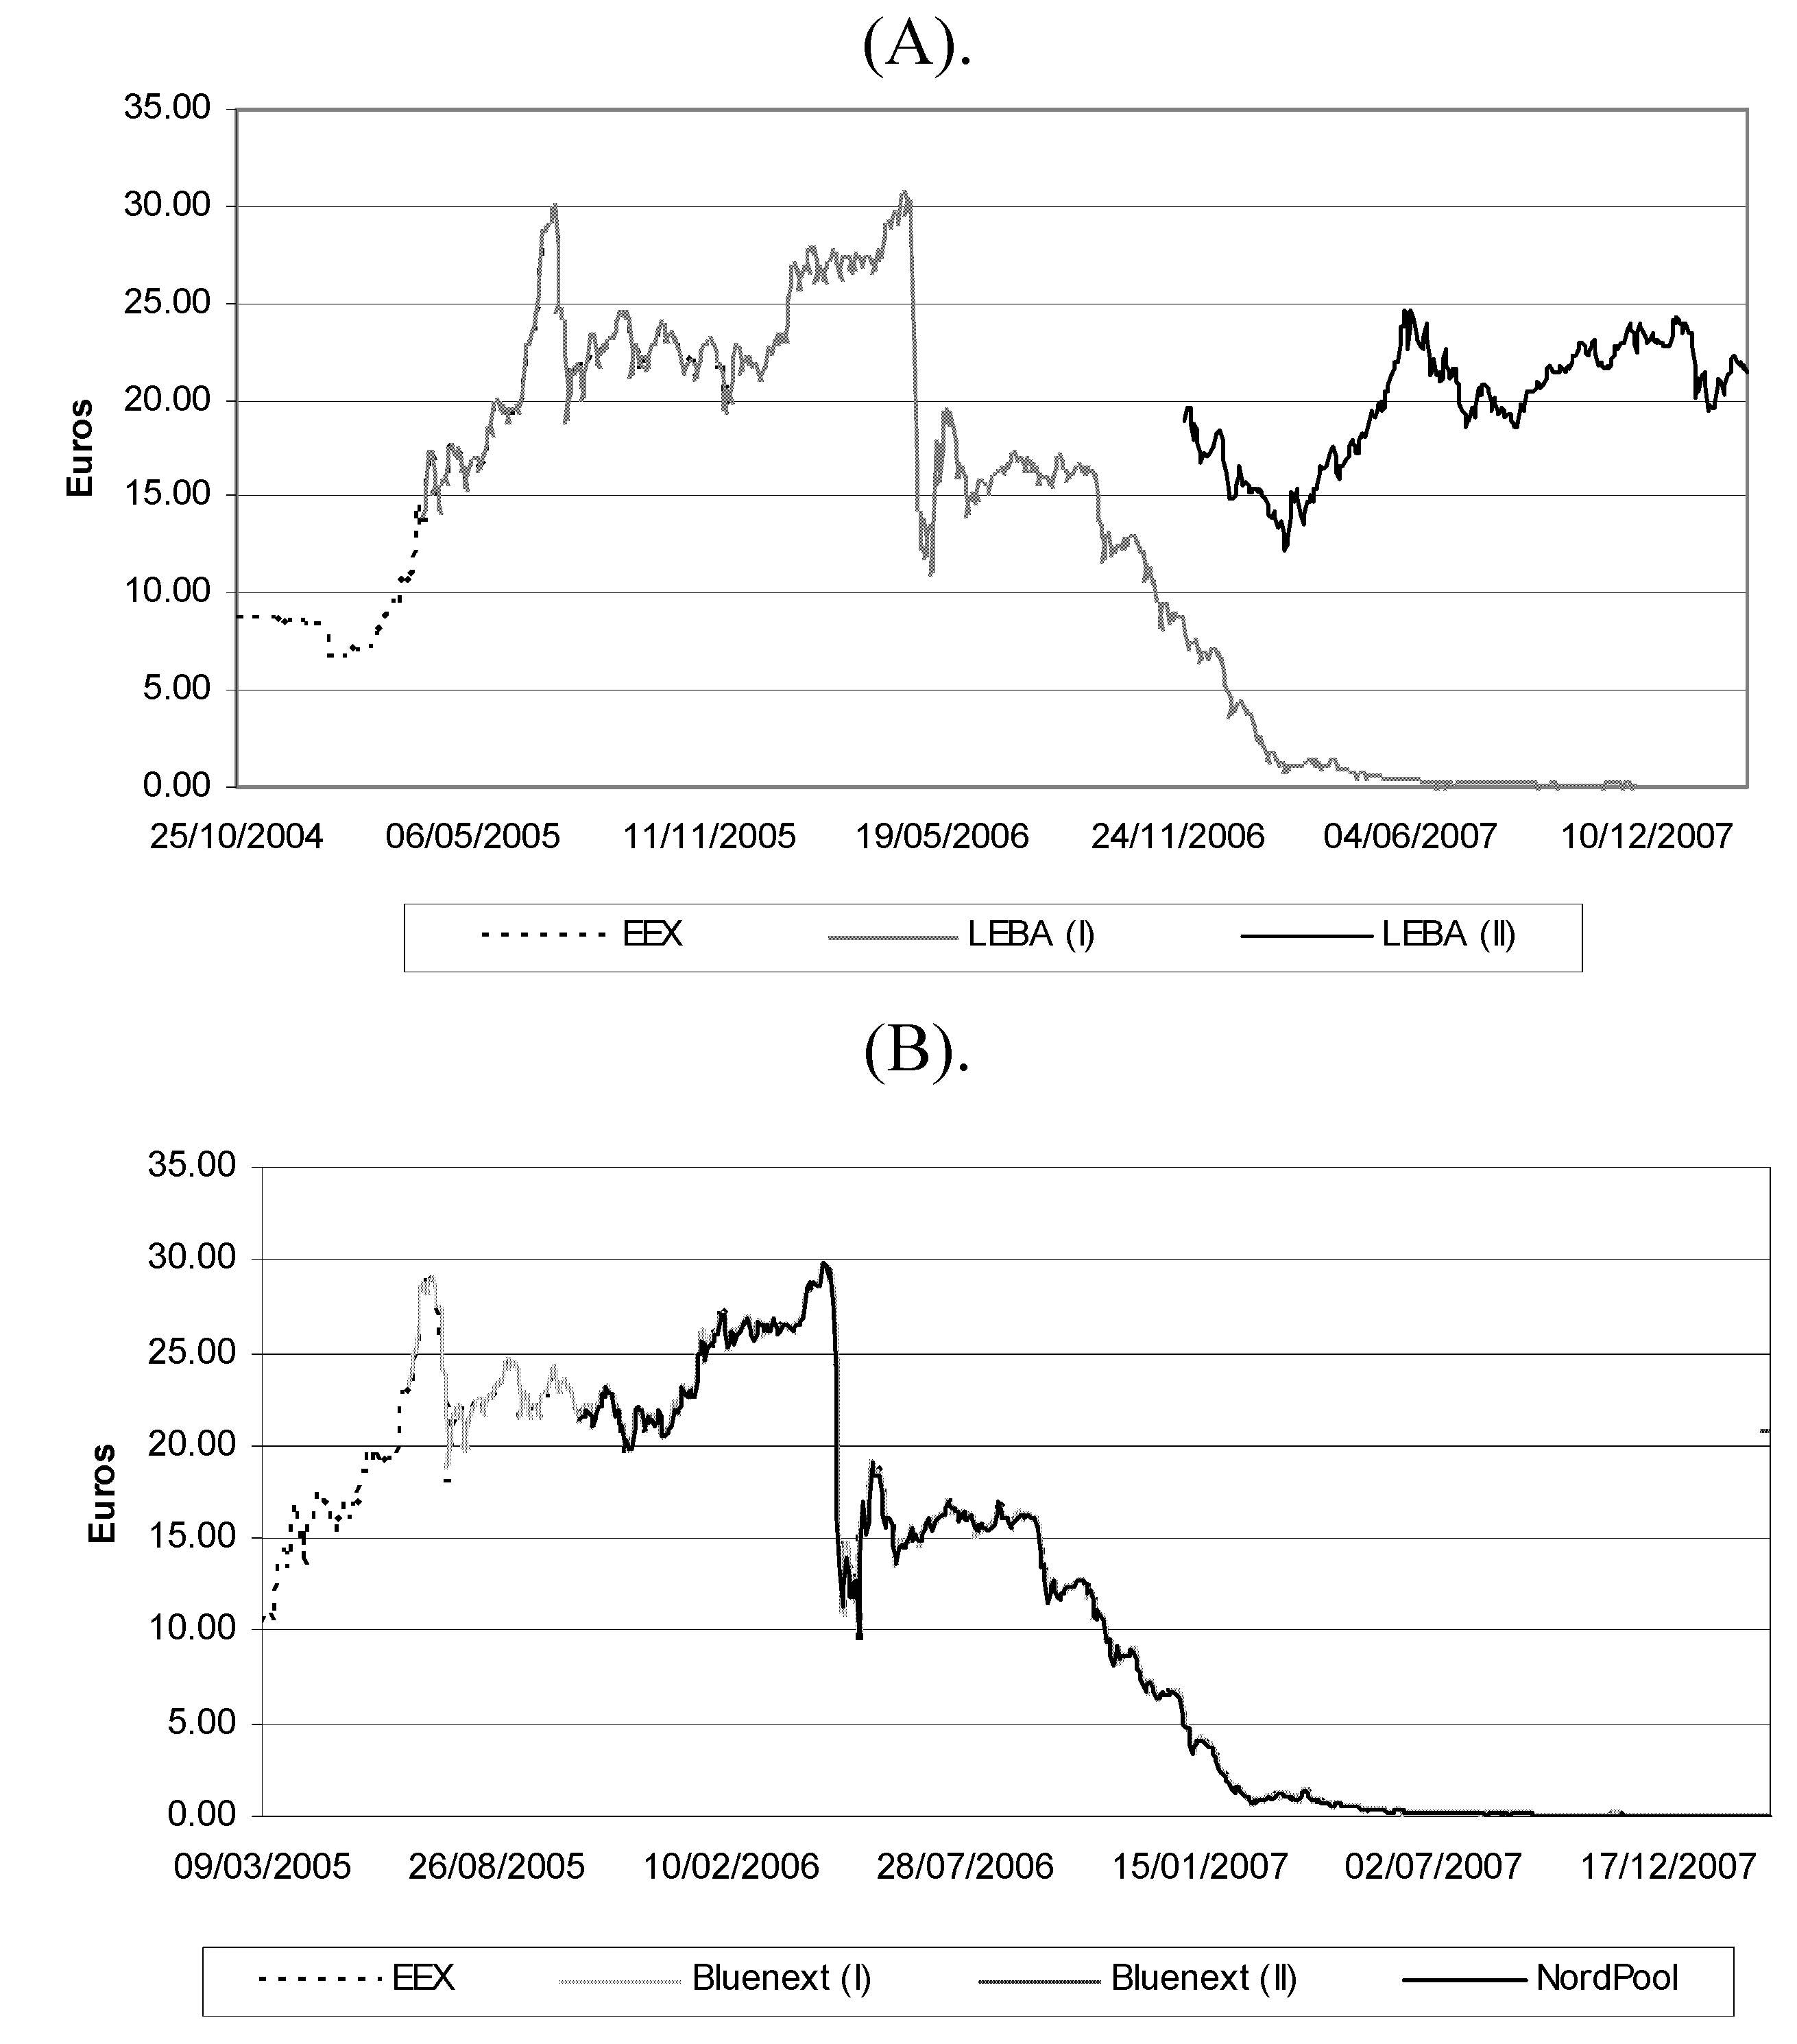
Figure 5.
Trends of Carbon Prices. (A). Trends of OTC Carbon Prices. (B). Trends of Spot Carbon Prices. (C). Trends of Futures Carbon Prices
Figure 5.
Trends of Carbon Prices. (A). Trends of OTC Carbon Prices. (B). Trends of Spot Carbon Prices. (C). Trends of Futures Carbon Prices
These Figures show the trends of the most relevant carbon prices in Europe. In
Figure 5-A the OTC forward indices are shown, in
Figure 5-B the spot prices are exhibited and in
Figure 5-C the futures prices are presented. EEX refers to the carbon index traded in European Energy Exchange, LEBA (I) and BlueNext (I) refer to Phase I prices and LEBA (II) and BlueNext (II) to Phase II prices. The futures contract corresponds to the December contract of the year indicated. Source: Markets web pages.
The LEBA (II) prices publication started 1st December 2006 at a level of 18.89 €/tCO2, and its evolution was similar to the Phase I OTC prices until 21st December 2007, when a bullish period started. Those prices reached a peak 4th June 2007 of 24.60 €/tCO2 while Phase I prices were at a level of 0.29 €/tCO2. Since then the OTC Phase II prices have moved in a range between 20 and 25 €/tCO2.
4.2. Trading in Organized Markets
The CO2 organized markets in Europe started with the EU ETS. The existence of CO2 organized markets enables market participants to get accurate price information and a fair price. The European Commission considers that the number of markets trading EUAs should be appropriate from the point of view of the agents participating in them. This means that each country can create its own market or that different platforms of trading can be organized. Therefore, although there is a unique European emissions market from the point of view of what is being traded, the trade can be done through different markets around Europe. In all those markets the underlying asset is the EUA (Phase I and Phase II) but the contracts that can be traded are slightly different.
There exist several organized market places in Europe where it is possible to trade EUAs. Specifically, EUAs can be traded in spot markets such as BlueNext (Paris), Energy Exchange of Austria (EXAA, Vienna), Nord Pool (Oslo), European Energy Exchange (EEX, Leipzig), and Gestore Mercato Elettrico (GME, Rome). It is important to note that BlueNext was a part of Powernext at the beginning of the EU ETS. The Powernext's Extraordinary General Assembly on 21st December 2007 ratified the purchase of Powernext's environmental activity, Powernext Carbon and Powernext Weather, by NYSE Euronext. These environmental activities are now housed within BlueNext an entity created with Caisse des Depots.
There is also a pan-European platform called Climex Alliance where it has been possible to trade spot contracts since July 2005. Furthermore, Nord Pool, European Climate Exchange (ECX, London) and EEX (jointly with Eurex since 5th December 2007, Eurex/EEX) have listed futures contracts with EUAs as the underlying commodity and BlueNext will launch the EUAs Future contract in a near future. Note that in all carbon futures markets, there are listed futures contracts for Phase I and Phase II of the EU ETS with the exception of BlueNext that will launch this type of contract once Phase I is already finished and, consequently, it will only list Phase II futures contracts.
In spite of the fact that the EU ETS started on 1st January 2005, the first trade in an organized market took place on 11th of February 2005 and it was a futures contract in Nord Pool. This is explained because the registries were not operational at that time, and thus the spot trading could not take place. The first spot contract was traded in EEX in March 2005. It is important to note that the only possibility for spot trading during Phase I of the EU ETS, that is, during the years 2005 to 2007, was Phase I EUAs and that it was impossible to trade spot Phase II EUAs. The explanation is that without the Phase II allowances delivered, no Phase II EUAs spot trade can take place, and the allowances can not be delivered before the Member States have been granted final approval of their installation-level allocation plans.
The European Commission fixed 28
th February 2008 as the deadline to allocate the allowances among the companies. However, as reported by Reuters (28
th February 2008) only 2 countries met the European commission deadline of 28
th February and were able to distribute their allowances: Austria and Denmark. Additionally, as pointed out by Tendance Carbon number 23 (March, 2008), only less than 3% of the total allowances were allocated by 28
th February 2008 [
28].
The first spot trade for Phase II in the EU ETS took place in BlueNext on 26th February 2008. Nord Pool will launch spot trading for Phase II EUAs on 15th April 2008 while Phase I EUAs will be interrupted in this market on 31st March 2008. Additionally, EEX will launch Phase II spot trading in June 2008 (Point Carbon 7th March 2008).
Finally, on 13
th October 2006, the ECX launched the first option contracts in an organized market [
29,
30,
31,
32,
33,
34,
35]. The alliance Eurex/EEX also launched a EUAs option contract on 14
th April 2005 [
36]. It is important to underline that all those markets are based on accounts transactions, and thus it is compulsory to have a registry in the specific market in order to participate in it. Remember that any natural or legal person is allowed to open an account in those registries.
4.2.a. Spot Contract Characteristics and Price Evolution
The spot contract that can be traded in the different markets is very similar. In all markets the delivery is physical (there is a transfer from one account to another) and takes place between 24 and 48 hours later. The unit of the contract is always one EUA but the size of the contract differs from one market to the next. In BlueNext and Nord Pool the minimum size of the contract is 1000 tonnes of CO
2-equivalent while for EXAA and EEX the minimum size of the spot contract is only one tonne ofCO
2-e. In GME the minimum size of the spot contract is 500 tonnes of CO
2-e. The minimum tick in all cases is €0.01. With the exception of the EXAA, where the trade is only once a week, in the other spot markets the trade is from Monday to Friday.
Table 3 collects the main characteristics of each spot market.
Table 3.
Spot Trading Rules Details in Organized Markets for Phase I EUAs.
Table 3.
Spot Trading Rules Details in Organized Markets for Phase I EUAs.
| BlueNext | Energy Exchange of Austria (EXAA) | Nord Pool | Gestore Mercato Elettrico (GME) | European Energy Exchange (EEX) |
|---|
| Commodity | 1 EUA | 1 EUA | 1 EUA | 1 EUA | 1 EUA |
| Country | France | Austria | Scandinavia | Italy | Germany |
| Market Launch | 24th April 2005 | 28th June 2005 | 24th October 2005 | 2nd April 2007 | 9th March 2005 |
| Trading Days | From Monday to Friday | Weekly trading | From Monday to Friday | From Monday to Friday | From Monday to Friday |
| Delivery | Physical | Physical | Physical | Physical | Physical |
| Minimum contract size | 1000 tCO2 | 1 tCO2 | 1000 tCO2 | 500 tCO2 | 1 tCO2 |
| Tick minimum | €0.01 | €0.01 | €0.01 | €0.01 | €0.01 |
| Registry | Seringas | ECRA (Emission Certificate Registry Austria ) | NEA (Dutch Emission Authority) | Sina Group | DEHSt (German Emissions Trading Authority) |
| Registry Management | Caisse des dépôts et consignations | ECRA (Emission Certificate Registry Austria ) | Dutch Emission Authority | APART (Italian Environmental Authority) | DEHSt (German Emissions Trading Authority) |
| Clearing | LCH Clearnet SA | APCS (Austrian Power Clearing and Settlement AG) | Nord Pool Clearing ASA | Gestore Mercato Elettrico (GME) S.p.a. | Several Banks |
Additionally, we present in
Figure 5-B the evolution of spot prices. We can appreciate the evolution of all spot price series has been really similar to the evolution of the Phase I OTC forward prices. This means that independently of the market used, the prices for the Phase I of the EU ETS had been homogenous all around Europe. In our sample period, there are only four days of trading spot Phase II, and the levels are similar to those of Phase II OTC forward prices.
4.2.b. Futures Contracts Characteristics and Prices Evolution
Futures contracts that can be traded in the different European markets are absolutely the same in terms of contract size (1,000 tonnes CO2-e), minimum tick (€0.01), and trading days (from Monday to Friday). However, the ECX offers much more variety for expiry contracts dates. Eurex/EEX offers only December futures contracts for each of the EU ETS years (Phase I futures contracts are those of December 2005, 2006 and 2007 and Phase II futures contracts are those of December 2008-2012). Nord Pool offers December and March contracts for both Phases, while ECX proposes contracts with monthly expiry dates from September 2006 to March 2008.
Table 4.
Futures Trading Rules Details in Organized Markets.
Table 4.
Futures Trading Rules Details in Organized Markets.
| Nord Pool | European Climate Exchange (ECX) | European Energy Exchange (EEX) / Eurex | BlueNext | The Green Exchange |
|---|
| Commodity | 1 EUA | 1 EUA | 1 EUA | 1 EUA | 1 EUA |
| Country | Scandinavia | United Kingdom | Germany | France | USA |
| Market Launch | 11th February 2005 | 22nd April 2005 | 4th October 2005 | 24th April 2008 | 17th March 2008 |
| Trading Days | From Monday to Friday | From Monday to Friday | From Monday to Friday | From Monday to Friday | From 6:00 pm Sundays through 5:15 pm Fridays, Eastern Time |
| Contract Expiry | December 2005. December and March from 2006 to 2012 | Quarterly contracts for 2005 and 2006. From September 2006 to March 2008 monthly contracts. December contracts from 2008 to 2012. | December contracts from 2006 to 2012 | December contracts from 2008 to 2012 | Quarterly contracts from December 2008 to December 2010 December contracts from 2011 to 2012 |
| Delivery | Physical | Physical | Physical | Physical | Physical |
| Minimum contract size | 1000 tCO2 | 1000 tCO2 | 1000 tCO2 | 1000 tCO2 | 1000 tCO2 |
| Tick minimum | €0.01 | €0.01 | €0.01 | €0.01 | €0.01 |
| Registry | NEA (Dutch Emission Authority) | Environment Agency | DEHSt (German Emissions Trading Authority) | Seringas | UK Emissions Trading Registry |
| Registry Management | Dutch Emission Authority | Environment Agency | DEHSt (German Emissions Trading Authority) | Caisse des dépôts et consignations | Environment Agency |
| Clearing | Nord Pool Clearing ASA | London Clearing House (LCH.Clearnet) | Eurex Clearing AG and the European Commodity Clearing AG (ECC). | LCH Clearnet SA | NYMEX ClearPort |
Additionally, block trades, Exchange for Physical (EFP) and Exchange for Swaps are available for ECX. The block trades allow the members to bilaterally negotiate ICE futures contracts without first revealing the order to the market so long as the order meets or exceeds a minimum volume threshold (50 contracts in the case of ICE ECX CFI futures or options). The EFP is used to mitigate the OTC risk exposures by registering the OTC positions with the ICE futures for clearing by the London Clearing House Clearnet (LCH.Clearnet). The counterparties agree that they wish to transfer an OTC position with an on-exchange futures position. The EFP position in the ECX CFI futures contract created is equivalent (in terms of volume, size and sense) to the OTC position. Note that the underlying asset in an EFP is a physical contract. The EFP is used by market participants to clear OTC forward contracts. Finally, the EFS contract works in a similar way to the EFP. The difference is that in this case the underlying asset is a financial contract. This mechanism is generally utilised to clear OTC options and swaps contracts. In
Table 4, the main characteristics of the futures markets in Europe are summarized.
Additionally, in
Figure 5-C, the most representative futures prices, both for Phase I and Phase II, are presented. Again we find that Phase I price behaviour is similar to the spot and OTC Phase I prices and Phase II is analogous to the spot and OTC Phase II prices. As we can appreciate in this
Figure 5-C, futures prices for Phase II behave in a similar way to futures prices for Phase I until 24
th April 2006. Around this date the Phase I - Phase II prices spread started to increase. The market decided that the fundamentals of Phase I prices are not the same as of Phase II and consequently the prices evolve in a different manner. As commented before, Phase I prices decreased drastically around this date. In contrast Phase II prices decreased but did not exceed 18.5 €/tCO
2 until 3
rd March 2006. Since then, Phase II futures prices moved in the range of 15-20 until 14
th May 2007 when prices broke the cap and moved into the 20-25 range until the end of the sample period.
4.2.c. Correlation Analysis among Markets
As we have observed in all figures of
Figure 5, there is a huge similarity in the trends of Phase I OTC forward prices, spot and futures prices. The similar trend between figures can also be confirmed with a cross correlation analysis in prices (Panel A of
Table 5) and returns (Panel B of
Table 5). It is important to note that the returns have been defined as
rt=ln(Pt/Pt-1), where
Pt is the price series at time
t. Furthermore, as trading in the EXAA market only takes place once a week, it has been eliminated from the correlations of prices and returns as the number of observations is very small. Climex Aliance and GME have also not been included since not enough data is available.
All the contemporary correlation coefficients are statistically significant at the 5% level. The positive and significant correlation coefficients indicate that all markets are strongly correlated and all of them incorporate the information in a very similar way. We find the same results when comparing the spot and the Phase I future prices that continued being traded after 30th November 2005. Related to Phase II prices, the correlation is also high even if it is smaller than in the case of Phase I prices. Note that the few negative correlation coefficients in prices and returns correspond to the correlation of contracts of different Phases. The correlations of BlueNext (II) with the other markets are not statistically significant. The explanation is that we only have five prices and four returns of BlueNext (II) and thus, the results are not representative.
Table 5.
Cross correlation analysis between European markets.
Panel A: Price Correlation.
Panel A: Price Correlation.
| EEX | Bluenext (I) | Bluenext (II) | NordPool | Carbon Index | LEBA (I) | LEBA (II) | EEX 2007 | EEX 2008 | NordPool 2007 | NordPool 2008 | ECX 2007 |
| Bluenext (I) | 0.9998 | 1.0000 | | | | | | | | | | |
| Bluenext (II) | -0.2027 | NA | 1.0000 | | | | | | | | | |
| NordPool | 0.9998 | 0.9999 | NA | 1.0000 | | | | | | | | |
| Carbon Index | 0.9971 | 0.9914 | NA | 0.9630 | 1.0000 | | | | | | | |
| LEBA (I) | 0.9995 | 0.9996 | NA | 0.9997 | 0.9978 | 1.0000 | | | | | | |
| LEBA (II) | -0.4781 | -0.4789 | 0.3675 | -0.4775 | NA | -0.4262 | 1.0000 | | | | | |
| EEX 2007 | 0.9994 | 0.9995 | NA | 0.9996 | 0.9701 | 0.9996 | -0.4382 | 1.0000 | | | | |
| EEX 2008 | 0.3542 | 0.3533 | NA | 0.3374 | 0.8310 | 0.4671 | 0.9963 | 0.4346 | 1.0000 | | | |
| NordPool 2007 | 0.9990 | 0.9993 | NA | 0.9996 | 0.9977 | 0.9995 | -0.4426 | 0.9999 | 0.4238 | 1.0000 | | |
| NordPool 2008 | 0.3438 | 0.3403 | 0.4272 | 0.3432 | NA | 0.4664 | 0.9959 | 0.4346 | 0.9979 | 0.4282 | 1.0000 | |
| ECX 2007 | 0.9992 | 0.9991 | NA | 0.9993 | 0.9888 | 0.9994 | -0.4536 | 0.9997 | 0.4057 | 0.9997 | 0.4031 | 1.0000 |
| ECX 2008 | 0.3981 | 0.4142 | -0.4479 | 0.3181 | 0.9201 | 0.5056 | 0.9943 | 0.4302 | 0.9967 | 0.4682 | 0.9955 | 0.4519 |
Panel B. Returns Correlation.
Panel B. Returns Correlation.
| EEX | Bluenext (I) | Bluenext (II) | NordPool | Carbon Index | LEBA (I) | LEBA (II) | EEX 2007 | EEX 2008 | NordPool 2007 | NordPool 2008 | ECX 2007 |
| Bluenext (I) | 0.4253 | 1.0000 | | | | | | | | | | |
| Bluenext (II) | -0.2033 | NA | 1.0000 | | | | | | | | | |
| NordPool | 0.4047 | 0.5870 | NA | 1.0000 | | | | | | | | |
| Carbon Index | 0.7831 | 0.7174 | NA | 0.6156 | 1.0000 | | | | | | | |
| LEBA (I) | 0.4991 | 0.6948 | NA | 0.6512 | 0.8988 | 1.0000 | | | | | | |
| LEBA (II) | 0.0197 | 0.0885 | -0.4341 | 0.1738 | NA | 0.2000 | 1.0000 | | | | | |
| EEX 2007 | 0.7256 | 0.7032 | NA | 0.6613 | 0.6323 | 0.7198 | 0.2413 | 1.0000 | | | | |
| EEX 2008 | 0.2550 | 0.3356 | NA | 0.3465 | 0.3628 | 0.3603 | 0.8029 | 0.5067 | 1.0000 | | | |
| NordPool 2007 | 0.5864 | 0.5998 | NA | 0.7807 | 0.7990 | 0.6666 | 0.1796 | 0.7280 | 0.3821 | 1.0000 | | |
| NordPool 2008 | 0.2344 | 0.3257 | 0.1496 | 0.3456 | NA | 0.3707 | 0.8197 | 0.4992 | 0.9300 | 0.3846 | 1.0000 | |
| ECX 2007 | 0.0639 | 0.1515 | NA | 0.3093 | 0.6880 | 0.3932 | 0.1658 | 0.7388 | 0.2836 | 0.3462 | 0.2720 | 1.0000 |
| ECX 2008 | 0.2292 | 0.2865 | -0.8883 | 0.2982 | 0.6175 | 0.3267 | 0.6573 | 0.4349 | 0.8412 | 0.3387 | 0.7886 | 0.3283 |
4.2.d. Volume Analysis
In terms of volume, measured in tonnes of CO
2, the most important market of spot contracts is BlueNext (73% of total spot volume) and the most important market for future contracts is ECX (96%).
Figure 6 shows the total volume of the EU ETS and the volumes of futures and spot markets.
Figure 6.
Traded Volume in EU ETS.
Figure 6.
Traded Volume in EU ETS.
This Figure shows volumes traded in the EU ETS. In the first picture we distinguish between spot, futures and OTC trading, and then we focus on the spot and futures markets. The spot and futures markets by phases and by markets are presented. All volumes are cumulated volumes from the first trade in each market to the end of the trading of the contract. The volumes are expressed in tonnes of CO2. Source: Own elaboration from market web pages.
Additionally, as we can appreciate in
Figure 6, the volume of EUAs traded with futures contracts is much higher than those traded in the spot market. Moreover, the Phase II contract has become the most traded one, representing 70% of the total futures traded. Note that the OTC volume considered in this picture represents only the trades done through the LEBA members.
4.2.e. Options Trading
In addition to spot and futures contracts, since 13
th October 2006, it has also been possible to trade options on EUAs futures in the ECX. The trading is done from Monday to Friday, the delivery is physical and the minimum contract size is 1000 tCO
2. There are 55 strike prices automatically listed for each contract month covering the price range from €1 to €55. The contract months are the last contract of each quarter (March, June, September, and December) from 2008 to 2012. Additionally, the Exchange may add one or more strike prices nearest to the last price listed as necessary. Note that the strike price intervals are €1. The options are exercised into ICE Futures ECX CFI EUAs futures contracts and are European-style exercise. In
Table 6, the main characteristics of the options trading in ECX are summarized.
Table 6.
Options Trading Rules Details in Organized Markets.
Table 6.
Options Trading Rules Details in Organized Markets.
| European Climate Exchange (ECX) | The Green Exchange |
|---|
| Commodity | EUA | EUA |
| Country | United Kingdom | USA |
| Market Launch | 13th October 2006 | 17th March 2008 |
| Trading Days | From Monday to Friday | From 6:00 pm Sundays through 5:15 pm Fridays, Eastern Time |
| Contract Expiry | Front two contracts plus next six December contract months. Currently Jan08, Feb08, December contracts from 2008-2012 are listed. | Quarterly contracts from December from 2008 to December 2010
December contracts from 2011 to 2012 |
| Delivery | Physical | Physical |
| Underlying | Exercised into ICE Futures ECX CFI EUAs futures contracts. | 1 EUAs futures contract |
| Minimum contract size | 1000 tCO2 | 1000 tCO2 |
| Strike price increments | Fifty-five strike prices are automatically listed for each contract month covering the price range from €1- €55.
The Exchange may add one or more strike prices nearest to the last price listed as necessary.
Strike price intervals are €1. | 10 strike prices in increments of €0.50 above and below the at-the-money strike price. |
| Tick minimum | €0.01 | €0.01 |
| Option Premium | Premiums are paid at the time of the transaction | Premiums are paid at the time of the transaction |
| Nature of exercise | European-style exercise | European-style exercise |
| Registry | Environment Agency | UK Emissions Trading Registry or at the Dutch CO2 Emissions Trading Registry |
| Registry Management | Environment Agency | Environment Agency
Dutch Emission Authority |
| Clearing | London Clearing House (LCH.Clearnet) | NYMEX ClearPort |
5. Linking with the rest of the international carbon market
As we have seen in the previous sections, following the ratification of the Kyoto Protocol, it is possible for European countries to use, together with the EUAs, the CERs and the ERUs to comply with its emission reductions obligations for Phase II of the EU ETS. Following the linking Directive (2004/101/EC), in order to use those units, the Member States have to give their permission through the NAPs. If permission is given, the Member States will also have to set a limit on how many CERs and EURs can be surrendered as a percentage of allocation, or in global terms at installation or at the national level. In
Table 2 the limit allowed for each European Member State is presented in terms of percentage of total emissions for 2008-2012.
The units CERs and ERUs may be obtained both by the realization of the project for emissions reductions (JI and CDM, respectively), or through the secondary market. Following Elabed and Leguet (2008) [
37], more than 3,500 CDM projects and around 130 JI projects were being developed in August 2008. Those projects may potentially generate around 2.6 billion credits from now to 2012, mostly in developing countries. Thus, the importance of the agents that participate in the elaboration of projects via CDM or JI is increasing due principally to three reasons: (i) they are potential sellers of CERs and ERUs, respectively; (ii) they increase the supply of credits with important consequences on prices; (iii) they will facilitate the equilibrium in Phase II of the EU ETS between credits supply and demand.
As in the case of the EUAs, it is also possible to trade CERs via OTC trades or in organized markets. There are no OTC indexes, as in the case of EUAs, that reflect CERs and ERUs OTC forward prices, and, consequently, it is not possible to reflect the behavior of those prices. Nevertheless, it is possible to trade CERs in organized markets. Nord Pool has offered future contracts on CERs since June 2007, and ECX since 14
th March 2008.
Figure 7 presents the evolution of the CERs futures prices at Nord Pool.
Figure 7.
Certificate Emission Reduction Futures Prices and Volume in Nord Pool.
Figure 7.
Certificate Emission Reduction Futures Prices and Volume in Nord Pool.
This Figure shows the evolution of the CERs prices and the evolution of the Phase II prices since the beginning of the trading of CERs futures contracts in Nord Pool. All CERs prices correspond to CERs futures contracts traded in Nord Pool. All of them expire in December and the number represents the year of the Phase II of the EU ETS. ECX 2008 refers to the futures contract on EUAs traded in the ECX. The total CERs volume traded in Nord Pool expressed in tonnes traded is also presented. Source: Nord Pool and ECX web page.
As we can appreciate in
Figure 7, the evolution of the different CERs futures contracts in Nord Pool has been quite similar. In addition, they behave in a similar manner to the December 2008 EUAs future contract traded at ECX. This is also supported by a correlation analysis among those variables. The correlations both in prices and returns are statistically significant and positive. In all cases, they are higher than 50%. However, note that even if EUAs are exchangeable with CERs and ERUs in terms of compliance, and we might think they are a perfect substitution, there are important differences between EUAs and the units issued from projects. First of all, there is a source of uncertainty related to the units the project will lead to. Secondly, the percentage of units each country will allow to use in order to achieve the Kyoto target as a percentage of the total units assigned will not be made public until all Phase II NAPs have been accepted by the European Commission. Finally, it will not be possible to transfer these types of units until the ITL is working perfectly and all countries are linked to it through the United Nations framework. All those reasons explain why the CERs futures prices at Nord Pool are some euros cheaper than the EUAs traded at ECX. While EUAs have been traded since June 2007 in a range of €18 to €24, the CERs have been negotiated in a range of €14 to €19. However, all those risks are becoming less uncertain and we should expect that in order to avoid arbitrage opportunities, the difference should start to narrow.
The CERs market is in an period of expansion, but the volumes in organized trading are still small (see
Figure 7). In addition to the possibility to negotiate in Nord Pool and ECX futures contracts for CERs, Bluenext will launch in the near future spot and futures trading of CERs issued by the Executive Committee of CDM Board for projects selected on the advice of BlueNext’s Expert Committee, and ECX will launch an option contract on CERs. Additionally, from 26
th March 2008, it will be possible to trade futures on CERs on the Eurex/EEX [
38].
There are several expiry dates for the CERs futures contracts that vary among markets. In the case of Nord Pool, there are December and March futures contract from December 2005 until December 2012, in the case of ECX, the expiry of the contracts is in the last month of each quarter (March, June, September, and December), and in the case of BlueNext, it is only possible to trade December futures contracts from 2008 to 2012. In all cases the contracts are daily traded, the trade is done in lots of 1000 CERs, and the minimum tick is €0.01.
In the ECX it is also possible to trade CER options on futures contracts. This trade is also daily, it is done in lots of 1000 CERs, and the minimum tick is €0.01. The options are exercised into ICE Futures ECX CFI CERs futures contracts and have European-style exercise. Additionally, 55 strike prices are automatically listed for each contract (there are contracts for each of the final months of the quarter) covering the price range from €1 to €55 (note that the strike price intervals are €1). Finally, the exchange may add one or more strike prices nearest to the last price listed if necessary.
Other than in Europe it is also possible to trade EUAs and CERs. The Green Exchange has offered, since 17th March 2008, the possibility to trade futures and options on EUAs and CERs. Both the EUAs futures contract and CERs futures contract are physically delivered at the UK Emissions Trading Registry. The contract size is 1000 metric tonnes of CO2 and the minimum price fluctuation is €0.01 per unit. In the case of the EUAs options contract, they are European-style options that will exercise into the underlying EUAs futures contract. It will expire three business days prior to the EUAs futures contract and will have 10 strike prices in increments of €0.50 above and below the at-the-money strike price. The EUAs and CERs options will be traded on the NYMEX trading floor and cleared on NYMEX ClearPort. Finally, the Chicago Climate Exchange has organized an auction of CERs that have been issued by the UNFCCC from a wind energy farm project in India. Additionally, the Multi Commodity Exchange of India has recently launched contracts on carbon credits.
It is important to emphasize that no Kyoto transaction could take place without the ITL as no European Union transaction can take place without the CITL. That means that a CER could not be formally issued or forwarded to a registry without the ITL. For this reason, CERs trades started to be done through futures or forward contracts were subject to the effective link between European registers and the ITL. The trading of the Kyoto Protocol CERs and ERUs was done at a discount due to the possibility that the ITL did not become operational before the end of the Phase I of the EU ETS.
In addition to the units issued from the different type of projects, it is also possible, under the Kyoto Protocol emissions trading flexibility mechanism, to trade the emissions permits from other emissions trading schemes. In addition to the European Union, as we have seen, launching the European Union Emission Trading Scheme, other countries have also launched their own emission trading schemes. For example, the USA has launched the Regional Greenhouse Gas Initiative (the first RGGI trade was announced on 14
th February 2008), Japan also has its pilot project emission trading scheme, and this is also the case for South Korea, New Zealand, Switzerland, and Australia. For further information on the first RGGI steps, see [
39]. Norway also has an Emission Trading Scheme that is the most comparable to the EU ETS, and Canada and the European Union have agreed to make their CO
2 emissions trading schemes compatible. The objective is that all those schemes will be linked to the ITL in order to have a global CO
2 market.
However, it is not easy to link the different systems adopted by all those countries. First of all, the systems have, in most cases, characteristics that are not comparable and secondly, in order to completely link the different markets it is compulsory that each partner accept the allowances issued by any program linked. Even if it is not easy, efforts are being made in this direction. A significant example is that the European Commission has agreed with countries in the European Economic Area (Norway, Iceland and Liechtenstein) on linking their respective emissions trading schemes, making the first international link between emissions trading schemes. See Kruger et al. (2007) [
19] for a discussion of linking issues.
Almost all parties have now completed the initialization of their registry connections with the ITL. This process verifies that they meet all technical requirements prior to the beginning of the operations with the ITL. Only the European countries, Japan, New Zealand and Switzerland have completed their initialization process [
40].
6. Summary and concluding remarks
In this paper we have studied several aspects of CO2 trading worldwide. First, we have presented the Kyoto Protocol. We have analysed the state of commitment of the different countries that have signed the Kyoto Protocol and we have presented the flexibility mechanisms that allow for easier compliance. Among those flexibility mechanisms we find emissions trading, the principal subject of this paper.
Even if there have been many experiences with emissions trading, in this paper we focus on the EU ETS. The elaboration of the National Allocation Plans procedure, the distribution among European countries of the allowances, and the verification of real emissions obligations, etc… are explained in detail. Following this, we have presented the existing spot, forward, futures and options markets of EUAs. In terms of prices we have illustrated that Phase I prices, independently of the market where they are negotiated, follow the same evolution and are on the same levels. This is also the case for Phase II prices.
The linking possibilities of the EU ETS with the United Nation carbon markets are also analysed in this paper. We emphasize the importance of the ITL and the role of the developing and economies-in-transition countries on mitigating the impact of climate change through the elaboration of reduction emissions projects that lead to CERs and ERUs, respectively.
Finally, we would like to underline that there are a wide variety of participants in the carbon markets. We firstly find the industrial agents that are directly concerned with CO2 emissions reductions, secondly the brokers and, finally, the financial institutions. Additionally, the importance of the agents that participate in the elaboration of the projects via CDM and JI is increasing as they are potential sellers of CERs and ERUs.
As a global conclusion to this paper, we want to highlight some aspects: (i) the EU ETS has succeeded in imposing a price on carbon emissions, which was one of its most important objectives; (ii) trading in CO2 spot, forward and futures markets is increasing at high rates; (iii) options contracts have been recently listed and the creation of these types of contracts in organized markets is considered by traders as a sign that the futures market is mature enough and will contribute to creating more liquidity in the futures markets; (iv) the secondary market of CERs is the segment with the highest development and, following the present estimations, it will contribute to creating an equilibrium between the offer and the demand in the carbon markets.


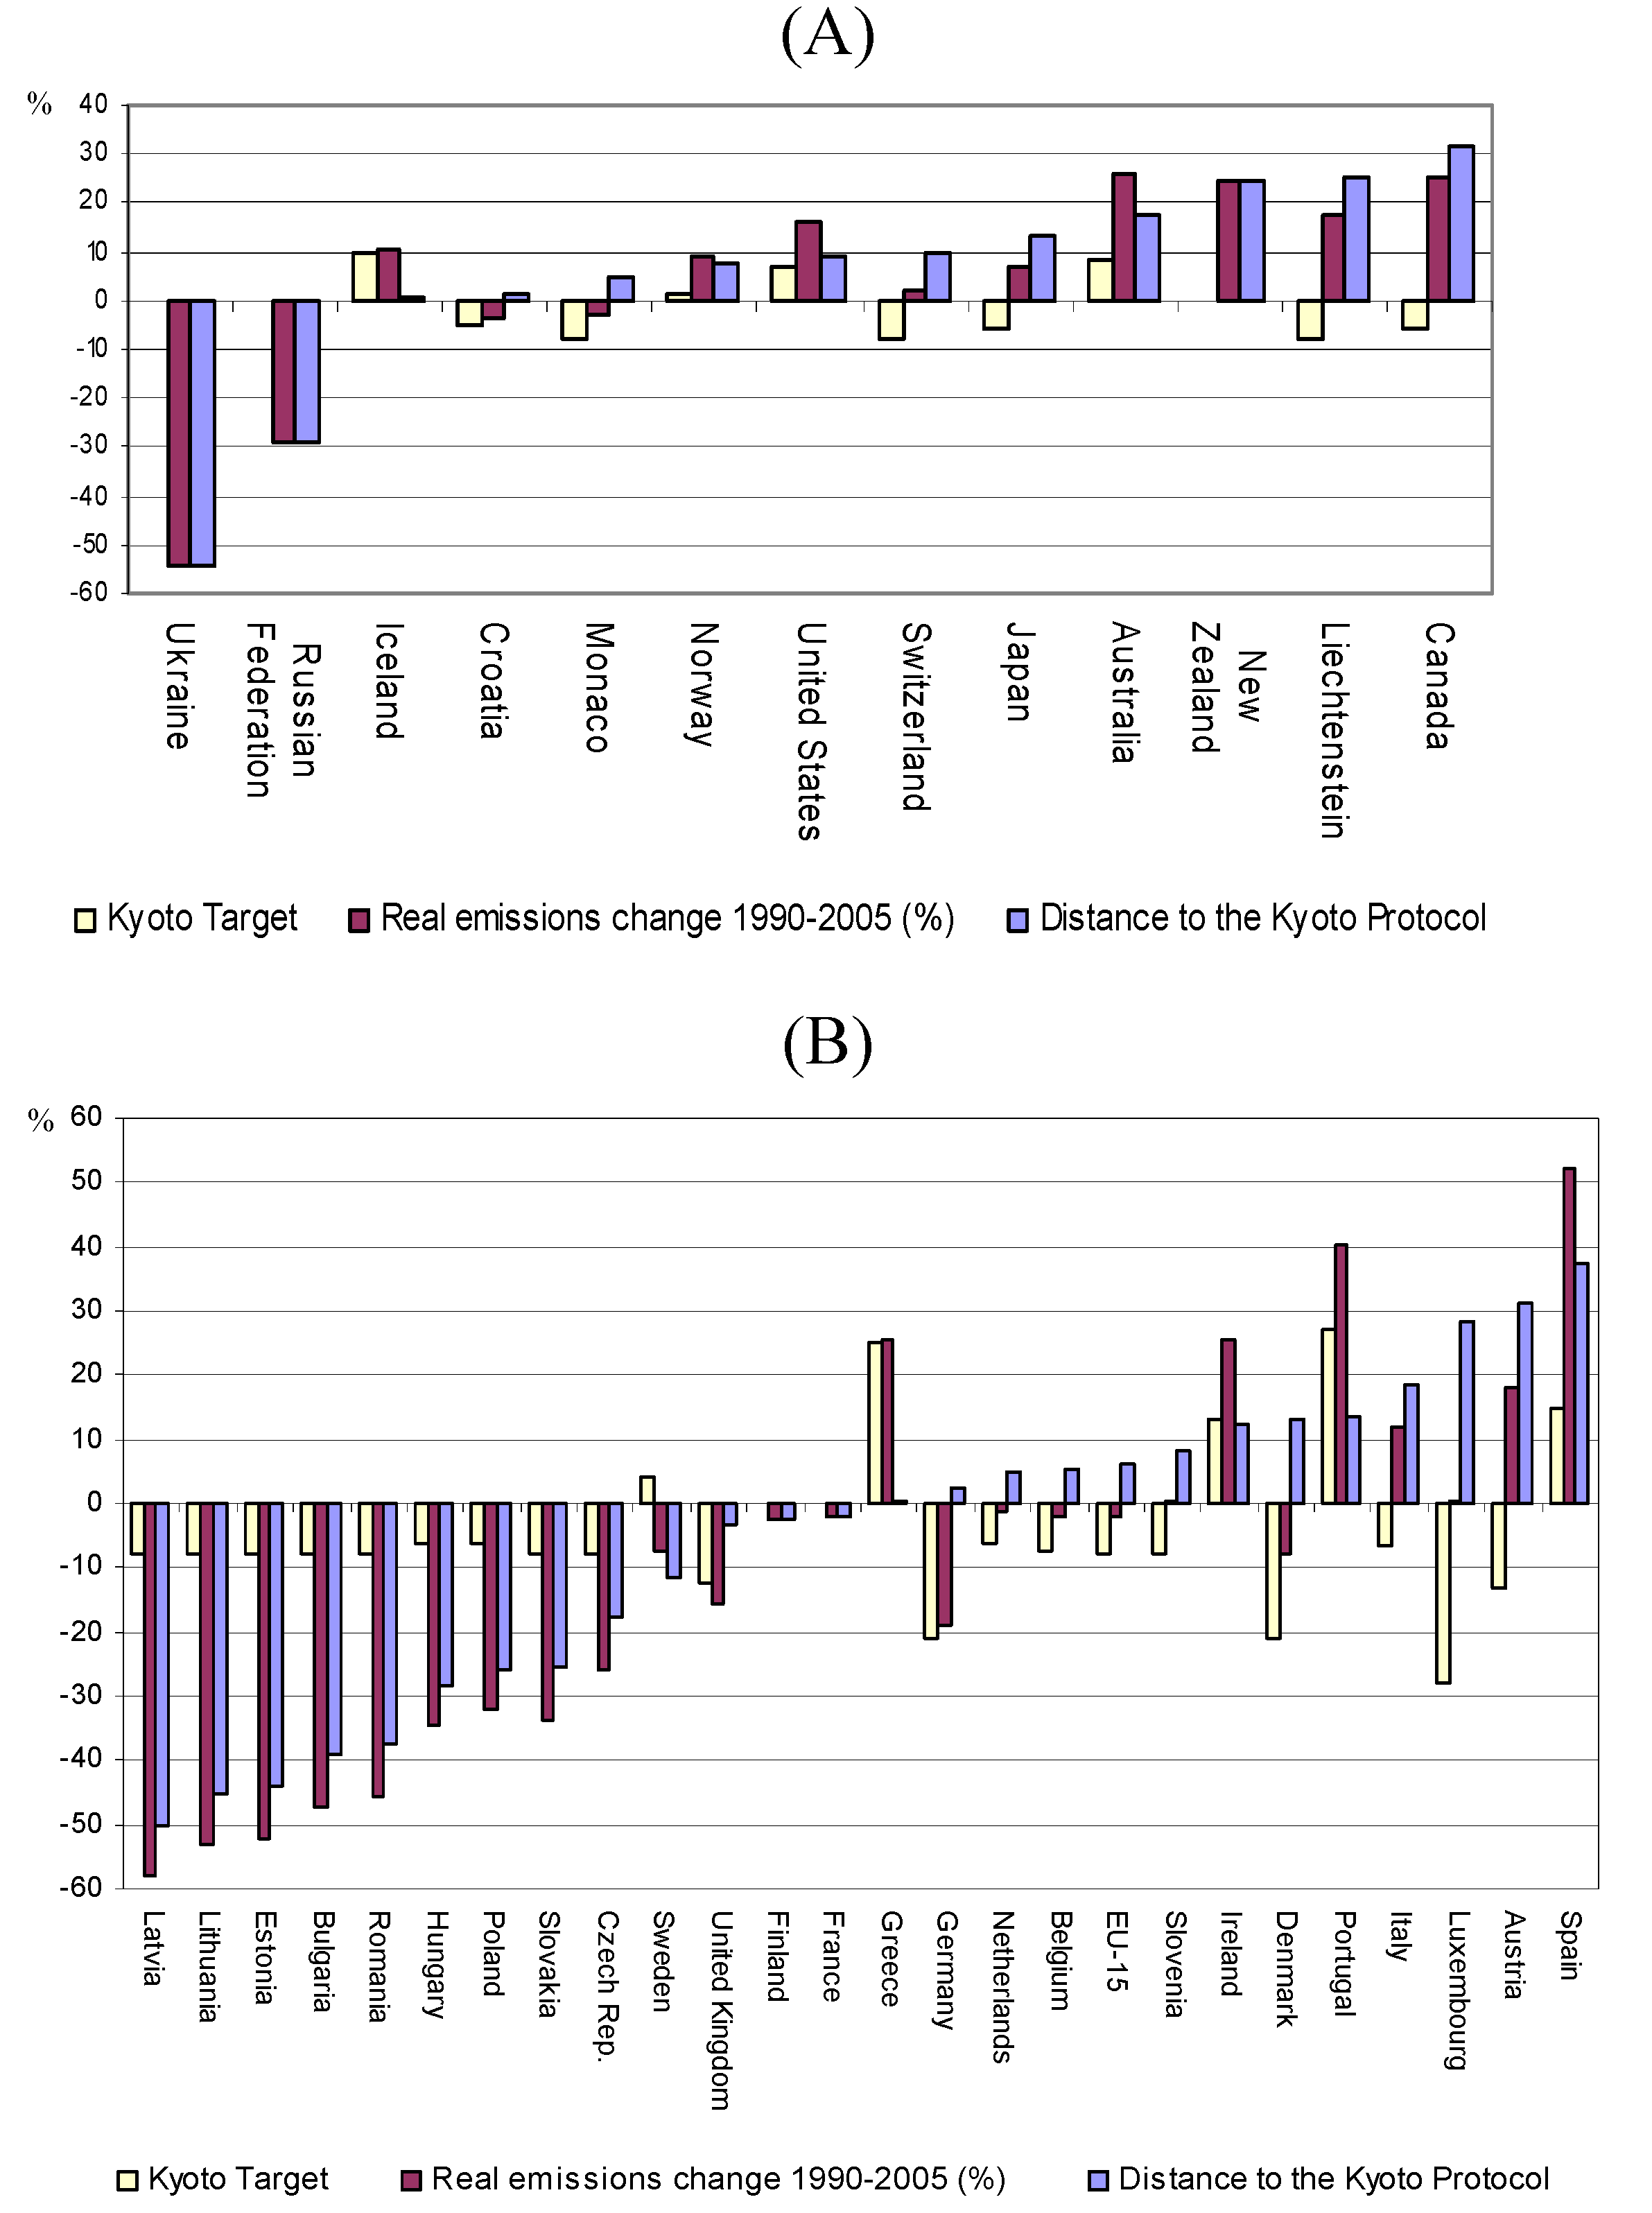
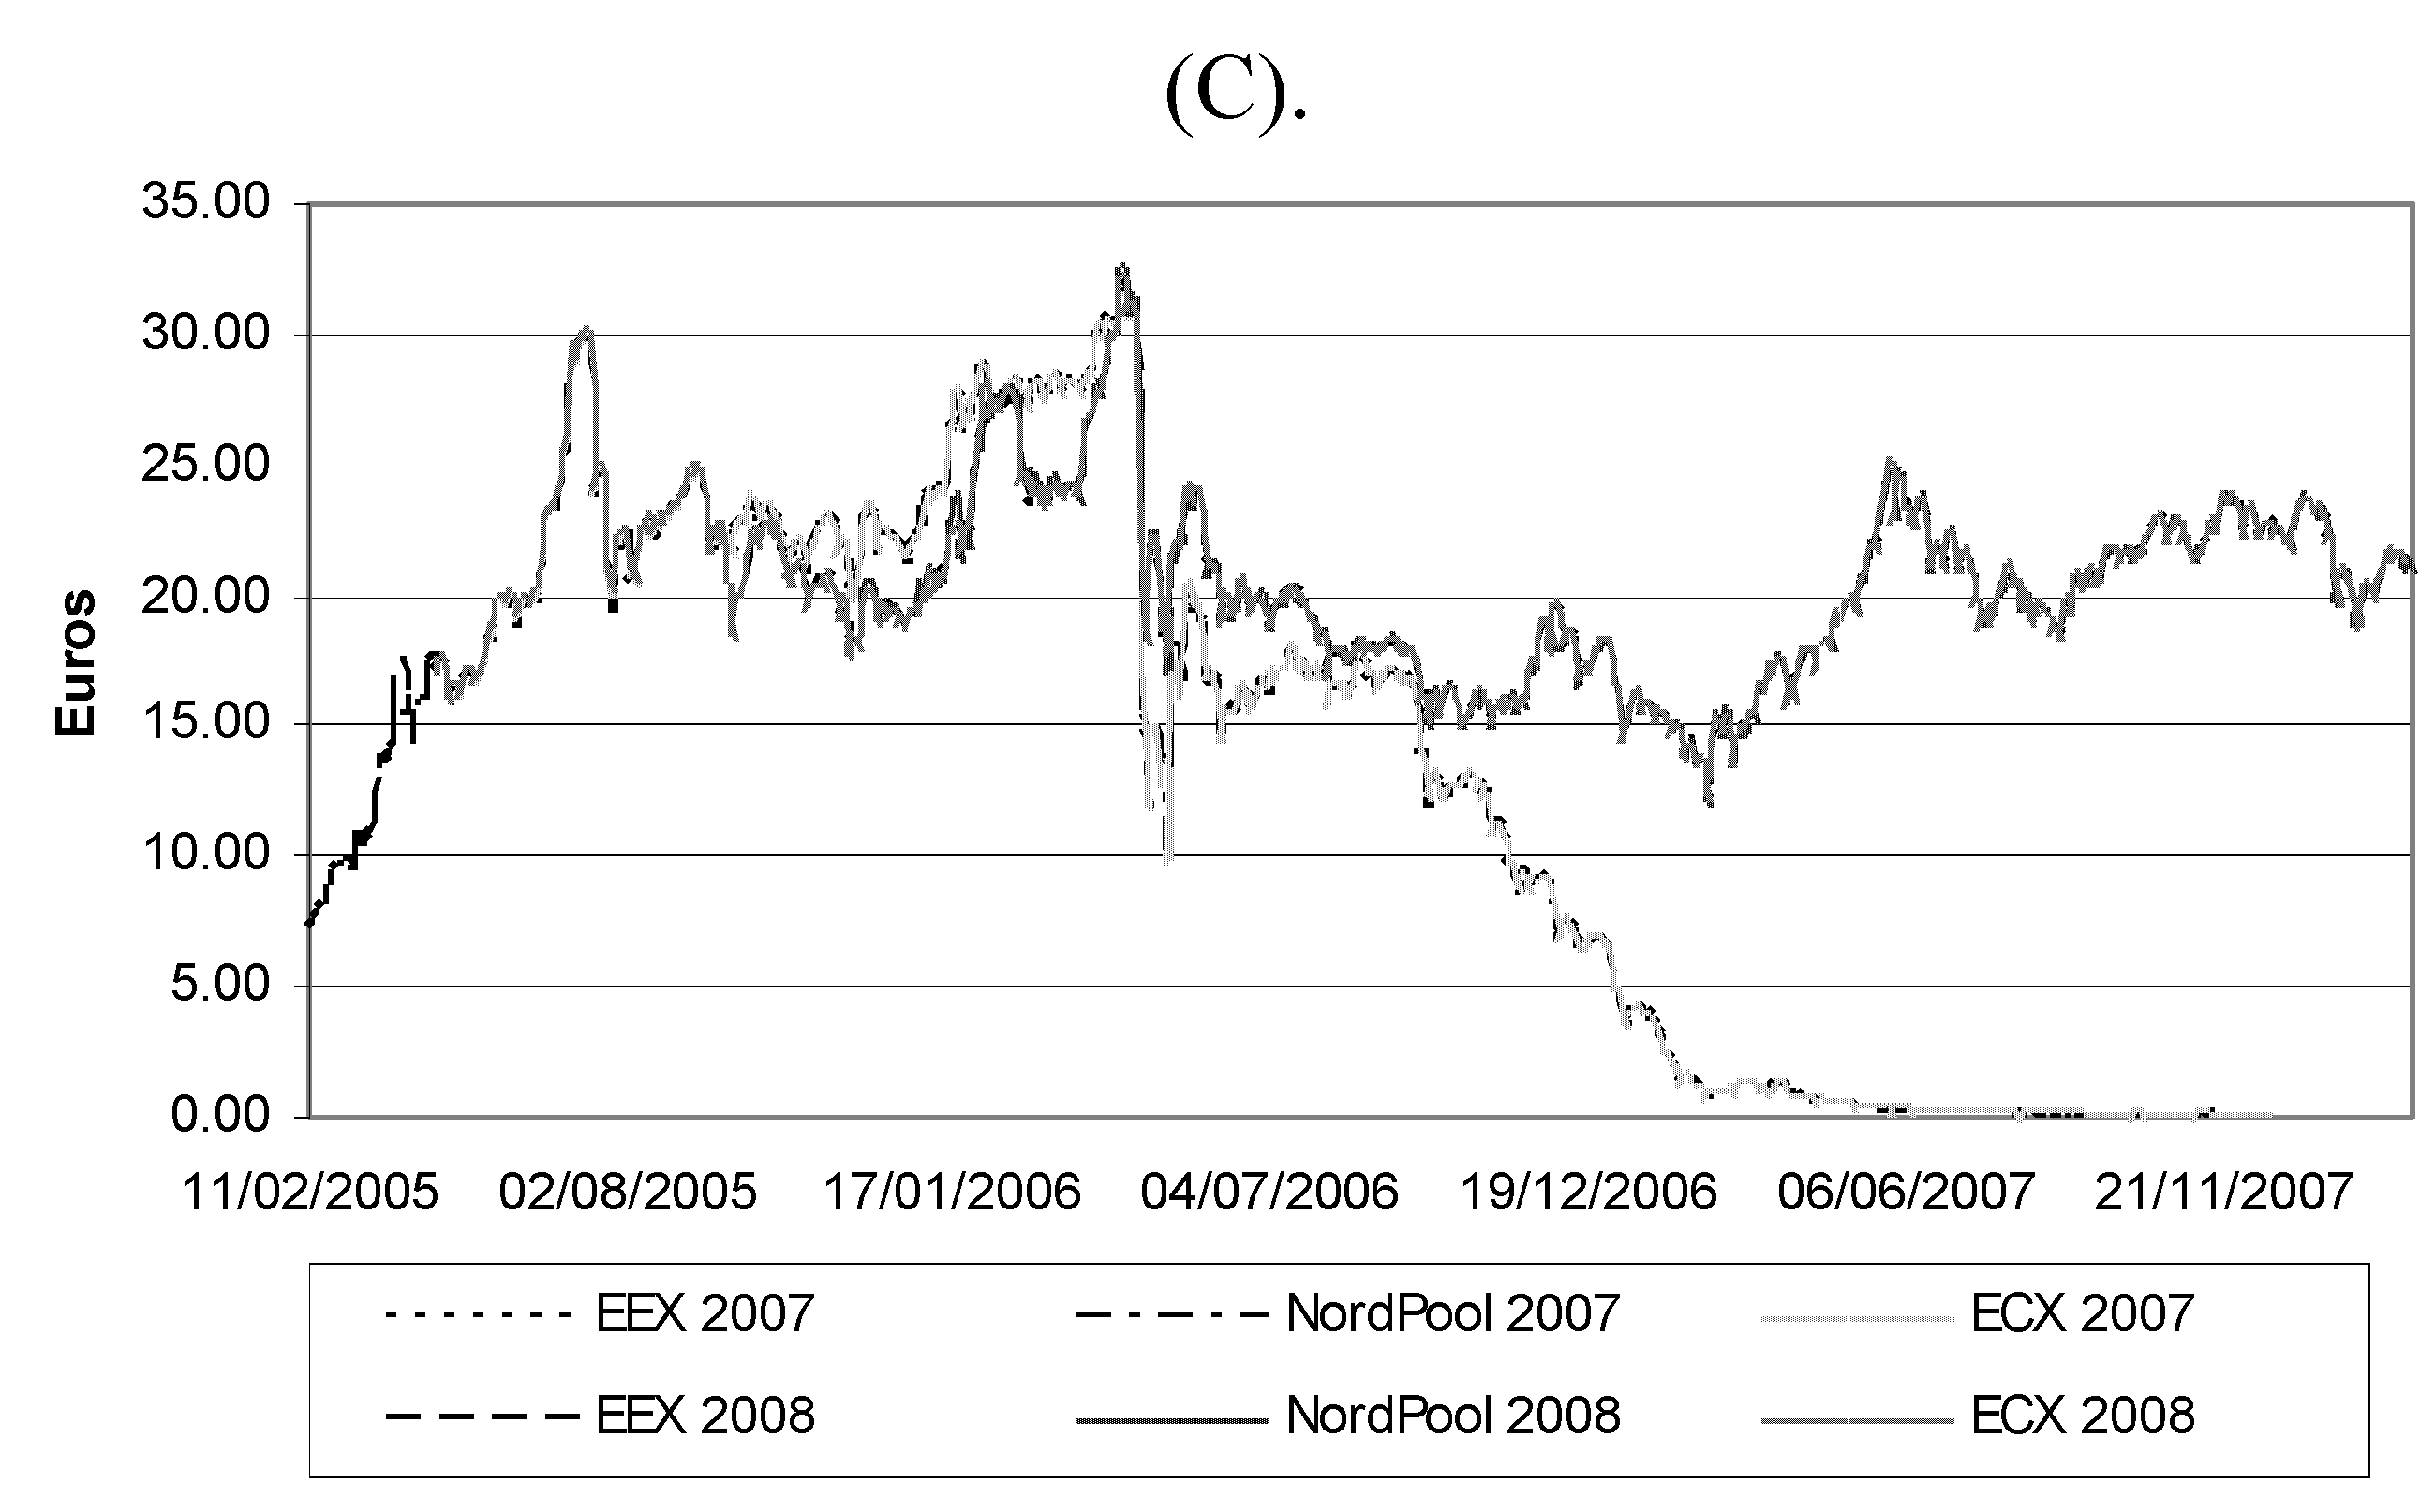
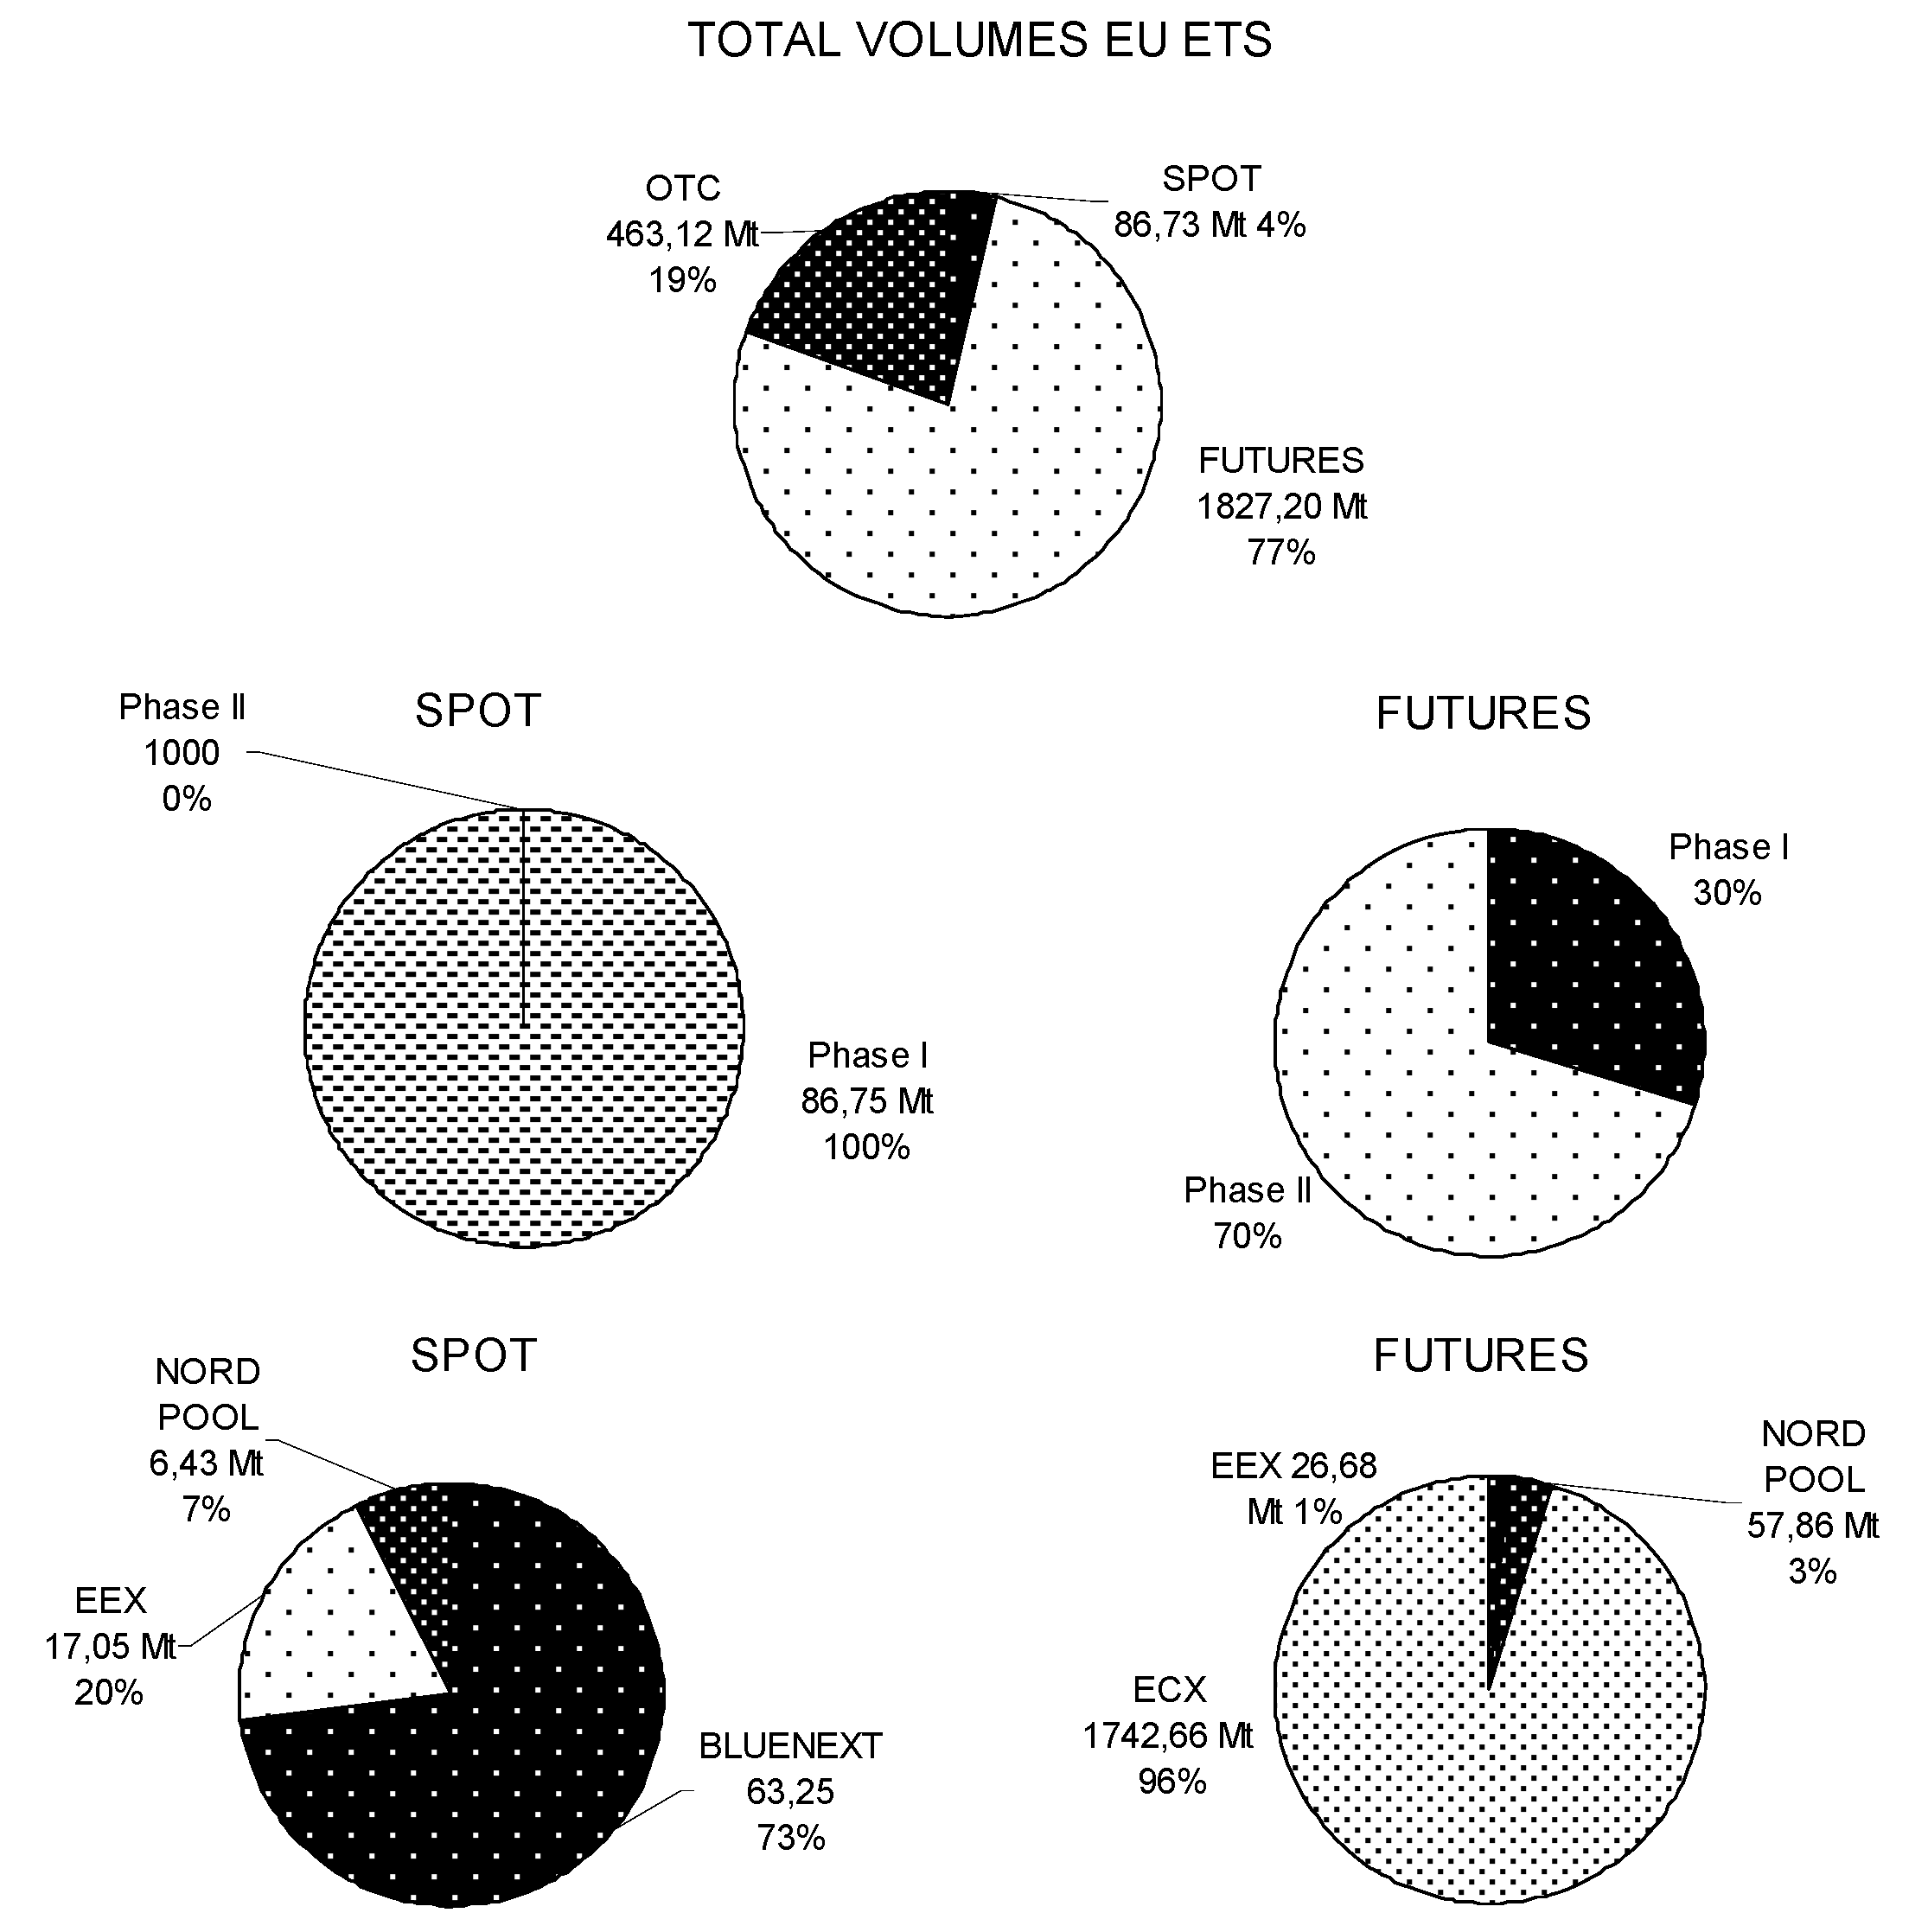
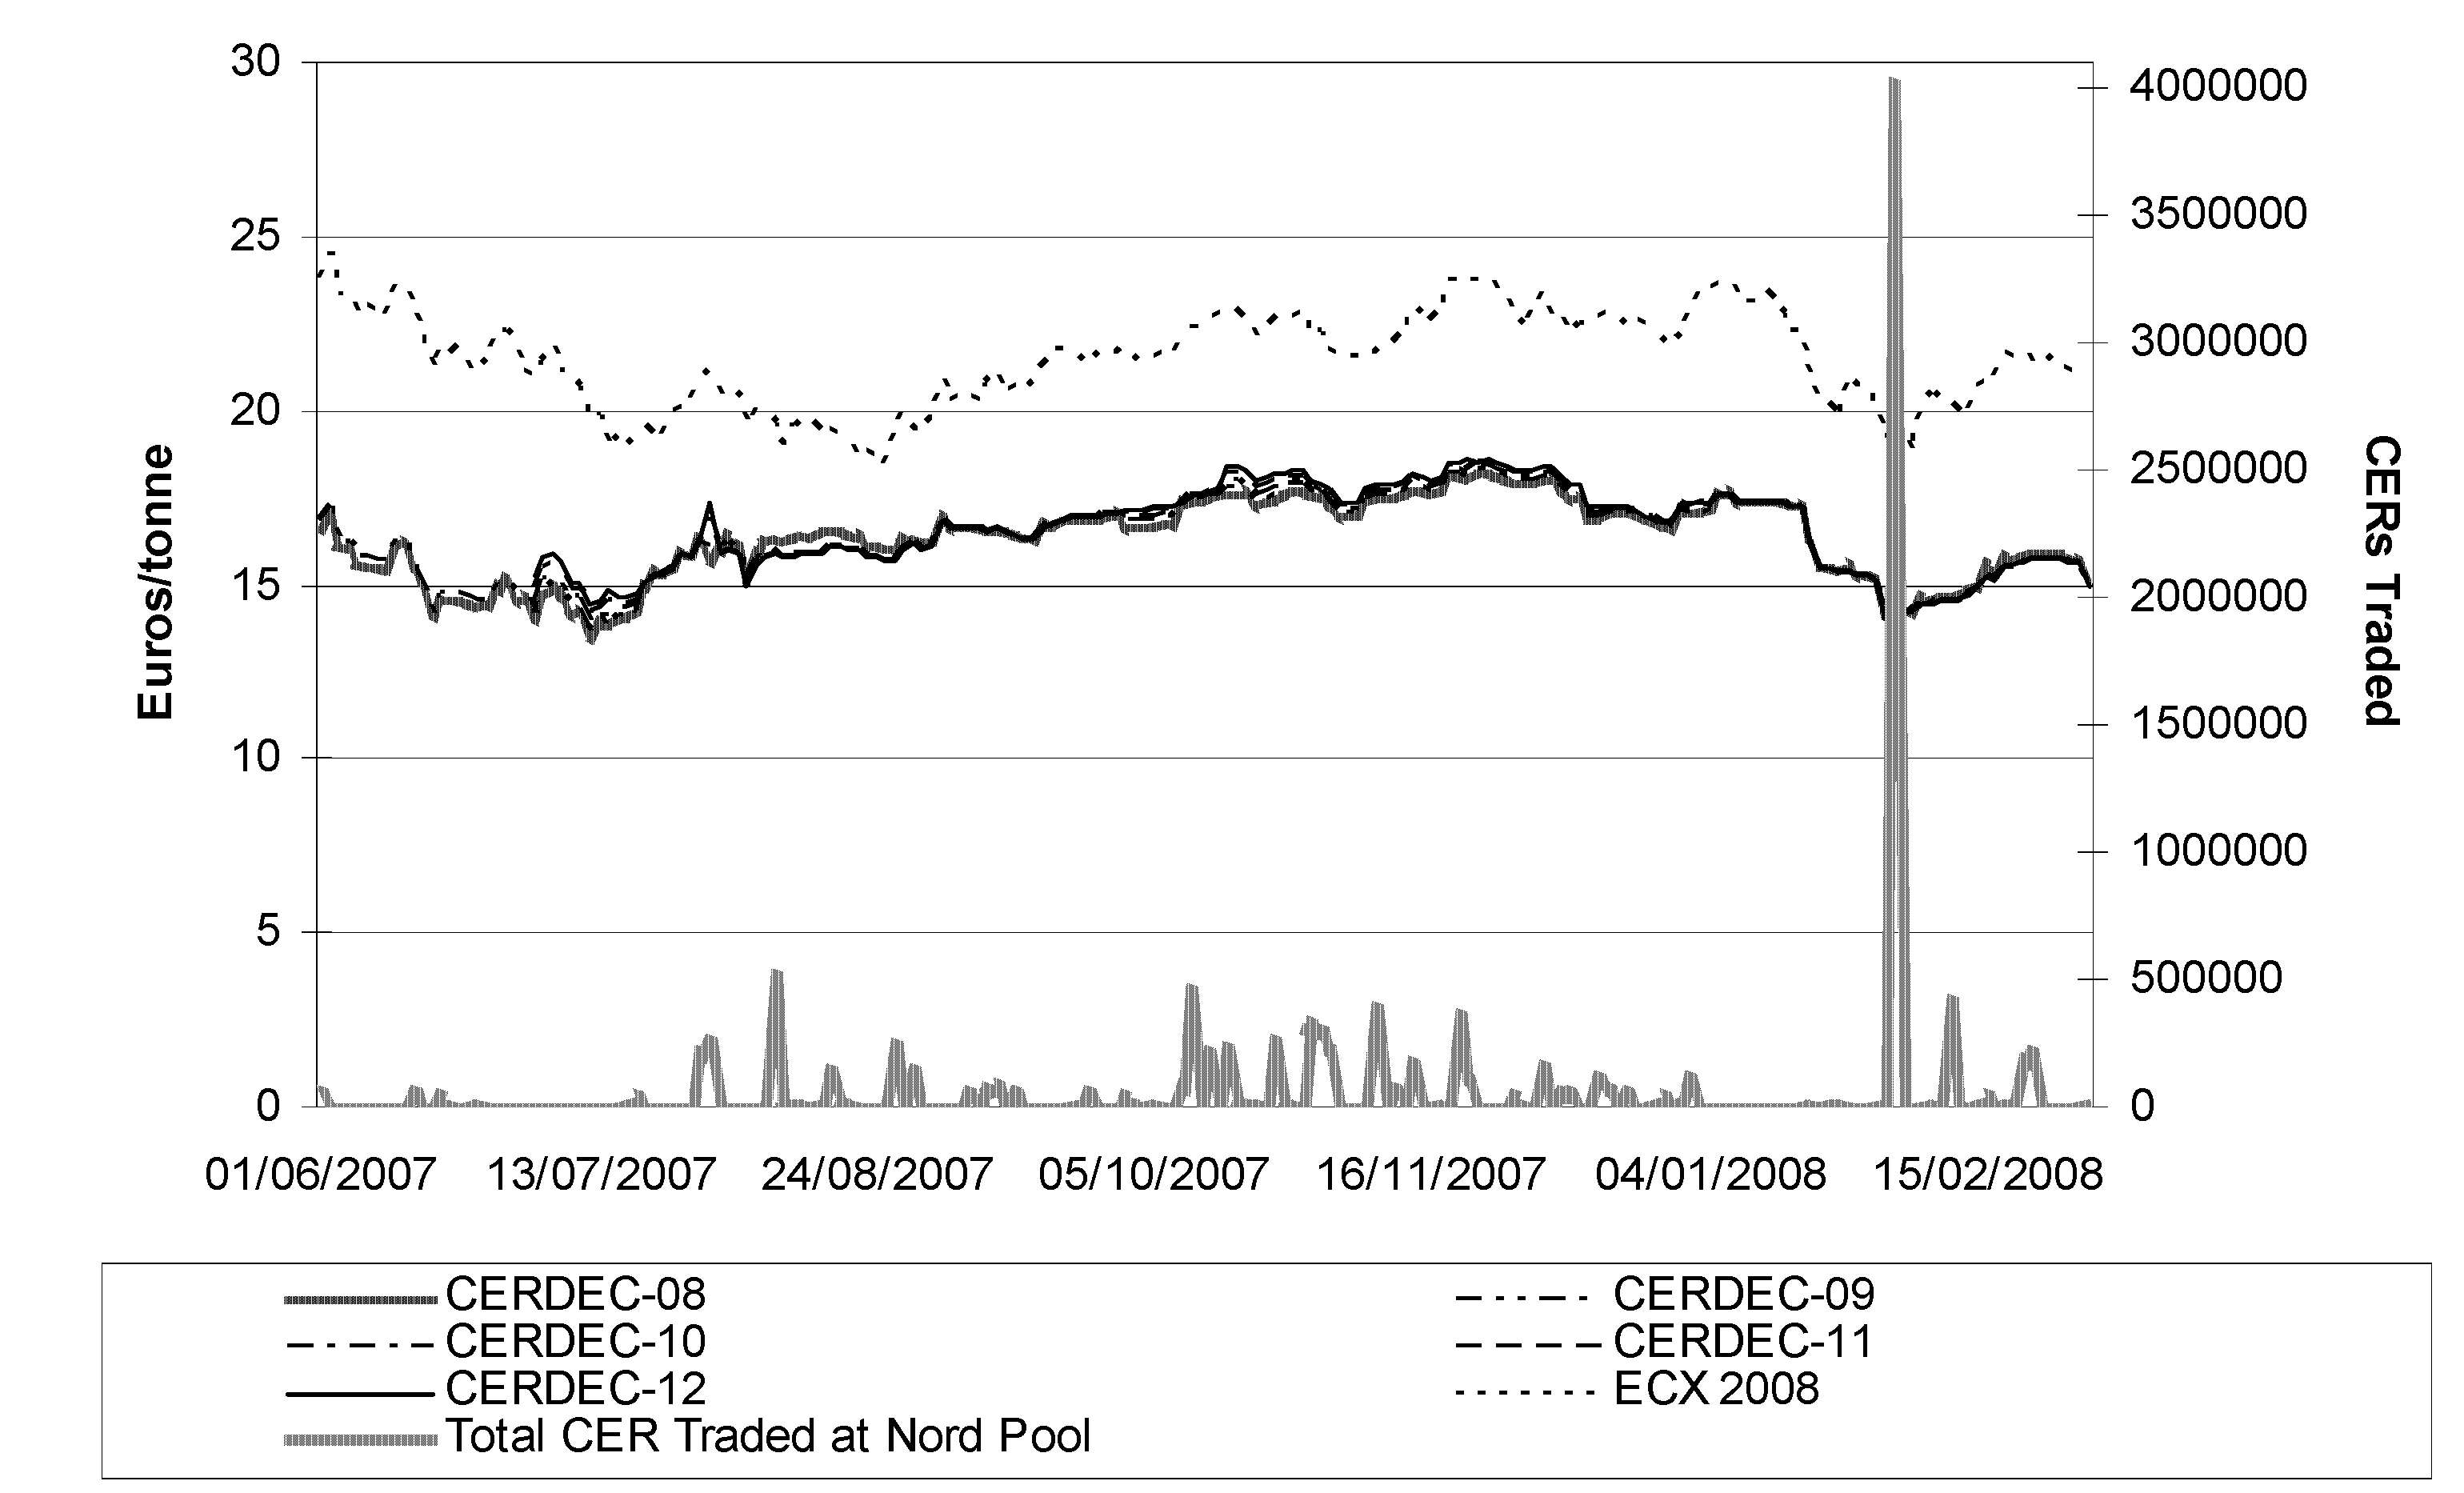