Article

Theoretical Analysis of Shrouded Horizontal Axis Wind Turbines

by
Tariq Abdulsalam Khamlaj
* and
Markus Peer Rumpfkeil
300 College Park Kettering Labs, University of Dayton, Dayton, OH 45469-0238, USA
*
Author to whom correspondence should be addressed.
Energies 2017, 10(1), 38; https://doi.org/10.3390/en10010038
Submission received: 26 September 2016 / Revised: 13 December 2016 / Accepted: 20 December 2016 / Published: 1 January 2017
(This article belongs to the Special Issue Wind Turbine 2017)

Abstract

:
Numerous analytical studies for power augmentation systems can be found in the literature with the goal to improve the performance of wind turbines by increasing the energy density of the air at the rotor. All methods to date are only concerned with the effects of a diffuser as the power augmentation, and this work extends the semi-empirical shrouded wind turbine model introduced first by Foreman to incorporate a converging-diverging nozzle into the system. The analysis is based on assumptions and approximations of the conservation laws to calculate optimal power coefficients and power extraction, as well as augmentation ratios. It is revealed that the power enhancement is proportional to the mass stream rise produced by the nozzle diffuser-augmented wind turbine (NDAWT). Such mass flow rise can only be accomplished through two essential principles: the increase in the area ratios and/or by reducing the negative back pressure at the exit. The thrust coefficient for optimal power production of a conventional bare wind turbine is known to be 8/9, whereas the theoretical analysis of the NDAWT predicts an ideal thrust coefficient either lower or higher than 8/9 depending on the back pressure coefficient at which the shrouded turbine operates. Computed performance expectations demonstrate a good agreement with numerical and experimental results, and it is demonstrated that much larger power coefficients than for traditional wind turbines are achievable. Lastly, the developed model is very well suited for the preliminary design of a shrouded wind turbine where typically many trade-off studies need to be conducted inexpensively.

1. Introduction

There are numerous unresolved problems if one wants to increase the power production of a conventional wind turbine by simply increasing the diameter of the rotor, e.g., transportation, installation and maintenance, to name a few. Due to this fact, integration of wind generators into a national or regional power grid can be inhibited by the unacceptable reliability of very large units or the economic liability of many smaller units of comparable total power output. These technical factors interact with the economic constraints associated with matching supply and demand schedules in variable wind, the low power density of wind, the high development risk of new system concepts and the capital intensive nature of wind power systems.
Many of these capital and performance challenges of conventional wind turbine systems could be potentially reduced or eliminated by enclosing the wind turbine in a suitably-shaped duct. A duct structure typically provides a diffuser section behind the rotor that produces a power augmentation of considerable magnitude (typically 1.5- to two-fold) for a given size rotor, as well as the dampening of gusts, reducing performance sensitivity to wind directionality and raising the level of axial velocity significantly [1].
The actuator disk theory for open flow wind turbines has been established for about 90 years, while shrouded horizontal axis wind turbines or diffuser-augmented wind turbines (DAWT) have been in development for more than five decades with no large commercial success to date. Unfortunately, one influential early investigator, Betz [2], concluded that diffusers were not economical for contemporaneous applications. Although this result was based on correct theory, it made the overly restrictive assumption that the diffuser exit pressure is equal to the ambient or free stream atmospheric pressure.
An experimental approach for ducted wind turbines was undertaken by Lilly and Rainbird [3] in the 1950s, and in the 1970s, a significant number of experiments were carried out by Foreman [1,4] from the Grumman Aerospace department. However, conclusions from these experiments varied significantly. The Lilly and Rainbird study concluded that no performance improvements were conceivable when the performance is normalized by the exit area of the diffuser, whereas Foreman [1] confirmed a power increase by a factor of four compared to the same rotor operating as a conventional or bare wind turbine. These research works performed not only experiments, but also developed theoretical models to verify their results. However, these models lacked a complete explanation of the major flow phenomena occurring in DAWTs. Shrouded horizontal axis wind turbines were a subject undergoing intense study at the Wind Energy Innovative System Conference in 1979. One of the major conclusions from this conference was that the economical applications of such turbines seemed not feasible at the time because of the high cost of the shroud, although the power augmentation was interesting. The expeditious development of bare horizontal axis wind turbines at around the same time led to the disappearance of DAWTs from research agendas.
Recently, however, an increase in the number of publications on the topic and attempts to commercialize the idea indicate a renewed interest in shrouded turbines. Researchers have come to the agreement that there is significant potential for improvements in this concept, and understanding the details of the flow physics is one of the keys. An investigation by Hansen [5] using both low-fidelity momentum theory and computational fluid dynamics (CFD) demonstrates that the power augmentation of a shrouded turbine is proportional to the increase in mass flow rate through the turbine blades. Furthermore, throughout the past decade, the research group of Ohya [6] has performed extensive experimental and computational work on this topic, which has led to the development of a high performance “flanged diffuser”, as they call it.
The current work complements the analysis first introduced by Foreman [1] and backed by Lawn [7], but derives the results in a rather more general way. However, due to the complexity of the force on a diffuser, a closed theory cannot be established, and the analysis needs to be augmented with empirical data. The remainder of the article is organized as follows. Section 2 gives an overview of other analytical methods in the literature. Section 3 derives the newly-extended theory, and Section 4 verifies and validates the theoretical results with experimental and CFD data. Section 5 provides a comparison between augmentation with a diffuser only and with a converging-diverging nozzle. Section 6 shows performance predictions of NDAWT systems by changing area ratios of the nozzle and diffuser, diffuser and nozzle efficiencies, velocity ratios and back pressure coefficients. Finally, Section 7 concludes this article.

2. Review of Previous Analytical Models

Researchers have developed several basic 1D theoretical models to predict the power production of wind turbines, including the well-known one-dimensional momentum analysis of the flow over a horizontal axis wind turbine leading to the famous Betz limit. Predictions for the power output of a shrouded wind turbine have been published by, amongst others, Foreman (1978) [1], Lawn (2003) [7], van Bussel (2007) [8], Jamieson (2008) [9], as well as Werle and Presz (2008) [10]. However, the results of these models vary; for instance, the predictions of the thrust coefficient at the maximum power coefficient differ based on the underlying theory, as explained in more detail below. In addition, some lack a complete description of the major flow phenomena, rendering most of the models either valid for only short diffusers or entirely invalid [11]. Next, the various theories and their shortcomings are discussed briefly.
Van Bussel (2007) [8] developed a theoretical model based on Betz’s theory. The continuity equation, as well as the momentum equation were used in the analysis. However, it was assumed that just downstream of the physical diffuser, the velocity is the average of the velocity far upstream and far downstream, i.e., the relation that is valid for the velocity at the rotor plane for the case of a conventional wind turbine. This assumption is only valid for the case of a short diffuser, i.e., if the diffuser exit plane is not too far off the rotor plane for which the assumption that was made regarding the average velocity is still somewhat justified, since it is certainly not true in long diffusers. Thus, the one-dimensional flow theory of van Bussel [8], though consistent with the case of the conventional wind turbine without diffuser, is not valid for longer diffusers [11].
Jamieson (2008) [9] derived a one-dimensional theory similar to the one of van Bussel. However, the diffuser is taken into account by assuming an induction factor at zero thrust. This decoupling is not ideal, since the diffuser performance is influenced by the thrust exerted by the rotating blades. He concludes that a DAWT operates optimally at the same conditions as a bare turbine with a thrust coefficient of 8/9. According to Konijn [11], the theory leads to an incorrect power coefficient of 32/27 (instead of the correct 16/27) when regarding the diffuser with an area ratio between the downstream exit and rotor plane of two.
Werle and Presz (2008) [10] use a different models for the diffuser. They assume that the effect of the diffuser can be modeled by a force on the fluid pointing against the direction of the flow. This force is modeled to be proportional to the rotor resistance. The rest of their derivation for the power coefficient is very similar to the one leading to the Betz limit, except for the presence of the force exerted by the diffuser on the fluid. The one-dimensional flow theory by Werle and Presz is questionable since the force is not necessarily proportional to the rotor resistance. For instance, the theory breaks down when the value of the loading coefficient is equal to two [11].
In summary, all of the methods mentioned above predict a maximum thrust coefficient equal to 8/9 for a DAWT; however, this is incorrect due to false assumptions made in the respective derivations. Foreman (1978) [1] and Lawn (2003) [7], on the other hand, show that optimal operating conditions occur at thrust coefficient values either higher or lower than 8/9 depending on the loading coefficient, back pressure coefficient and diffuser efficiency.

3. 1-D Theory of Nozzle Diffuser Augmented Wind Turbines

3.1. Assumptions and Geometry

The theory by Betz–Joukowski, as well as the theory of shrouded diffuser wind turbines is based on the premise that the turbine can be represented as an actuator disk, as given in Equation (1). The flow over the disc is considered ideal, meaning frictionless, as well as having no rotational velocity component in the wake. The flow is also assumed to be steady and incompressible.
Figure 1 shows that the actuator disc appears as a drag device decelerating the wind speed in a continuous manner from V far upstream of the rotor, to V 1 at the rotor and, finally, V 3 far downstream in the wake. The retardation of flow gives rise to a divergence in the stream tube passing through the periphery of the disc. There is an associated pressure rise on the upstream side of the rotor to a value p 1 . Across the actuator disc, there is a discontinuous pressure drop from p 1 to p 2 . Downstream of the rotor, there is a gradual pressure recovery until the level returns to atmospheric, p , in the far wake.

3.2. 1-D Theory for Bare Wind Turbines

Investigations of the one-dimensional theory for a conventional or bare wind turbine by Bergey [12] indicated that Lanchester (1915), Betz (1920) and Joukowski (1920) might all have independently established the maximum efficiency of an energy extraction device in an open flow. A recent study by Okulov and van Kuik [13] suggests that the ascription to Lanchester is likely inappropriate. Therefore, the Betz limit may conceivably be called the Betz–Joukowski limit; however, for shortness and familiarity, the reference as simply the Betz limit is retained [14] here.
Across the rotor, the thrust, F r , that is the force in the streamwise direction resulting from the pressure drop across the turbine, can be written as follows [15]:
F r = ( p 1 p 2 ) A r
where A r is the rotor area and p 1 and p 2 are the pressure before and after the rotor plane, respectively.
The ideal power output of the actuator or the rate of energy loss across the rotor is obtained by multiplying Equation (1) with V r , where V r = V 1 = V 2 . Hence, the ideal power from the actuator disk can be written as follows:
P i d e a l = ( p 1 p 2 ) Q ,    Q = V 1 A 1
showing that the power generated by the turbine is proportional to the product of the pressure loss across it and the volumetric flow rate. However, in practice, only a fraction of the power P < P i d e a l can be harvested; hence, the turbine efficiency can be defined as follows:
η T = P ( p 1 p 2 ) Q
The loading coefficient for the flow caused by some factors, e.g., the degree of surface smoothness, angles of the exit and inlet section, rounded inlet section, separation layer (boundary layer), etc., is defined as the ratio of the drop in static pressure across the turbine and the dynamic pressure at the throat [1]:
ψ = ( p 1 p 2 ) 1 2 ρ V 1 2
The standard definition of the thrust coefficient for a turbine is one referenced to the free stream velocity V [15].
C t = p 1 p 2 1 2 ρ V 2
The velocity ratio between the rotor plane and free stream can be defined as:
V R = V 1 V ,    V 1 = V 2
Therefore, substituting Equation (4) into (5) yields:
C t = ψ V R 2
Rewriting Equation (3):
P = η T ( p 1 p 2 ) V 1 A 1
and multiplying and dividing the right-hand side by 1 2 ρ V 1 2 gives:
P = 1 2 η T ψ ρ V 1 3 A r
where η T is the turbine efficiency, and V 1 will be diminished as ψ increases. Similarly, the standard definition of the power coefficient is given with reference to the rotor area:
C P = P 1 2 ρ V 3 A r
Substituting Equations (9) into (10) results in the following handy relation:
C P η T = C t V R
The changes in pressure and velocity upstream and downstream of the actuator disc can be described by Bernoulli’s equation under the assumptions mentioned earlier. Therefore, the equation for the stream tube beginning far upstream and ending at Station 1 just in front of the rotor is given by:
C p 1 = p 1 p 1 2 ρ V 2 = 1 V R 2
Similarly, the Bernoulli equation holds for the flow downstream of the turbine:
C p 23 = p p 2 1 2 ρ V 2 2 = 1 V 3 2 V 2 2
Considering the stream tube shown in Figure 1, the axial momentum balance can be written in the following form [16]:
V 3 ρ V 3 A 3 V ρ V A = F r
Substituting the definition that was introduced for the thrust Equation (1) into Equation (14) gives:
V 3 ρ V 3 A 3 V ρ V A = ( p 1 p 2 ) A r
Hence, by simplifying Equation (15), the final result will be in the following form:
ψ = 2 V V 1 V 3 V 2
Summing the pressure differences along the streamwise direction and equating to zero leads to:
( p 1 p ) + ( p p 2 ) ( p 1 p 2 ) = 0
Substituting Equations (4), (12) and (13) into (17) yields:
V R = V 1 V = 4 ψ + 4
Now, since the thrust and power coefficients are functions of the velocity ratio V R , it is easy to find these coefficients. To do so, substitute Equations (18) into (7), resulting in:
C t C = 16 ψ ψ + 4 2
Similarly, substituting Equation (18) into (11) yields:
C P C η T = 64 ψ ψ + 4 3
The maximum theoretical power coefficient of the conventional wind turbine can be obtained by differentiating C P C η T with respect to ψ in Equation (20) and solving for the root(s). The result yields:
ψ m a x = 2
V R m a x = 2 3
C t C m a x = 8 9
C P C m a x η T = 16 27 = 59.3 %
Using Bernoulli’s equation for the flow upstream of the rotor, the pressure difference between Section 1 and section ∞ relative to the dynamic pressure in the upstream flow for a conventional wind turbine operating at the Betz limit can be calculated by using Equation (12) with the maximum velocity ratio V R m a x = 2 3 yielding:
C p f = p 1 p 1 2 ρ V 2 = 1 V R 2 = 5 9
Similarly, for the back pressure of the bare wind turbine, one obtains:
C p b = p 2 p 1 2 ρ V 2 = C p f C t = 1 3

3.3. 1-D Theory for Shrouded Turbines with Nozzle and Diffuser

The results of one-dimensional momentum theory applied to a diffuser-augmented wind turbine or DAWT were first presented by Foreman [1] and re-derived by Lawn [7]. Here, their approach is expanded to include the effect of a nozzle incorporated into the shroud called a nozzle diffuser-augmented wind turbine or NDAWT.
The area ratio of the nozzle and diffuser can be defined from the continuity equation:
V e V 2 = A 2 A e = λ D ,    V i V 1 = A 1 A i = λ N
Referring to Figure 1, the pressure coefficient at the nozzle inlet can be expressed by applying Bernoulli’s equation:
C p f = p i p 1 2 ρ V 2 = 1 λ N 2 V 1 2 V
Similarly, the coefficient at the exit of the diffuser or back pressure is given by:
C p b = p b p 1 2 ρ V 2 = V 3 2 V 2 λ D 2 V 2 2 V 2
The nozzle efficiency can be introduced by using Bernoulli’s equation between the inlet of the nozzle and rotor:
η N = p i p 1 1 2 ρ V 1 2 1 2 ρ V i 2
Similarly, the diffuser efficiency can be defined as [1,7,17]:
η D = p b p 2 1 2 ρ V 2 2 1 2 ρ V e 2
Summing the pressure difference along the streamwise direction and equating to zero results in:
( p i p 1 ) ( p i p ) + ( p 1 p 2 ) ( p b p 2 ) + ( p b p ) = 0
Substituting Equations (4), (28), (29), (30) and (31) into (32) yields:
V R N D = V 1 V = 1 C p b ψ + η N + λ N 2 1 η N η D 1 λ D 2
Substituting Equations (33) into (7) yields the thrust coefficient for the NDAWT:
C t N D = ψ V R 2 = ψ 1 C p b ψ + η N + λ N 2 1 η N η D 1 λ D 2
Recall Equation (29); hence, the velocity far downstream is given as follows:
V 3 V = C p b + λ D 2 V 1 2 V 2
Similarly, substituting Equations (33) into (11) gives the power coefficient for the NDAWT:
C P N D η T = C t V R = ψ 1 C p b ψ + η N + λ N 2 1 η N η D 1 λ D 2 3 2
The main insight of Equation (36) is that the power available to a perfect ducted turbine can be increased by using a smaller rotor/nozzle and rotor/exit area ratio, λ N and λ D , high nozzle and diffuser efficiencies, η N and η D , and a large negative back pressure coefficient C p b .
The maximum theoretical power output of the NDAWT can be found by differentiating C P N D η T with respect to ψ in Equation (36) and finding the root(s). The result leads to the following optimal loading coefficient:
ψ N D m a x = 2 η N + λ N 2 1 η N η D 1 λ D 2
Substituting Equations (37) into (33), (34) and (36) results in:
V R N D m a x = 1 C p b 3 η N + 3 λ N 2 1 η N 3 η D 1 λ D 2
C t N D m a x = 2 1 C p b 3
C P N D m a x η T = 2 1 C p b 3 27 η N + λ N 2 1 η N η D 1 λ D 2 1 2
Thus, the greatest power augmentation compared to conventional wind power generators is obtained for [1]:
  • The largest possible negative value of the exit plane pressure coefficient (i.e., diffuser exit pressure is reduced well below atmospheric pressure).
  • The largest possible diffuser and nozzle efficiencies.
  • A unique relation of turbine disk loading to diffuser pressure recovery in which high recovery favors low power loading by inducing greater volume flow through the disk.
Because coefficients, such as C p b , η D and η N must be empirically determined, the one-dimensional theoretical performance indicated by Equation (36) is, in practice, a semi-empirical theory for which measured quantities of existing NDAWTs need to be introduced for proper quantitative evaluation.
It is prudent to verify that in the limit, one recovers the traditional Betz results presented in Section 3.2 above. One can remove the effects of the nozzle and diffuser by setting λ D = λ N = 1 , as well as η D = η N = 1 and using C p b = 1 3 (semi-empirical theory) in Equations (37)–(40), yielding the familiar results. Table 1 gives a succinct summary of the theoretical equations governing the performance of bare and augmented wind turbines.

4. Validation

4.1. Validation with Field Experimental Results

The research institution at Kyushu University [6] tested a shrouded wind turbine with a brim shown in Figure 2. The parameters used for the field experiment of that wind turbine are provided in Table 2.
Equations (20) and (36) are used to obtain the theoretical maximum power coefficients displayed as a function of the loading coefficient in Figure 3. In this case, the maximum power coefficient for the shrouded wind turbine with diameter D = 0.7 m and a brim is found to be C P N D = 1.519 , which is almost three-times larger than the Betz limit for a bare wind turbine, C P C = 0.593 . The corresponding value for the thrust coefficient of the shrouded turbine at the same optimal loading coefficient is C t N D 1.1 .
From Figure 4, one can observe that while the 1D theory of the bare wind turbine developed by Betz [15] shows a considerable deviation from the obtained experimental results as the velocity increases, the 1D theory for the NDAWT exhibits less deviation as the velocity increases. This can be explained due to the fact that the 1D theory for Betz is a completely inviscid theory, whereas for the NDAWT, the 1D theory contains semi-empirical relations, namely the pressure coefficient of the diffuser C p b that was obtained from the corresponding experimental results, as well as the nozzle and diffuser efficiencies η N and η D .

4.2. Validation with CFD Results

Another good avenue to validate the developed semi-empirical formulations presented in Equations (33)–(36) is to make comparisons to higher fidelity CFD results. Comprehensive and complex viscous CFD computations were conducted by Hansen et al. [5,18] employing an actuator disk model to simulate the pressure drop across a wind turbine. They computed results for both a conventional and shrouded wind turbine, whose geometry is shown in Figure 5.
It was found in Hansen’s [5] study for a diffuser with an aggressive area ratio λ D = 0.54 that the diffuser efficiency η D is equal to 83 % . Furthermore, the overall diffuser pressure recovery coefficient or back pressure C p b is estimated to be C p b = 0.38 for zero thrust. Using these values in Equations (20) and (36) for an unshrouded and shrouded wind turbine, respectively, the results shown in Figure 6 were calculated.
The comparison shows that the simple inviscid one-dimensional analysis for a conventional wind turbine is in good agreement with the more complex and expensive CFD results over the full range of the blade thrust. Likewise, for the shrouded wind turbine, the one dimensional inviscid analysis agrees well with the CFD results, but not surprisingly with a slightly higher maximum-power level, due to the considerable viscous losses encountered for such an aggressive diffusion area ratio ( λ D = 0.54 ). Furthermore, it can be noticed from Figure 6 that the NDAWT method is in good agreement with the viscous CFD results by Hansen [5]. However, at a thrust coefficient value of approximately 0.9, the new theory shows a noticeable deviation compared to the CFD results. This deviation likely occurs due to high turbulent effects at those operating conditions that cannot be captured using a simple 1D inviscid theory.

5. Diffuser Only vs. Converging-Diverging Nozzle

The main contribution of this article is to account for the physical effect of the addition of a nozzle to a diffuser shape, i.e., the consideration of a converging-diverging (C-D) nozzle for the shroud. In order to motivate the importance of this addition, Figure 7, Figure 8 and Figure 9 have been created using the newly-developed generalized 1D momentum theory for the C-D nozzle, whereas the old momentum theory by Foreman et al. [1] (which is included as a limiting case in the new theory) is used for the diffuser only results. Figure 7 illustrates the velocity distribution, and one can notice the same velocity distribution for the diffuser only and C-D nozzle case if the efficiencies of both the nozzle and diffuser are equal to 100 % . However, for efficiencies less than 100 % and the same back pressure coefficient, one can observe that the C-D nozzle performs always better than the diffuser only and that adding a nozzle could lead to a 12 % increase in the power production, as illustrated in Figure 8 and Figure 9. In addition, based on viscous CFD simulations conducted by the authors, the nozzle has a secondary effect of decreasing the back pressure by up to 15 % , as well leading to an even greater increase in power generation. Thus, the authors believe that one should use C-D nozzles as the design starting point for shrouds, and thus, the theory by Foreman et al. has been extended.

6. Results and Discussions

Equation (
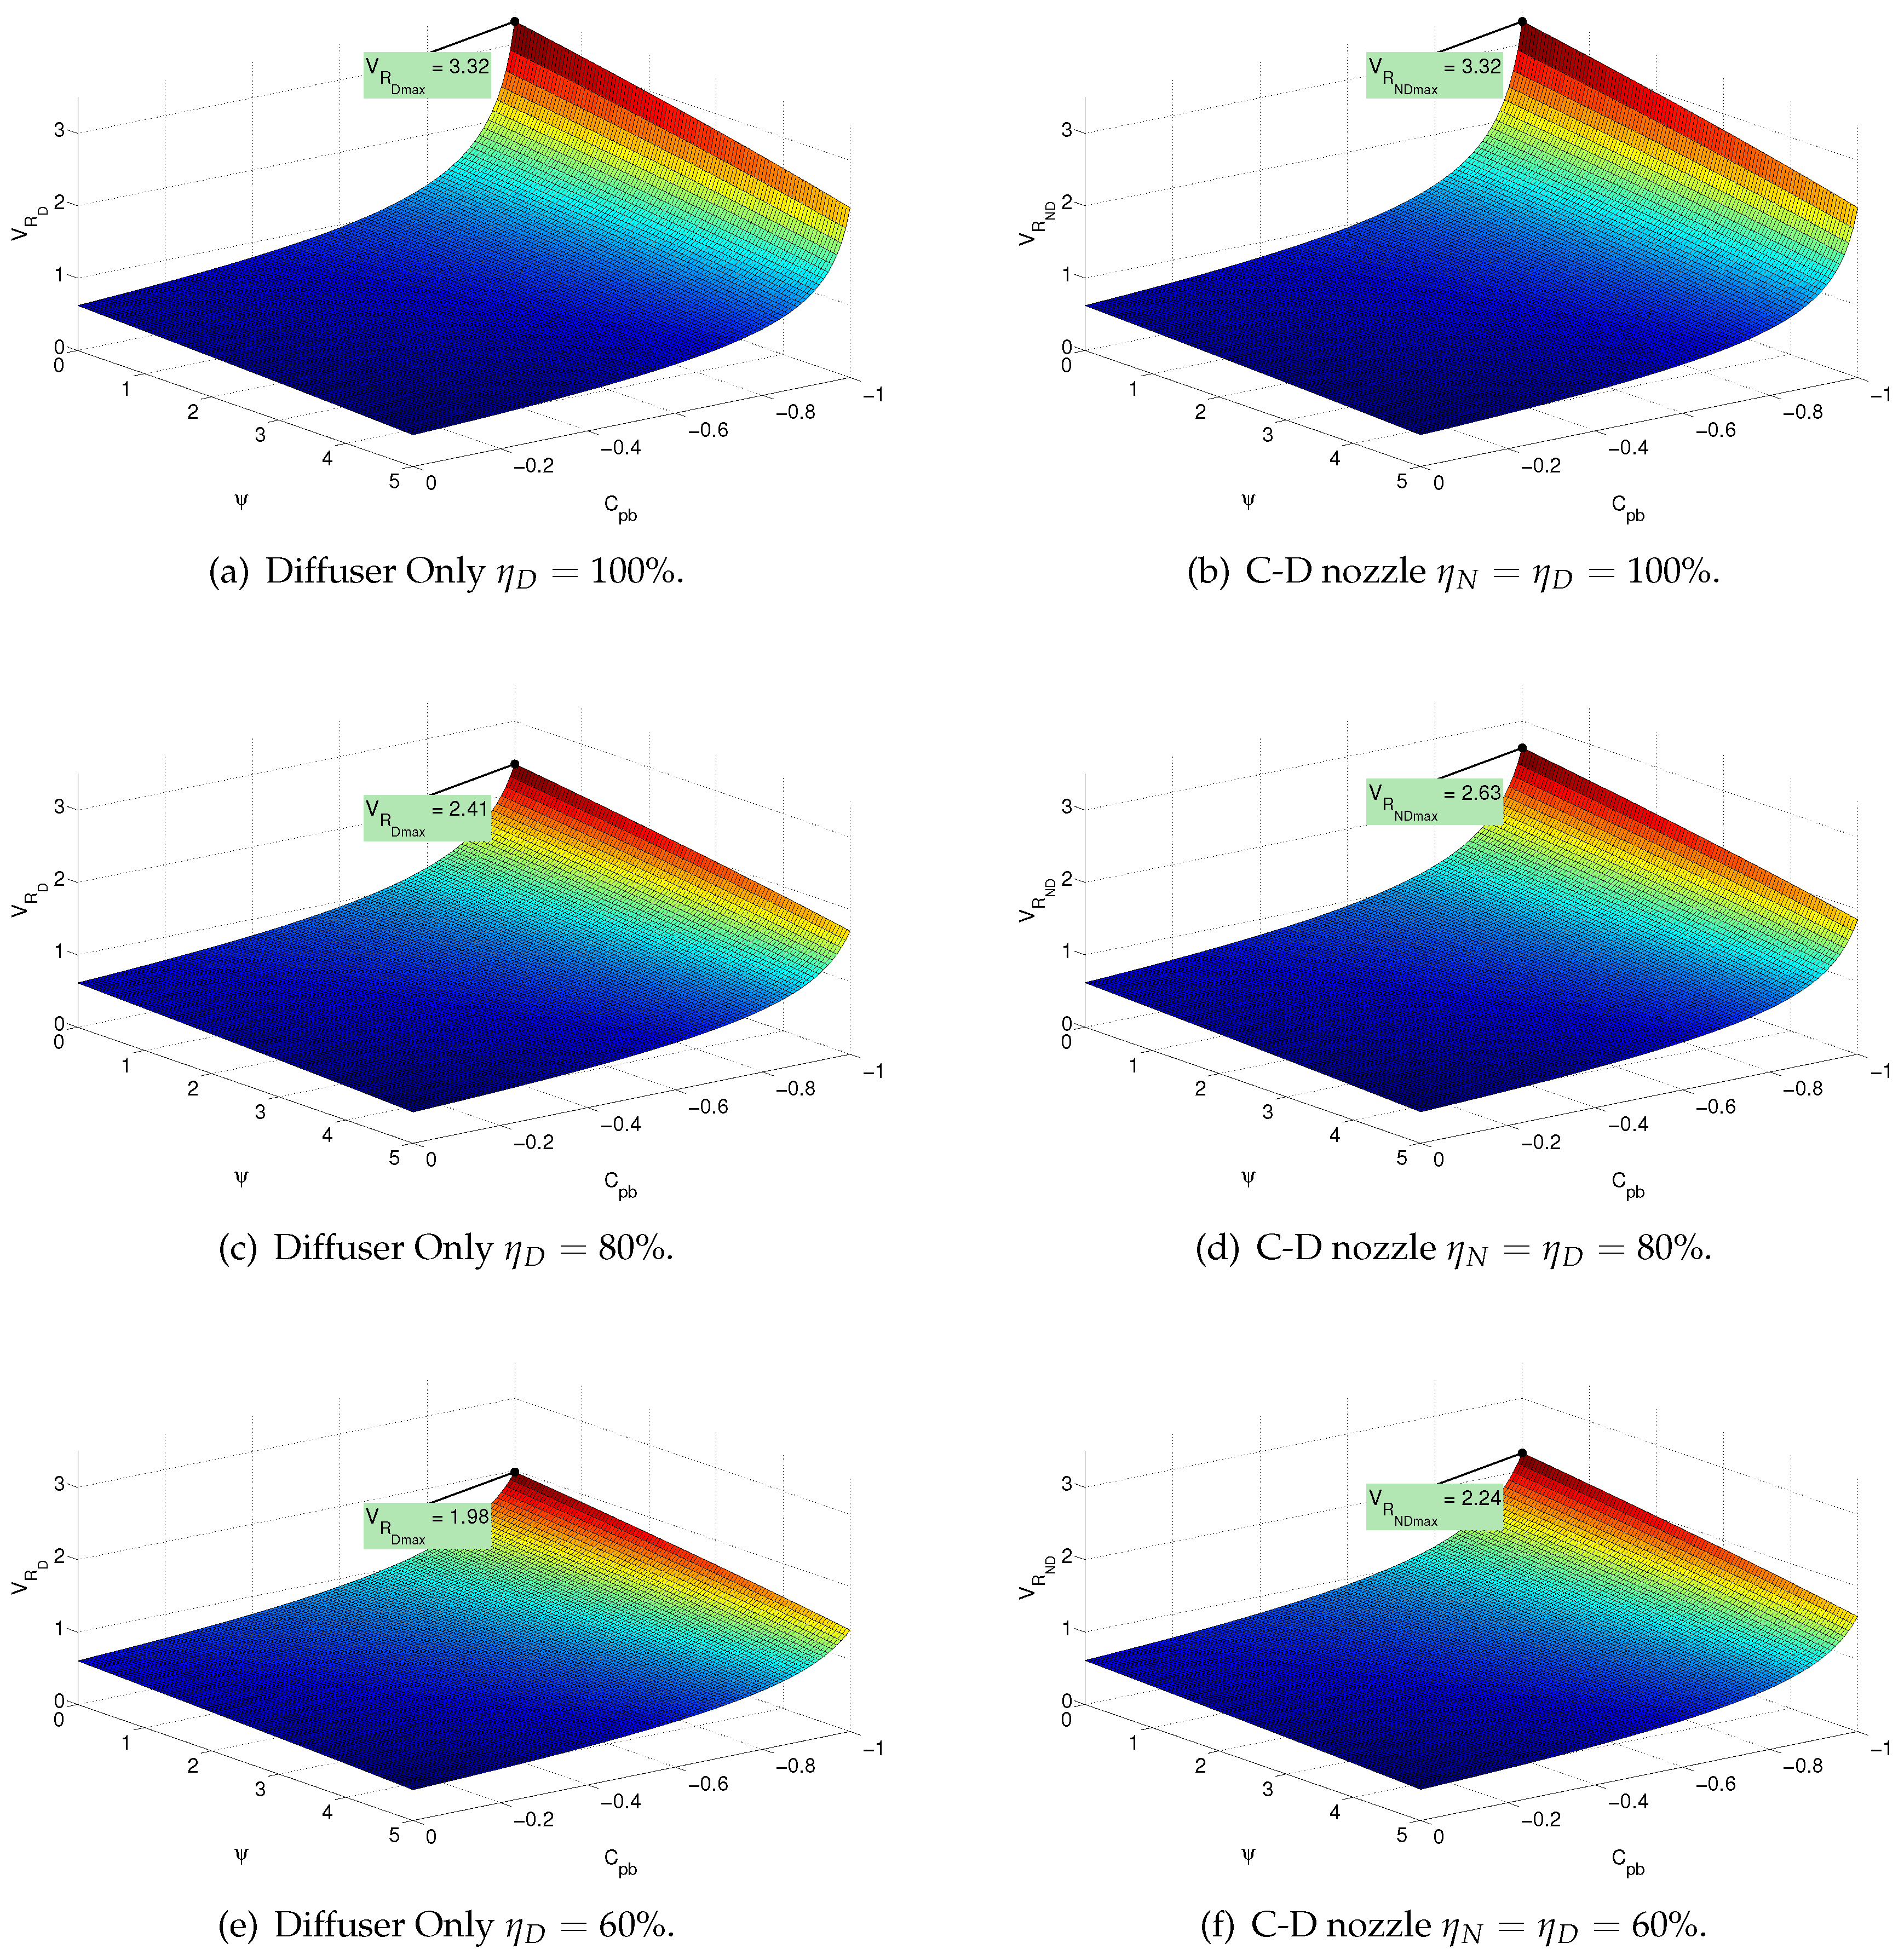
33) allows the relative velocity ratio, V 1 / V , through a shrouded wind turbine with nozzle to be computed as a function of the loading coefficient ψ, the back pressure C p b , as well as diffuser and nozzle efficiencies η D , η N , as illustrated in Figure 10. As can be inferred from Figure 10a, for perfect efficiencies of both the diffuser and nozzle, values above two for the velocity ratio can be obtained. It can also be noticed that higher values are achieved if the the wind turbine is operating at lower loading coefficients and lower back pressures. However, due to flow separation in the diffuser for larger exit areas, values for the back pressure coefficient below 0.7 can likely not be achieved. Similar behavior can also be observed at lower efficiencies, albeit with lower velocity ratios.
In Figure 11a, cross-sectional view of the plots in Figure 10 are shown using C p b = 1 / 3 , which corresponds to the back pressure coefficient for the Betz limit. One can observe how the nozzle and diffuser can increase the velocity ratio above the maximum of one for a bare wind turbine given by Equation (18).
As expected, when the area of the diffuser outlet and nozzle inlet area equal the rotor area Cases (2) and (3), the velocity ratio reduces approximately to one. On the other hand, when both areas of the nozzle inlet and the diffuser outlet are infinite in the limit of no load on the rotor Case (4), the velocity ratio could be theoretically infinite since the convergent-divergent nozzle or shrouded turbine is collecting from and expanding to an infinite area. In practice viscous effects such as flow separation make this behaviour impossible. The figure also shows the effect of the area ratio on the velocity ratio through Cases (6)–(7) for realistic efficiencies. It can be noticed that for values of the loading coefficients less than 0.75 , it is conceivable to obtain higher velocity ratios [7].
Figure 12 provides the effect of the diffuser and nozzle efficiencies, the back pressure, as well as the loading coefficient on the power coefficient based on Equation (36). A significant observation is that the maximum power coefficient occurs at lower loading coefficients than that for the Betz limit of two. For realistic back pressure values, the power coefficient can be much higher than the one for a bare wind turbine of 16 / 27 .
Figure 13 shows cross-sectional views of the plots in Figure 12 using again C p b = 1 / 3 . It is easy to see that for a maximum power extraction for a given turbine blade area, a much more lightly loaded design should be chosen for the ducted case [7] compared to a conventional wind turbine and that the power extraction can be much higher.
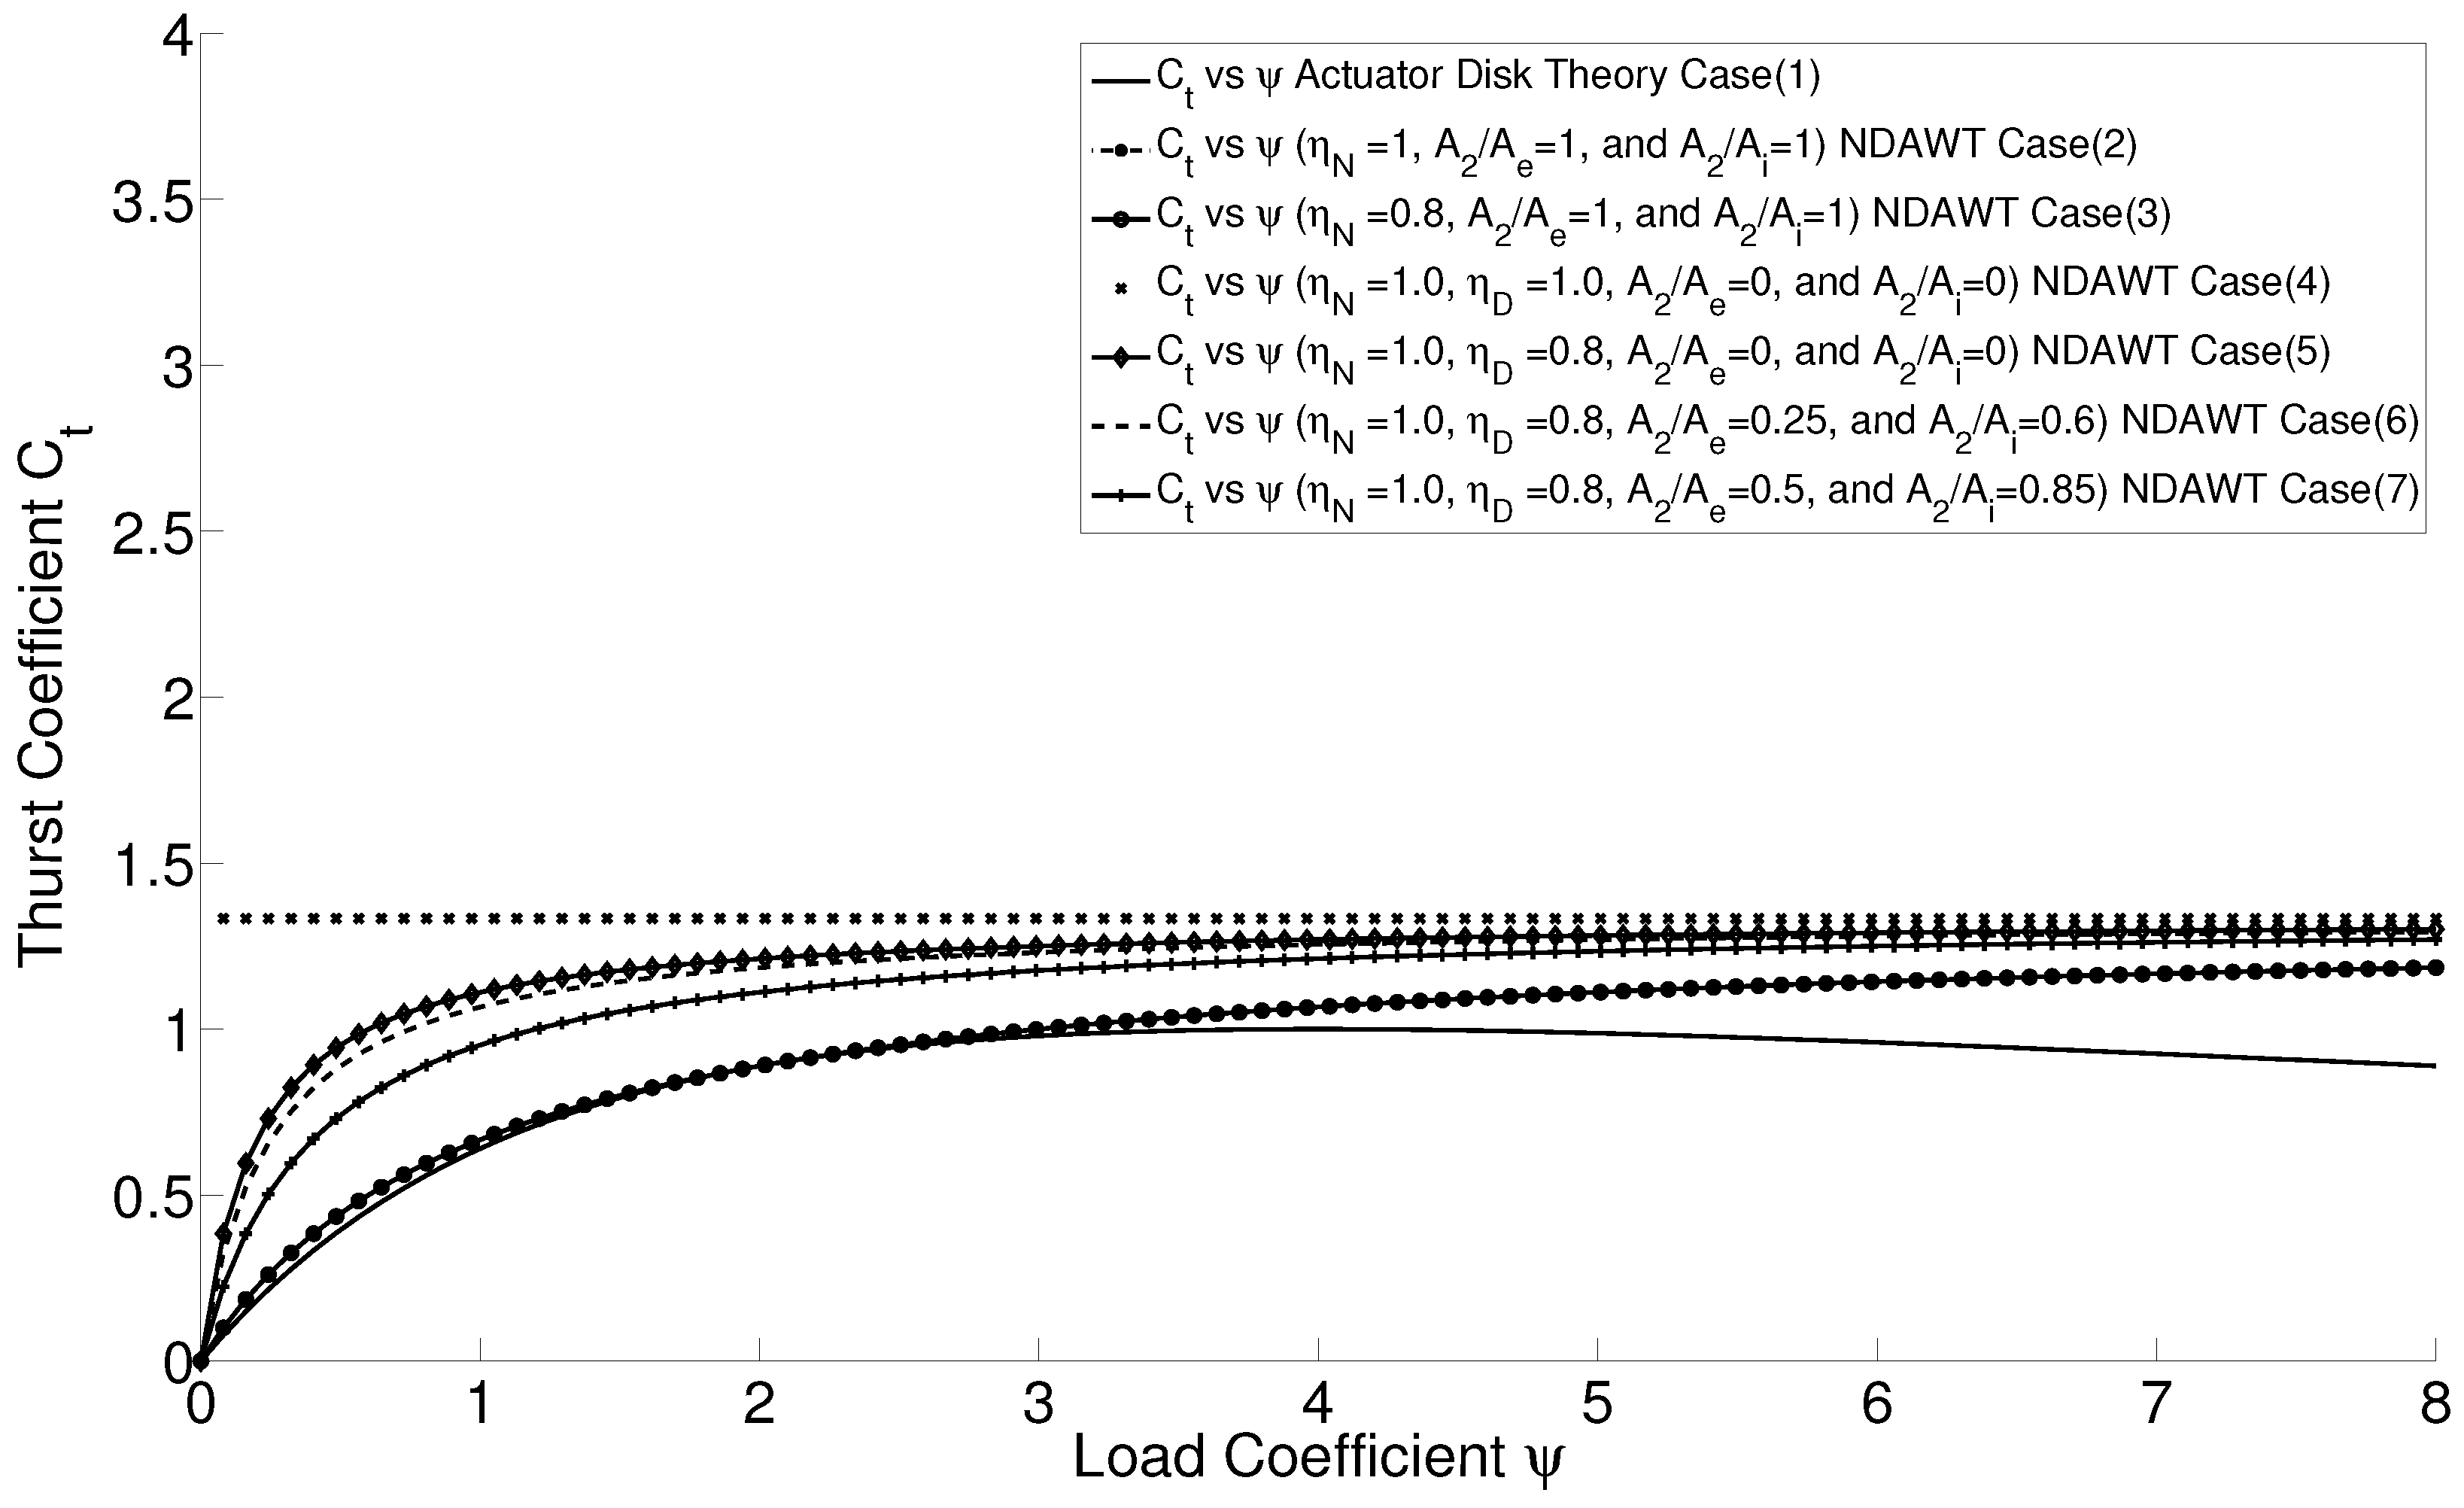
In Figure 14, the thrust coefficient is plotted for different values of the loading coefficient, the back pressure coefficient, as well as the nozzle and diffuser efficiencies η D and η N using Equation (34).
For unrealistic low values of the back pressure of C p b = 1 , Figure 14a shows that for a loading coefficient of ψ = 3 , the thrust coefficient could reach two instead of 8 / 9 , as in the Betz limit. Furthermore, for realistic values of the back pressure of C p b = 0.5 and a loading coefficient of ψ = 0.5 , it can be noticed that the thrust coefficient can be lower than 8 / 9 . This makes sense since one obtains higher velocities at the throat, which lowers the pressure. Therefore, the thrust would be lower, since it is a function of the pressure. Finally, it can be observed through Figure 14a–d that as the efficiencies for both the diffuser and nozzle decrease, the thrust coefficient tends to decrease, as well.
Figure 15 displays cross-sectional views of the plots in Figure 14 using again C p b = 1 / 3 . One should keep in mind that the thrust coefficient is the product of the velocity ratio times the loading coefficient. One can see that in Case (1), the maximum thrust happens at ψ = 2 at a value of 8 / 9 . One can also notice that for infinite values of the nozzle (inlet) and diffuser (outlet) areas Case (4), a maximum thrust coefficient of 1.35 is obtained. Using realistic values of the area ratio in Cases (6) and (7), we see that values higher than 8 / 9 can be experienced by the wind turbine for higher loading coefficients. However, it is also possible to achieve a thrust coefficient lower than 8 / 9 for smaller loading coefficients. The reason to work with a lower thrust coefficient is to obtain higher velocities at the rotor plane and lower pressures at the exit plane [7].
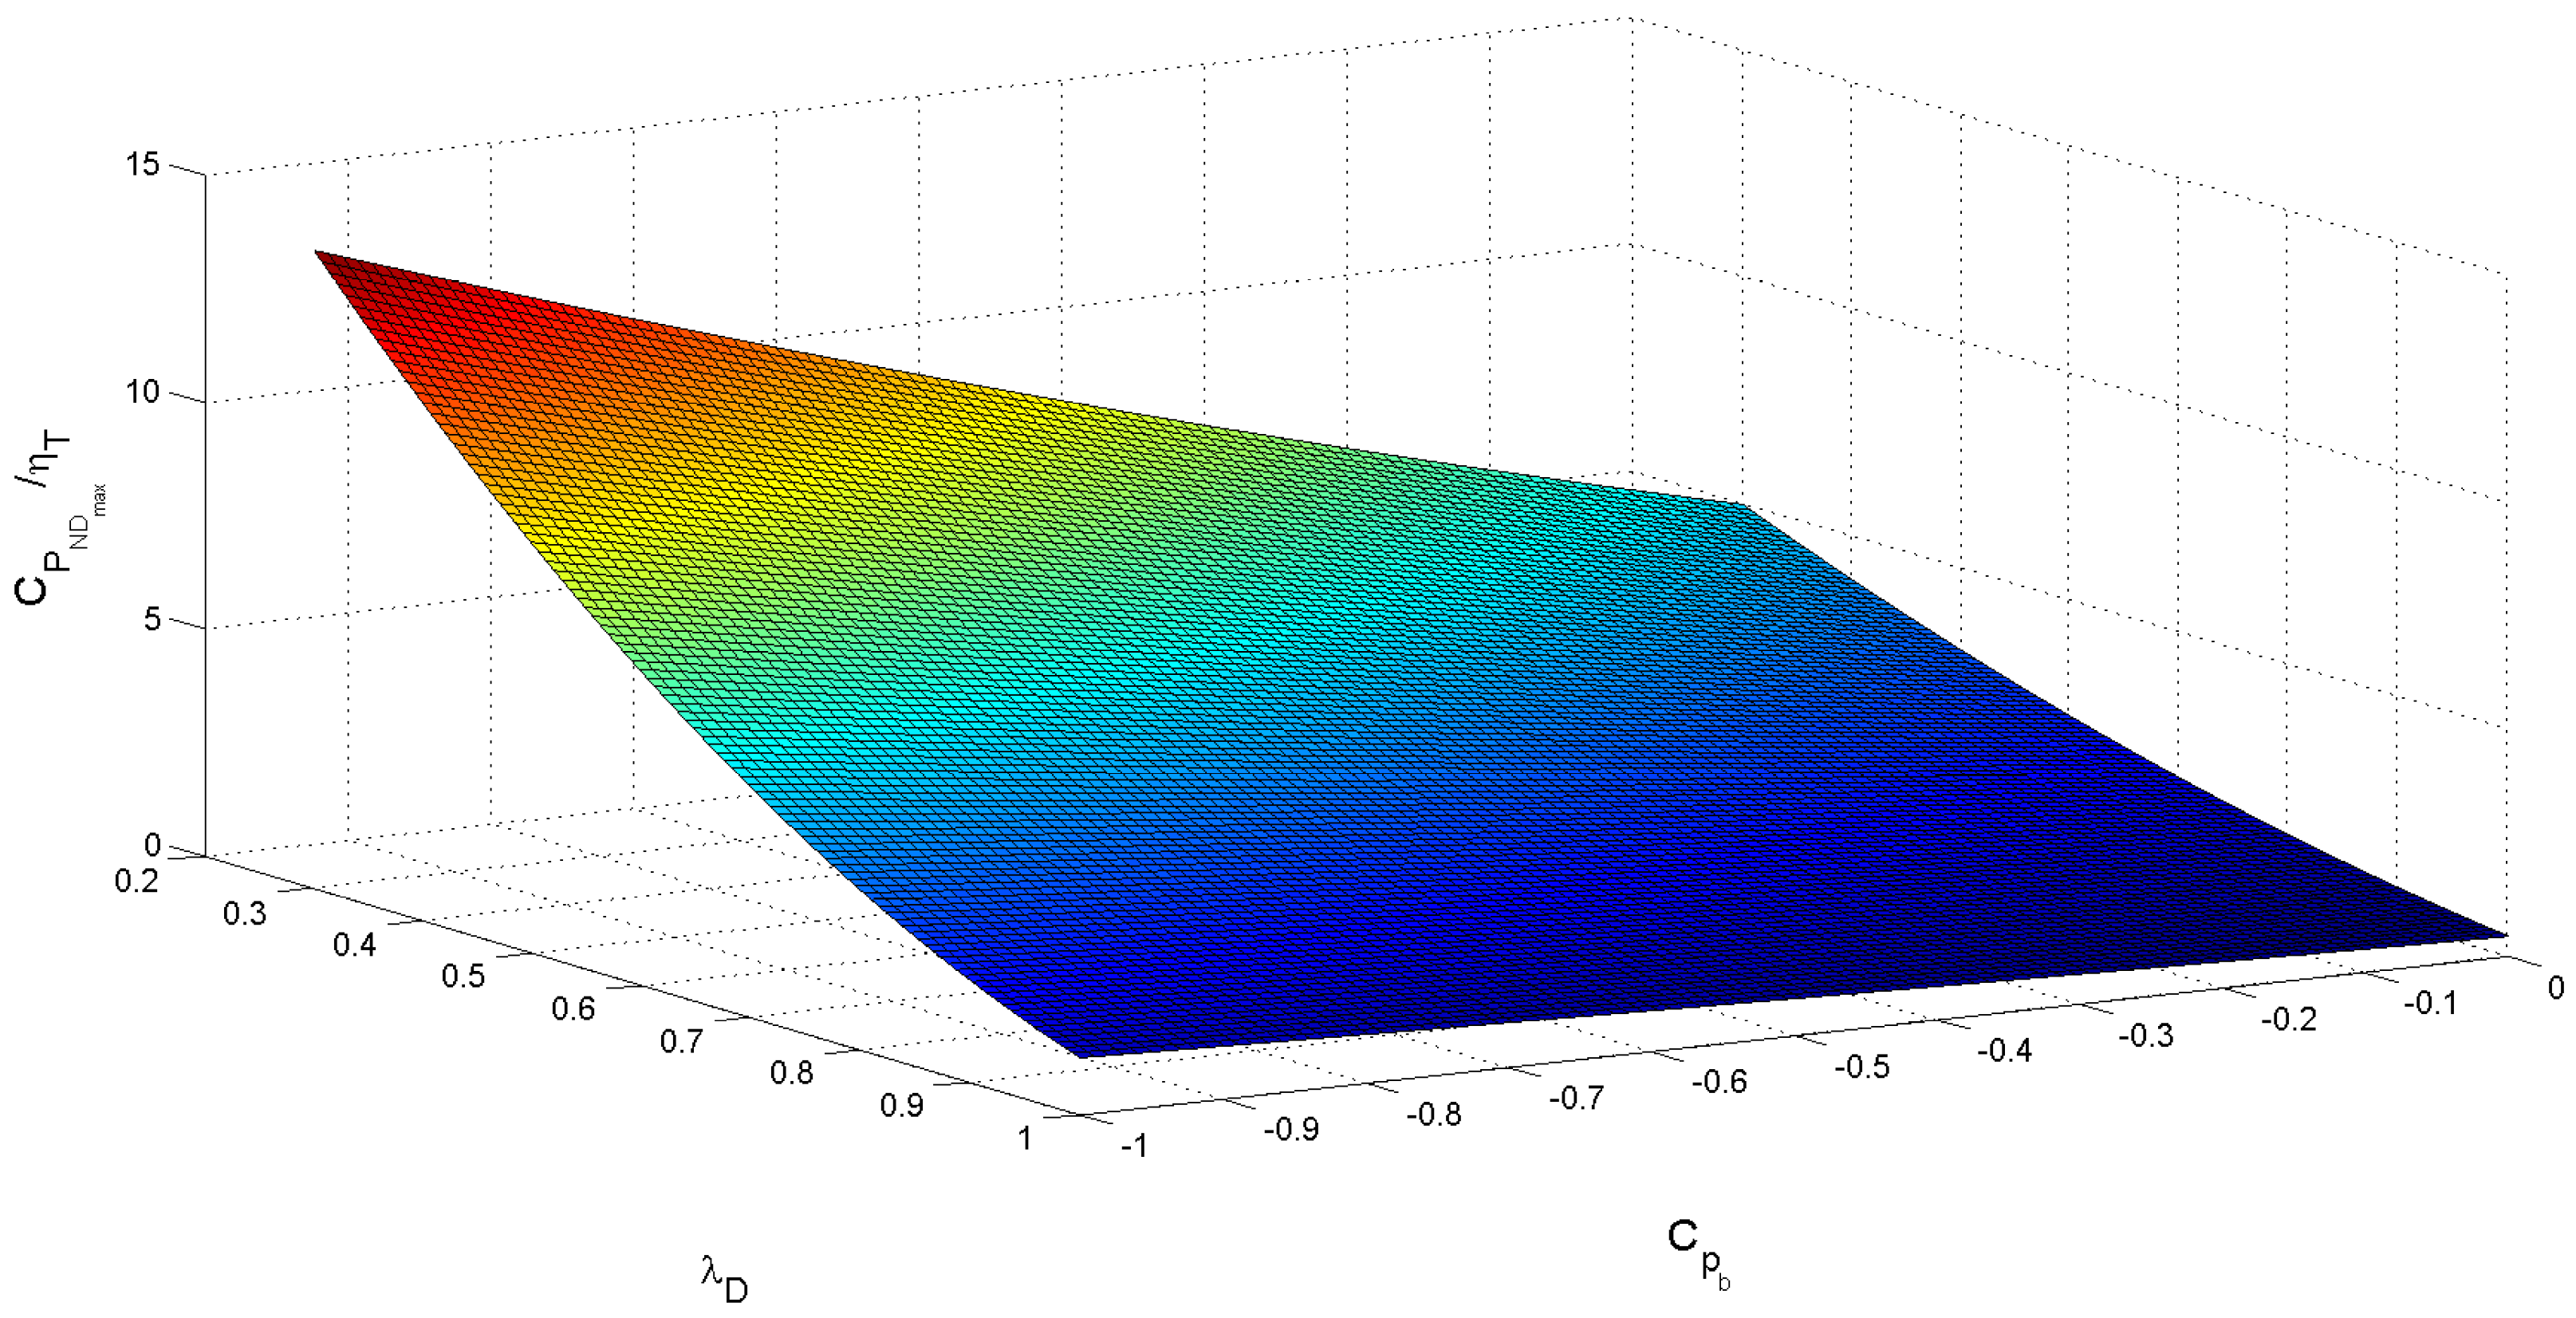
Lastly, for preliminary design purposes, Figure 16 shows how the maximum power coefficient obtained at the optimal loading varies as a function of back pressure and diffuser area ratio. The designer should try to decrease the back pressure and diffuser area ratio as much as possible until viscous effects, such as flow separation, take over and render these results invalid.

7. Conclusions

Numerous theoretical models were examined to predict the flow through shrouded turbines. It was found that some of the theories are only valid for short diffusers or predict incorrect values for certain area ratios due to incorrect assumptions. A more generalized theory based on work by Foreman [1] was developed in this article to be able to incorporate C-D nozzles into the shroud design. The developed generalized one-dimensional momentum theory showed reasonable agreement with experimental field data and CFD results from the literature.
It is evident from the developed equations that the nozzle and diffuser efficiencies, η N and η D , as well as the back pressure coefficient, C p b , have the most significant impact on a nozzle diffuser-augmented wind turbine (NDAWT). Since these coefficients must be empirically determined, the developed generalized one-dimensional theory is, in practice, a semi-empirical theory. However, the theory provides a clear path for the preliminary design of NDAWT geometries, and the design focus should be on maximizing the nozzle and diffuser efficiencies, as well as lowering the back pressure at the diffuser exit with the help of, for example, flanges or brims.
Finally, according to the newly-developed generalized theory, it is shown that larger power coefficients than for conventional wind turbines can be achieved and that the maximum thrust could be higher or lower than that for a conventional wind turbine depending on the loading coefficient at which the shrouded turbine would operate.

Acknowledgments

This research was supported by the Libyan government of higher education. We are thankful to our colleagues Eric Lang and Kevin Hallinan who provided expertise that greatly assisted the research.

Author Contributions

Tariq Abdulsalam Khamlaj conducted the so-called NDAWT theory and wrote the article. Markus Peer Rumpfkeil proposed the idea and supervised the work.

Conflicts of Interest

The authors declare no conflict of interest.

References

  1. Foreman, K.; Gilbert, B.; Oman, R. Diffuser augmentation of wind turbines. Sol. Energy 1978, 20, 305–311. [Google Scholar] [CrossRef]
  2. Betz, A. Energieumsetzungen in venturidüsen. Naturwissenschaften 1929, 17, 160–164. [Google Scholar] [CrossRef]
  3. Lilley, G.; Rainbird, W. A Preliminary Report on the Design and Performance of Ducted Windmills; College of Aeronautics College of Aeronautics Cranfield: Bedfordshire, UK, 1956. [Google Scholar]
  4. Oman, R.; Foreman, K.; Gilbert, B. A progress report on the diffuser augmented wind turbine. In Proceedings of the 3rd Biennal Conference and Workshop on Wind Energy Conversion Systems, Washington, DC, USA, 9–11 June 1975; pp. 819–826.
  5. Hansen, M.O.L.; Sørensen, N.N.; Flay, R. Effect of placing a diffuser around a wind turbine. Wind Energy 2000, 3, 207–213. [Google Scholar] [CrossRef]
  6. Ohya, Y.; Karasudani, T. A shrouded wind turbine generating high output power with wind-lens technology. Energies 2010, 3, 634–649. [Google Scholar] [CrossRef]
  7. Lawn, C. Optimization of the power output from ducted turbines. Proc. Inst. Mech. Eng. Part A J. Power Energy 2003, 217, 107–117. [Google Scholar] [CrossRef]
  8. Van Bussel, G.J. The Science of Making More Torque from Wind: Diffuser Experiments and Theory Revisited; IOP Publishing: Bristol, UK, 2007; Volume 75, p. 012010. [Google Scholar]
  9. Jamieson, P. Generalized limits for energy extraction in a linear constant velocity flow field. Wind Energy 2008, 11, 445–457. [Google Scholar] [CrossRef]
  10. Werle, M.J.; Presz, W.M. Ducted wind/water turbines and propellers revisited. J. Propuls. Power 2008, 24, 1146–1150. [Google Scholar] [CrossRef]
  11. Konijn, F.B.J.; Hoeijmakers, H.W.M. One Dimensional Flow Theory for Diffuser Augmented Wind Turbines; University of Twente: Enschede, The Netherlands, 2010; Volume 217, p. 9. [Google Scholar]
  12. Bergey, K. The Lanchester-Betz limit (energy conversion efficiency factor for windmills). J. Energy 1979, 3, 382–384. [Google Scholar] [CrossRef]
  13. Okulov, V.L.; van Kuik, G.A. The Betz–Joukowsky limit: On the contribution to rotor aerodynamics by the british, german and russian scientific schools. Wind Energy 2012, 15, 335–344. [Google Scholar] [CrossRef]
  14. Jamieson, P. Innovation in Wind Turbine Design; John Wiley & Sons: Hoboken, NJ, USA, 2011. [Google Scholar]
  15. Manwell, J.F.; McGowan, J.G.; Rogers, A.L. Wind Energy Explained: Theory, Design and Application; John Wiley & Sons: Hoboken, NJ, USA, 2010. [Google Scholar]
  16. Fox, R.W.; McDonald, A.; Pitchard, P. Introduction to Fluid Mechanics; John Wiley: Hoboken, NJ, USA, 2004. [Google Scholar]
  17. Phillips, D.G. An Investigation on Diffuser Augmented Wind Turbine Design. Ph.D. Thesis, ResearchSpace@ Auckland, University of Auckland, Auckland, New Zealand, 2003. [Google Scholar]
  18. Hansen, M.O. Aerodynamics of Wind Turbines; Routledge: London, UK, 2015. [Google Scholar]
Figure 1. Stream tube passing through a shrouded wind turbine with nozzle and diffuser.
Energies 10 00038 g001
Figure 2. Wind turbine equipped with a brimmed diffuser [6].
Energies 10 00038 g002
Figure 3. Power and thrust coefficients of the NDAWT using the data in Table 2 and in comparison with a bare wind turbine.
Energies 10 00038 g003
Figure 4. Comparison between the theoretical and experimental results [6] for the NDAWT and bare wind turbine.
Energies 10 00038 g004
Figure 5. The duct shape used in Hansen’s study [18].
Energies 10 00038 g005
Figure 6. Theoretical calculations compared to the CFD results by Hansen et al. [5].
Energies 10 00038 g006
Figure 7. The effect of the pressure and loading coefficients on the velocity distribution of diffuser only and and converging-diverging (C-D) nozzle.
Energies 10 00038 g007
Figure 8. The effect of the pressure and loading coefficients on the power coefficient of diffuser only and C-D nozzle.
Energies 10 00038 g008aEnergies 10 00038 g008b
Figure 9. The effect of the pressure and loading coefficients on the thrust coefficient of diffuser only and C-D nozzle.
Energies 10 00038 g009aEnergies 10 00038 g009b
Figure 10. Plot of relative velocity ratios using D i = 0.76 m, D 1 = 0.7 m and D e = 1.072 m for different efficiencies using Equation (33).
Energies 10 00038 g010
Figure 11. Cross-sectional view of the relative velocity ratio at C p b = 1 / 3 .
Energies 10 00038 g011
Figure 12. Plot of power coefficient using D i = 0.76 m, D 1 = 0.7 m, and D e = 1.072 m for different efficiencies using Equation (36).
Energies 10 00038 g012
Figure 13. Cross-sectional view of the power coefficient at C p b = 1 / 3 .
Energies 10 00038 g013
Figure 14. Plot of thrust coefficient using D i = 0.76 m, D 1 = 0.7 m and D e = 1.072 m for different efficiencies using Equation (34).
Energies 10 00038 g014
Figure 15. Cross-sectional view of the thrust coefficient at C p b = 1 / 3 .
Energies 10 00038 g015
Figure 16. The maximum power coefficient as a function of back pressure and diffuser area ratio.
Energies 10 00038 g016
Table 1. Summary results of bare wind turbine and the current method. NDAWT, nozzle diffuser-augmented wind turbine.
ParameterBare Wind TurbineNDAWT
Upstream wind speed V V
Wind speed at rotor plane V · 4 ψ + 4 V · 1 C p b ψ + η N + λ N 2 1 η N η D 1 λ D 2
Far wake wind speed V · 4 ψ ψ + 4 V · C p b + λ D 2 V 1 2 V 2
Power coefficient C P 64 ψ ψ + 4 3 ψ 1 C p b ψ + η N + λ N 2 1 η N η D 1 λ D 2 3 2
Thrust coefficient C t 16 ψ ψ + 4 2 ψ 1 C p b ψ + η N + λ N 2 1 η N η D 1 λ D 2
Table 2. Parameters of a shrouded wind turbine with a brim [6].
ParameterValue
Turbine diameter D0.7 m
Diffuser diameter D e 1.072 m
Nozzle diameter D N 0.78 m
Diffuser length L t 1.029 m
The brim height h0.35 m
Density ρ1.225 kg/m 3
The back pressure of the diffuser C p b −0.6
The nozzle efficiency η N 85 %
The diffuser efficiency η D 85 %

