1. Introduction
The household sector in the European Union (EU), EU28, accounted for almost 25% of the final energy consumption in 2014 and around 22% in Sweden [
1]. As the European population is estimated to continue to grow, there is a risk that the final energy consumption will grow more than needed and that this might negatively affect the targets of the EU 2030 energy strategy [
2]. To counteract such a development, the EU has introduced the Energy Performance of Buildings Directive (EPBD) and the Energy Efficiency Directive (EED). All member countries are bound by legislation to implement the EPBD in their national regulations no later than 2020. In Sweden, a first proposal has been sent to the government from the Swedish National Board of Housing, Building and Planning and has been out for consultation to public authorities, universities, and the business community. It is yet to become a binding regulation.
In the EPBD, there is some focus on decentralized energy generation (DEG), and in Sweden there are several incentive programs in effect for one particular DEG technology, photovoltaic (PV) systems.
1.1. Current Swedish Incentive Schemes for Decentralized Energy Generation (DEG) Systems
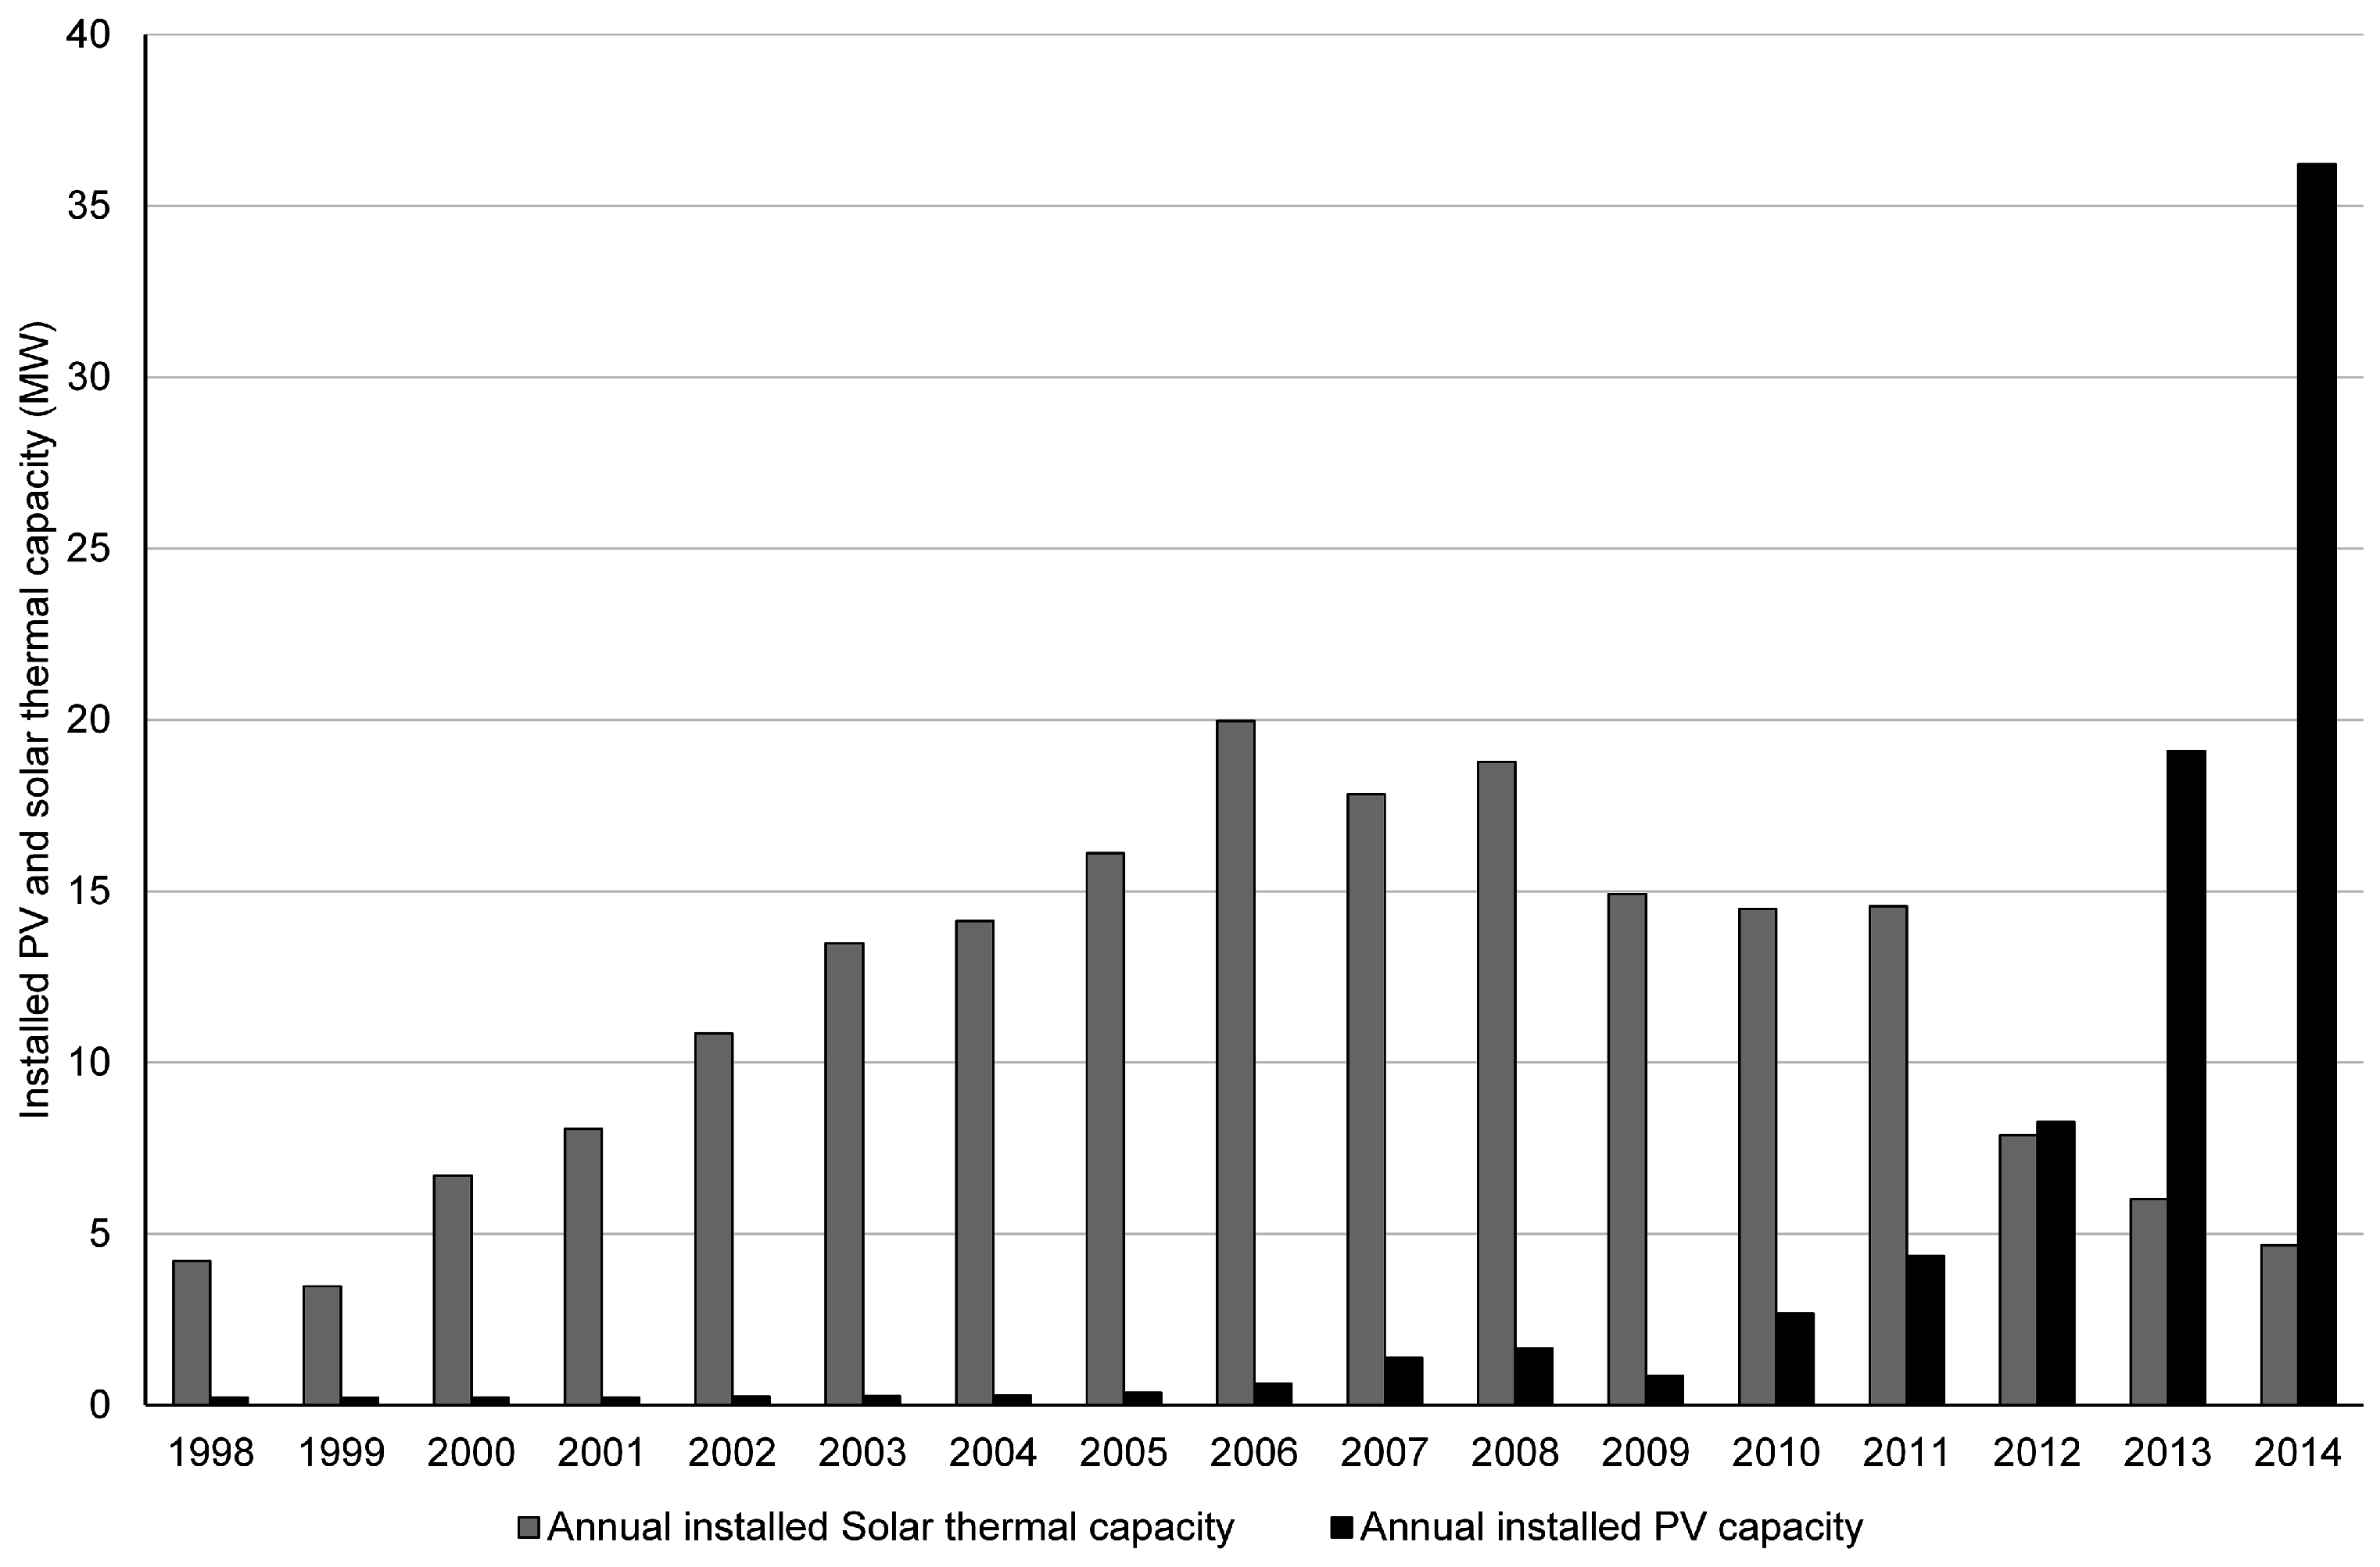
There is a stated ambition by the Swedish government to support a strong development of DEG in the form of PV systems, and all incentives for PV systems are designed to increase the installation rate.
This has been done as one part of the Swedish ambitions to rely solely on renewables for Swedish electricity generation in 2036.
Currently, three different support systems for DEG are active in Sweden. The investment cost incentive, implemented in 2009, gives 20% and 30% of the total PV-system incentive cost for private consumers and for commercial actors, respectively. The investment cost support is limited to a maximum of 133,000 €.
The second incentive, implemented in 2015, is the tax deduction system, which grants PV system owners a deduction on their taxes equivalent to ~0.07 € for every kWh of PV electricity—up to 30,000 kWh a year—that is fed into the electricity grid and sold. This incentive applies for all, as long as the main fuse is 100 A or smaller.
The third incentive, implemented in 2016, is a battery system investment cost incentive and only applies if the private consumer has a PV system. It gives 60% of the investment cost, up to a maximum of 5600 €. The current growth trend for PV and solar thermal (ST) systems indicates that the Swedish incentive schemes, implemented in 2009, 2015, and 2016, have had some effect. The annual capacity growth can be found in
Figure 1.
1.2. Current Swedish Building Regulations
The current Swedish building regulation is based on purchased energy and is calculated as described in Equation (1).
where
Espec is building specific energy demand;
Eheating is purchased energy used for heating;
EDHW is purchased energy used for domestic hot water (DHW);
Ecooling is purchased energy used for cooling;
Eelec, building services is purchased electricity used for building services (e.g., fans, pumps etc.), and
Atemp is floor area heated to more than 10 °C.
The required levels to meet are 90 kWh/m2 tempered area for buildings heated with forms of energy other than that of electricity, and 55 kWh/m2 tempered area for buildings heated with electricity (e.g., heat pumps). The household electricity of the tenants is not included in the specific energy demand of the building.
1.3. Earlier Research
Earlier research in this area has focused on assessment and experience of the EPBD in other European countries that have already implemented the EPBD in its building regulations. In Greece, one of the lessons learned was to start early, with development of software tools for energy performance calculations to avoid inconsistencies in different assumptions [
4]. In an Italian study, near-zero-energy (NZE) buildings in the Lombardy region were analyzed with regards to how the implementation of the EPBD has affected the evolution of energy efficiency in buildings and what design choices are implemented in NZE buildings in the region [
5]. A comparison between Greece and the Netherlands indicates that the implementation of the regulations is low due to different causes, including external influences [
6]. Several studies have focused on one or several cases on NZE buildings in accordance with the EPBD. A German study showed large differences between simulated and monitored values, and one reason for this was related to usage patterns of the building [
7]. A study conducted on several newly built Dutch buildings indicates that the EPBD requirements are rarely met [
8]. On reason, according to the study, is that low-energy buildings are regarded as costlier than conventional buildings. Also, research regarding NZE refurbishment of buildings has increased in recent years. A Spanish study analyzed different refurbishment schemes for a Spanish building [
9]. The result indicates that economic incentives in Spain are not enough to reduce the gap between energy savings and cost in the optimal solution. In Denmark, an old multifamily building was renovated to fulfill the NZE building’s requirements [
10]. The theoretical result showed a decrease in energy usage by 68%, from 162.5 kWh/m
2/year to 51.5 kWh/m
2/year. A review of the research focused on improving energy efficiency in buildings concluded that recent research focus has shifted from windows, shading, and the building envelope towards the heating, ventilation and air conditioning (HVAC) system of buildings [
11].
Research with a focus on cost-effective solutions in NZE buildings has been found in [
12]. The conclusion of the work conducted in [
12] is that ground source heat pumps with free cooling (i.e., ground source heating and cooling, GSHP) is the most optimal solution in regards to economics. This is, however, contradicted by another study where a bio-boiler solution is most cost optimal [
13]. In [
14], one of the conclusions was that a large PV system is needed to achieve the NZE building requirements with and without a heat pump.
However, research regarding how different solar-assisted heating systems affect the energy performance of buildings is scarce. Some research regarding this can be found in [
3] and the appended articles, where different PV-assisted heat pump systems were analyzed in a one-family building in regards to the proposed new Swedish building regulation that is adapted to conform with the EPBD. The results indicate challenges when it comes to assumptions on how the PV electricity should be counted in the energy performance of the building. As presented earlier in this section, there is a knowledge gap regarding how the proposed Swedish building regulations, adapted to the EPBD, handle different solar-assisted heating systems in regards to how the energy performance of buildings is affected by the different systems.
All the above reasons make it interesting to analyze how different solar-assisted heating systems affect the energy performance of buildings and, in this case, multifamily buildings (as defined in the Swedish proposal for new regulations). Also, it is interesting to analyze if the Swedish incentive schemes affect the choice of the DEG system and if that choice is best in terms of constructing buildings to be as energy efficient as possible in regards to the Swedish EPB directive targets proposal. In addition, it is also interesting to analyze how a Swedish support scheme for DEGs should be constructed in order to increase the EPB directives effect in Sweden for the most common types of heating systems in Sweden. The following research questions (RQs) will be answered in this article:
RQ1: How do the different combinations of DEGs and heating systems affect the energy performance of buildings?
RQ 2: Do the different incentives schemes in Sweden affect the choice of DEG system, and if so, how does it affect the energy performance of buildings?
RQ3: Is it necessary to modify the Swedish incentive schemes for DEG, and if so, how should they be modified in order to increase the effectiveness of the EPBD-adapted building regulations in buildings with the most common types of Swedish heating systems?
2. Materials and Methods
The analysis is based on transient simulations in TRNSYS version 17 [
15], and the simulation model is a highly modified version of the simulation model developed in [
16,
17] and further enhanced in [
18]. The model has the following main systems: a multifamily building, main heating system, ventilation system, and DEG system.
Four different models with different heating and DEG systems, presented in
Table 1, have been simulated and analyzed.
2.1. Proposed New Swedish Building Regulations Adapted to the Energy Performance of Buildings Directive (EPBD)
Earlier building regulations in Sweden have focused on purchased energy, and the proposed new building regulations have the same focus. The only difference is that, before, there were two different requirements for buildings, depending on whether they were heated with electricity or heated with other forms of energy. This has changed in the proposal and, instead, weighing factors have been introduced. The calculation for the specific energy demand of the building is presented in Equation (2) [
19].
where
Espec is building specific energy demand;
Eelec, heating is purchased electricity used for heating;
Eelec, DHW is purchased electricity used for domestic hot water (DHW);
Eelec, cooling is purchased electricity used for cooling;
Eelec, building services is purchased electricity used for building services (e.g., fans, pumps, etc.);
Eheating is purchased energy other than electricity used for heating;
EDHW is purchased energy other than electricity used for DHW;
Ecooling is purchased energy other than electricity used for cooling; and
Atemp is floor area heated to more than 10 °C.
All parameters have the unit kWh/year except Atemp, which has the unit m2, giving Espec the unit kWh/m2/year.
As can be seen in Equation (1), there is one weighing factor of 2.5 for purchased electricity used for heating, cooling, and DHW, which means that every purchased kWh of electricity for the aforementioned usages is counted as 2.5 kWh in the specific energy demand of the building. Two other unexpressed weighing factors are also part of the equation; namely, 1 for purchased electricity used for building services and for purchased fuel or other purchased energy used for heating, cooling, and DHW, and 0 for electricity used for appliances and lighting.
The weighing factor, 2.5, is based on tests performed on exhaust air heat pumps by the Swedish energy agency, which indicated that the seasonal coefficient of performance (SCOP) for this type of heat pump is around 2.5 [
19]. Energy from DEG systems used in the building is not taken into account in the proposed regulations, and, therefore, this energy reduces the specific energy demand.
The required level of the specific energy demand of a multifamily building is 55 kWh/m2/year or lower.
2.2. Simulated Building
The simulated building is based on a real, deep refurbished building in the Swedish town of Eskilstuna. It has 24 apartments in 3 stories above ground and has a tempered floor area of 3331 m
2. It does not fulfil the proposed requirements as specified in the Swedish proposal for new building regulations, but the simulation model has been modified to do so. Total energy demand of the building divided between (1) heating (heat losses) and DHW and (2) building services is presented in
Table 2.
In TRNSYS, the building is simulated by type 56 and is modeled in accordance with the real building briefly described earlier in this section. However, the simulated building consists of only one large zone in order to simplify and speed up the simulations.
The set-point temperatures for the indoor temperature are 21 °C and 17 °C for the supply air from the ventilation system. The heating system is designed to supply 45 °C to the radiator system at −21 °C. The U-value of the different parts of the building envelope is presented in
Table 3.
2.3. Technical Installations
The building in its different versions is equipped with either (1) district heating and a solar thermal system or a PV system or (2) a GSHP and a solar thermal system or PV system. All versions are equipped with a heat recovery ventilation system (HRV).
2.3.1. Ground Source Heat Pump (GSHP) System
The GSHP has a heating capacity of 200 kW and a rated power consumption of 40 kW. The borehole system consists of 15 boreholes all connected in parallel with a depth of 220 m, which gives a total depth of 3300 m. In TRNSYS, type 927 is used to model the heat pump. It is a model based on user-supplied normalized catalog data on heating capacity and power demand as functions of entering source and load fluid temperatures. With the given normalized catalog data, it is easy to calculate coefficient of performance (COP), outlet source, and load fluid temperatures. An advantage with normalized catalog data is that it is possible to increase or decrease the heat pump size in an easy way.
2.3.2. Heat Recovery Ventilation (HRV) System
The HRV system consists of a rotary heat exchanger, which exchanges heat between the exhaust air from the building and fresh air from outside the building, and an exhaust and fresh air fan. The rated power of the HRV system is 1.2 kW and it has a heat exchange efficiency of 80%. The ventilation flow is 0.35 L/s/m2 floor area, which is in accordance with the current Swedish building regulations.
In TRNSYS, type 760 is used to model the heat exchanger, and this type uses an effectiveness—minimum capacitance approach, which means that the minimum capacitance air stream is calculated, and then the sensible energy transfer at the minimum capacitance air stream is calculated.
2.3.3. Photovoltaic (PV) System
The PV system is tilted 45° from the horizontal and directed to the south. This is close to the optimal tilt in Sweden and at the building location. In TRNSYS, the PV system is modeled using type 194, which is a five-parameter model that calculates current and power at a specified voltage. The size of the PV systems is varied in the calculations, between 10 and 200 kWp. This gives an annual yield of electricity in the Swedish location of about 9000–180,000 kWh.
2.3.4. Solar Thermal System
As is the case for the PV system, the solar thermal system is directed to the south and tilted 45° from the horizontal. In TRNSYS, the system is modeled using type 539 flat-plate collectors. In the calculations, the solar thermal systems’ size is varied between 34 and 285 m2, which gives an annual yield of thermal energy for the Swedish location of about 13,400–114,000 kWh.
2.3.5. Domestic Hot Water (DHW) Tank
The DHW tank volume is fixed, to 3 m3, for all systems and solar thermal system sizes.
If the tank were to be sized according to the largest simulated solar thermal system in this article, the tank would have to be 28 m3. The size of the tank has not been sized to fit all analyzed solar thermal system sizes. This is a limitation to the analysis, but also a conscious choice. This has been done in order to recharge the borehole system with a large fraction of the solar thermal energy and achieve a higher SCOP of the GSHP.
2.4. Systems Descriptions
In this section, four different systems are simulated and control strategies for all systems are described.
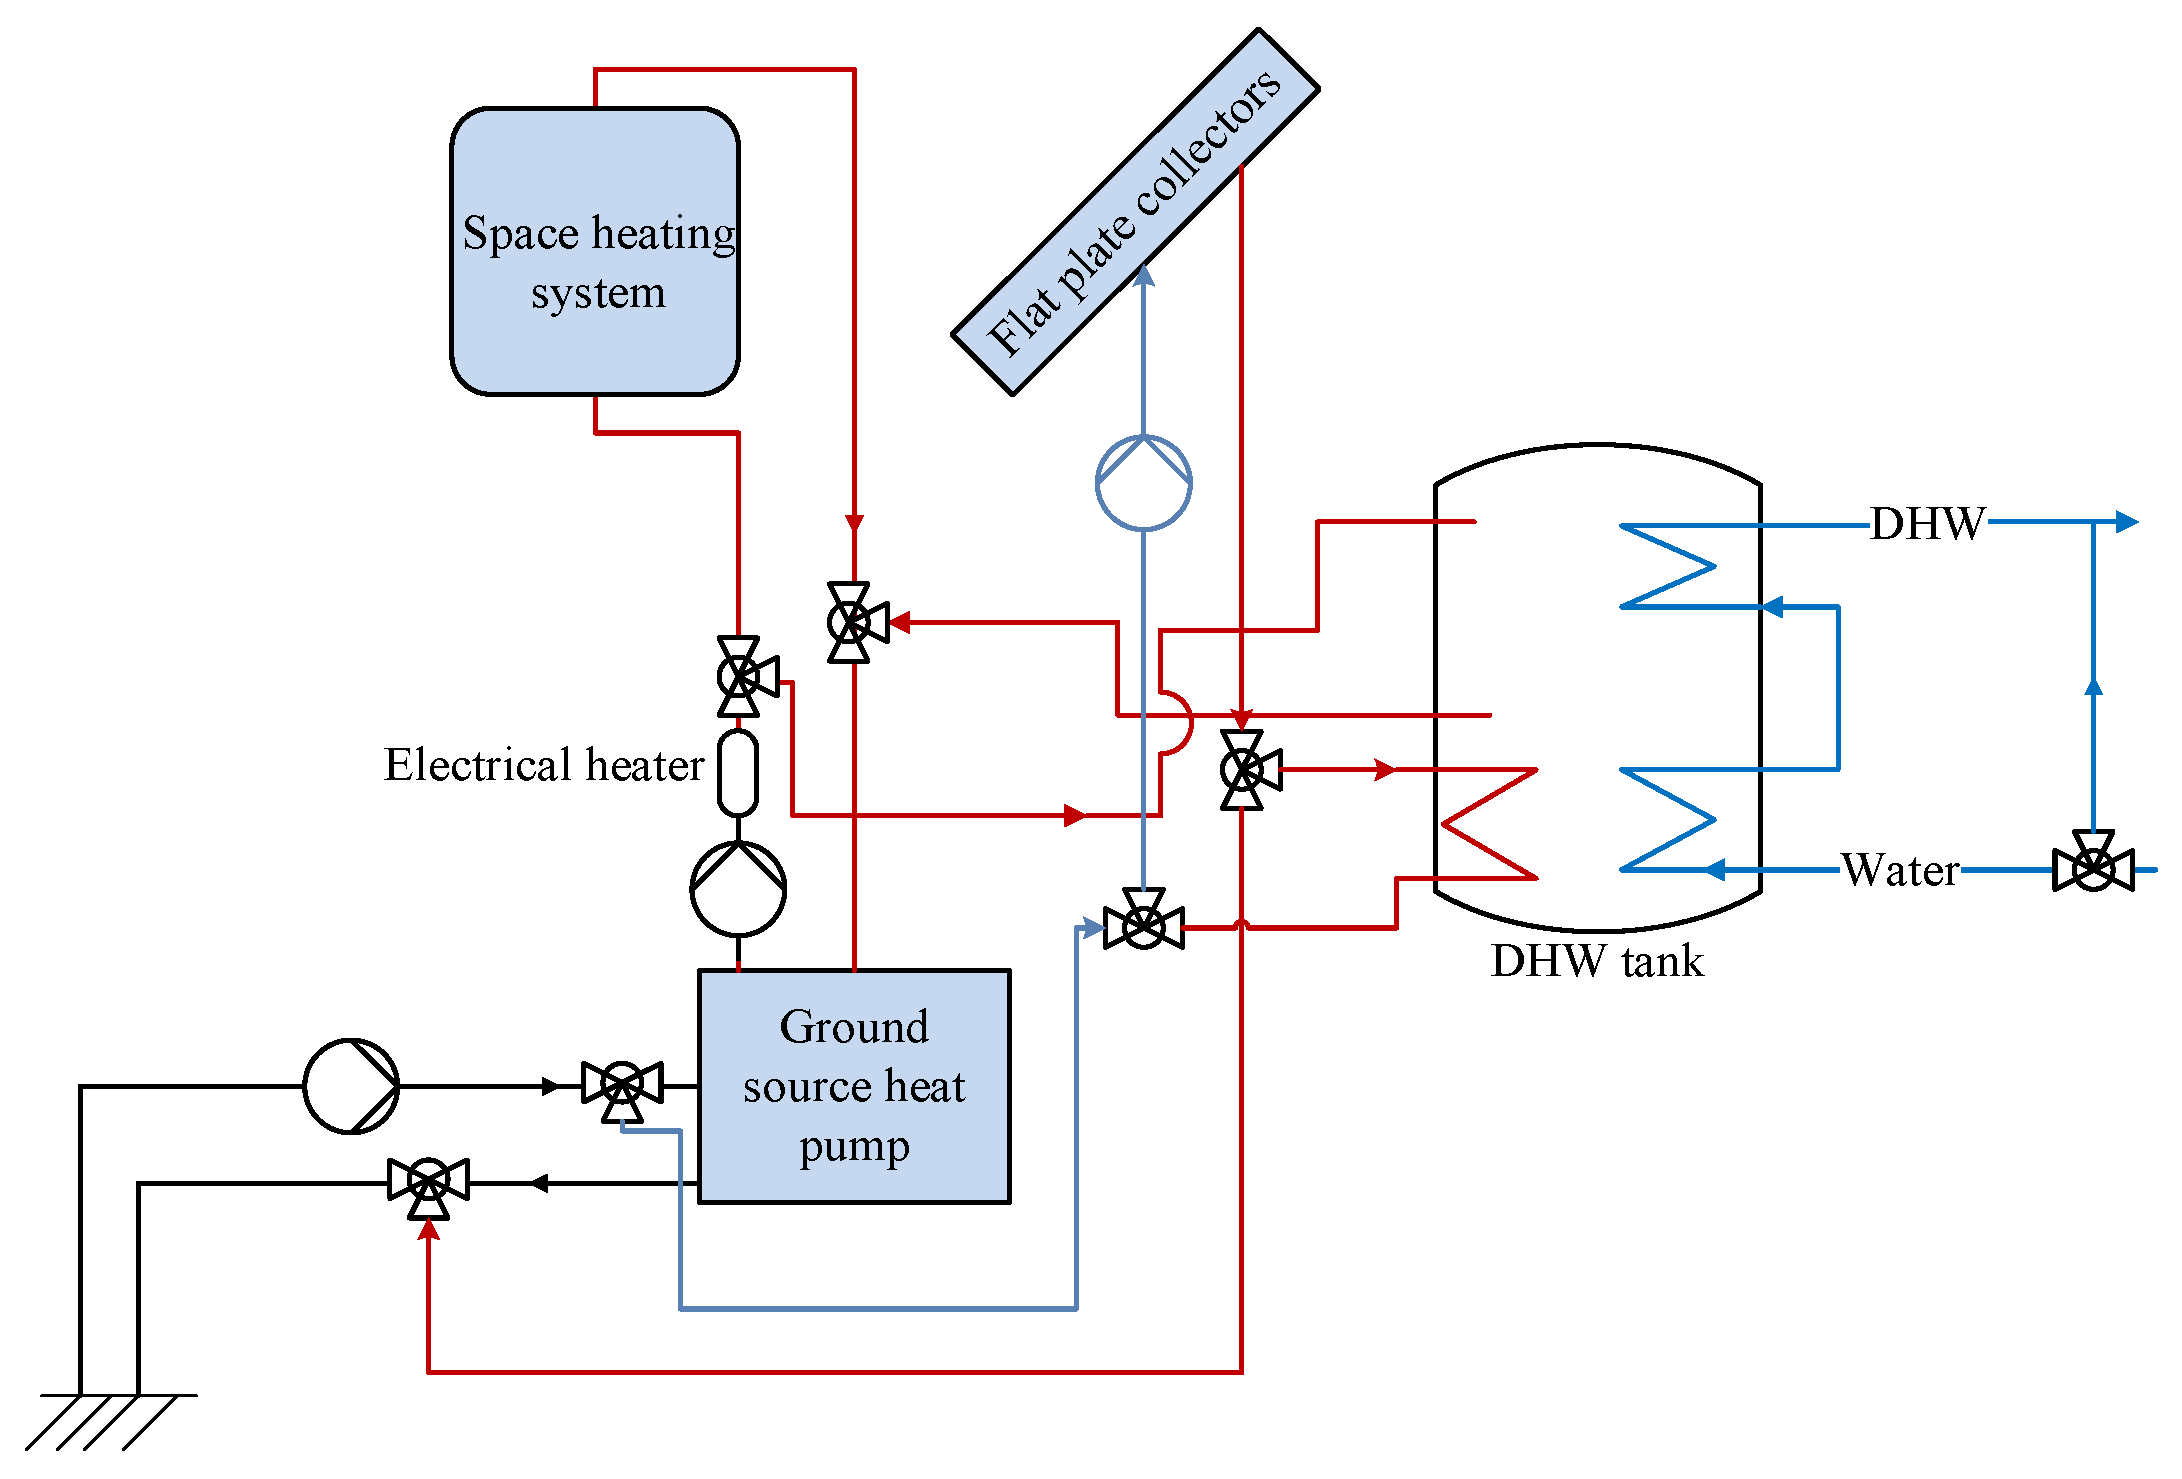
2.4.1. GSHP with Solar Thermal System
The GSHP and the solar thermal system are both connected to the DHW tank and to the borehole system. The HRV is not physically connected to any other subsystems, but utilizes the heat from the heating system in order to heat the supply air.
This system has the most complicated control strategy of all the simulated systems.
The heat from the solar thermal system has two different usages: heating the storage tank and heating the borehole. Heating of the storage tank is the first priority, and if the solar thermal fluid temperature is 2 °C higher than the temperature in the lower part of the storage tank and the temperature in the tank is below 90 °C, the heat is directed to the tank. When the solar thermal fluid temperature is lower than the tank temperature or the tank temperature is 90 °C and above, it is diverted into the borehole. Schematics for this system is presented in
Figure 2.
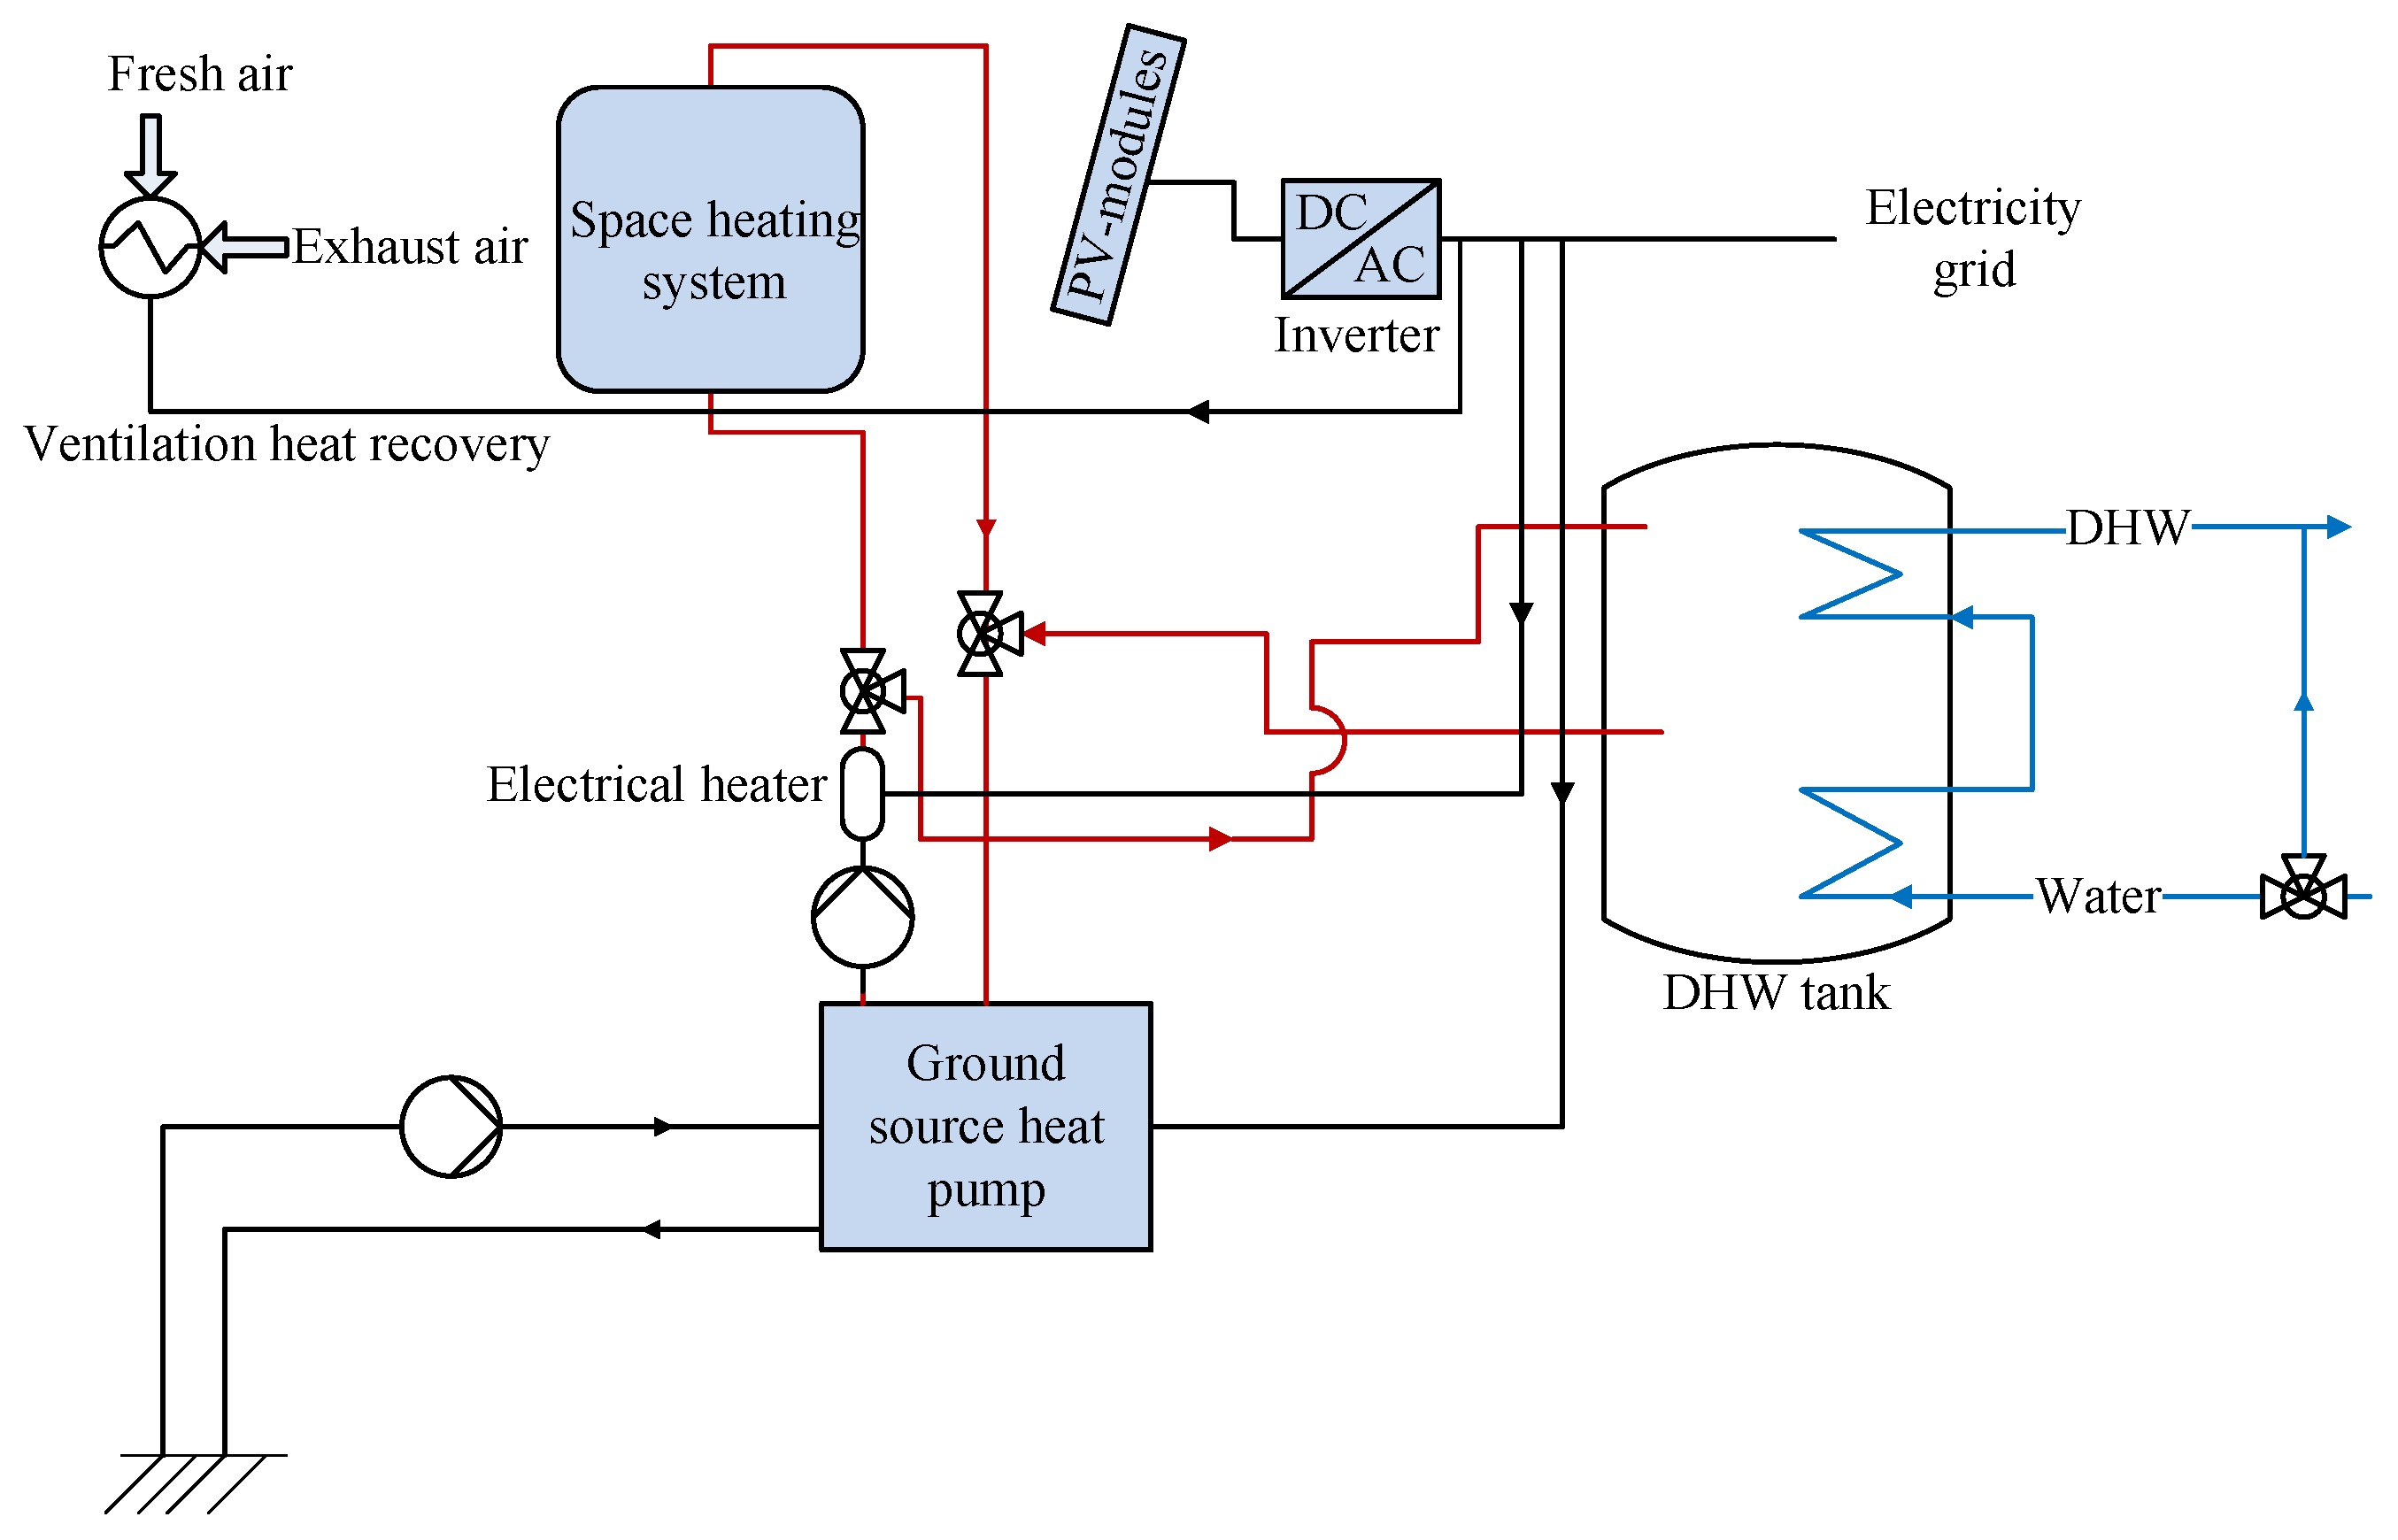
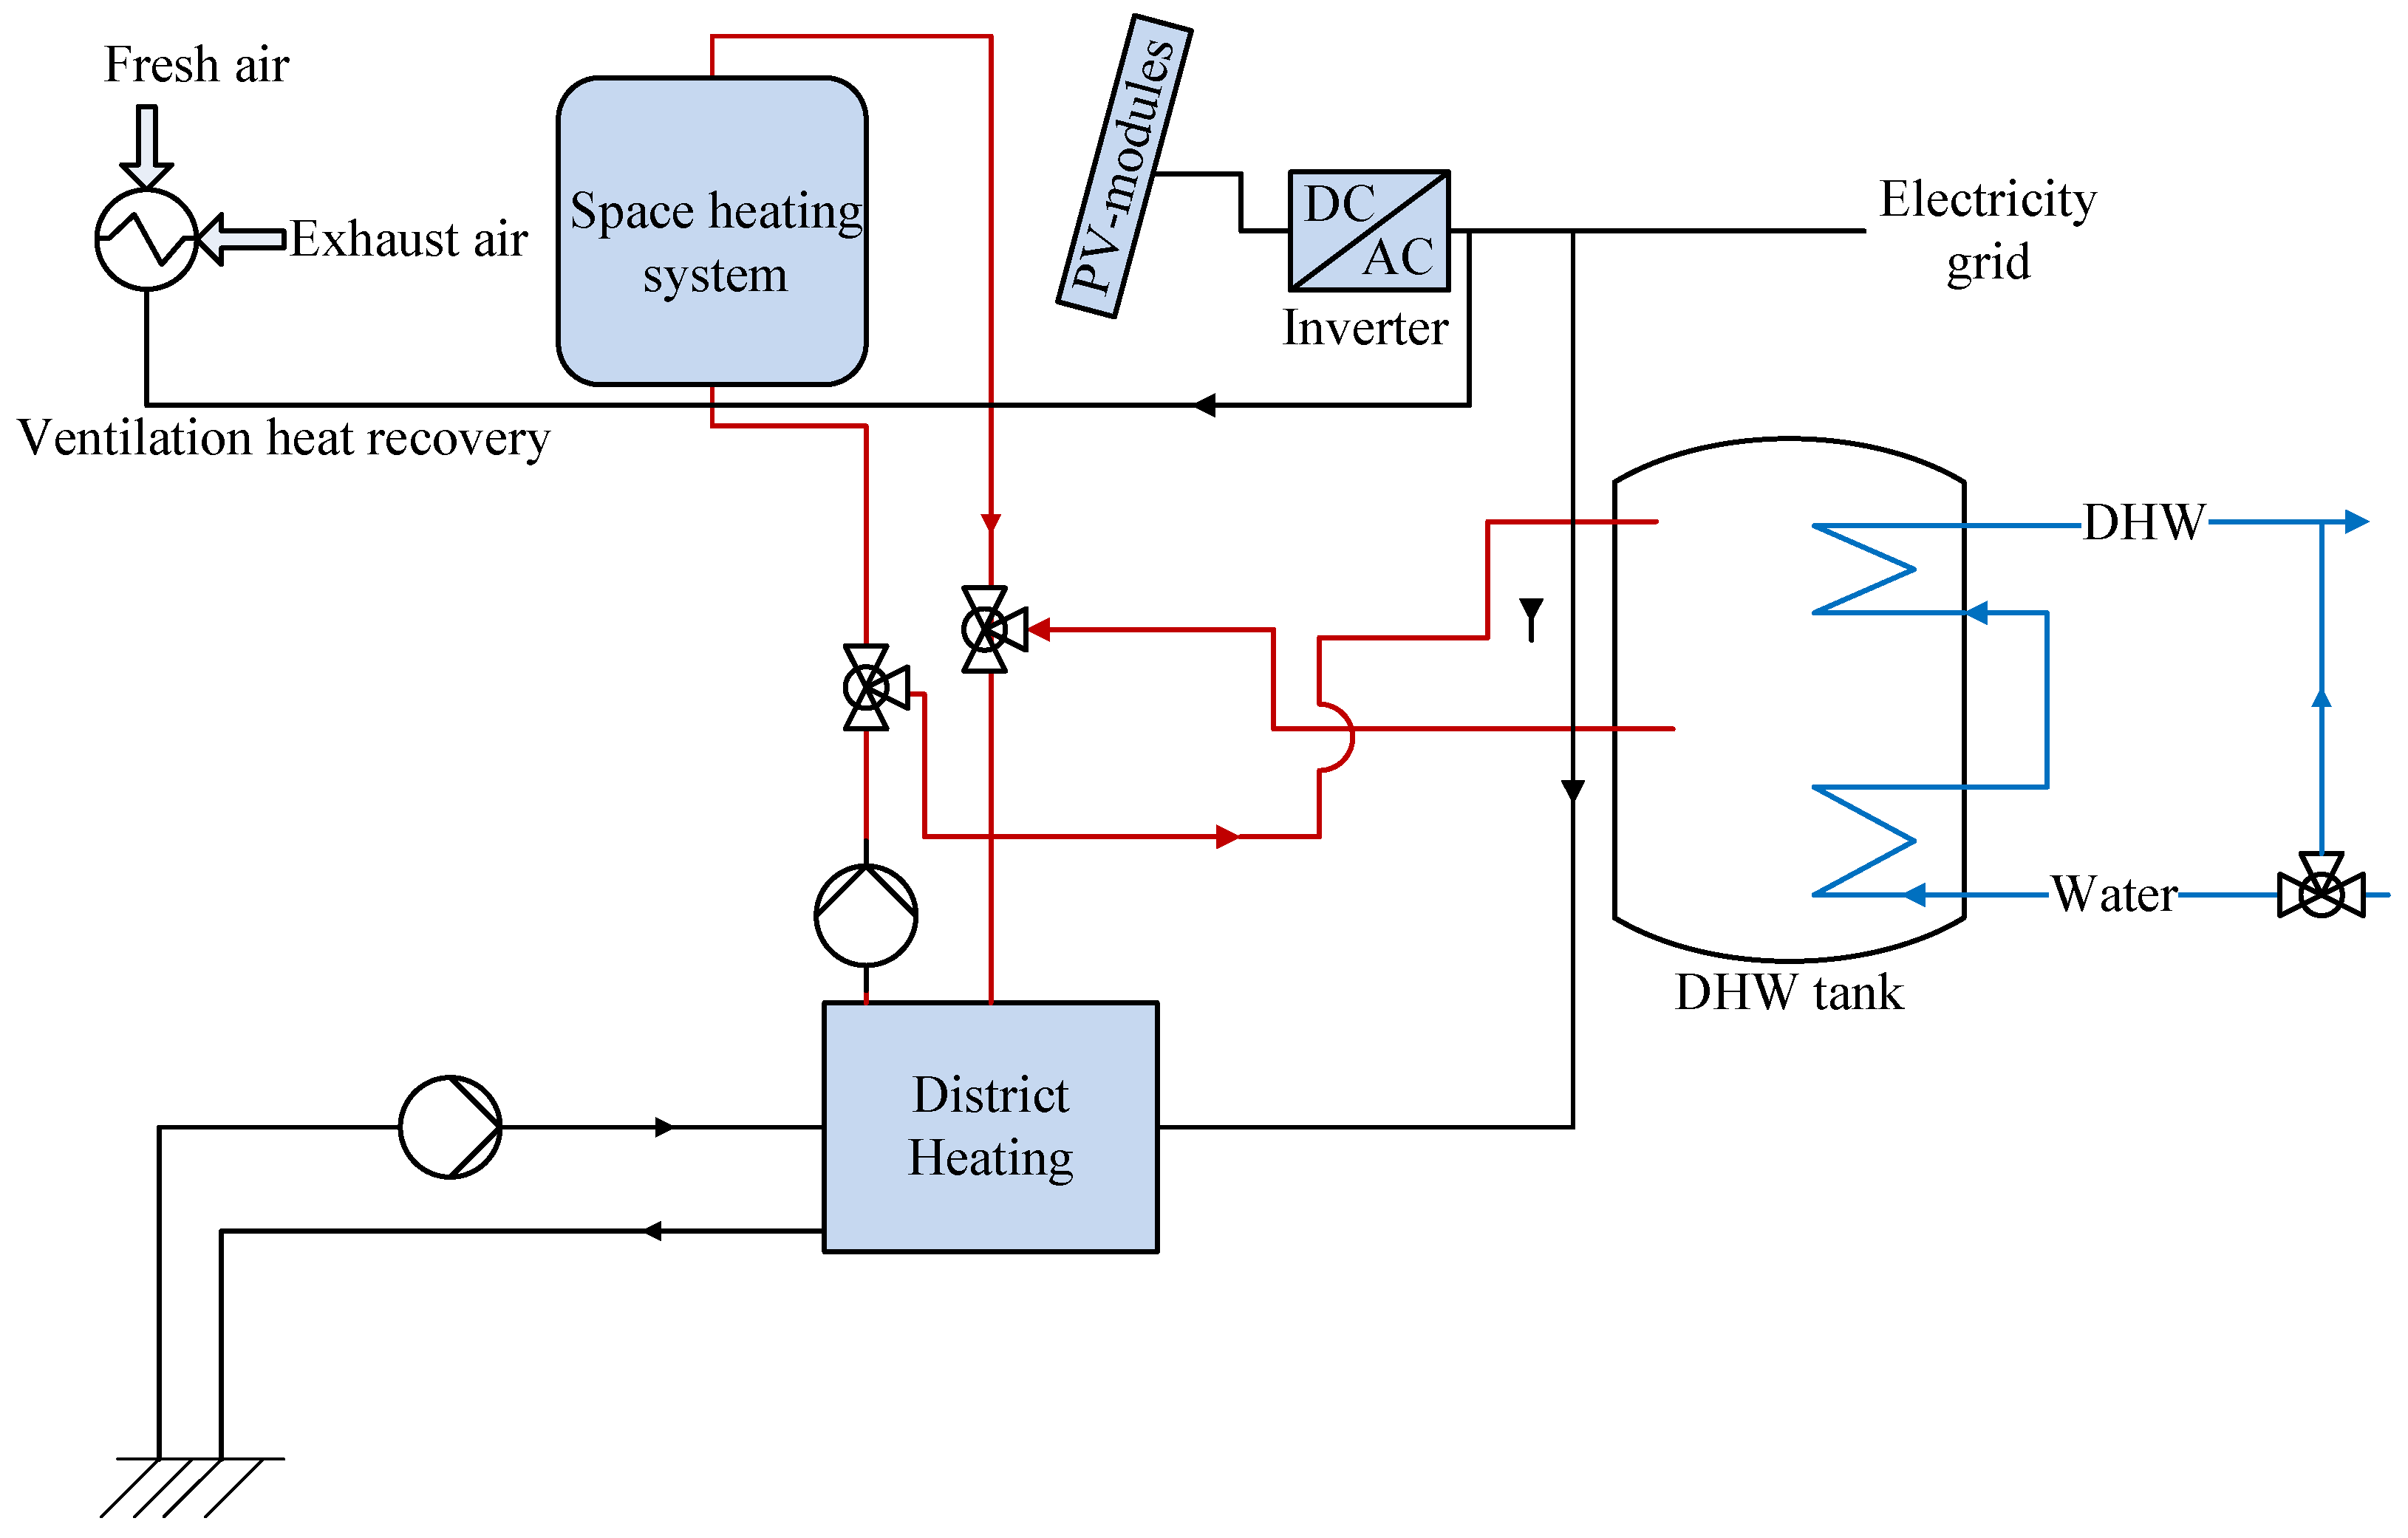
2.4.2. GSHP with PV System
The GSHP, the HRV, and the PV system is physically connected via the internal electricity grid of the building. However, the different subsystems are individually controlled without taking the other subsystems into account. A systems schematic is presented in
Figure 3.
In this system, the control is straightforward and the subsystem is decoupled. The GSHP is in operation when there is a need for DHW or heat to the hydronic system of the building. DHW is prioritized over heating when both demands occur at the same time. The GSHP is controlled based on the outdoor temperature via a temperature curve. The GSHP has a set temperature and in this (and all systems with GSHP), it is 47 °C with a hysteresis of 6/3, which means that the GSHP heats the DHW tank to 53 °C. In addition, the DHW tank temperature is increased to 65 °C during 1 h every week in order to limit the risk of legionella in the tank.
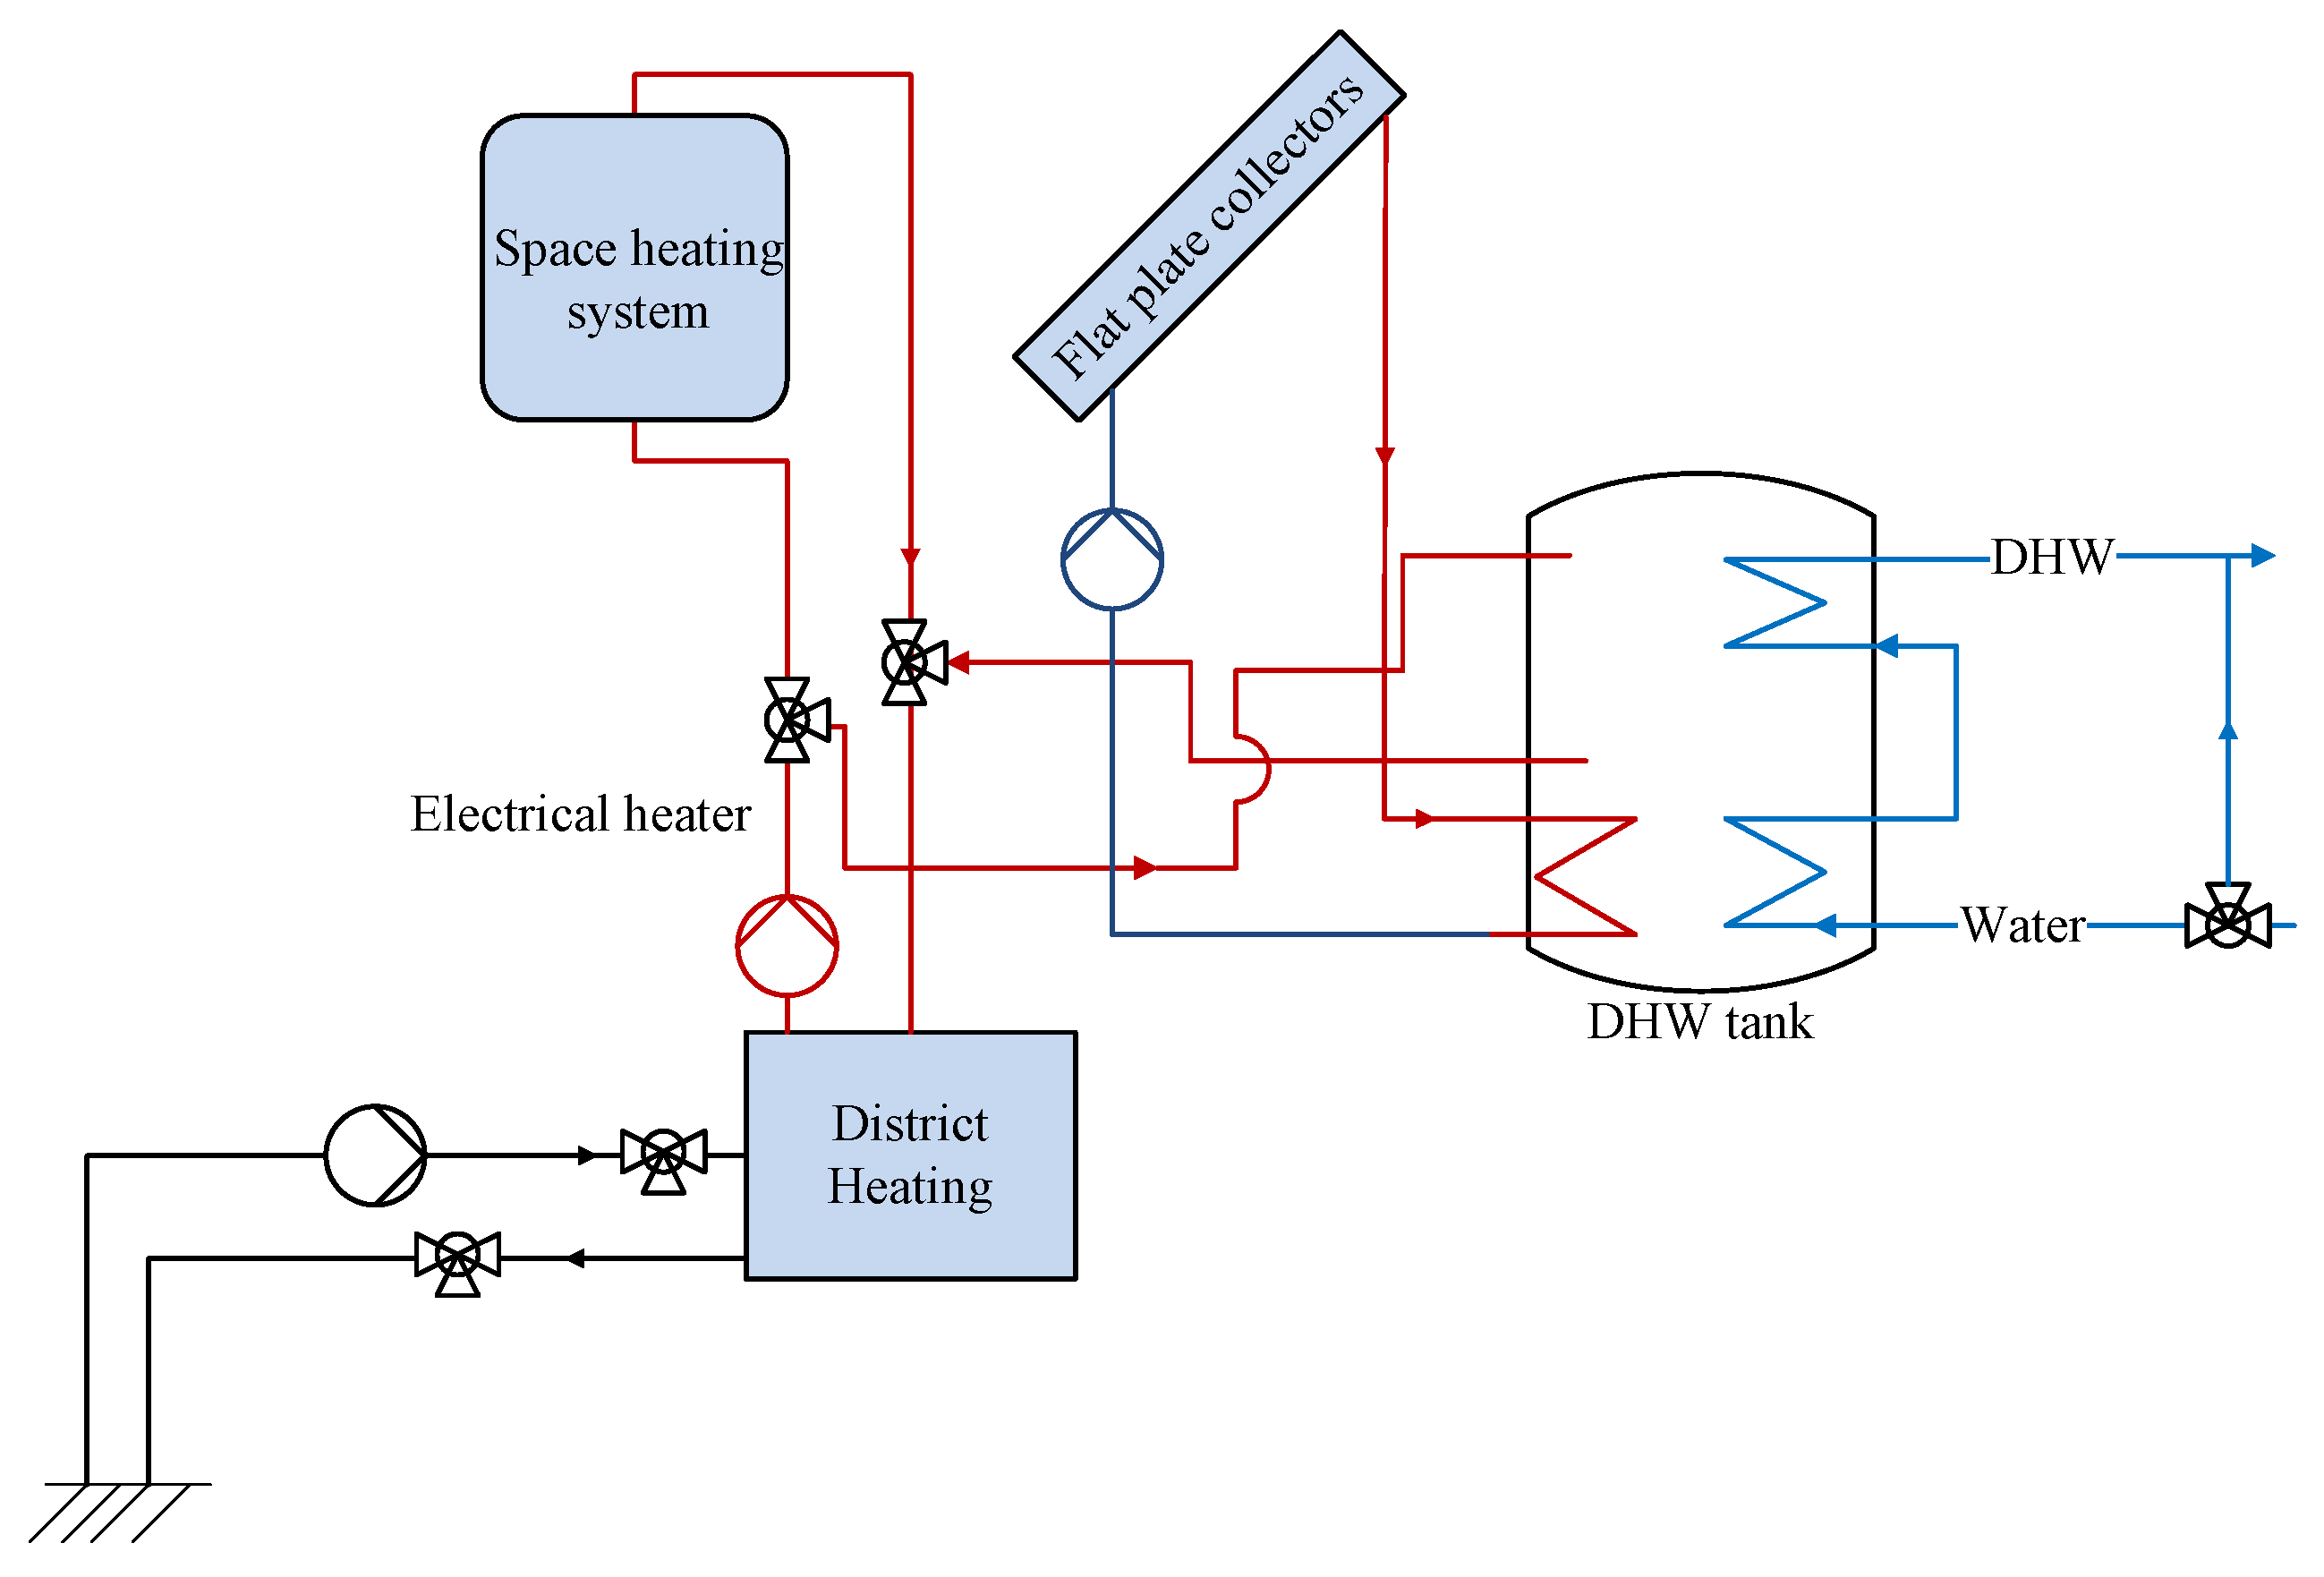
2.4.3. District Heating (DH) with Solar Thermal System
The DH substation in the building and the solar thermal system are both connected to the DHW tank, and the control of the different subsystems is dependent on one another. The system’s schematic is presented in
Figure 4.
In this solution, the solar thermal system heats the storage tank, and the DH supplies heat to the tank when the solar thermal system is unable to cover the total demand.
2.4.4. DH with PV System
These two subsystems are totally decoupled and are operating independent of one another. The DH is heating the tank based on a temperature curve. Usually, the DH is controlled in this way. However, a DHW tank is not commonly used, and this is only implemented to be able to store solar thermal energy. The system schematic is presented in
Figure 5.
2.5. Incentive Schemes for PV System and PV and Solar Thermal System Costs
In Sweden today, there are three incentives that are focused on PV systems in particular. This is explained in detail in
Section 1.1.
The electricity cost for sold and purchased electricity with and without the tax deduction incentive scheme is presented in
Table 4.
2.6. Economic Calculation Methods
Payback Method
This is the easiest form of economic calculation. The investment cost is divided by the net annual cash flow, which is defined as the annual income minus the annual expenses. The payback time is presented in full years.
All payback calculations are solely based on the different DEG systems, hence, the other technical installations are not included in this calculations.
3. Results
3.1. Energy Performance
As presented in
Table 2, the energy performance of the building is 67 kWh/m
2/year. This is the case when the heat losses of the building and DHW are counted as energy demand. This is well above the limit of 55 kWh/m
2/year.
An HRV system is installed and complements the main heat source in the building, which lowers the purchased energy from 224 to 190 MWh, or by 15%.
The specific energy demand, as specified in the proposed new building regulations, for the different system variations without a solar energy system is presented in
Table 5.
As indicated in
Table 5, the building with an HRV and a GSHP is well below the requirement of 55 kWh/m
2/year. This is because the GSHP has a seasonal COP of 4.1, which is higher than the weighing factor of 2.5. If the seasonal COP had been 2.5, both buildings would have had the same specific energy demand.
3.1.1. GSHP and DH with PV System
As indicated in
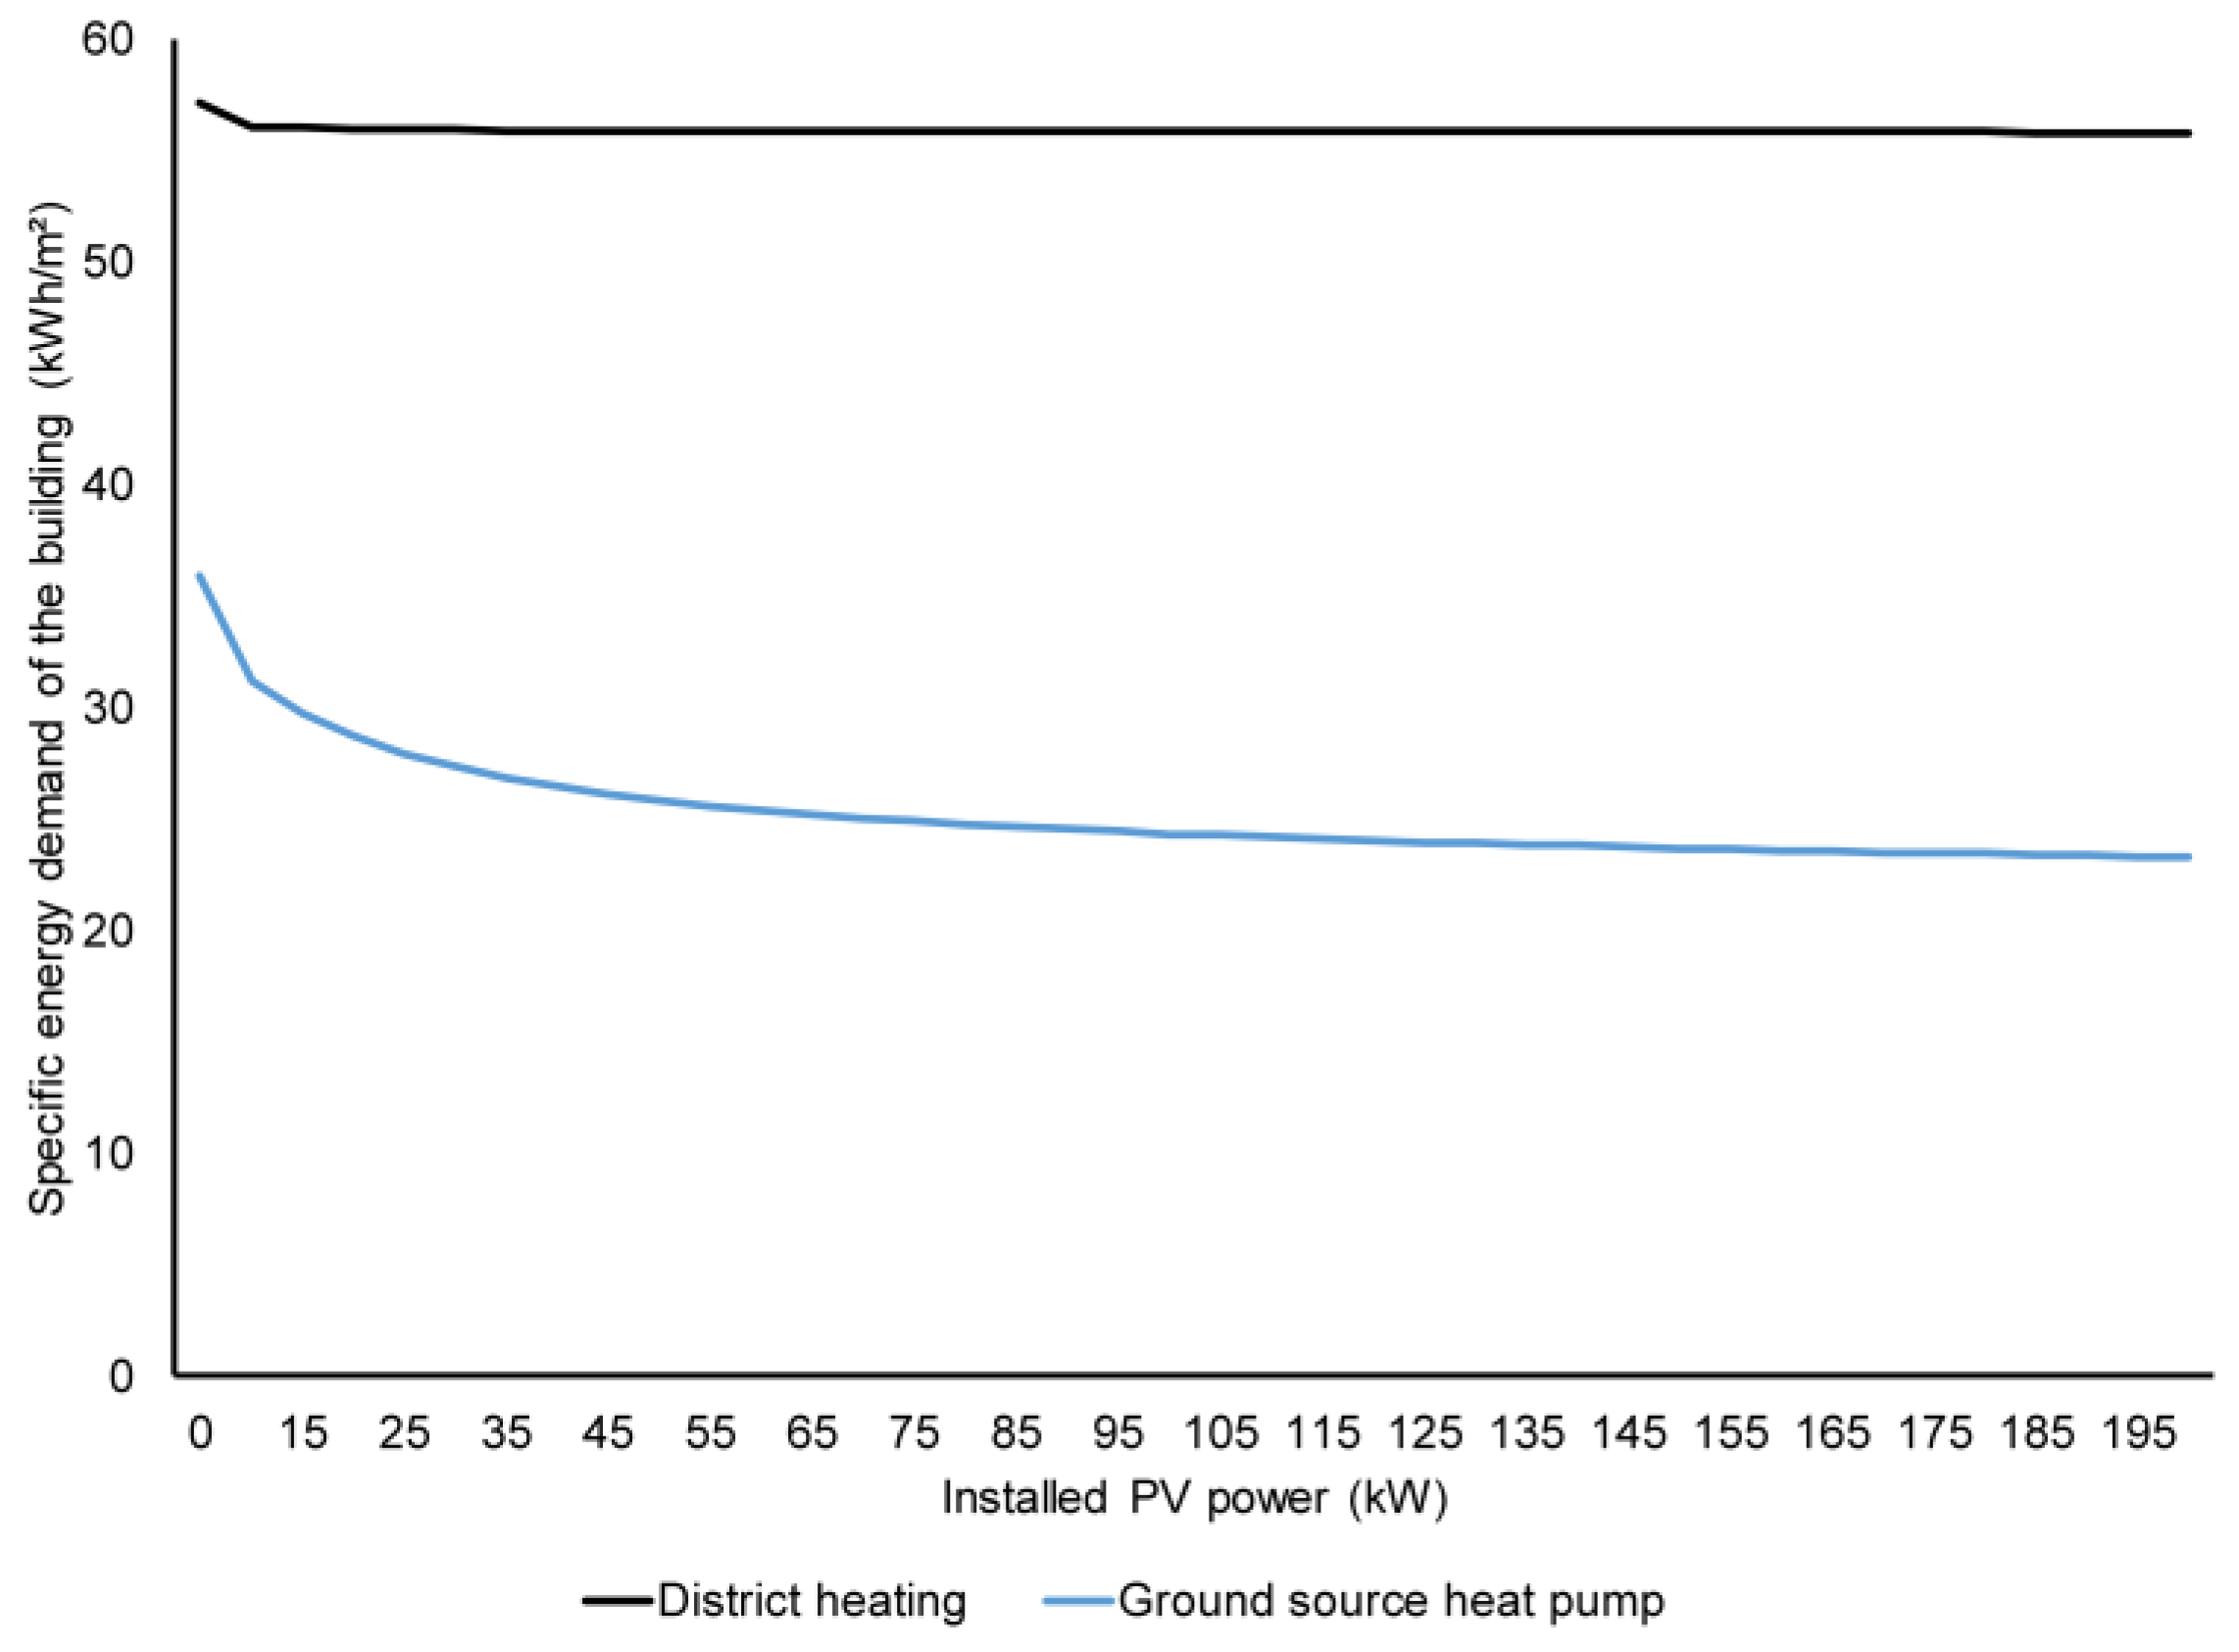
Figure 6, only small changes occur in the specific energy demand of the building heated with DH when it is supplemented with a PV system. A PV system larger than 10 kW
p has a small, additional effect on the reduction of the specific energy demand of the building with DH. This can be explained by the fact that the part of the purchased energy demand of the building that can be replaced by PV electricity is the electricity for building services. The electricity for building services consists of electricity for lighting, elevators, and ventilation fans, and is a fairly small part of the total purchased energy demand; therefore, the reduction of this has a small effect of the specific energy demand and the reduction already occurs with small PV system sizes. Also, the building services’ electricity demand that can be replaced by PV electricity is more or less constant during the whole day. The reduction of specific energy demand at 10 kW
p is, in comparison to a case without a PV system, is just above 1 kWh/m
2/year. The difference in specific energy demand between no PV system and a PV system with a size of 200 kW
p is 1.3 kWh/m
2/year.
For the GSHP case, the effect is more substantial and the difference in specific energy demand, between 0 and 10 kWp, is just below 5 kWh/m2/year, and the difference between 0 and 200 kWp is 12.5 kWh/m2/year. This can be explained by the fact that in addition to electricity for building services, also the GSHP has an electricity demand for DHW production during the summer months.
As presented earlier in this section, it is possible to build a low-energy building, according to the proposed Swedish building regulations, if it is equipped with an HRV, a GSHP, and a PV system. It is not as easy to do that for a building with DH and HRV. It requires a more insulated building than the GSHP, HRV, and PV system case.
3.1.2. GSHP and DH with Solar Thermal System
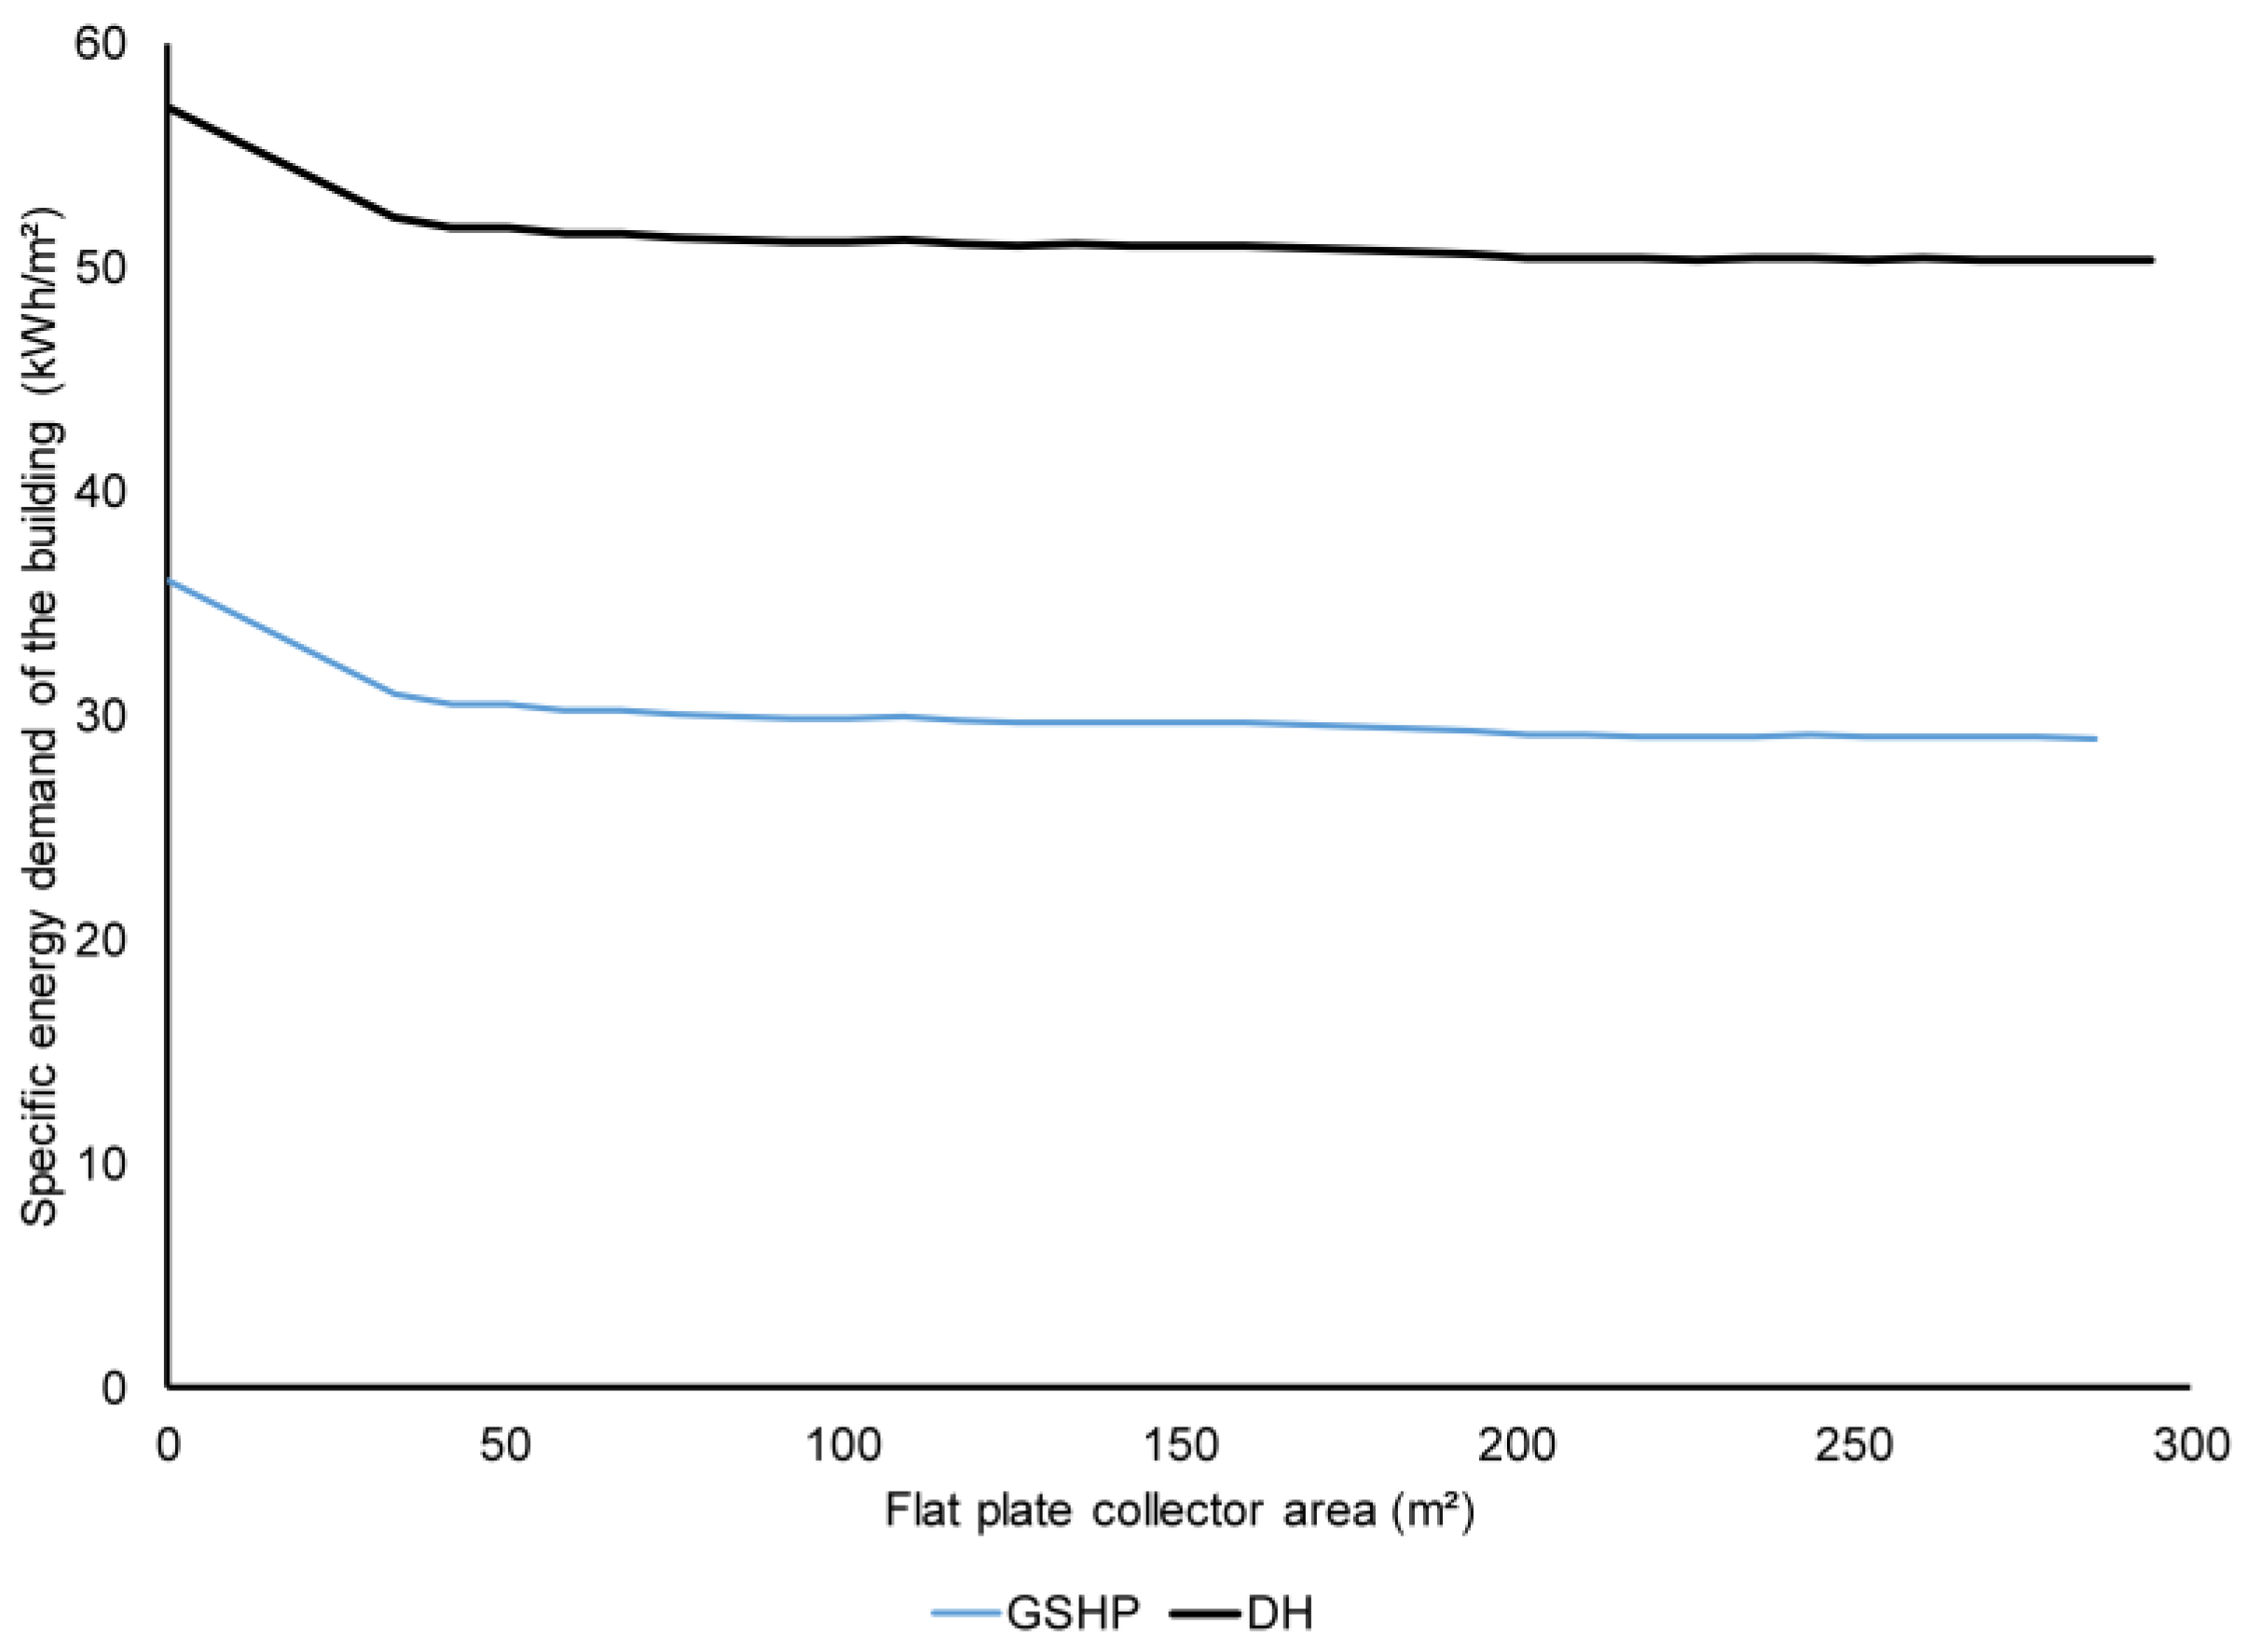
In this system’s case, the reduction in specific energy demand is more or less the same for the different systems. As presented in
Figure 7, The DH building has the lowest reduction share in its specific energy demand. However, in real numbers, the change is almost the same.
The effect of the solar thermal system on the DH building is largest, up to a system size of around 30 m
2, after which the effect on the specific energy demand is negligible. This is due to the fact that the demand for heat is limited during summer, and, therefore, there is a limit to the reduction of the specific energy demand of the building. The energy from the solar thermal system can only reduce the DHW demand that is occurring during the summer months. This limit is reached with a solar thermal system size of around 30 m
3, which clearly can be shown in
Figure 7 where the line for DH building is flattening out. The reduction in specific energy demand from a DH building without a solar thermal system compared to a building with a solar thermal system size of around 30 m
2 is 4.9 kWh/m
2/year.
For the building with the GSHP, the reduction between 0 and 30 m2 is 5 kWh/m2/year.
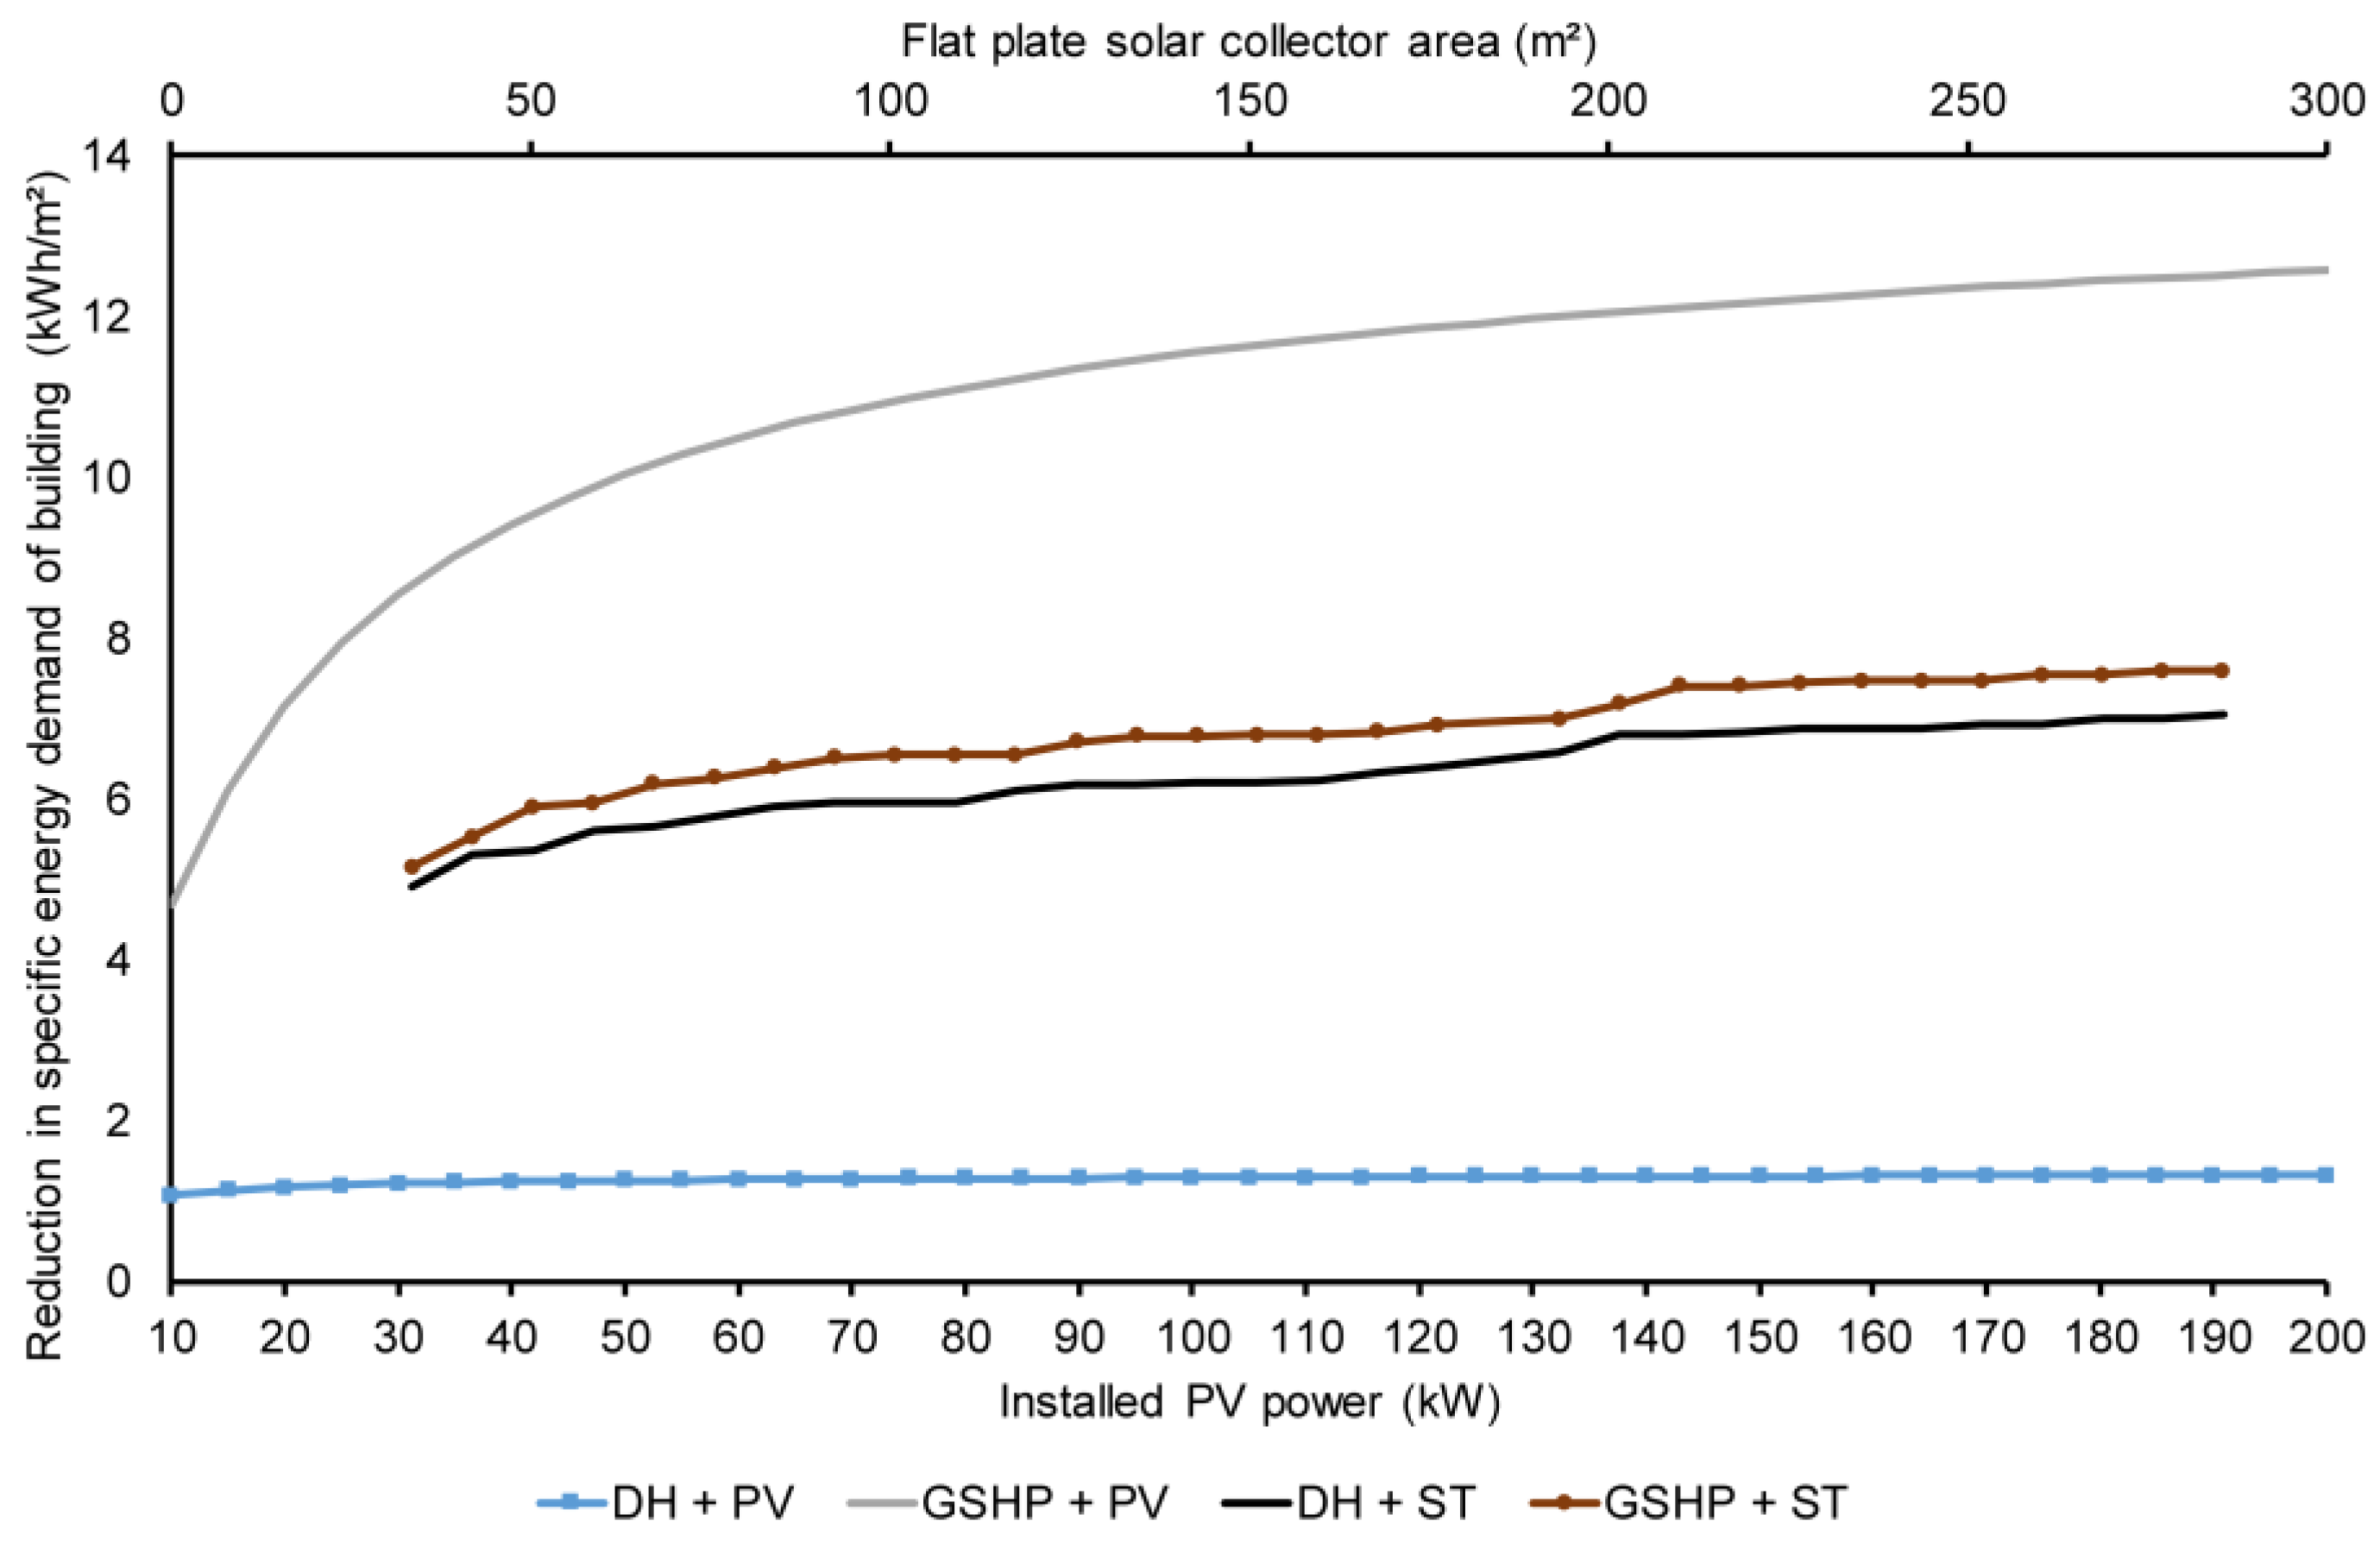
Presented in
Figure 8 is the reduction in specific energy demand per kW of installed PV or m
2 of solar collector. As presented, the GSHP in combination with the PV system and DH and GSHP in combination with the ST system has the same reduction in specific energy demand. This is explained by the fact that the match between the electricity demand of the GSHP, for DHW production, and the PV yield is fairly good. In addition, the electricity for building services can also somewhat be replaced by PV electricity. These two facts make the system with a GSHP and a PV system the best of those analyzed in terms of reduction of the specific energy demand of the building. The system with GSHP and solar thermal system is not as effective as the GSHP and PV system combination, and this is due to the fact that the energy from the solar thermal systems can only reduce the electricity to the GSHP. In order to save 1 kWh of electricity to the GSHP, approximately 3 kWh of heat from the solar thermal system is needed. This is because the solar thermal systems save the electricity that the GSHP would have used in order to produce the DHW and the energy the GSHP would have extracted from the borehole.
3.2. Incentive Scheme Analysis
The support schemes in Sweden make it far more attractive to install PV systems from an economic point of view. The building owner get an investment cost support and a tax deduction on electricity fed into the grid. Investment cost per unit, energy yield per unit, revenue per unit, and payback time is presented in
Table 6.
As indicated in
Table 6, the tax deduction incentive makes PV electricity that is fed into the grid and sold more valuable than PV electricity used in the building. This result indicates that the energy storage incentive is more or less unnecessary in terms of installing economic systems. The overall results of this analysis suggest that the tax deduction support also makes PV systems attractive for buildings with low internal electricity demand, for example, DH-heated buildings. This makes it more valuable to install PV systems on DH-heated buildings even though the results indicate that an ST system would be a viable way of reducing the specific energy demand of the DH-heated building.
3.3. Proposal for a More Stringently Designed DEG System Incentive Policy
As presented in the results earlier in this section, the current incentives are not steering in the same direction and the tax deduction incentive is counteracting the storage system investment incentive. In addition, the incentives are not designed to work with the EPBD in the best possible way. The results in
Section 3.1.1 and
Section 3.1.2 indicates that the PV incentives, or the lack of incentives for ST, also make installation of PV systems more attractive on buildings with DH, where it would be better to install ST in order to decrease the specific energy demand of the building in order to make the incentives for DEG.
A more efficient incentive scheme would be an investment incentive based on how much the DEG system reduces the specific energy demand on the building in which it is installed. The proposal is presented in Equation (3) and
Espec and
Espec, DEG is based on method proposed and described in [
19].
where
IncentiveDEG is the monetary support in euros;
Espec is building-specific energy demand;
Espec, DEG is building-specific energy demand after reduction by the
DEG system; and
x is €/reduction in specific energy demand of the building.
In this article, x is set to 560.
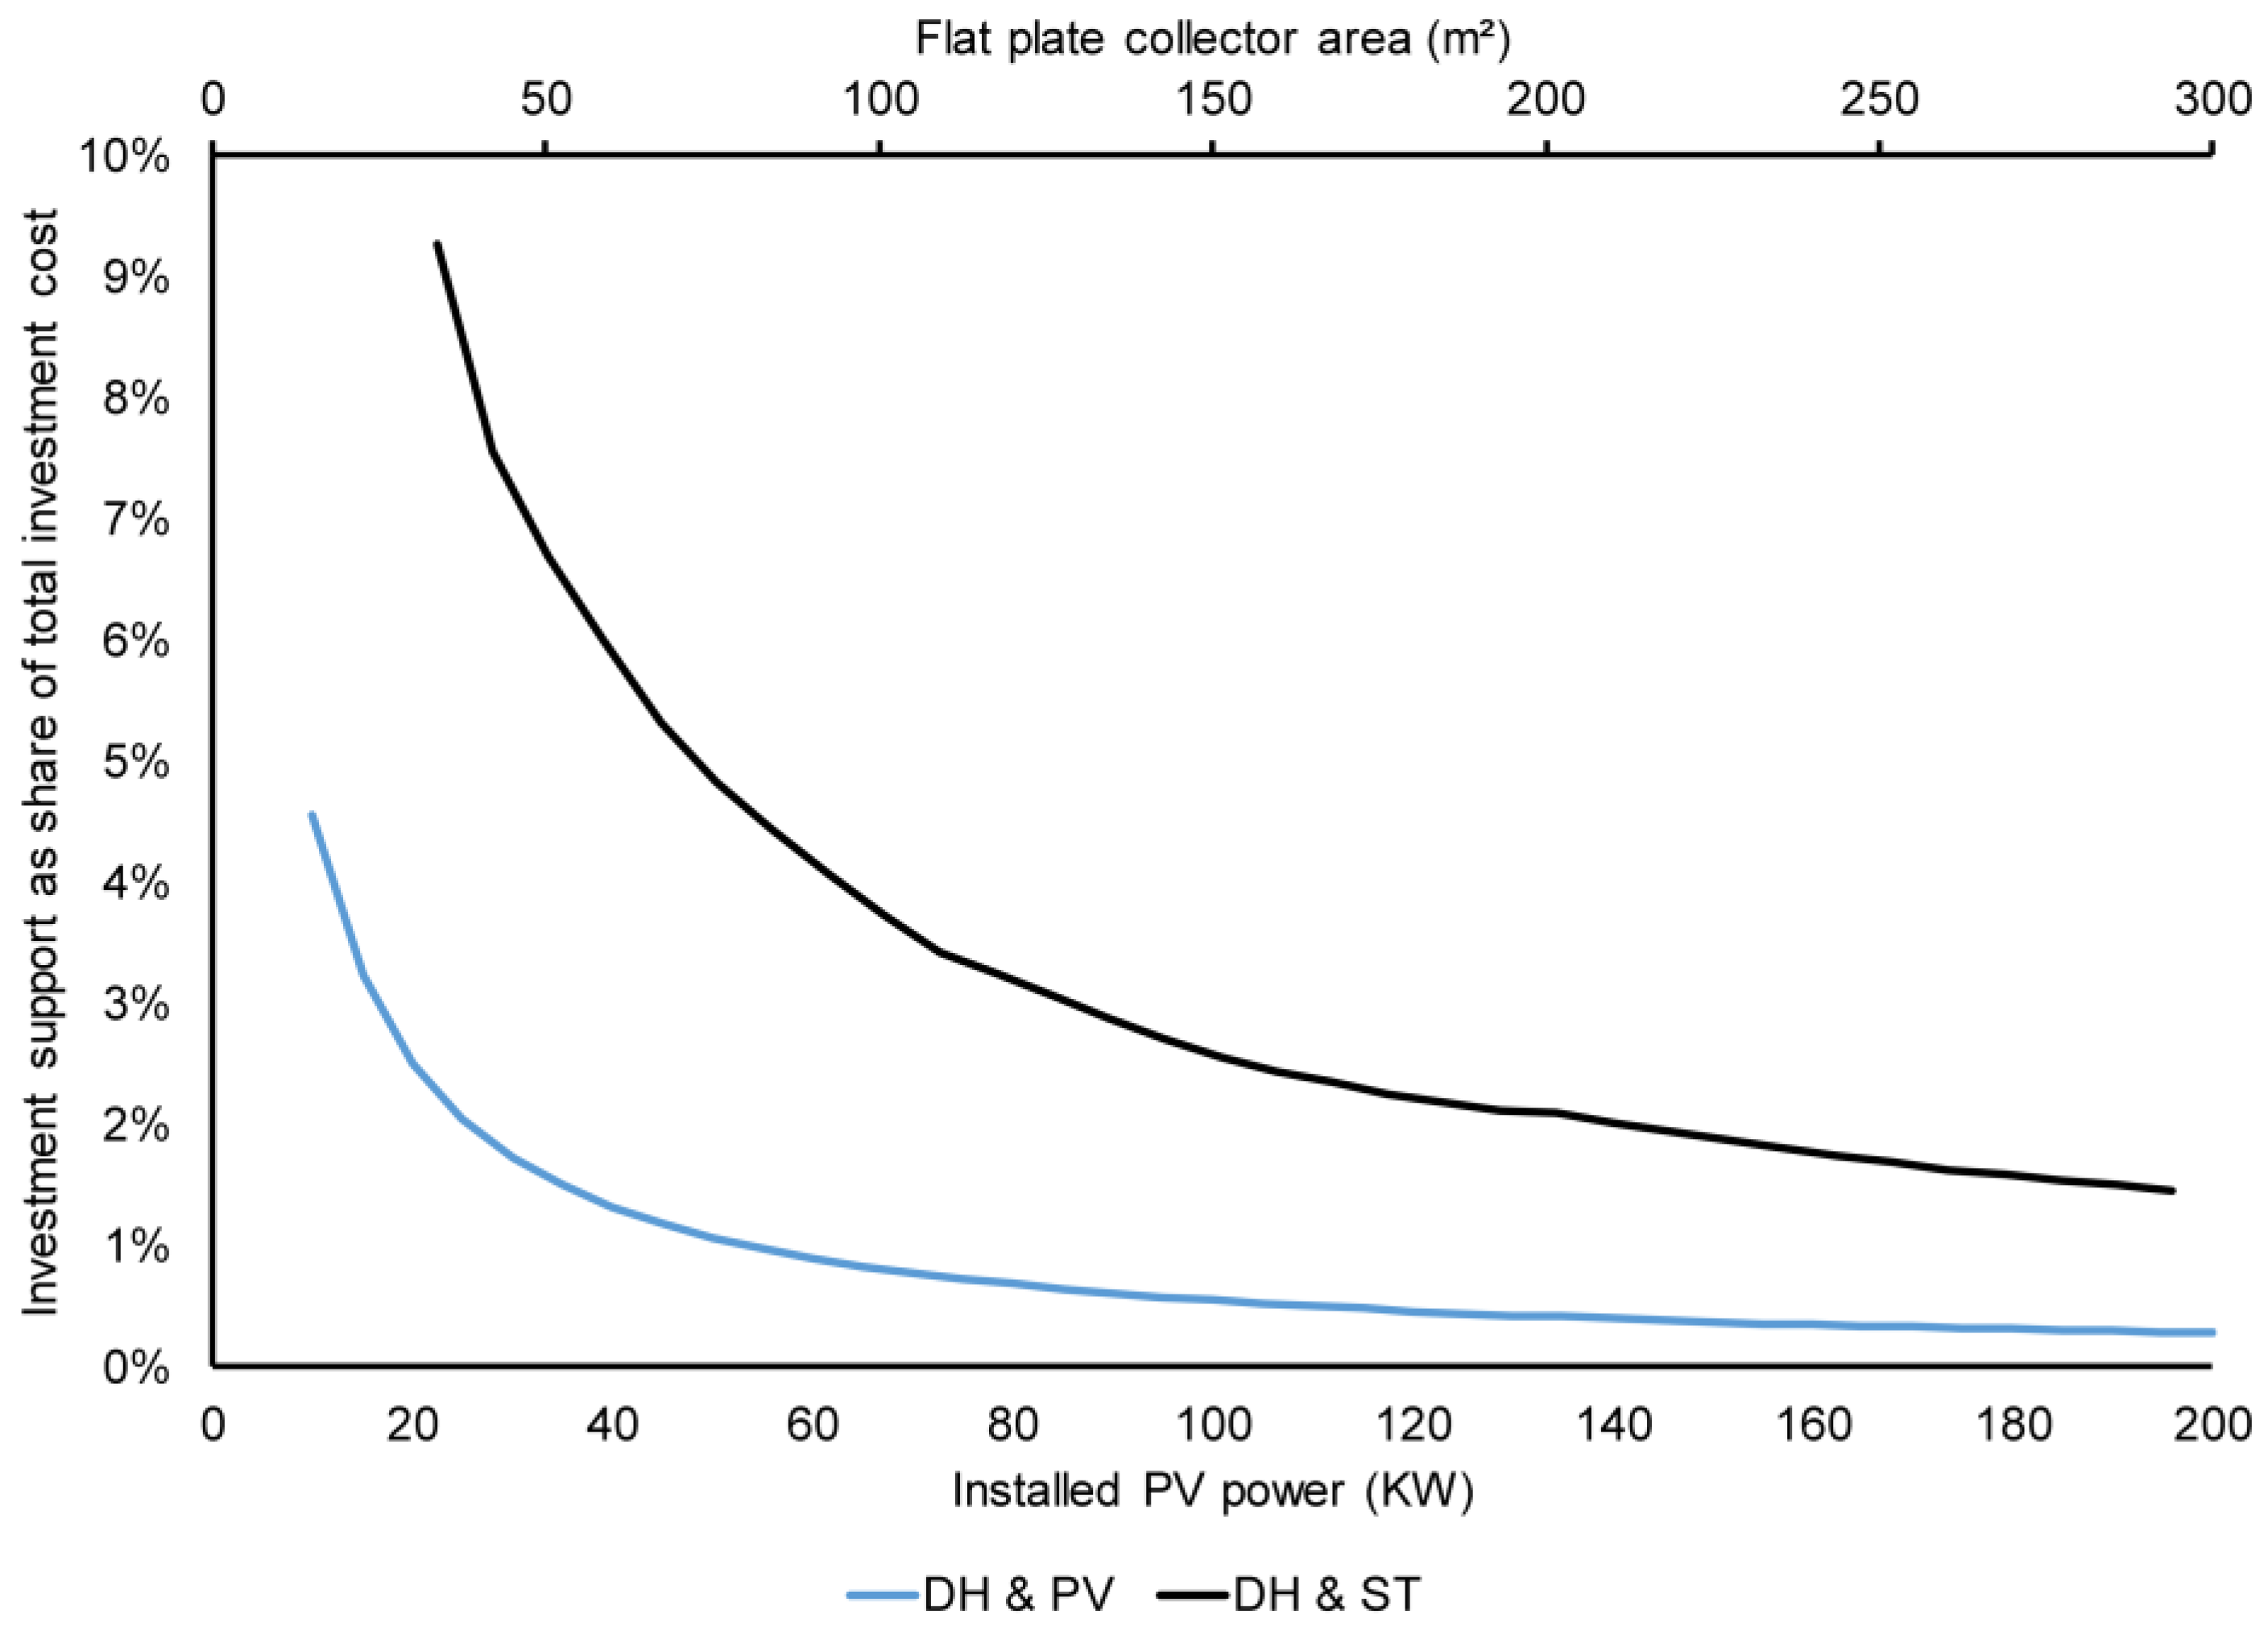
The effect of the incentive proposal on the building heated with DH is presented in
Figure 9.
As presented in
Figure 9, it is a sharp decline in the support cost share of the total investment cost for the DH in combination with a PV system. This occurs because the reduction in specific energy demand per additional installed kW
p of PV is decreasing, thus affecting the share of support from the proposed support scheme. In addition, the proposed system implicitly steers towards systems with high self-consumption of PV electricity.
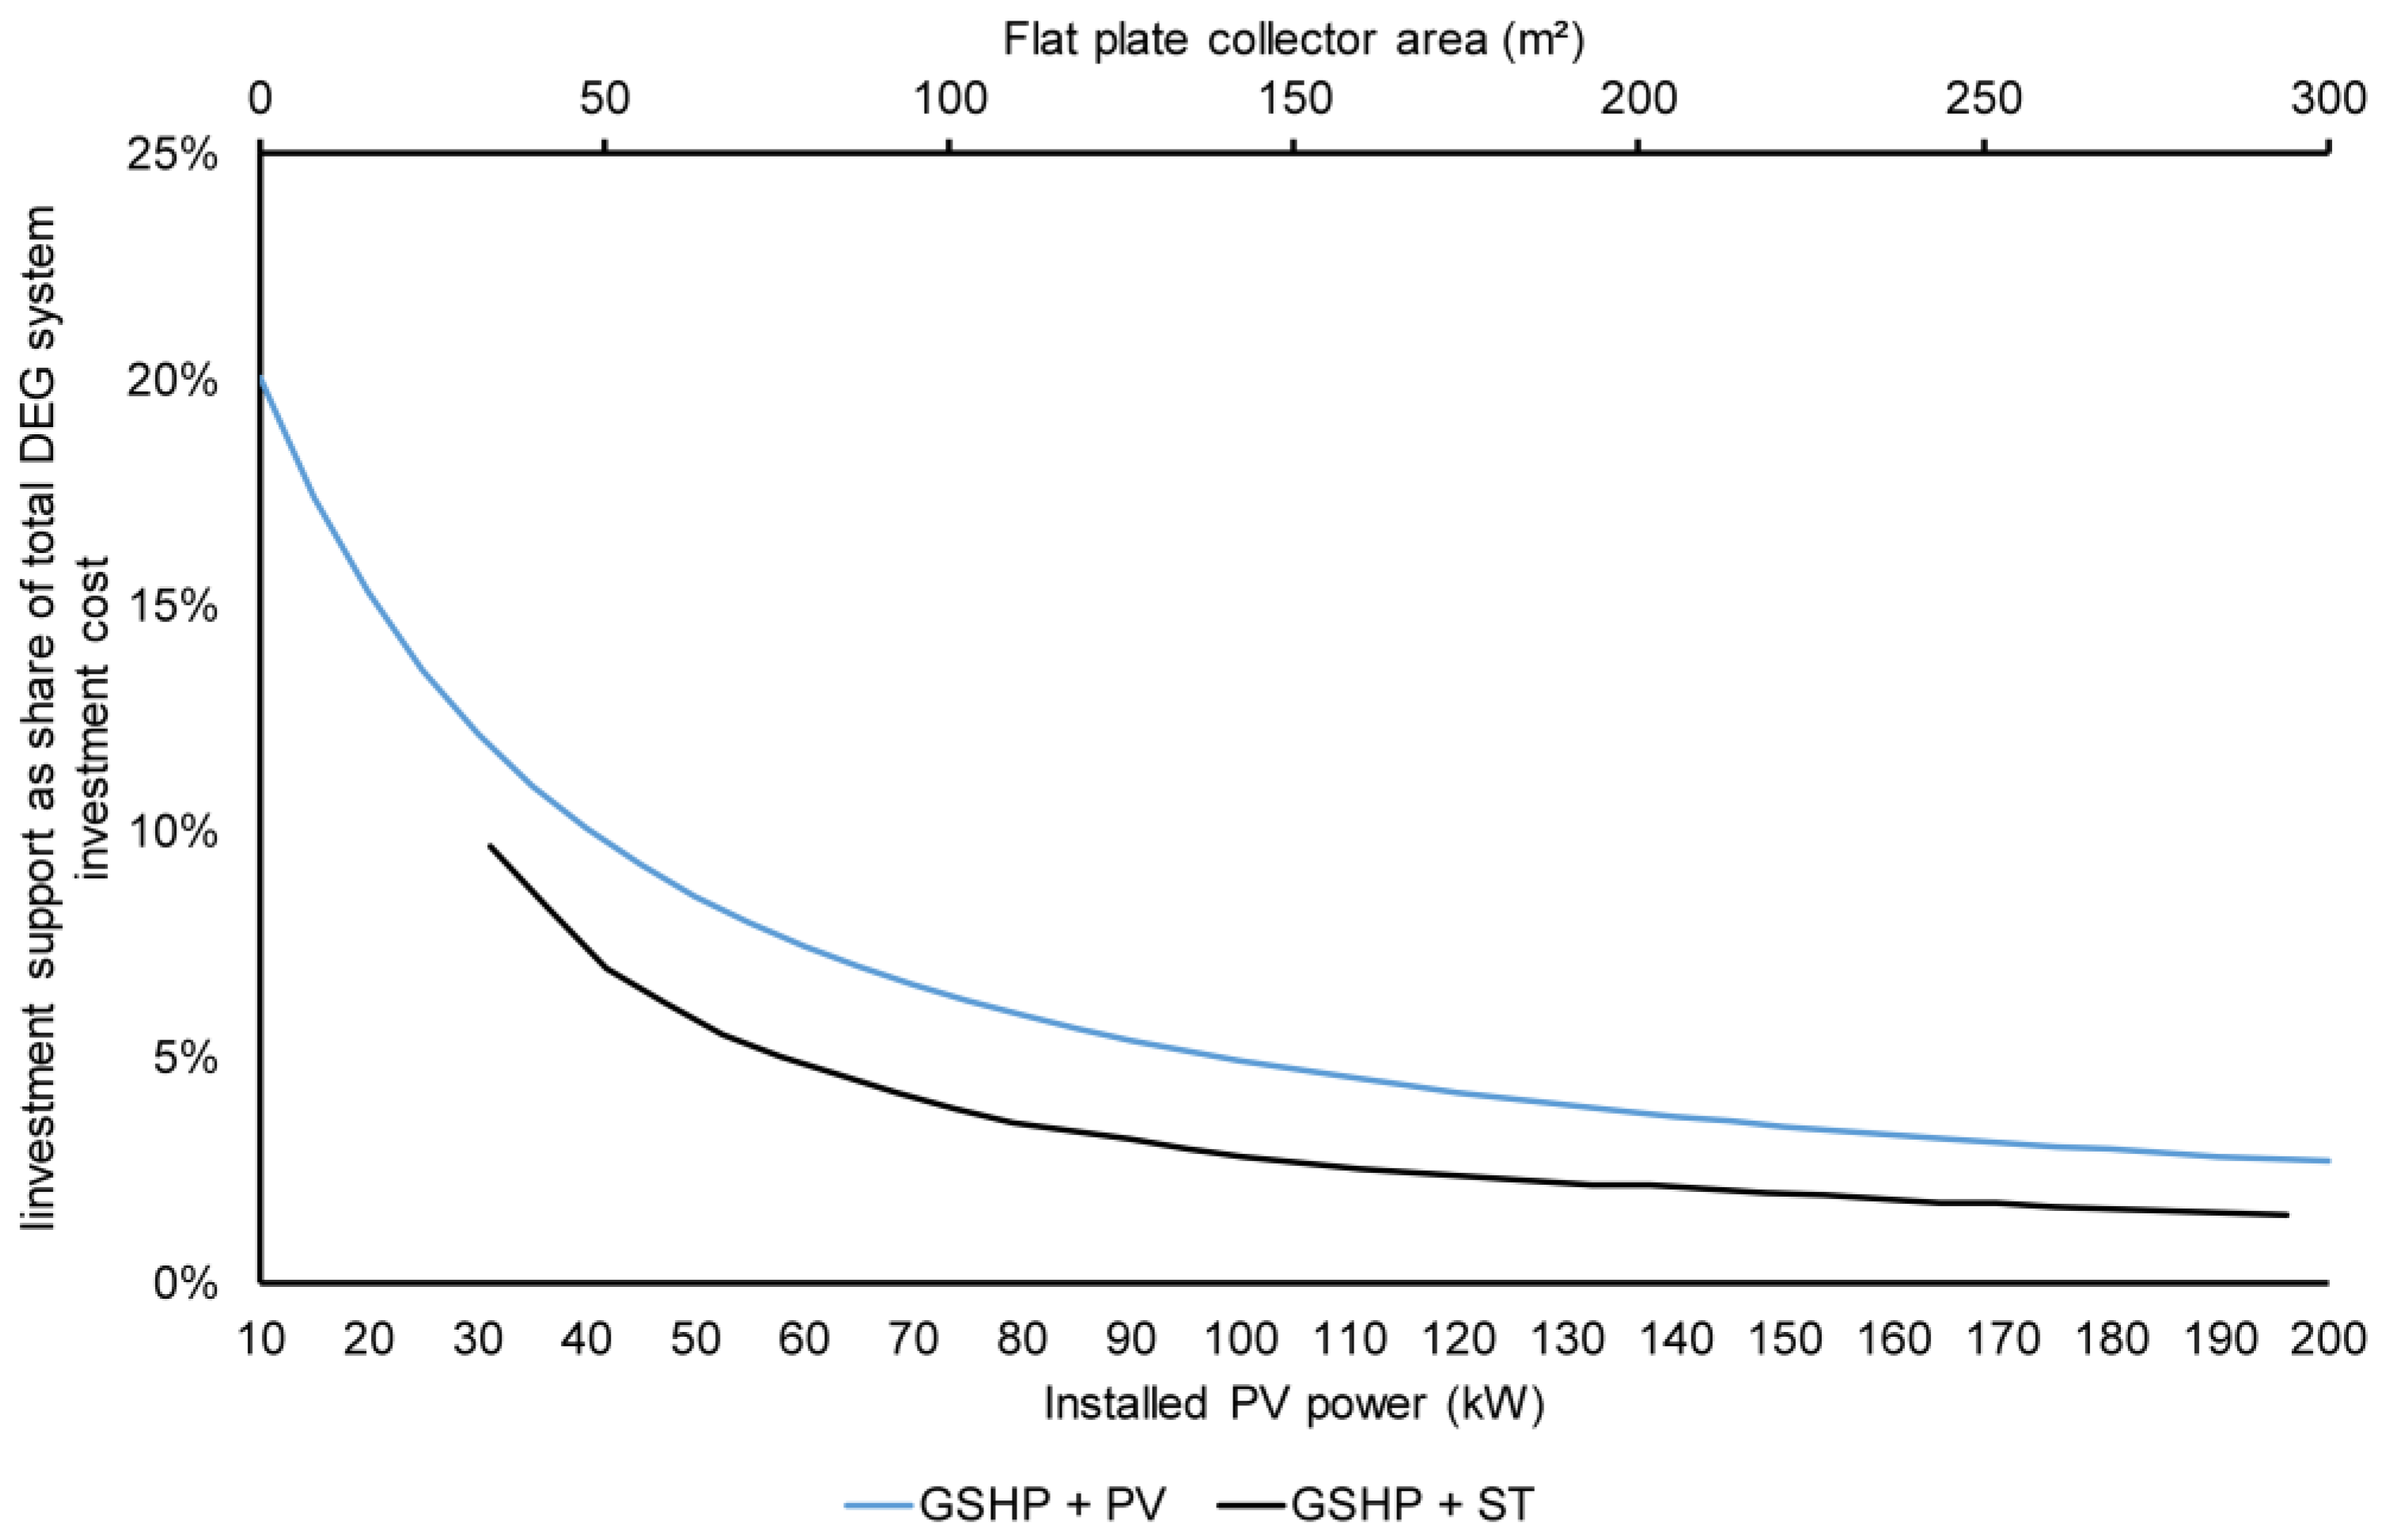
The way the proposed incentive scheme is affecting the building with a GSHP and combined with a PV or a ST system is presented in
Figure 10.
As indicated in
Figure 10, the alternative that uses the GSHP and PV gets the highest share of support. The incentive share of the total PV system costs only reach the level of the current investment incentive system for PV system sizes below 10 kW
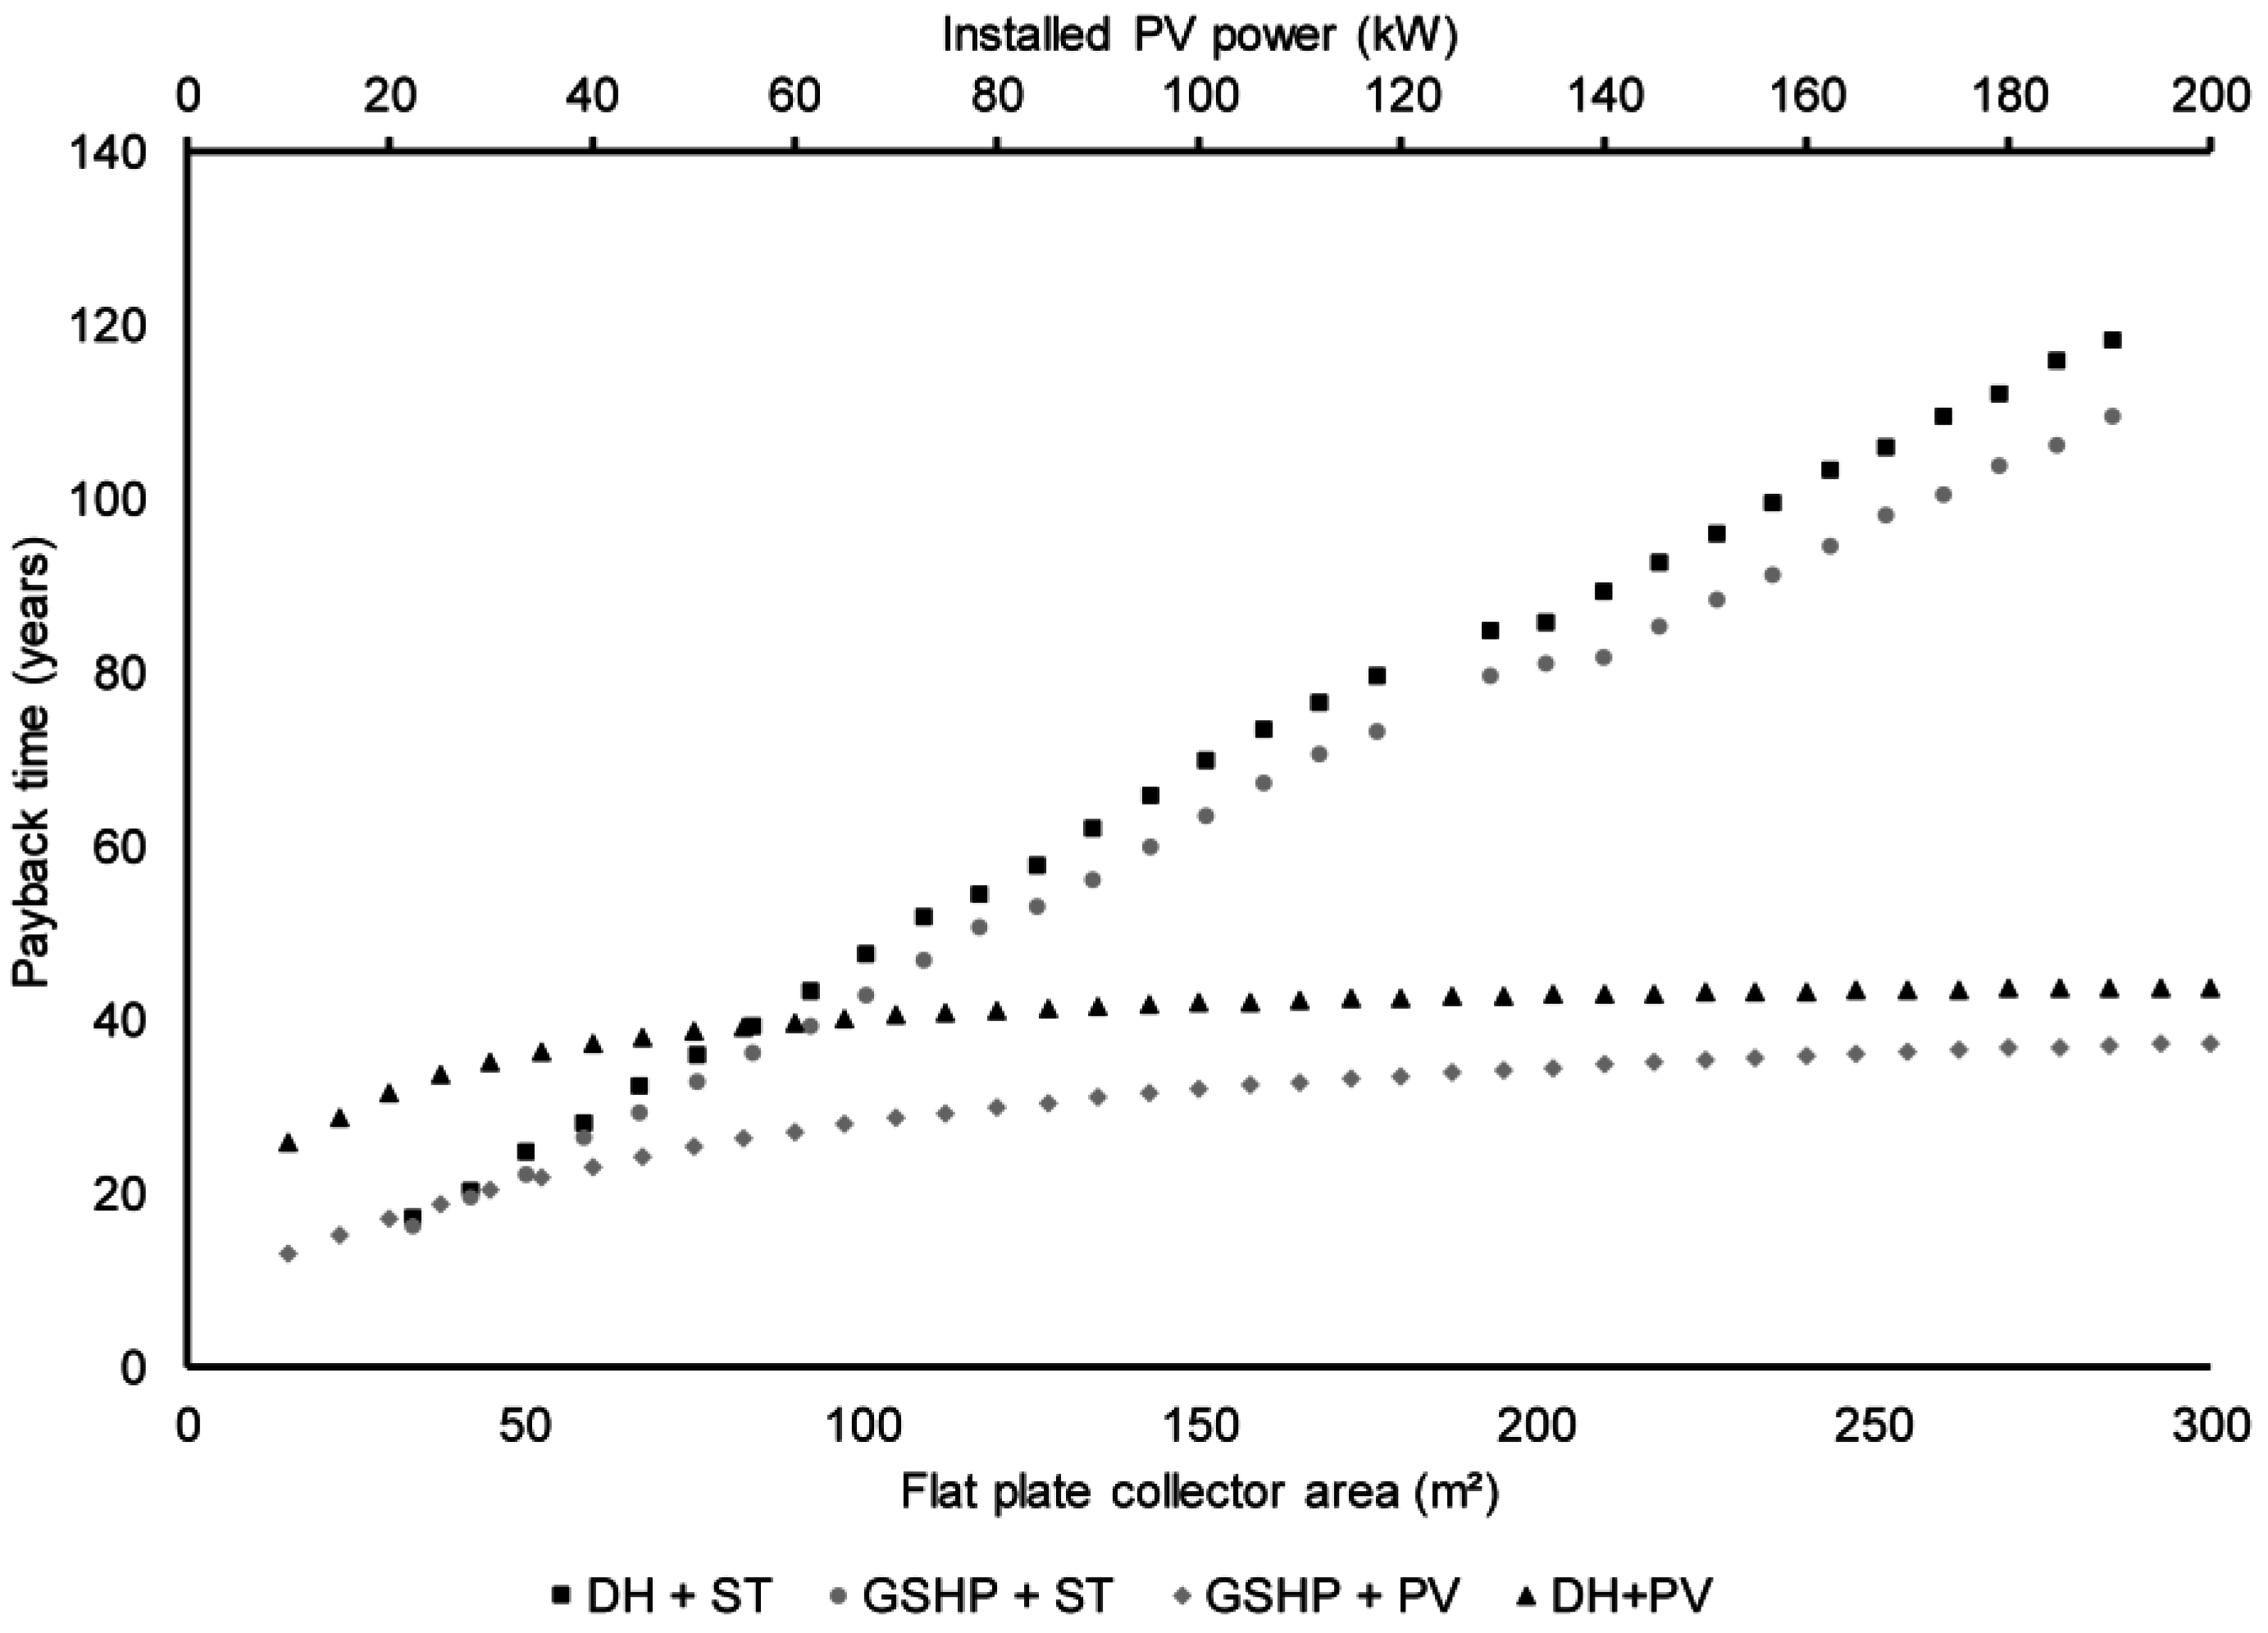
p. The proposed incentive scheme gives lower economic support than the current system, but the proposed system can be scaled up with ease if deemed necessary. In this article, the importance is the proposed support mechanism, not the exact level of support. Even though it is the mechanism that is important, it is still interesting to calculate the payback time for DEG systems with the proposed incentive schemes. This is presented in
Figure 11 for the different system combinations. The results of the payback time calculation indicate that the proposed incentive scheme steer towards systems that have a rather high share of self-consumption and reduction in specific energy demand—this is visualized in
Figure 11.
It is difficult to compare the differences between the current and proposed incentive schemes due to the fact that the current yields revenues every year and the proposed only gives a fixed amount at the time of installation. Therefore, no comparison is presented in this article. However, it is easy to notice in
Figure 10 that the highest investment support share of the proposed incentive scheme reaches 20% which is equal to one of the three current incentives, namely the investment support scheme.
4. Discussion
There is a large advantage for the building with the GSHP in terms of specific energy demand. This is due to the fact that the Swedish proposal for new building regulations focus on purchased energy, but the Swedish National Board of Housing, Building and Planning has tried to reduce the advantage for heat pumps by introducing the weighing factor of 2.5. This is not enough, because modern heat pumps usually have a seasonal COP higher than 2.5 and thus still have an advantage over other types of heating systems in regards to specific energy demand. Also, the building with DH and ST has a fairly large reduction in specific energy demand. A large decrease in specific energy is the focus of the proposed incentive scheme. To achieve this, it is important to give higher incentives to the system combinations with highest reduction in specific energy demand. With the proposed incentive scheme, the system combinations GSHP + PV and DH + ST get the highest share of incentives of the analyzed system combinations. There is an ongoing study and discussion in Sweden regarding the usefulness of saving heat in DH-heated buildings and how that affects the electricity generation fuel mix on a European level. In the article, the building is the system limit, and the author has not analyzed the effect on the European fuel mix.
How incentives affect the choice of DEG system is hard to evaluate, but the current, fairly rapid growth trend of the PV system and the current diminishing solar thermal market indicates that the three-PV-system incentives are steering towards installation of PV systems instead of solar thermal systems. The annual capacity growth is presented in
Figure 1, located in the introduction section. The incentive schemes also steer towards PV systems on buildings with low daily electricity demand during the summer, which means that a large part of the PV electricity has to be fed into the grid and sold. After the end of the incentives, these systems with low self-consumption will be less profitable than before because of the Swedish electricity cost structure, which has a fairly high total cost when purchasing electricity and a fairly low price of sold electricity.
With the proposed incentive scheme, buildings with low electricity demand during summer will be steered towards installing an ST system. Also, the size of PV systems will be restricted, because the proposed incentive scheme steers towards systems that save electricity in the building instead of installing systems as large as the building roof with the risk of steering towards too large, and in the future, perhaps unprofitable systems. All other current incentive schemes for PV are unnecessary with this proposed scheme. The energy storage incentive is in a way part of the proposed one, as the support will increase with an energy storage system because of an increased reduction of the specific purchased energy demand.
5. Conclusions
The two system combinations with GSHP-heated buildings have the lowest specific energy demand, as expected. The GSHP plus PV system combination achieves the largest reduction in specific purchased energy demand of all combinations, and the DH plus PV system combination has the lowest reduction in purchased specific energy demand. A main conclusion of RQ1 is that in order to reduce the specific purchased energy demand as much as possible, GSHP-heated buildings should be combined with PV systems and DH-heated buildings should be combined with ST systems.
The growth in PV capacity in Sweden since the current support was introduced indicates that it has steered towards installation of PV systems. However, as concluded above in the results, the discussion, and the conclusions sections, PV systems have a marginal effect on the specific purchased energy demand in buildings with heating systems that are not electrically driven. The effect of the PV incentive schemes is that they steer away from the best DEG system solution in terms of reduction of the specific purchased energy demand (RQ2).
As concluded above, it is necessary to change the incentive scheme if it is going to be possible to use it to build more energy-efficient buildings in regards to the Swedish building regulations adapted to the EPBD.
The conclusion of RQ3 is that the incentive scheme should be changed so it focuses on how large of a reduction in the specific purchased energy demand the DEG system is contributing. The system gives a fixed amount per kWh/m2/year by which the DEG system reduces the building’s specific purchased energy demand. The tax deduction system and the energy storage incentive scheme will, in this proposal, be discontinued (RQ3).


