Stress Inversion of Coal with a Gas Drilling Borehole and the Law of Crack Propagation
by
 ,
,
Tianjun Zhang
1,2,3, 
Lei Zhang
2,3,*,
Shugang Li
2,3,
Jialei Liu
4,
Hongyu Pan
2,3 and
Shuang Song
2,3 1
College of Science, Xi’an University of Science and Technology, Xi’an 710054, China
2
School of Safety Engineering, Xi’an University of Science and Technology, Xi’an 710054, China
3
Key Laboratory of Western Mine Exploitation and Hazard Prevention of the Ministry of Education, Xi’an 710054, China
4
China Gezhouba Group No.5 Engineering Co., Ltd., Yichang 443002, China
*
Author to whom correspondence should be addressed.
Energies 2017, 10(11), 1743; https://doi.org/10.3390/en10111743
Submission received: 24 September 2017
/
Revised: 18 October 2017
/
Accepted: 27 October 2017
/
Published: 30 October 2017
Abstract
:For studying the law of crack propagation around a gas drilling borehole, an experimental study about coal with a cavity under uniaxial compression was carried out, with the digital speckle correlation method capturing the images of coal failure. A sequence of coal failure images and the full-field strain of failure were obtained. The strain softening characteristic was shown by the curve. A method of curve dividing—named fitting-damaging—was proposed, combining the least square fitting residual norm and damage fraction. By this method, the five stages and four key points of a stress-strain curve were defined. Then, the full-field stress was inverted by means of the theory of elasticity and the adjacent element weight sharing model. The results show that σci was 30.28–41.71 percent of σf and σcd was 83.08–87.34 percent of σf, calculated by the fitting-damaging method, agreeing with former research. The results of stress inversion showed that under a low stress level (0.15 σf < σ < 0.5 σf), microdamage evolving into plastic failure later was formed around the cavity. Under a high stress level (0.5 σf < σ < 0.85 σf), the region of stress concentration suddenly crazed and formed a brittle crack. When σ ≥ 0.85 σf, the crack was developing, crack lines were connecting with each other, and the coal finally failed. The outcome of the stress inversion was completely concomitant with the images of crack propagation. Additionally, the stress around the cavity was able to be calculated accurately.
1. Introduction
Extraction is widely used in the prevention and management of gas, and drilling construction is bound to change the original stress distribution of coal and rock mass [1]. A complex stress distribution increases the difficulty of studying the crack propagation law of coal around the borehole. As the stress can reflect a crack’s propagation intuitively, stress inversion is helpful to reveal the evolutionary mechanism of crack propagation.
In order to study the evolutionary mechanism of crack propagation, a large number of samples are taken and a gypsum-like compression test is carried out [2]. Finally, the crack is divided into four types, and the state of each crack is described in detail. Strain gauges are used to measure the strain around the borehole [3]. A single cavity and multiple cavities are simulated by RFPA2D, and the lateral compressive coefficient is calculated [4]. A three-dimensional (3-D) model is built to reveal the crack propagation around cavities [5]. The stability of the hole is calculated by theory and an engineering experiment is carried out to verify the results [6].
However, the above conclusions are limited by research methods, which mainly use continuous media and classical elastoplastic theory to carry out research. Researchers believe that the elastic and plastic range and equilibrium theory cannot completely solve the problem of damage to coal and rock damage, and need to analyze the damage from different scales of evolution [7]. So, acoustic emission and electromagnetic wave observation methods are used to reveal the evolution of coal and rock with a uniaxial compression test [8]. The digital image correlation (DIC) method is a measure of surface displacement. The basic principle of DIC was introduced by [9]. The DIC method is used for rock deformation observation and to explain the process of rock failure from the perspective of strain localization [10]. The uniaxial compression test on sandstone with two nonparallel fissures has been carried out, and the relationship between the crack angle and the failure type was discussed [11]. A uniaxial compression test on rock materials was conducted with DIC [12]. With a numerical simulation analysis, the relationship between the macroscopic mechanical response and the micromechanical mechanism was discussed. Now, the DIC method is being used for a wide range of applications on all kinds of materials, such as metal [13], rubber [14], and rock [15]. Furthermore, the effects of mixed-mode I/II loading on fracture studies have been performed by [16]. Additionally, the accuracy of the DIC method under a recoding resolution of 1000 × 1000 pixels2 and aimed at a 10 × 10 mm object could achieve ±100 mm [17].
The process of rock mass destruction is related to the elasticity and plasticity of solid materials. It is still impossible to fully explain the structure of the rock mass during the change of elastic stage to shaping stage. In order to explore the evolutionary mechanism of crack propagation of coal around a borehole, this paper presents experimental investigations on a uniaxial compression test of coal with a cavity. A compression test was used as the traditional research of coal sample damage is based on an image analysis, which cannot quantitatively analyze the surface on the meso-scale. Furthermore, the stress analysis of the experiment was very hard to carry out. Thus, the DIC method was used for handling these problems to analyse the procedure of a sample’s destruction. With the DIC method, detailed records of the image of the coal samples during destruction can be used to obtain a full stress-strain curve and an image sequence of a coal sample’s surface failure. By an analysis of the stress-strain curve and the surface damage of the coal samples, the key points and phases in the process of failure are determined. By the elasticity theory and the adjacent element weight sharing model, the surface stress of the coal sample is inverted, and the crack propagation process and evolutionary mechanism are studied.
2. Method and Theory
2.1. Digital Image Correlation
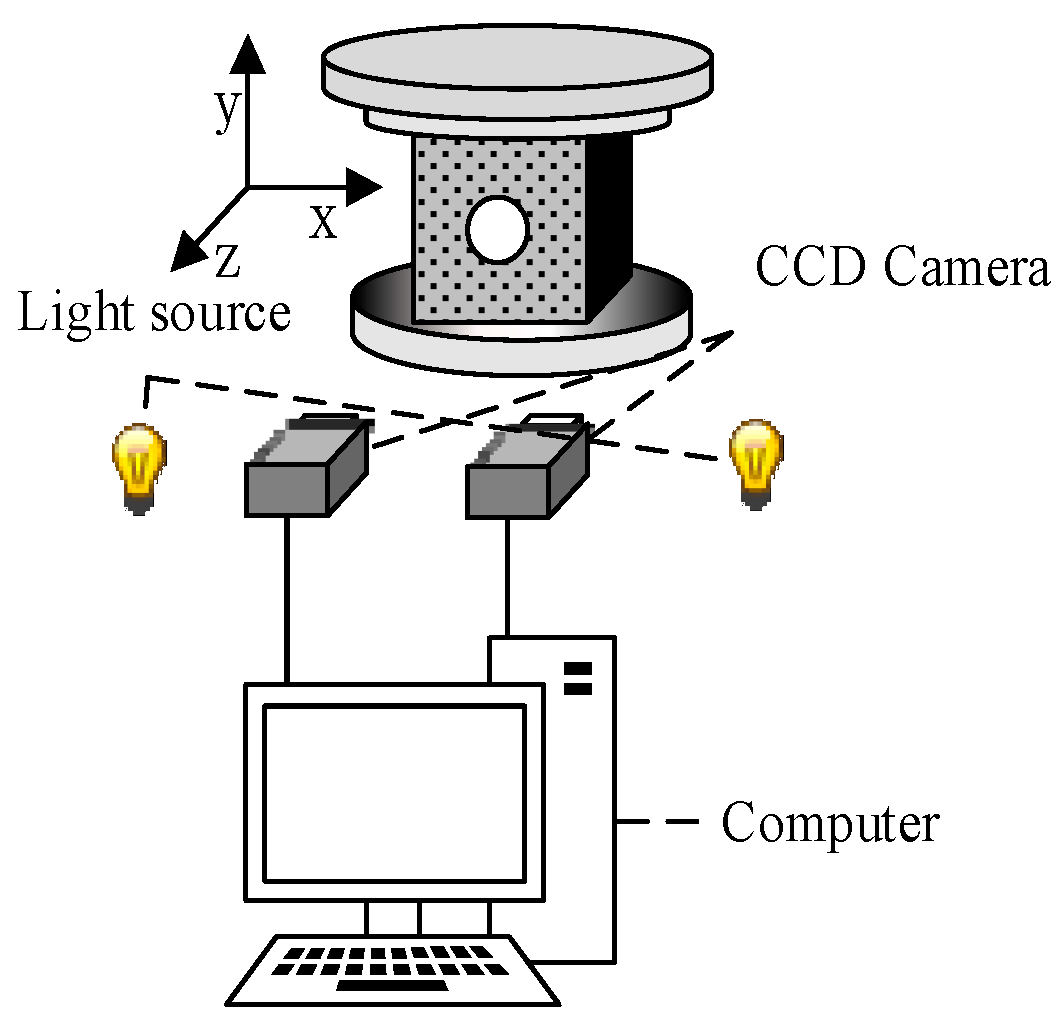
Digital image correlation (DIC) is a non-contact measurement method that can be used to obtain the surface deformation field of a specimen. The system is mainly composed of an acquisition system and a data storage system, as shown in Figure 1. The experimental system calculates the deformation of the entire field by the difference method and a pattern-matching algorithm by use of the computational visual principle.
During the experiment, the system collects the surface images of a sample in real time and stores it in the computer in the form of a digital image. Additionally, the output of this system is the field of strain as a matrix. Assuming that there are i analysis points in the horizontal direction of each image and j analysis points in the vertical direction, an image is collected at time t and the multidimensional matrix Rt is obtained by
where Xij, Yij, Zij, Uij, Vij, Wij, εxij, and εyij are the X, Y, and Z coordinates, the displacement of the X, Y, and Z directions of point(i, j), the X-direction strain, and the Y-direction strain, respectively.
Rt(Xij, Yij, Zij, Uij, Vij, Wij, εxij, εyij)
2.2. Model of Stress Inversion
In the elastic phase, the stress can be calculated from the strain, the elastic modulus E, and Poisson’s ratio μ, as in Equation (1).
After the sample is broken, the stress is calculated by the adjacent unit weighting model on the hypothesis that the sample contains a total of L damage microcells. These microcells are randomly distributed in the research system, forming M disconnected disruptive groups. Lm was used to denote the number of broken microcells in the group.
Additionally, the damage on the Group Lm should be borne by the adjacent unit to bear the stress, expressed as:
where F(Lm) is the function of the Lm element in relation to the stress; W(Lm) is the function of the stress in the X, Y, and Z directions of the group; W(d) is the distance weight; and d is the distance between the complete unit and the damage unit. Considering the mutual influence among the damage units, F(Lm) is corrected to the function of the damage fraction λ.
2.3. Method of Defining the Stress-Strain Curve
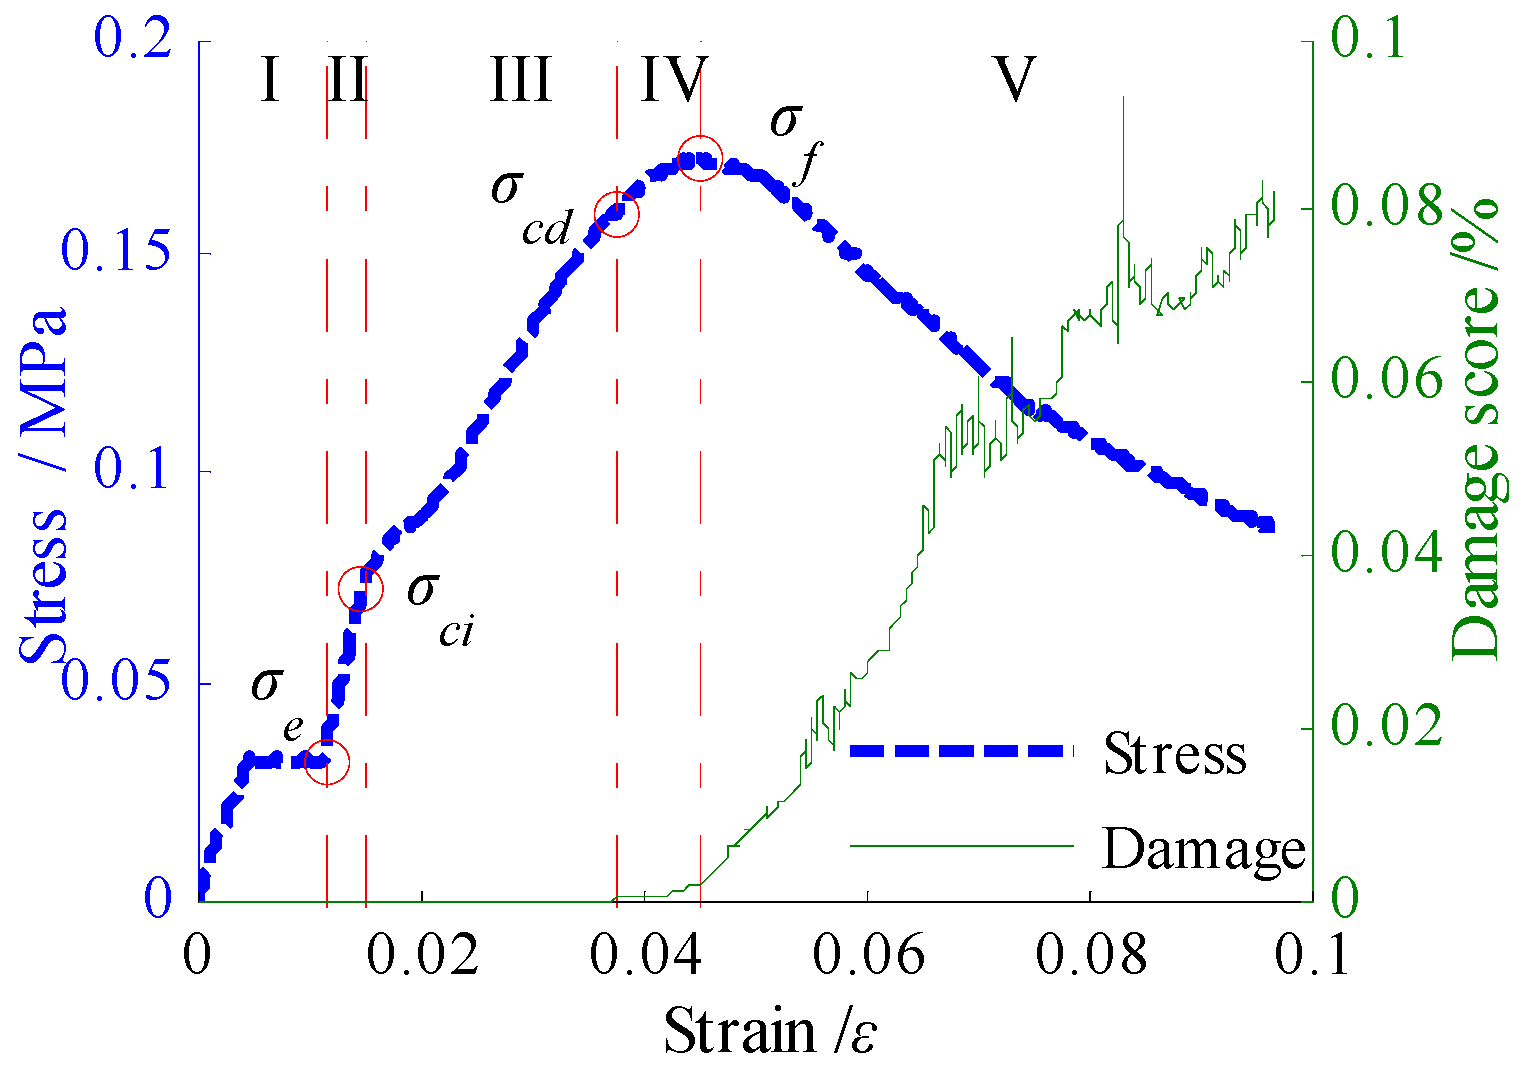
For a more accurate study of the compression process, the key points (elastic starting stress σe, crack initiation stress σci, crack failure stress σcd, and peak stress σf) in the full stress-strain curve are determined and partitioned. Firstly, calculated the coal sample surface damage fraction Di is calculated. Then, the damage score curve, which is defined by Equation (6), is drawn.
where A is the original area of the coal sample’s surface, A* is the damage area on the surface, and A0 is the initial damage area of the coal sample. In the DIC system, the coal sample’s surface corresponds to i × j analysis points in the initial state. When the coal sample’s surface is damaged, the corresponding analysis points would disappear. According to the relationship between the area and the analysis point, the damage score can be defined as:
where s is the analysis point of disappearance and s0 is the number of analysis points missing from the initial state.
The damage score curve of the compression process can be calculated according to Equation (7), and the Nonzero starting point of the curve corresponds to the crack stress σcd. Secondly, according to the physical meaning of the elastic modulus, we find the part of the full stress-strain curve closest to the straight line segment as the elastic stage, and construct the European norm:
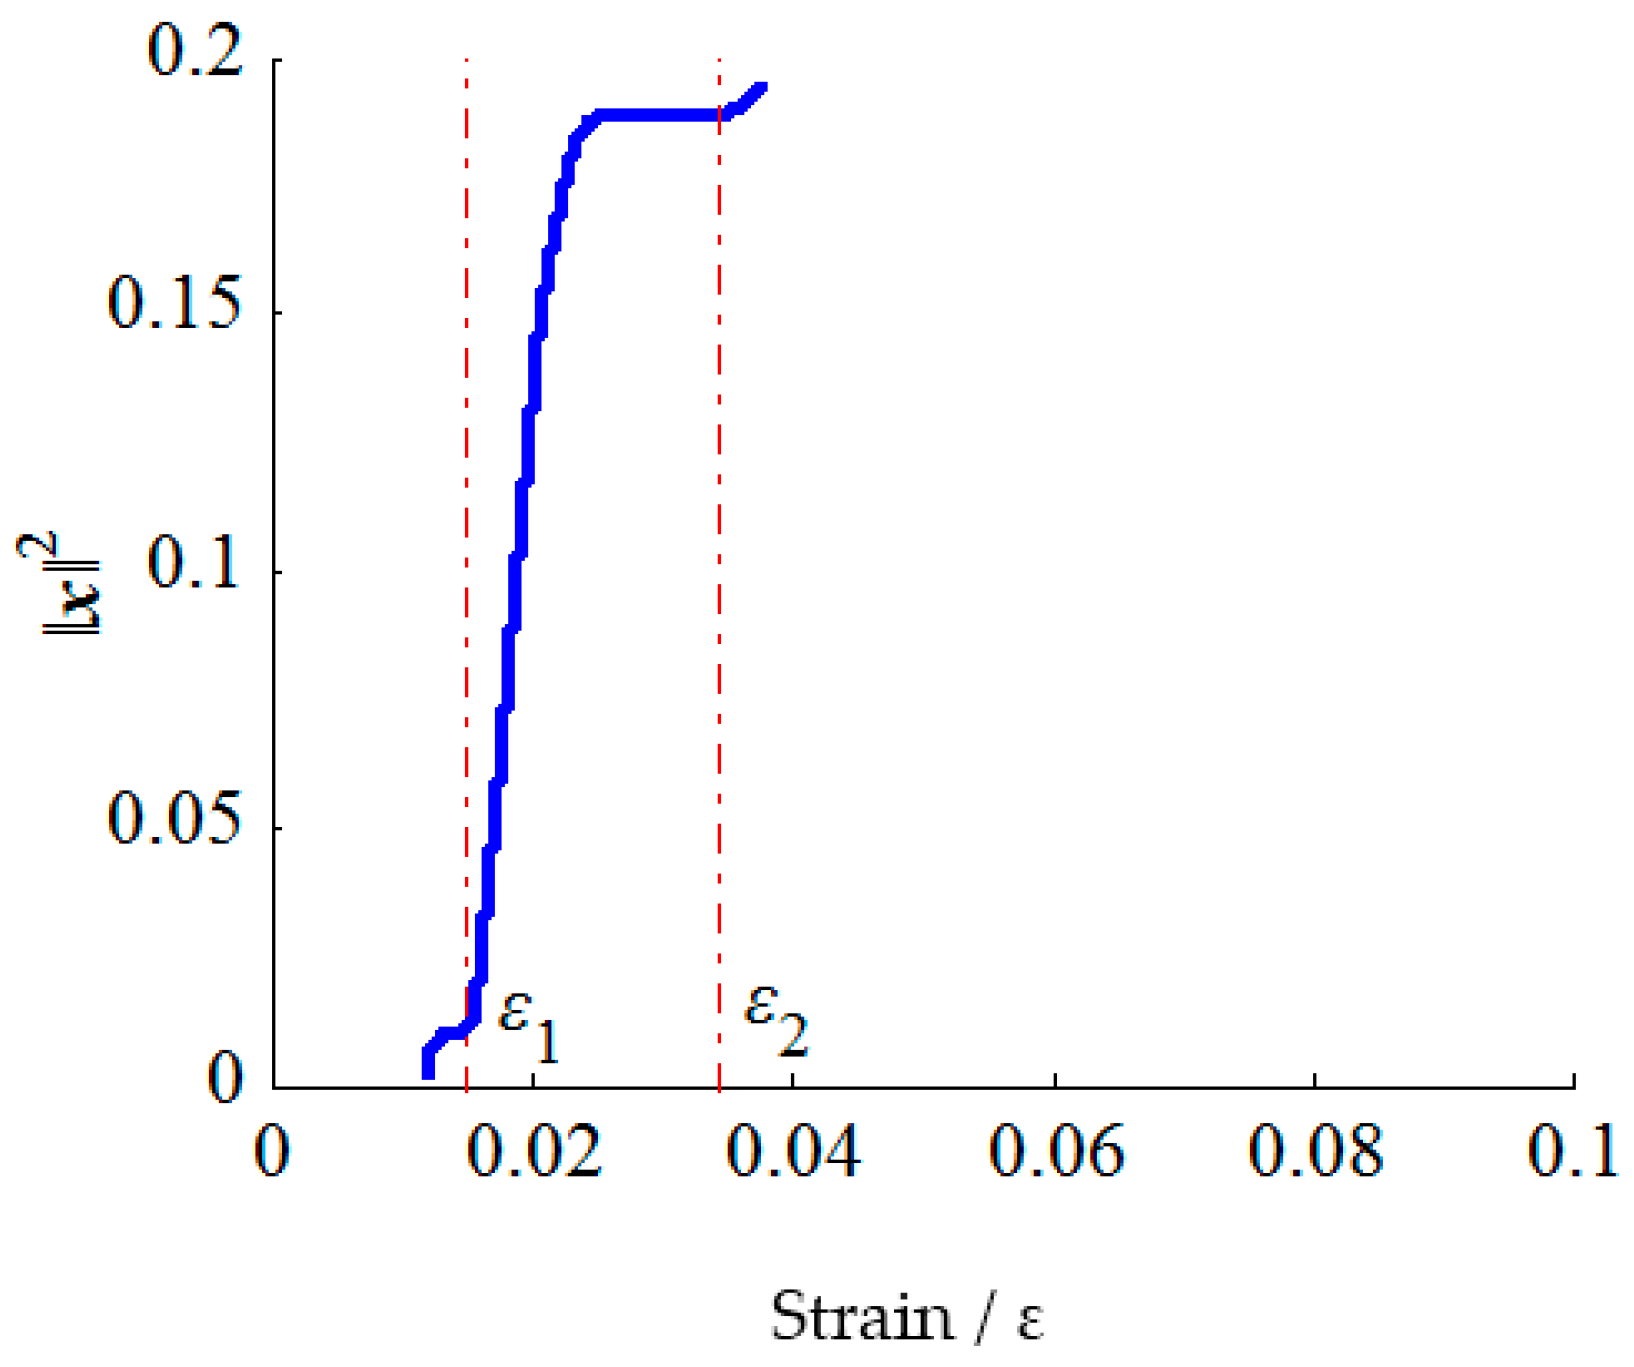
The above equation, also known as the Euclidean distance, means the norm of the vector x, commonly used to characterize the degree of curve fitting [18]. Let xi be the residual of each point of the stress-strain fitting curve, n be the number of fitting points, and let ‖x‖2 represent the merits of the fitting curve. When ‖x‖2→0, the fitting curve is closest to the original curve. In this experiment, since the stress sensor frequency of the testing Machine was fixed at 10 Hz, so that n is 10 times that of t, n = 10t. In the experiment, the loading method is fixed at a load rate, v, which means n and ε are a linear relationship, so the ‖x‖2 − n curve can be directly drawn as a ‖x‖2 − ε curve, as shown in Figure 2.
The point of the stress-strain curve is fitted by the least square linear method, which starts with σe and ends with σcd. The point of participation is gradually increased, and the euclidean distance remains constant, as shown in Figure 2, which means that the participation of the points is in the same line. There are two lines with a higher degree of fit, and the first (the end point corresponding to ε1) is much better than the second (the end point corresponding to ε2). So, ε1 is the end point of the elastic phase, and the corresponding stress is the crack initiation stress σci. When the strain is larger than ε1, the coal sample enters the stable crack development stage.
3. Experimental Details
3.1. Specimen Preparation
For researching the stress around the hole, a hole must be contained in the coal sample. A complex curve structure forms after boring a hole in the cylindrical sample, which makes the regular part of our research harder. However, a flat plane forms after boring a hole in the cube sample, which makes our research more convenient. Additionally, the diameter of the hole is 10 mm, and for reducing the influence of the stress concentration and end effect, the distance between the edge of the sample and the hole must be larger than 30 mm. So, a 70 mm cube sample was a better choice for this research.
First, the coal slurry must be prepared. The slurry was mixed with coal, fly ash, and water, with the quality ratio as 11:2:7. Then, the slurry was cast in a 70 mm × 70 mm × 70 mm cube coal sample box. Subsequently, a cylinder having a diameter of φ = 10 mm and a height of 100 mm was placed in the center of the slurry, thereby prefabricating the holes. Finally, after the slurry was completely solidified, the cylinder was removed and speckle was sprayed in the coal sample on the drilling side. The coal sample situation is shown in Table 1. The experiment was loaded with a DDL200 electronic testing machine, and the loading method was controlled by displacement. The loading speed was 0.2 mm/min. Images are captured by two sets of Pointgrey® charge-colored device (CCD) cameras (Point Grey Research® Inc., Richmond, BC, Canada) and Pentax® 75 mm lenses (Ricoh Imaging Company, LTD., Tokyo, Japan). To prevent any impact of strobe on data acquisition, two OSRAM® 55460 optical lights (OSRAM Licht AG, Garching, Germany) were the light sources. During the loading process, the DIC acquisition frequency was 1 Hz.
3.2. Experiments Result
The full stress-strain curve of the coal sample is shown in Figure 3, and the curve is consistent with the results of Martin [14]. The five stages and four key points are shown in Figure 3. The σc is 30.28–41.71% of the peak stress σf, and the σcd is 83.08–87.34% of the σf. Table 2 shows σe, σci, σcd, and σf, the ratio of the crack initiation stress to the peak stress σci/σf, and the ratio of the crack failure stress to the peak stress σcd/σf.
The stress-strain curves of Figure 3 are different from those in [19] where natural rock through a complex diagenesis was used, and the internal gap was much smaller than the bricks produced in this test. The internal porosity of the sample was much larger, and leads to the difference in the I partition.
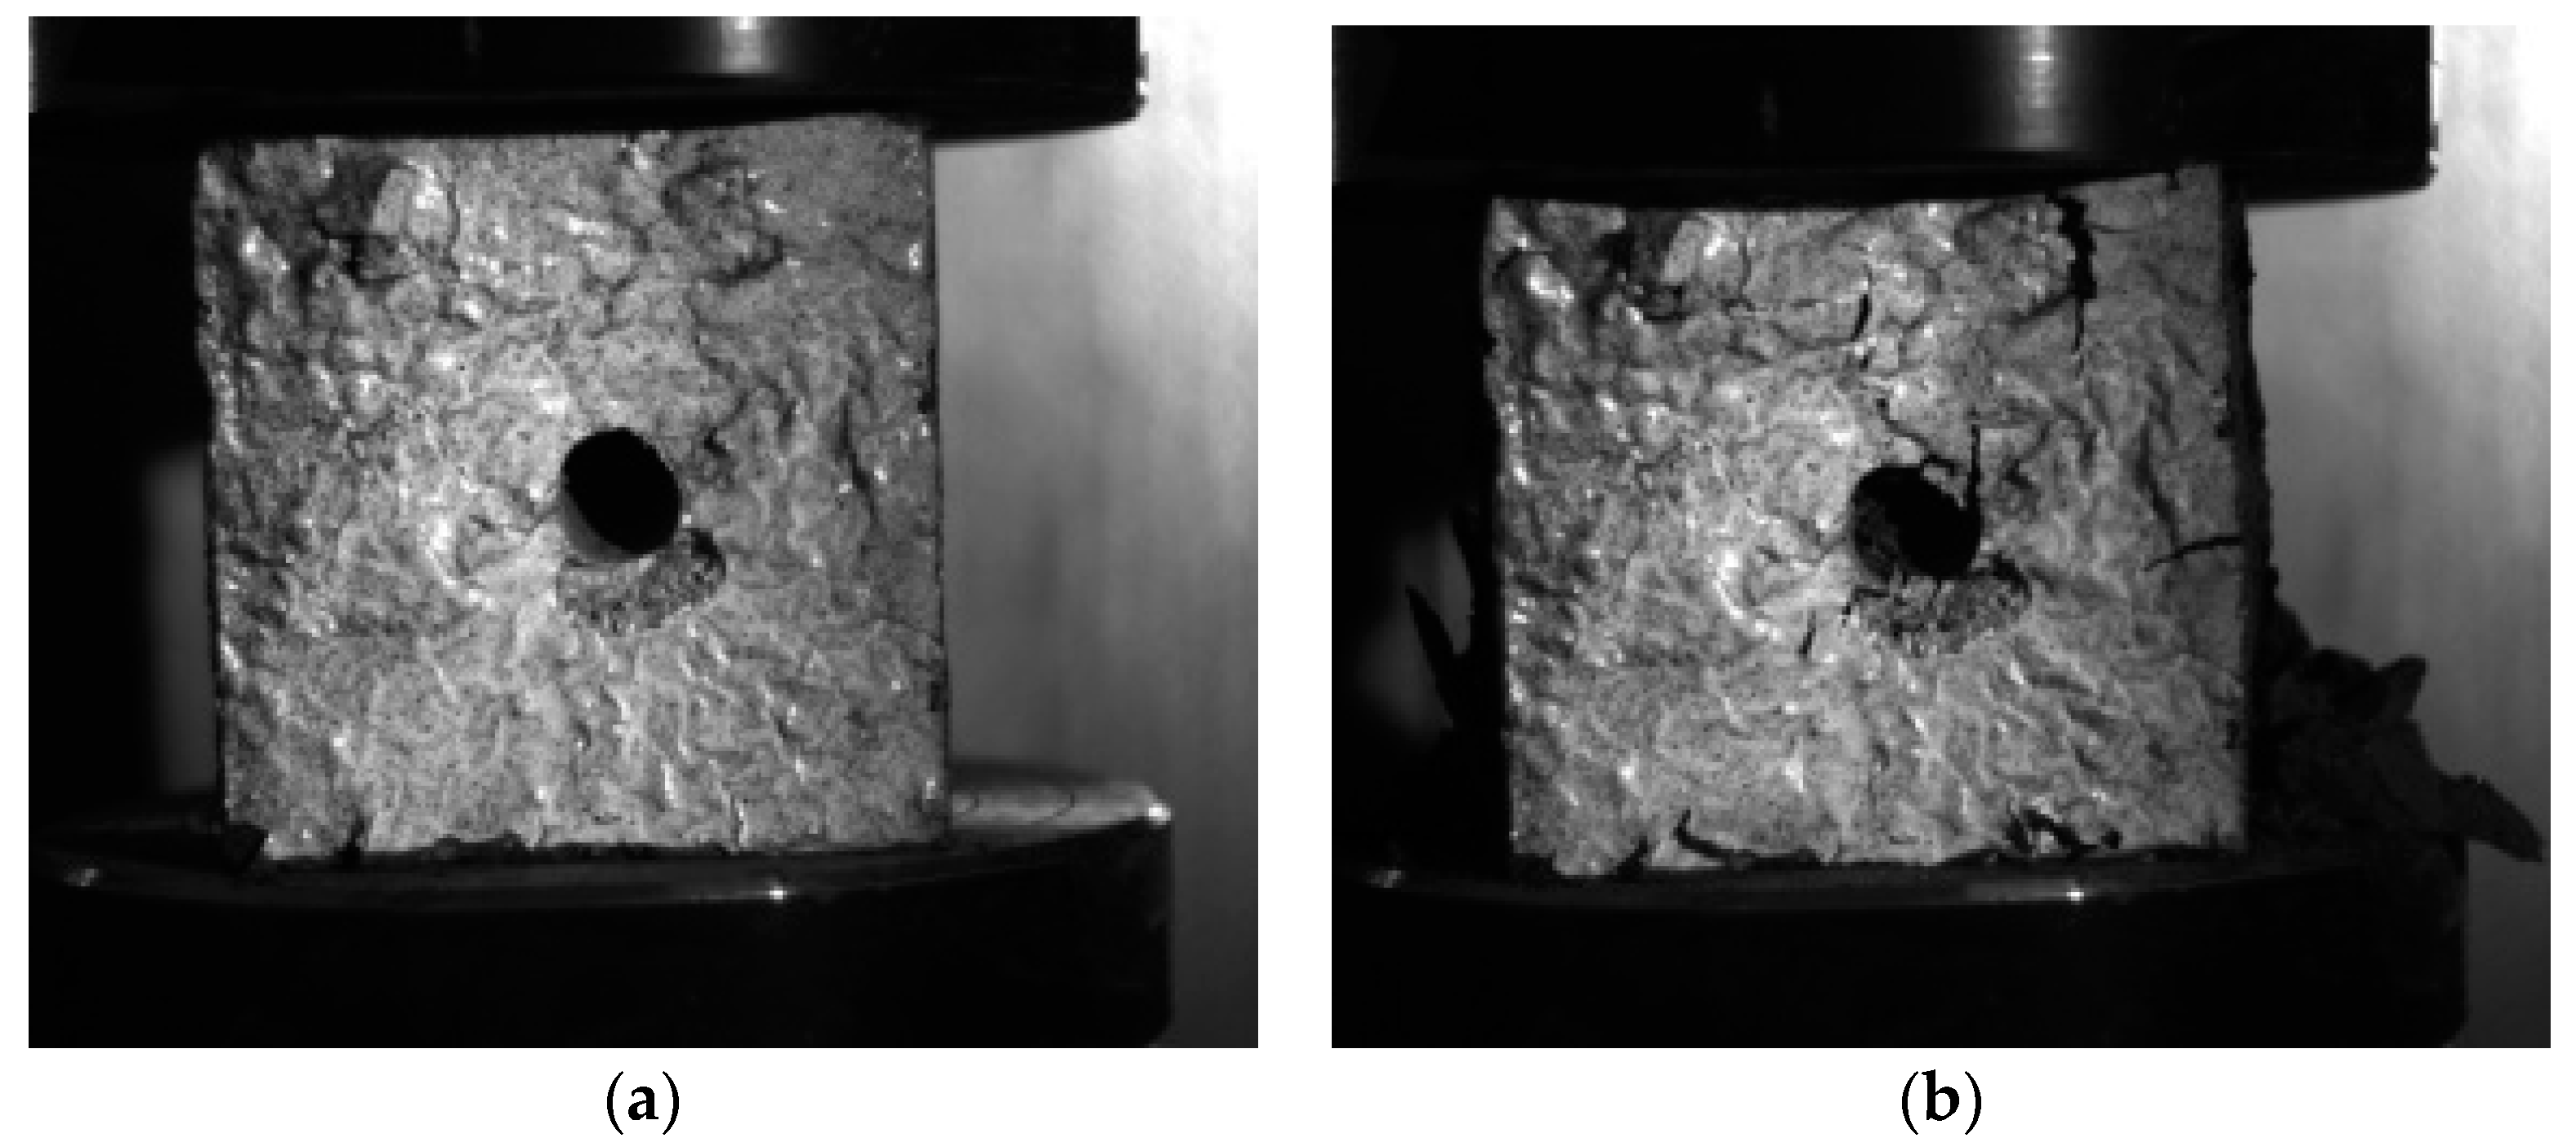
Taking Sample 16 as an example, a coal sample is shown in Figure 4. The surface displacement field of the sample is shown in Figure 5. It can be found that the evolution of the displacement field in the process of the coal sample’s compression involved two stages: (1) from chaos to order; and (2) from order to slice. The previous stage mainly occurs in the I, II, and III partitions, and the latter stage mainly occurs in the IV and V partitions.
In the beginning of the test, as shown in Figure 5a, the displacement of the coal sample’s surface is different, showing a random distribution of a chaotic state. As the coal sample in the outside without load is under a natural dry formation, there is a large gap within the coal sample. In the case of coal pressure, the loose structure still has a certain carrying capacity, and the stress increases gradually with the increase of strain. After the pressure is more than the carrying capacity, the loose structure is destroyed and the coal sample is compacted, the stress is kept constant and the strain increases, and the full stress-strain curve is shown to be an approximately horizontal straight line. Under the action of axial pressure, the surface of the coal sample forms directional movement.
With an increase of axial strain, the displacement of each point on the surface of the coal sample shows a linear distribution of 45° from top to bottom, and the displacement field gradually changes to an orderly state, as shown in Figure 5b. As the axial strain increases, the stress increases to σe, and the internal voids of the coal sample are completely closed and enter the elastic phase (II partition in Figure 3). In this stage, the displacement of the points on the surface of the coal sample has the characteristic of diffusing downward from the top, the surface points are uniformly deformed, and the displacement field distribution is kept constant, as shown in Figure 5b,c. The full stress-strain curve is approximated as a straight line as shown in Figure 3, the coal sample is linearly elastic, and the surface displacement field is ordered.
When the stress is larger than σci, the order of the displacement field of the coal sample is strengthened, the internal cracks are dominated by the overall mechanical behavior of the coal sample, and the typical linear elastic phase ends to enter the crack stabilization stage (III partition in Figure 3). When the loading is carried out, the internal weak structure of the fracture is initiated and affects the top-down displacement transfer process, eventually forming a displacement field associated with the internal fracture, as shown in Figure 5c. At this time, the surface of the coal sample has not yet produced macroscopic visible cracks, and the damage score at this stage is still constant.
When the stress is larger than σcd, the surface displacement field of the coal sample starts to transit from an ordered state to a fragmented state, and the coal sample enters the crack acceleration stage (IV partition in Figure 3). Under the action of the upper load, the displacement field, which exists in the coal sample, begins to fragment and show a localized trend, as shown in Figure 5d. The discontinuous fracture at the displacement results in the rapid expansion of cracks, the formation of macroscopic cracks, and the damage scores rise sharply.
As the axial strain increases, the stress is loaded into σf, and the coal sample breaks as shown in Figure 5e, indicating an entry into the post-peak phase (V-partition in Figure 3). The crack pattern divides the coal sample into four regions, and the coal surface displacement field is completely in a fragmented state.
4. Results and Discussion
4.1. Stress Calculation around the Hole
The elastic modulus E of the coal sample was obtained from the full stress-strain curve according to least squares fitting. Based on the ratio of the average transverse strain ε’xx to εyy, the method was used to calculate the lateral strain proposed by [20]. The coordinates of the measurement points of the system boundary in the elastic phase were obtained by using the left and right boundary coordinates. The average transverse strain could be calculated by the difference in the approximation. The final Poisson’s ratio can be calculated from Equation (9).
where n is the number of boundary points, w is the initial distance of the boundary, and Δxi is the distance between the left and right borders at the same level. Based on the data from each image, we obtained the function of μt and the Poisson’s ratio μ at time t. Additionally, σ = 11.0948ε − 0.0936 and E = 11.0948 MPa according to the stress-strain curve in the elastic phase.
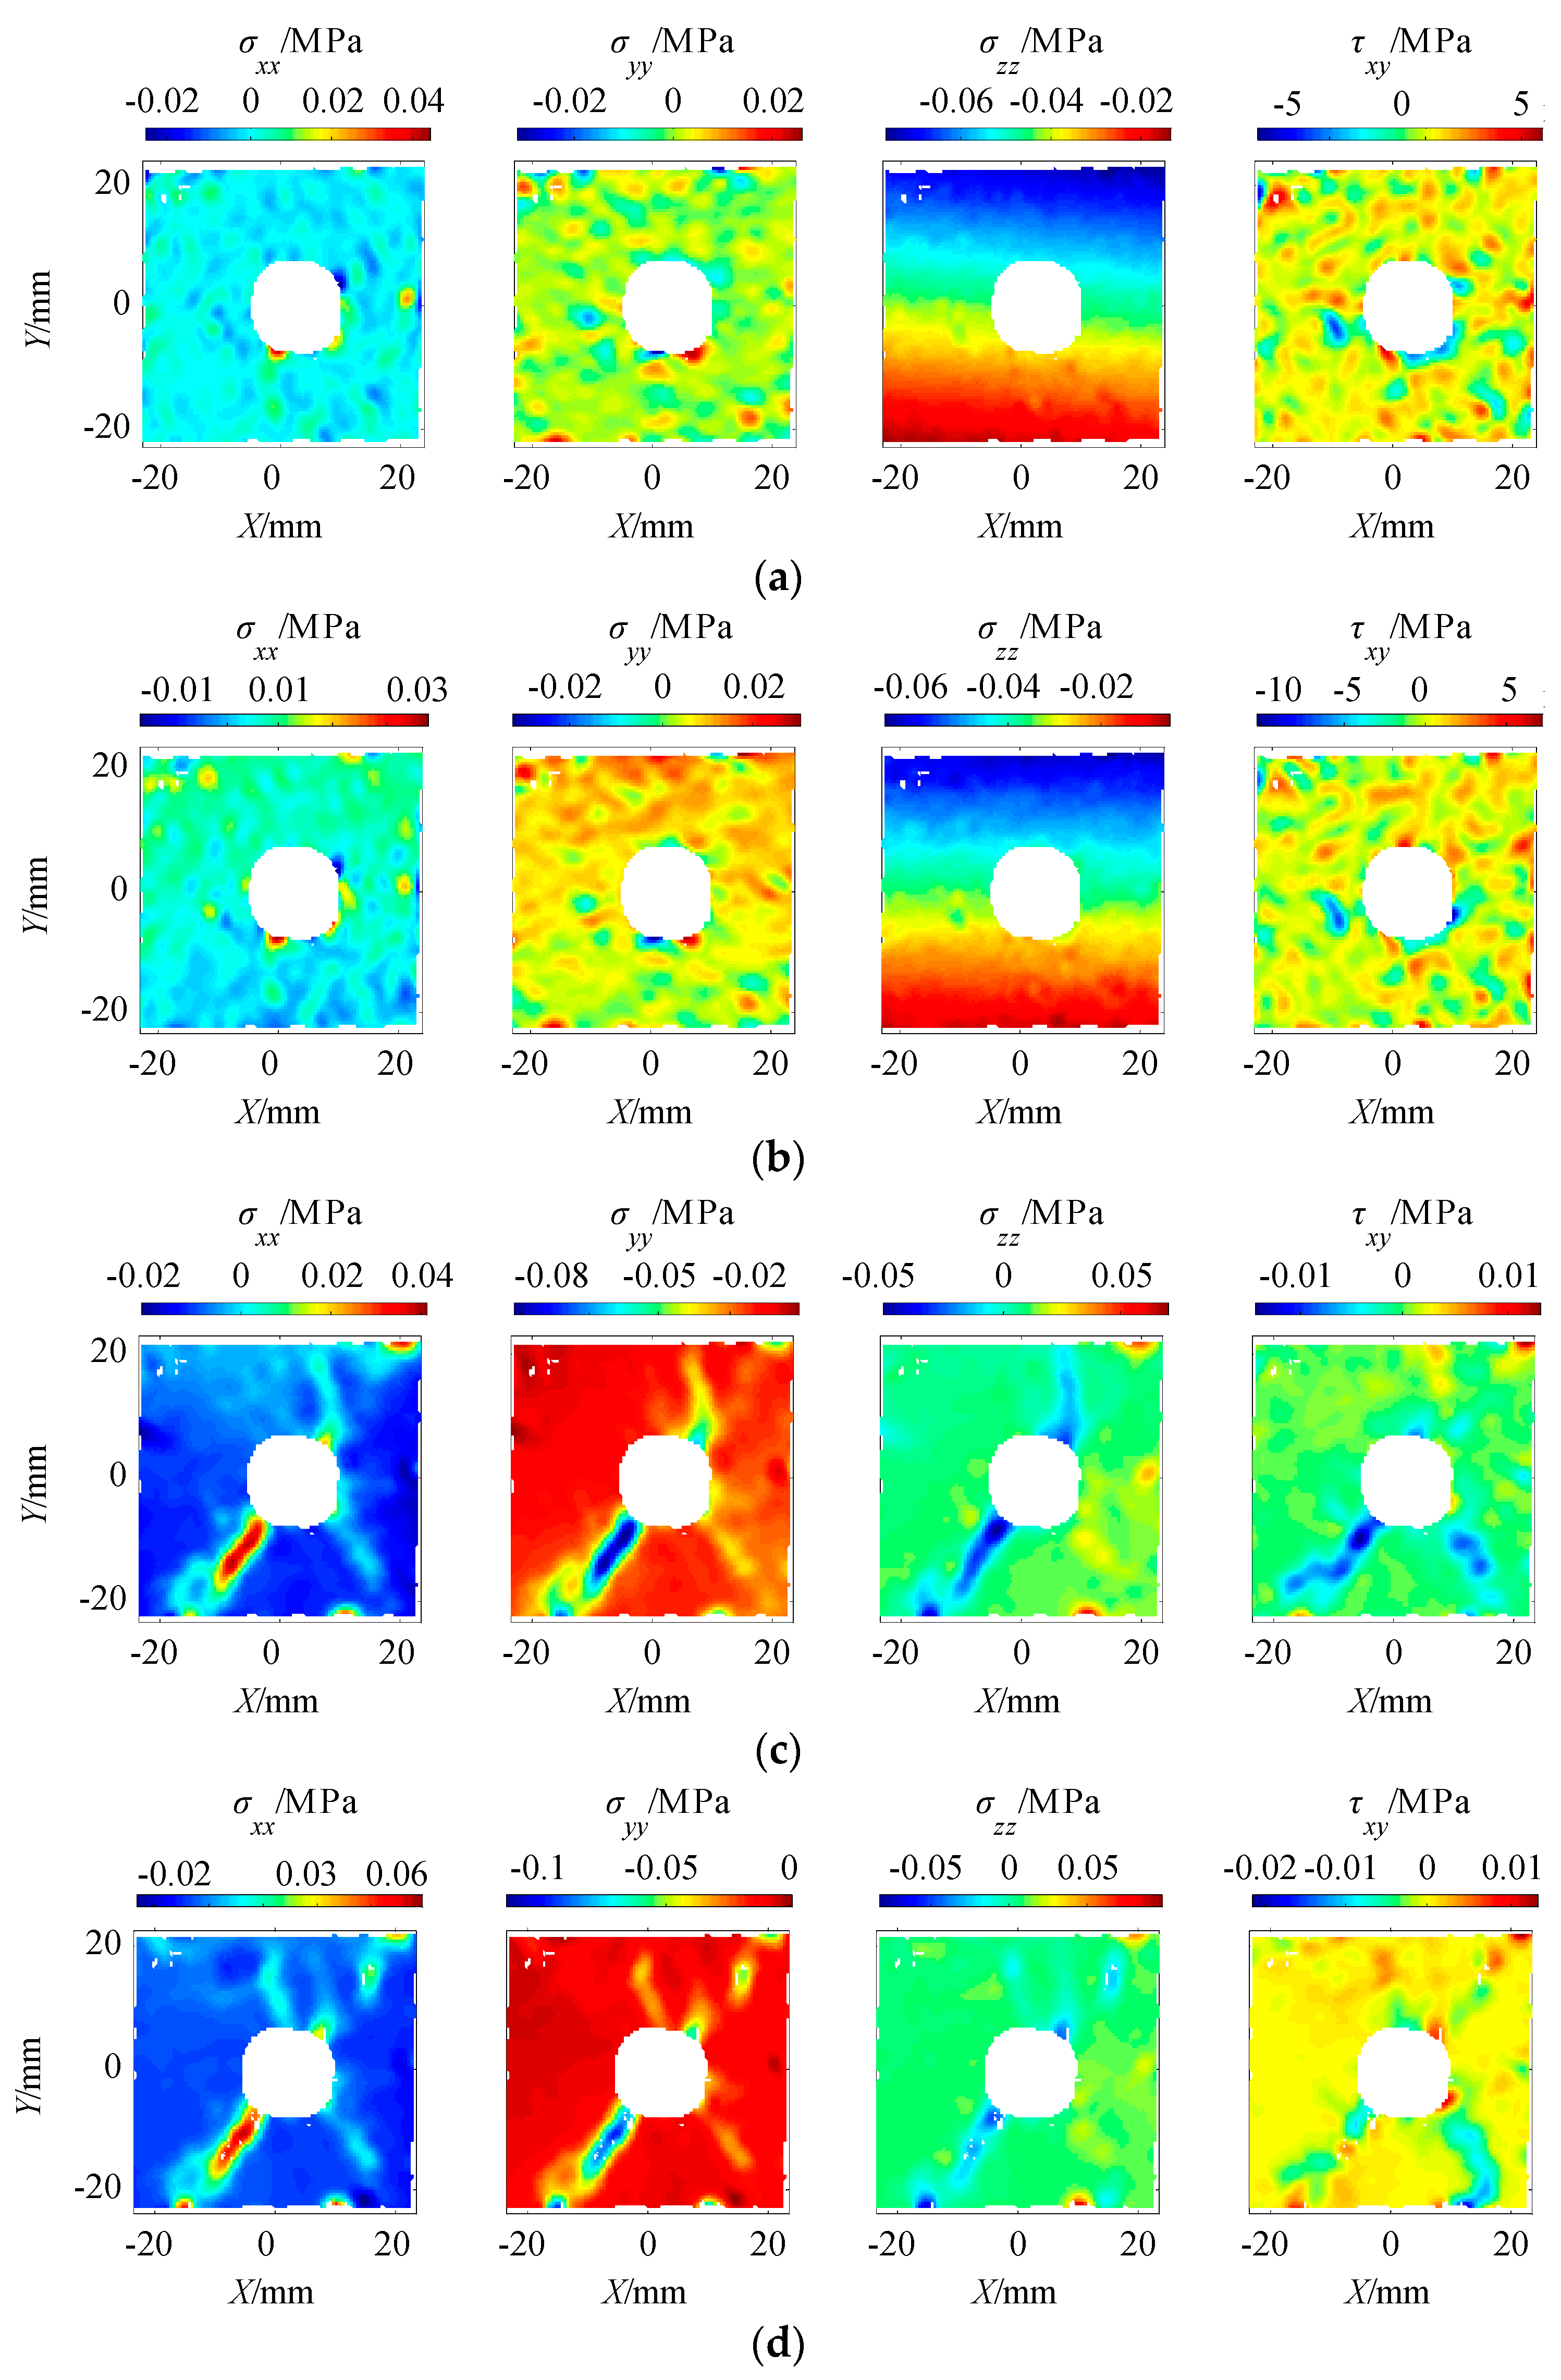
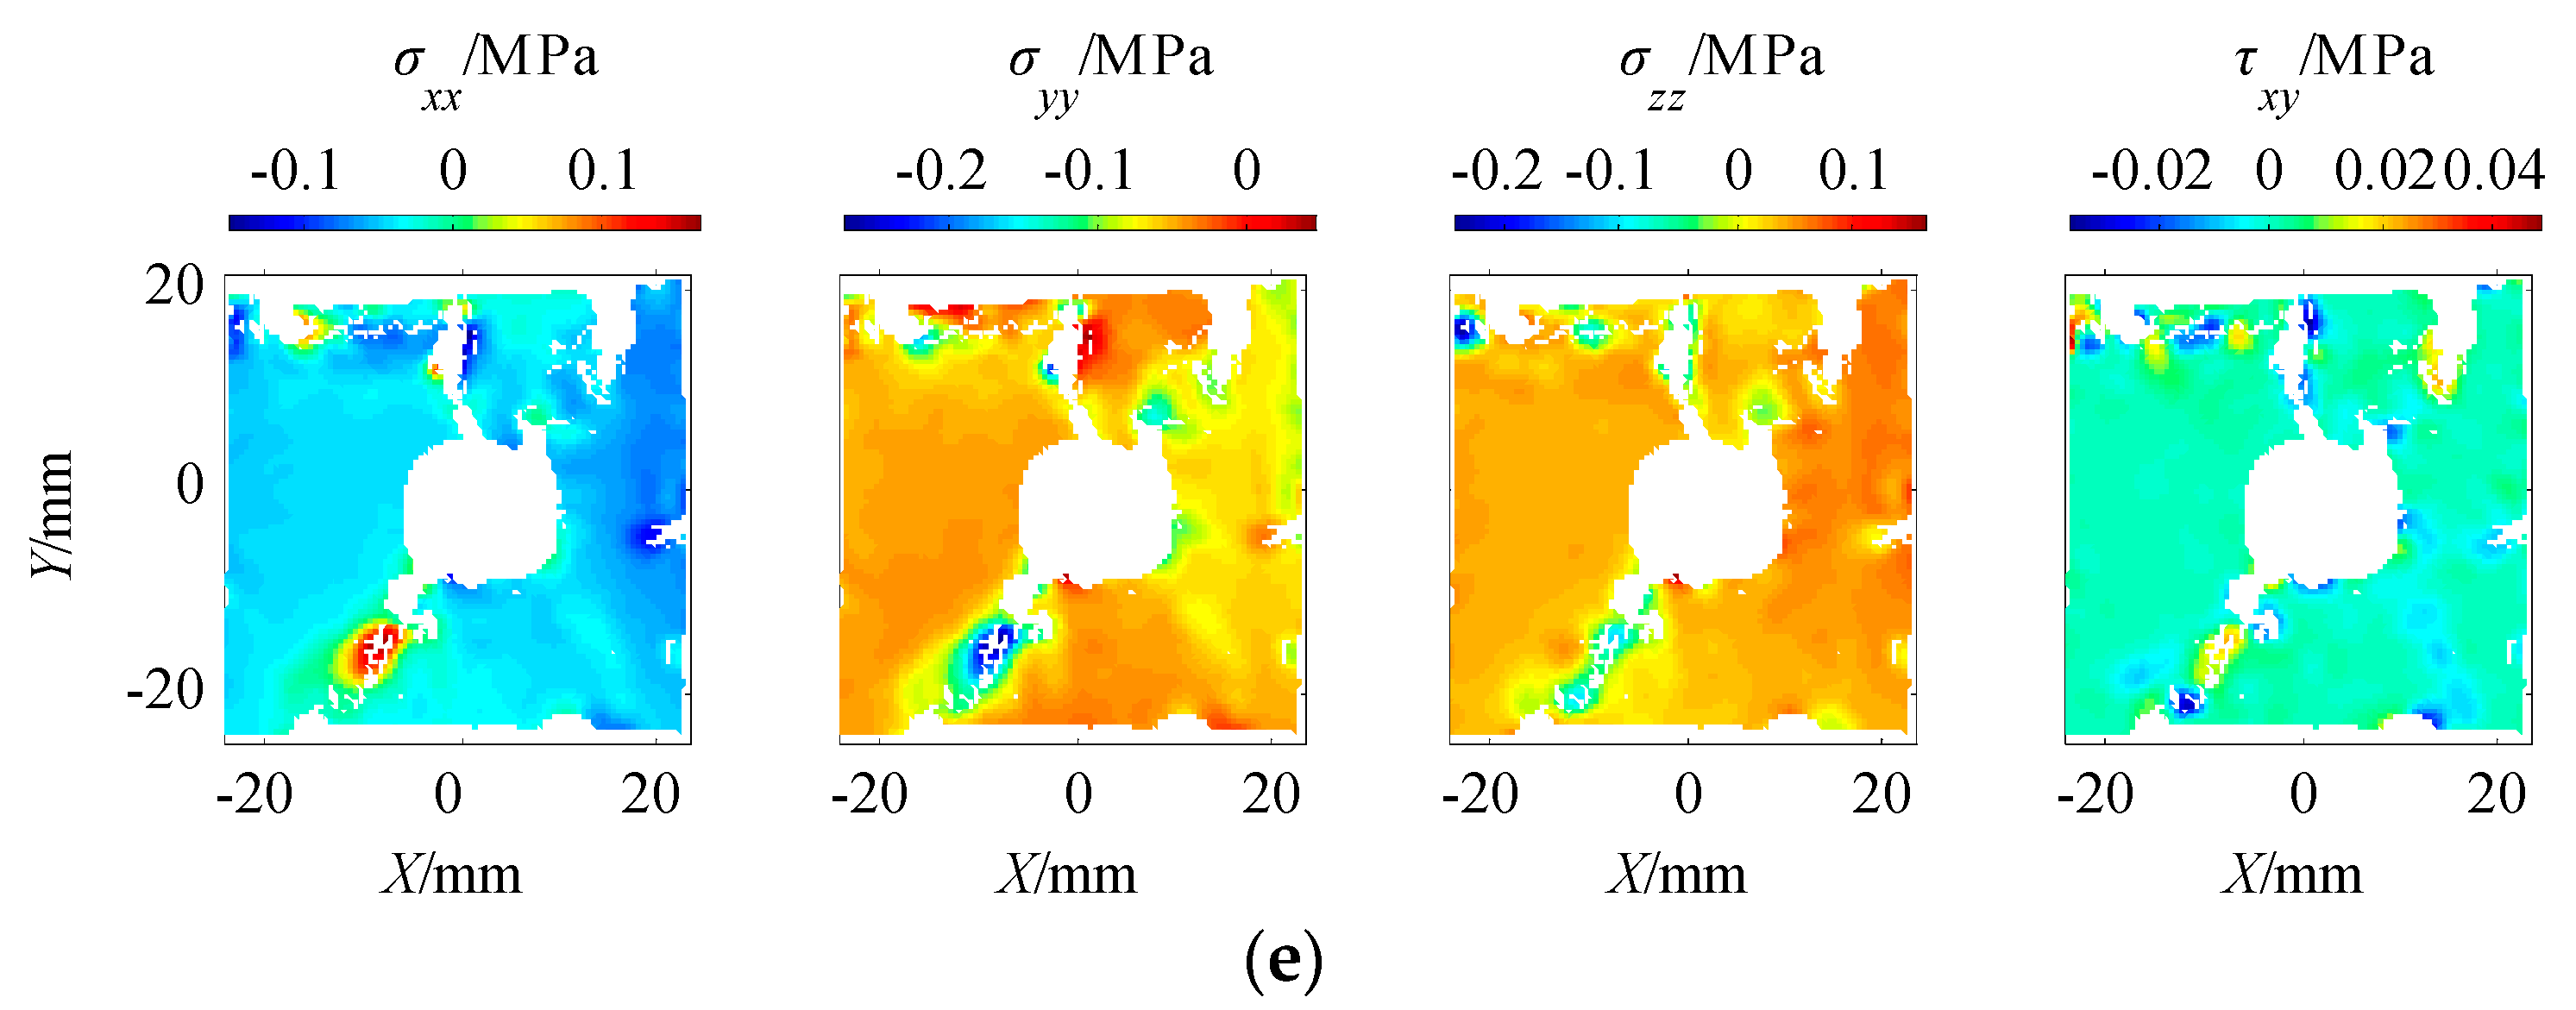
The surface stress of the coal sample’s surface was inverted by Equation (1) before the macroscopic failure on the surface of the coal sample (i.e., the elastic phase and the crack stabilization expansion stage). The stage of the crack accelerates the expansion, the coal surface of the macro cracks, and the damage increase. By using the adjacent unit weighting model, the surface stress of the coal sample was obtained though Equation (3). Finally, the surface full-field stress of the coal sample in the compression process was obtained, as shown in Figure 6.
4.2. Stress Evolution around the Hole
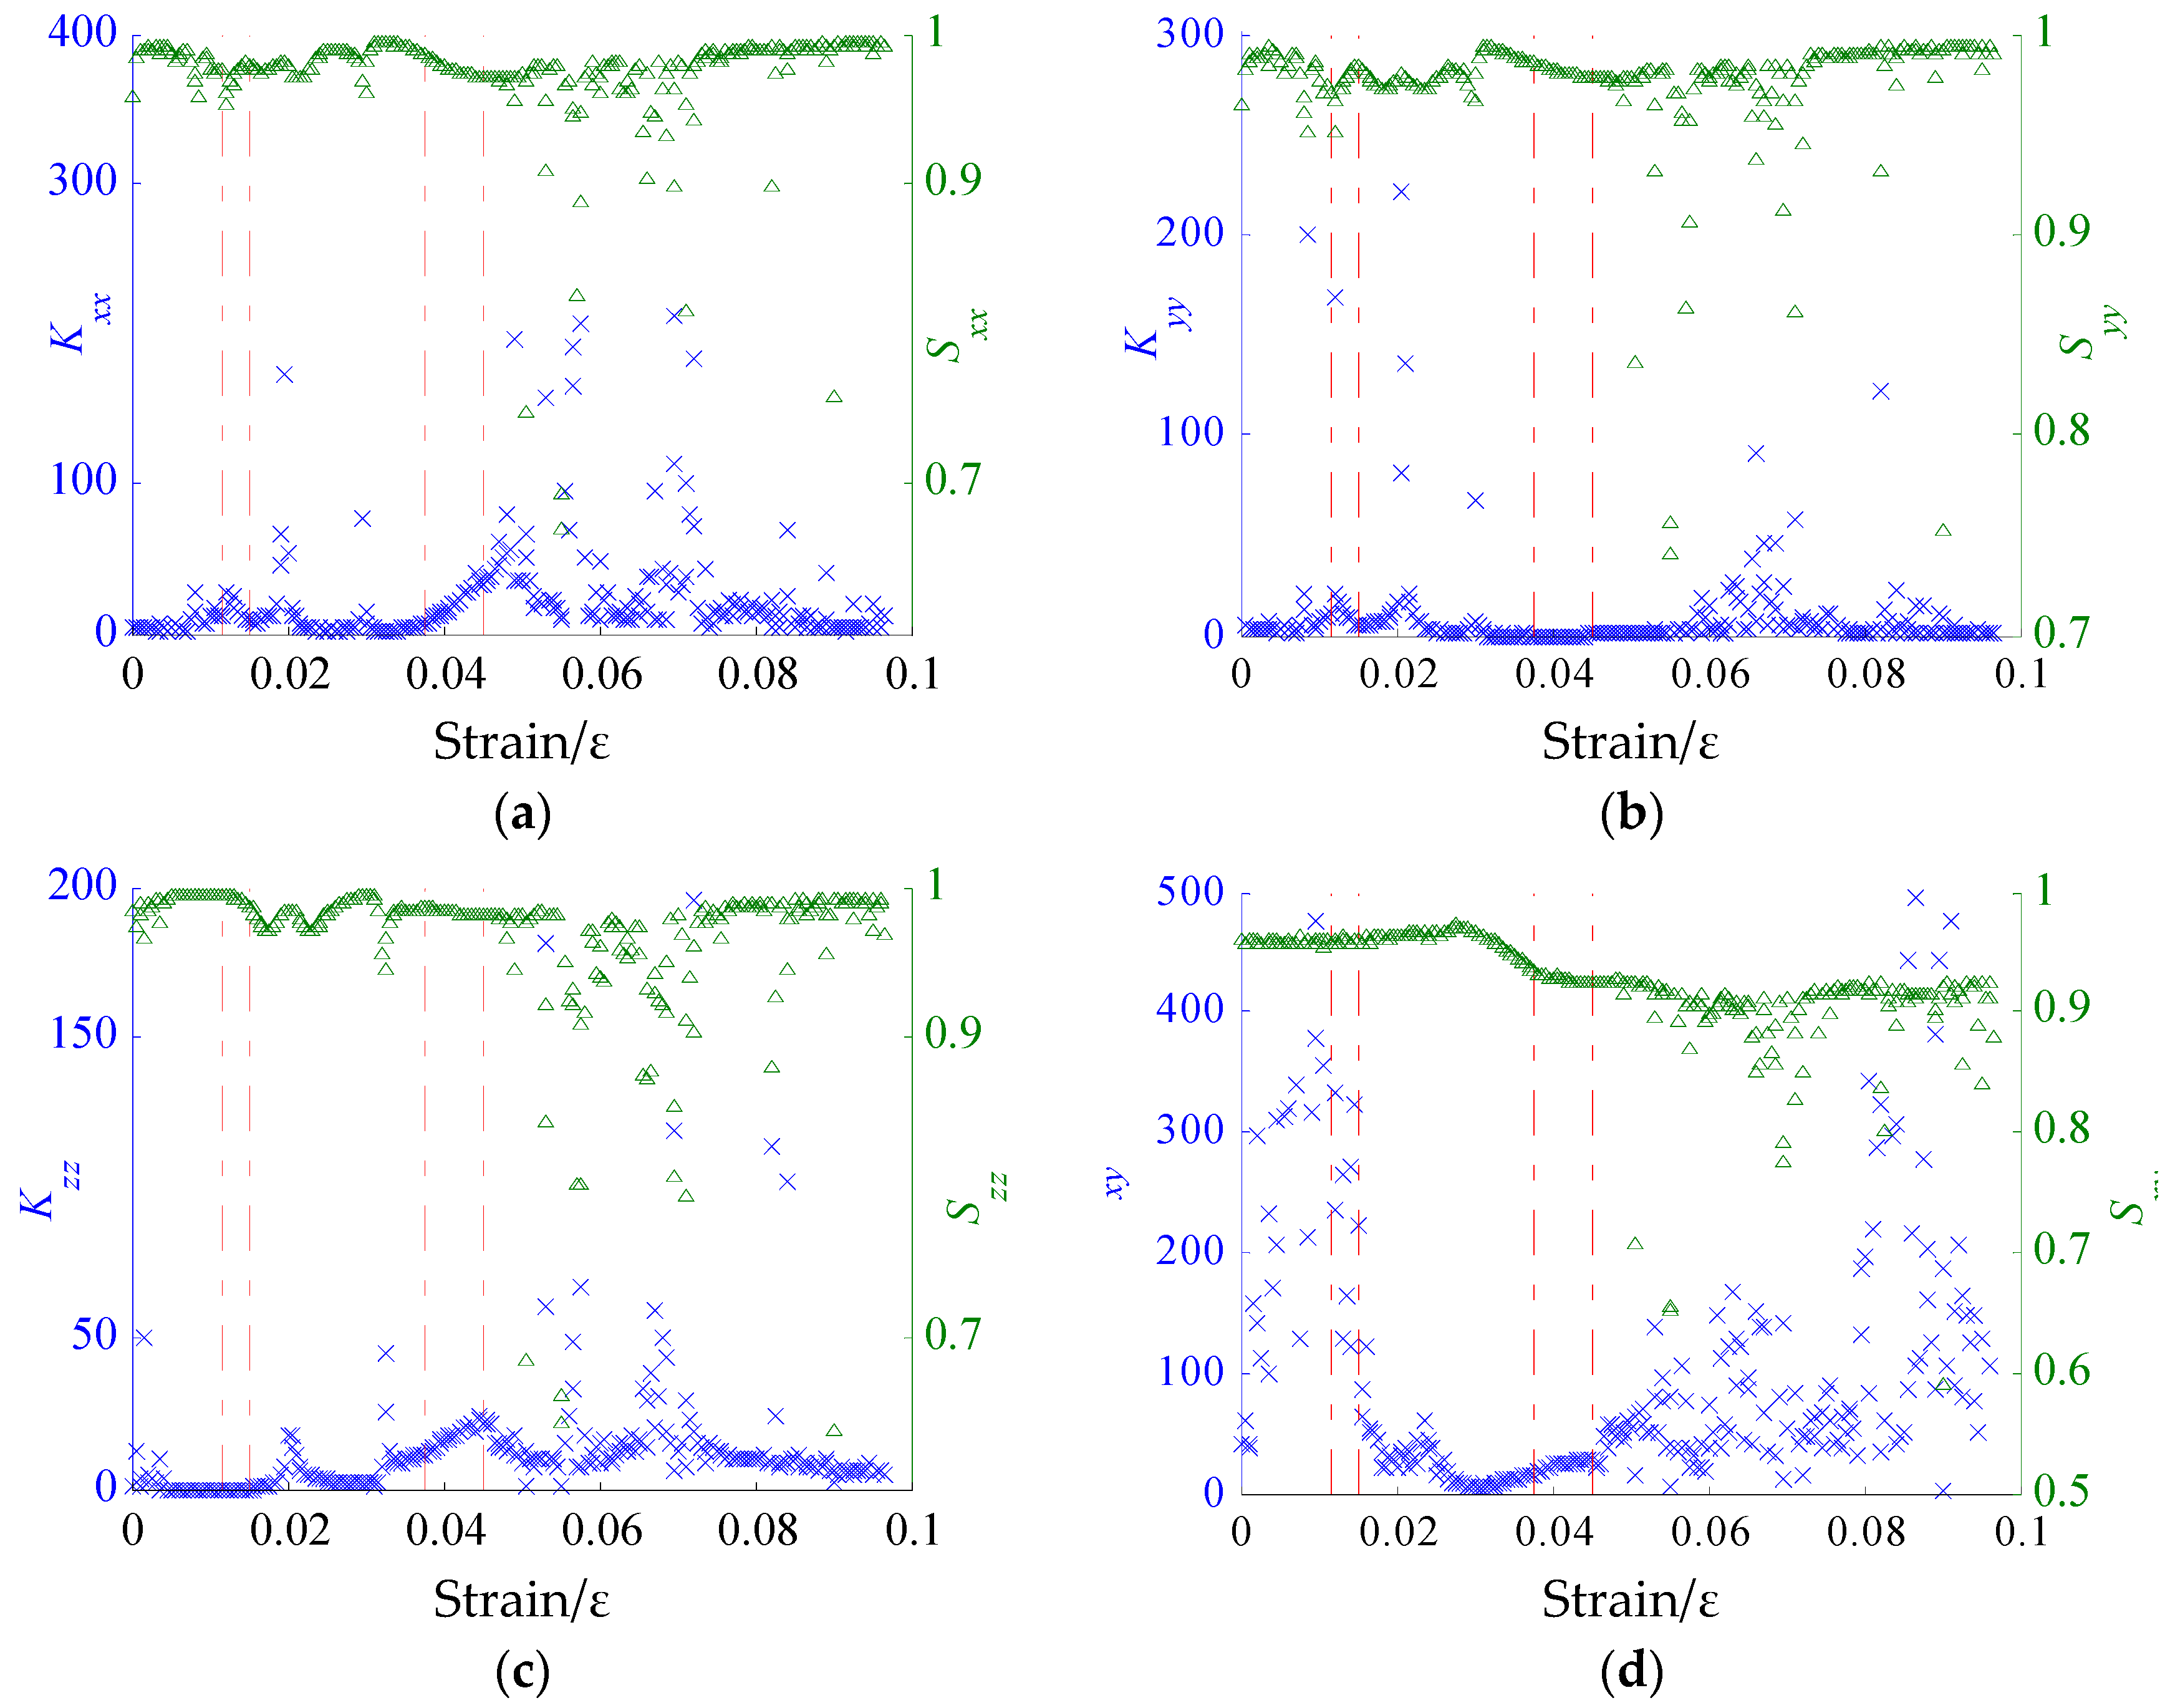
The stress field of the surface of the coal sample during compression is shown in Figure 6. The first to fourth columns are the σxx, σyy, σzz, and τxy stress distributions. The horizontal stress concentration coefficient Kxx, the vertical stress concentration coefficient Kyy, the σzz stress concentration coefficient Kzz, and the τxy shear stress concentration coefficient Kxy are shown in Figure 7.
In order to describe the stress field distribution more accurately, the entropy S was used to characterize the stress field discretization. The entropy was extended into the two-dimensional case by Equation (10).
where σij is the stress of point (i, j).
The horizontal stress field entropy Sxx is maintained at around 0.99 at the beginning of loading, showing a chaotic state, as shown in the first column of Figure 6 and Figure 7a. However, there was a tendency to decrease slowly, indicating that the horizontal stress field σxx was gradually changing to an orderly state. As the coal sample contains a large number of randomly distributed primary voids, the surface stress of the coal sample was different and discontinuously distributed. There were individual regions showing a slight stress concentration, but the whole sample was still at a low stress level with an enhanced trend; when ε > 0.0116, entering the elastic phase, the coal sample was closed with the original void, and was gradually compacted. Additionally, Sxx at this stage reaches the first extreme 0.9518, as shown in Figure 7a. Its characteristics still remain chaotic. The stress concentration factor Kxx reaches the extreme value of 28.04 at this stage, as shown in Figure 7a. When ε > 0.0150, entering the crack stabilization stage, new fissures were gradually generated due to the original defects with the strain increase. As the internal fissure was generated, the orderly transition process of the stress field was interrupted. The stress field spontaneously evolved to a lower degree of concentration according to entropy theory. In this process, Sxx returns to the initial state of 0.9941, and Kxx reduces to 0.5 with a release of stress concentration, as shown in Figure 7a. As the loading continues, the energy of the coal sample turns to an ordered state, Sxx decreases again, and Kxx increases. Additionally, Kxx increases significantly before the crack is destroyed. When ε > 0.0378, the crack is destroyed and forms a macroscopic crack, and Kxx rapidly increases, as shown in Figure 7a. So, the stress concentration is significant, and the stress concentration in the vicinity of the crack is significant. When the destruction of the coal is close, Kxx goes up to 39.57. When ε > 0.0453, the coal sample falls into the after-peak stage, due to damage caused by coal-like fragments. In some areas, the stress concentration intensifies, while in the other parts of the sample, the stress releases. Additionally, the stress field distribution evolves into a chaotic state as the volatility of Kxx becomes larger, and the overall trend weakens.
The variation of the vertical stress field σyy over the entire loading phase is smaller than that of the other stress field as shown in the second column of Figure 6 and Figure 7b. Only in the early stage of the elastic phase and the stable crack development stage is the stress field more uniform. The stress field is unified: (1) when the chaotic state was the main behavior in the elastic stage and the stable crack development stage; and (2) when in the crack expansion stage the stress field was ordered, and when in the post-peak stage the stress field was chaotic.
At first, the σzz stress field increased from a low stress level to the peak value, as shown in Figure 6’s third column and Figure 7c. When ε = 0.0378, the coal sample ruptures and Kzz reaches 23.55. When ε > 0.0378, Kzz gradually decreases at the post-peak stage. While ε → 0.0378, the stress field is gradually ordered when the macroscopic crack is almost at failure. When ε > 0.0453, most of the stress is gradually released after the peak phase. Only the localized stress concentration is localized, and the stress field is characterized by disorder.
The shear stress field τxy exhibits a significant increase in strength at the initial stage of loading, and the shear stress distribution of the coal sample is larger due to the random distribution of the primary pores of the coal sample’s randomness, showing the characteristics of chaos, as shown in Figure 6d. Additionally, Kxy was 475 and then decreased rapidly. When ε > 0.0150, the shear stress was increased after the crack stabilization stage. The stress concentration further reduced, the concentration of Sxy further reduced, and the concentration of the stress increased again. When ε > 0.0378, τxy was further ordered, Sxy decreased, and the stress concentration increased again. When ε > 0.0453, entering the post-peak stage, the shear stress was completely released in the destructive area of the coal sample, and the distribution of the stress field was chaotic. The shear stress of the crack tip resulted in a significant increase in Kxy.
4.3. Crack Propagation Process around the Hole
In order to facilitate the description, the center was drilled as the center of the establishment of the polar coordinates. Nine damage zones of the coal sample were eventually formed, numbered as shown in Figure 8, where the A and B, C and E, and F and G areas format three macro cracks. The evolution of the nine failure zones on the coal sample’s surface is shown in Figure 9.
The damage regions of A, C, E, and F were directly related to the horizontal stress field σxx, and the order of their failure is shown in Figure 9a. After entering the elastic stage, the original pores of the coal sample were completely closed and the axial loading was transferred to the bottom of the coal sample. The horizontal stress field σxx gradually ordered and the first peak of surface stress was concentrated. A stress concentration region was formed at the bottom of the borehole, i.e., θ = 240° and θ = 300°. As σ = 18.84% σf, at a low stress level, the degree of stress concentration was in a low stage. Additionally, the area of θ = 240° did not produce brittle cracks and expansion, but existed in the coal sample’s surface with a stable stress concentration, so that a tensile stress concentration formatted in region C. By combining Equation (1), the stress concentration here also indicates that the horizontal strain εxx increases, which is the deformation localization described by Ma [21]. Due to the low stress level at this time, it was difficult for macroscopic cracks to form in the stress concentration area in the direction of θ = 300°, as the wall structure had loosened. The hole was gradually shifted from the right side of the low lateral hole along the wall (i.e., the right side of the cell wall) and maintained for about 111 s (t = 141 s to t = 252 s). In the process of the right side of the hole wall producing large-scale damage and a large amount of damage, the formation of normal shear (NS) damage in [2] eventually resulted in the destruction of the right side of the hole wall rather than the left side of the wall, as shown in Figure 4. Then, the stress concentration zone stabilized at the top of the hole θ = 60° to form the tensile stress concentration in region A. In the crack propagation stage, σ > 87.34% σf, the A, C, and E regions had been broken down under the combined loading of high stress, a high stress concentration, and a highly ordered stress field. With such a comprehensive effect, a brittle fracture occurred in the crack tips of A, C, and E, and the crack propagated rapidly along the stress field. In the post-peak stage, the regions A and B and C and E were successively passed, and the crack was fully expanded. The stress concentration in region A was gradually expanded and the region F was split. The region F gradually extended upwardly along the stress field direction and formed the main tensile (T1) damage. At the same time, the region F gradually penetrated into region G, and the 45° crack formed by ABCE ran through the surface of the coal sample. The coal sample was broken, and the carrying capacity significantly decreased.
In the post-peak stage, as shown in Figure 9b, due to the lack of a strong stress concentration, in the region D of the coal sample’s surface under the combined action of the vertical stress field σyy and the ordered field, plastic damage emerged, the stress released, and the local stress field began to enter into a chaotic state. The destruction of the region no longer increased, with only a small range of yield, and the border of destruction was arc-shaped.
Also, in the post-peak stage, as the σzz field became chaotic after the failure, the effect on the region of θ = 0–60° was significant, which exacerbated the damage of region B, as shown in Figure 9c. The destruction of the surface area directly lead to the formation of an ordered stress field and stress concentration in the local area, resulting in a small range of damage, and forming a horizontal crack.
The failure of surface regions B and E were dominated by τxy stress. In the stable crack development stage (41.71% σf > σ > 87.34% σf), a stable stress concentration region was formed under the action of moderate and low stress levels and an ordered τxy field, as shown in Figure 9d. With the order of the stress field, the stress concentration increased continuously until the axial stress σ > 87.34% σf, when the cracks in the A, B, and E regions occured one after another. The region A ruptured under the complex action of τxy and σxx. The damage of region E was more complex, which involved σxx, σzz, and τxy. Additionally, the rupture of region B was caused by τxy and σzz. Finally, the region B continued to expand along the τxy and σzz directions, and passed through the region A after the post-peak stage.
The destruction behavior of the sample, which mainly were the T1 crack and an X-shaped failure, was similar to MA’s research [21]. As the diameter of the hole in [21] was too large, the influence of the stress concentration and end effect caused the X-shaped failure. Additionally, the unavoidable friction between the sample and the loading machine similarly caused the end effect, leading to the X-shaped failure. However, the emergence of the T1 crack was more similar to LAJTAI’s research [2] and YIN’s research [22]. Under the loading process, the top of hole moved to the left and right sides, forming a region of tension, which could have caused the T1 crack. However, the length of the crack in our experiment was shorter than LAJTAI [2], YIN [22], and YANG [23], which was caused by the strength of the sample. The strength of the sandstone was much higher than the strength of the sample we made, whose crack expansion was more plastic.
5. Conclusions
The fracture initiation stress σci calculated according to this method is 30.28–41.71% of the σf, and the crack failure stress σcd is 83.08–87.34% of the σf. The results are similar to existing experimental results, which proves that the fitting-damage method can be used for stress inversion. The perimeter crack’s propagation experienced two stages, which were the low stress and high stress levels. In the low stress level, including the II and III regions, that is, the 0.15 σf < σ < 0.5 σf period, there resulted invisible micro-damage, the macro effect of the formation of plastic deformation; in the high stress level, mainly for the IV and V region, that is, the 0.5 σf < σ < 0.85 σf period, the stress concentration coefficient K is greater than 10, and the stress concentration area around the hole had rapid cracking, resulting in macro brittle cracks. Into the V region, that is, σ ≥ 0.85 σf, the cracks are fully developed, perforating with each other, which eventually lead to the coal sample’s rupture.
Acknowledgments
This work was supported in part by the National Natural Science Foundation of China (NSFC) under grant numbers 51374168, 51774234, 51327007, and 51474172.
Author Contributions
T.Z. and S.L. conceived and designed the experiments; J.L. performed the experiments; H.P. contributed to English writing. S.S. contributed to materials; L.Z. analyzed the data and wrote the paper.
Conflicts of Interest
The authors declare no conflict of interest.
References
- Haifeng, W.; Yuanping, C.; Lei, W. Regional gas drainage techniques in Chinese coal mines. Int. J. Min. Sci. Technol. 2012, 22, 873–878. [Google Scholar] [CrossRef]
- Lajtai, E.Z.; Lajtai, V.N. Collapse of Cavities. Int. J. Rock Mech. Min. Sci. 1975, 12, 81–86. [Google Scholar] [CrossRef]
- Carter, B.J.; Lajtai, E.Z.; Petukhov, A. Primary and remote fracture around underground cavities. Int. J. Numer. Anal. Methods Geomech. 1991, 15, 21–40. [Google Scholar] [CrossRef]
- Wang, S.Y.; Sun, L.; Yang, C.; Yang, S.Q.; Tang, C.A. Numerical study on static and dynamic fracture evolution around rock cavities. J. Rock Mech. Geotech. Eng. 2013, 5, 262–276. [Google Scholar] [CrossRef]
- Tao, M.; Li, X.; Wu, C. 3D numerical model for dynamic loading-induced multiple fracture zones around underground cavity faces. Comput. Geotech. 2013, 54, 33–45. [Google Scholar] [CrossRef]
- Zhang, C.; Lin, B.; Zhou, Y.; Zhai, C.; Zhu, C. Study on “fracturing-sealing” integration technology based on high-energy gas fracturing in single seam with high gas and low air permeability. Int. J. Min. Sci. Technol. 2013, 23, 841–846. [Google Scholar] [CrossRef]
- Bai, Y.L.; Wang, H.Y.; Xia, M.F.; Ke, F.J. Statistical Mesomechanics of Solid, Linking Coupled Multiple Space and Time Scales. Appl. Mech. Rev. 2005, 58, 372. [Google Scholar] [CrossRef]
- Jin, P.; Wang, E.; Liu, X.; Huang, N.; Wang, S. Damage evolution law of coal-rock under uniaxial compression based on the electromagnetic radiation characteristics. Int. J. Min. Sci. Technol. 2013, 23, 213–219. [Google Scholar] [CrossRef]
- Peters, W.H.; Ranson, W.F. Digital Imaging Techniques in Experimental Stress Analysis. Opt. Eng. 1982, 21, 427–431. [Google Scholar] [CrossRef]
- Ma, S.-P.; Liu, S.-J.; Zhao, Y.-H. Gray correlation of digital images from loaded rock specimen surface to evaluate its damage evolution. Yanshilixue Yu Gongcheng Xuebao/Chin. J. Rock Mech. Eng. 2006, 25, 590–595. [Google Scholar]
- Yang, S.-Q.; Huang, Y.-H.; Jing, H.-W.; Liu, X.-R. Discrete element modeling on fracture coalescence behavior of red sandstone containing two unparallel fissures under uniaxial compression. Eng. Geol. 2014, 178, 28–48. [Google Scholar] [CrossRef]
- Zhao, C.; Matsuda, H.; Morita, C.; Shen, M.R. Study on failure characteristic of rock-like materials with an open-hole under uniaxial compression. Strain 2011, 47, 405–413. [Google Scholar] [CrossRef]
- Mallela, K.; Ilinich, A.; Luckey, S.; Zeng, D.; Gan, Y. Characterization of 6XXX Series Aluminum Extrusions Using Digital Image Correlation (DIC) Technique. In Proceedings of the SAE World Congress Experience (WCX 2017), Detroit, MI, USA, 4–6 April 2017; SAE International: Detroit, MI, USA; ADIENT: Plymouth, MI, USA; HITACHI: Tokyo, Japan; Mentor Automotive: Wilsonville, OR, USA; OMRON: Osaka, Japan; Southwest Research Institute (SwRI): San Antonio, TX, USA, 2017. [Google Scholar]
- Tuononen, A.J. Digital Image Correlation to analyse stick–slip behaviour of tyre tread block. Tribol. Int. 2014, 69, 70–76. [Google Scholar] [CrossRef]
- Ma, S.P.; Yan, D.; Wang, X.; Cao, Y.Y. Damage Observation and Analysis of a Rock Brazilian Disc Using High-Speed DIC Method. Appl. Mech. Mater. 2011, 70, 87–92. [Google Scholar] [CrossRef]
- Nunes, L.C.S.; Reis, J.M.L. Experimental investigation of mixed-mode-I/II fracture in polymer mortars using digital image correlation method. Lat. Am. J. Solids Struct. 2014, 11, 330–343. [Google Scholar] [CrossRef]
- Schreier, H.; Orteu, J.-J.; Sutton, M.A. Image Correlation for Shape, Motion and Deformation Measurements: Basic Concepts, Theory and Applications; Springer: New York, NY, USA, 2009; pp. 1–321. [Google Scholar]
- Taubin, G. Improved Algorithm for Algebraic Curve and Surface Fitting. In Proceedings of the 1993 IEEE 4th International Conference on Computer Vision, Berlin, Germany, 11–14 May 1993; IEEE: Berlin, Germany, 1993; pp. 658–665. [Google Scholar]
- Martin, C.D.; Chandler, N.A. Progressive fracture of Lac du Bonnet granite. Int. J. Rock Mech. Min. Sci. 1994, 31, 643–659. [Google Scholar] [CrossRef]
- Wang, X.-B.; Du, Y.-Z.; Pan, Y.-S.; Zhang, C.-Y. Lateral deformation measurements for sand specimens under uniaxial compression based on digital image correlation with coarse-fine search method. Gongcheng Lixue/Eng. Mech. 2013, 30, 184–190. [Google Scholar]
- Ma, S.-P.; Wang, L.-G.; Zhao, Y.-H. Experimental study on deformation field evolution during failure procedure of a rock borehole structure. Yantu Lixue/Rock Soil Mech. 2006, 27, 1082–1086. [Google Scholar]
- Yin, Q.; Jing, H.-W.; Zhu, T.-T. Experimental Study on Mechanical Properties and Cracking Behavior of Pre-cracked Sandstone Specimens under Uniaxial Compression. Indian Geotech. J. 2016, 47, 265–279. [Google Scholar] [CrossRef]
- Yang, S.-Q.; Jing, H.-W.; Xu, T. Mechanical behavior and failure analysis of brittle sandstone specimens containing combined flaws under uniaxial compression. J. Cent. South Univ. 2014, 21, 2059–2073. [Google Scholar] [CrossRef]
Figure 1.
System structure. CCD: charge-colored device.

Figure 2.
Least square fitting residual norm.

Figure 3.
Stress-strain curve.

Figure 4.
Sample images: (a) before sample destruction; (b) after sample destruction.

Figure 5.
Revolution of displacement field.
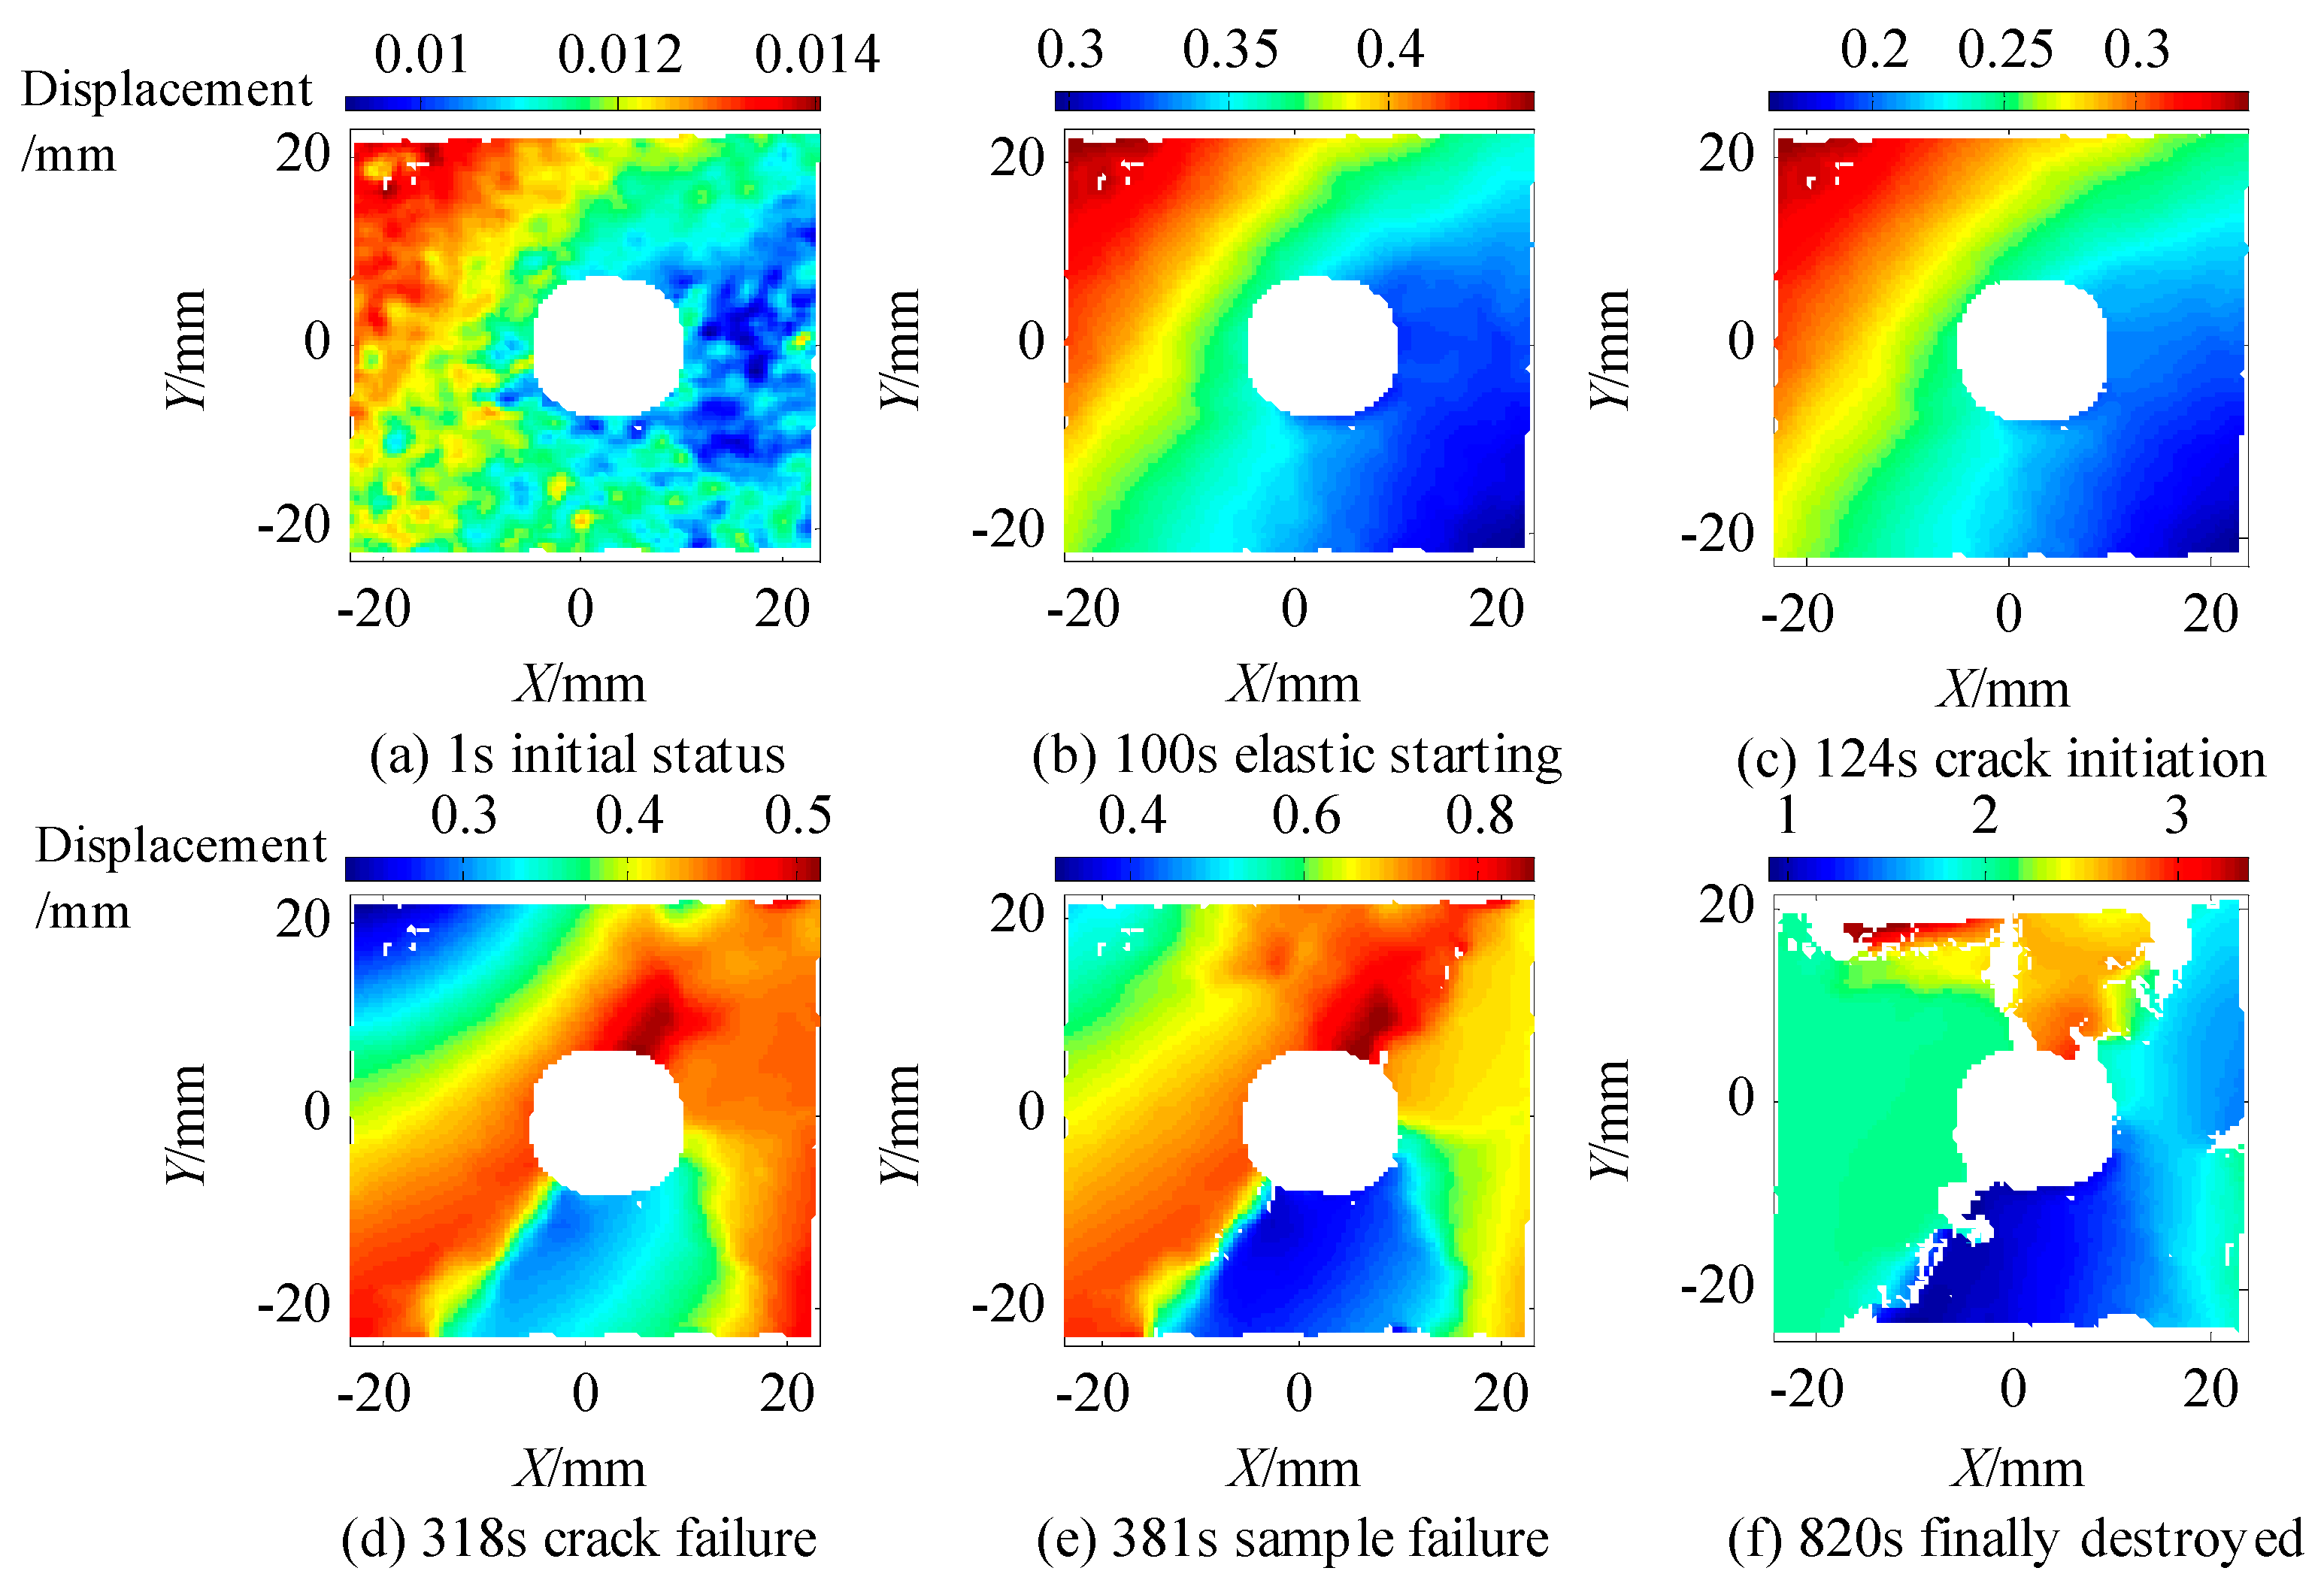
Figure 6.
Revolution of stress field: (a) elastic starting point; (b) crack initiation; (c) crack failure; (d) sample failure; and (e) finally destroyed.
Figure 6.
Revolution of stress field: (a) elastic starting point; (b) crack initiation; (c) crack failure; (d) sample failure; and (e) finally destroyed.


Figure 7.
Revolution of the stress concentration factor and entropy (a) Kxx and Sxx; (b) Kyy and Syy; (c) Kzz and Szz; and (d) Kxy and Sxy.
Figure 7.
Revolution of the stress concentration factor and entropy (a) Kxx and Sxx; (b) Kyy and Syy; (c) Kzz and Szz; and (d) Kxy and Sxy.

Figure 8.
Direction of the coal.

Figure 9.
Revolution of stress and failure: (a) relationship of σxx and destruction evolution; (b) relationship of σyy and destruction evolution; (c) relationship of σzz and destruction evolution; and (d) relationship of τxy and destruction evolution.
Figure 9.
Revolution of stress and failure: (a) relationship of σxx and destruction evolution; (b) relationship of σyy and destruction evolution; (c) relationship of σzz and destruction evolution; and (d) relationship of τxy and destruction evolution.


Table 1.
Size of samples and experiment parameters.
| Index | E/MPa | Size(mm × mm × mm) | φ/(mm) | Total Time/s |
|---|---|---|---|---|
| 16 | 11.0948 | 69.9 × 69.7 × 69.9 | 10.4 | 820 |
| 18 | 2.0643 | 69.8 × 69.9 × 69.6 | 10.6 | 420 |
| 22 | 8.7863 | 69.5 × 69.5 × 69.7 | 10.2 | 490 |
Table 2.
Key points of stress and ratios obtained by the fitting-damaging method.
| Index | σe (MPa) | σci (MPa) | σcd (MPa) | σf (MPa) | σci/σf (%) | σcd/σf (%) |
|---|---|---|---|---|---|---|
| 16 | 0.0324 | 0.0718 | 0.1504 | 0.1722 | 41.71 | 87.34 |
| 18 | 0.0012 | 0.0304 | 0.0812 | 0.1004 | 30.28 | 80.89 |
| 22 | 0.0373 | 0.0671 | 0.1363 | 0.1641 | 40.87 | 83.08 |
© 2017 by the authors. Licensee MDPI, Basel, Switzerland. This article is an open access article distributed under the terms and conditions of the Creative Commons Attribution (CC BY) license (http://creativecommons.org/licenses/by/4.0/).
Share and Cite
MDPI and ACS Style
Zhang, T.; Zhang, L.; Li, S.; Liu, J.; Pan, H.; Song, S. Stress Inversion of Coal with a Gas Drilling Borehole and the Law of Crack Propagation. Energies 2017, 10, 1743. https://doi.org/10.3390/en10111743
AMA Style
Zhang T, Zhang L, Li S, Liu J, Pan H, Song S. Stress Inversion of Coal with a Gas Drilling Borehole and the Law of Crack Propagation. Energies. 2017; 10(11):1743. https://doi.org/10.3390/en10111743
Chicago/Turabian StyleZhang, Tianjun, Lei Zhang, Shugang Li, Jialei Liu, Hongyu Pan, and Shuang Song. 2017. "Stress Inversion of Coal with a Gas Drilling Borehole and the Law of Crack Propagation" Energies 10, no. 11: 1743. https://doi.org/10.3390/en10111743
Note that from the first issue of 2016, this journal uses article numbers instead of page numbers. See further details here.