Article

Orthogonal Test Analysis on Conditions Affecting Electricity Generation Performance of an Enhanced Geothermal System at Yangbajing Geothermal Field

1
School of Earth Science and Engineering, Sun Yat-sen University, Guangzhou 510275, China
2
Guangdong Provincial Key Laboratory of Mineral Resources & Geological Processes, Guangzhou 510275, China
3
Guangzhou Institute of Energy Conversion, Chinese Academy of Sciences, Guangzhou 510640, China
4
Qingdao Institute of Marine Geology, China Geological Survey, Qingdao 266071, China
*
Author to whom correspondence should be addressed.
Energies 2017, 10(12), 2015; https://doi.org/10.3390/en10122015
Submission received: 13 October 2017 / Revised: 16 November 2017 / Accepted: 20 November 2017 / Published: 1 December 2017
(This article belongs to the Section L: Energy Sources)

Abstract

:
The main conditions affecting electricity generation performance of an enhanced geothermal system (EGS) include reservoir porosity, reservoir permeability, rock heat conductivity, water production rate and injection temperature. Presently there is lack of systematic research the relative importance of the five aforementioned conditions. The orthogonal test method is a statistical approach to analyze multi-factor and multi-level influence on system performance. In this work, based on the geological data at Yangbajing geothermal field, we analyzed the five conditions affecting the electricity generation performance of EGS, and ranked the relative importance of the five factors. The results show that the order of the relative importance of the conditions on electric power is water production rate > injection temperature > reservoir porosity > rock heat conductivity > reservoir permeability; the order of the relative importance of the conditions on reservoir impedance is reservoir permeability > injection temperature > water production rate > reservoir porosity > rock heat conductivity; the order of the relative importance of the conditions on pump power is water production rate > reservoir permeability > injection temperature > reservoir porosity > rock heat conductivity, and; the order of the relative importance of the conditions on energy efficiency is water production rate > reservoir permeability > reservoir porosity > injection temperature > rock heat conductivity. The construction of an EGS reservoir should be located at a formation with higher reservoir porosity or rock heat conductivity, while the determination of reservoir permeability, water production rate and injection temperature should be based on the comprehensive target.

1. Introduction

1.1. Background

Under the pressure of energy shortages and environmental pollution, developing renewable and clean energy is of great strategic significance [1]. As a clean and renewable energy, the development and utilization of geothermal energy has received worldwide attention [1]. Geothermal energy can be divided into three categories according to depth and resource temperature. First, if the depth is shallower than 200 m and the resource temperature is less than 90 °C, this type is the shallow geothermal resource and is mainly used for heat supply or refrigeration. Second, if the depth is within 200~3000 m and the resource temperature is within 90~150 °C, this type is the hydrothermal geothermal resource and is mainly used for electricity generation or heat supply or refrigeration [2]. Third, if the depth is within 3000~10,000 m and the resource temperature is higher than 150 °C, this type is the hot dry rock (HDR) geothermal resource or the enhanced geothermal system (EGS) resource and is mainly used for electricity generation [2]. The earth is a huge heat reservoir, and the internal stored heat is 50,000 times that of all the oil and gas resources in the world [2]. Based on the predictions from international energy experts, the geothermal energy could occupy 30~80% of the total energy consumption by 2100, so the perspective of the development of geothermal energy is very bright [2]. EGS resources occupy more than 90% of all geothermal resources. The total EGS resource reserve in China within a depth of 3~10 km amounts to 20.90 M EJ; if we take 2% as the recoverable fraction, the recoverable EGS resource amounts to 168 times the quality of traditional hydrothermal resource, or 4400 times total annual energy consumption in 2010 in China [3], so only developing the deep EGS resource opens the treasury of geothermal resources.
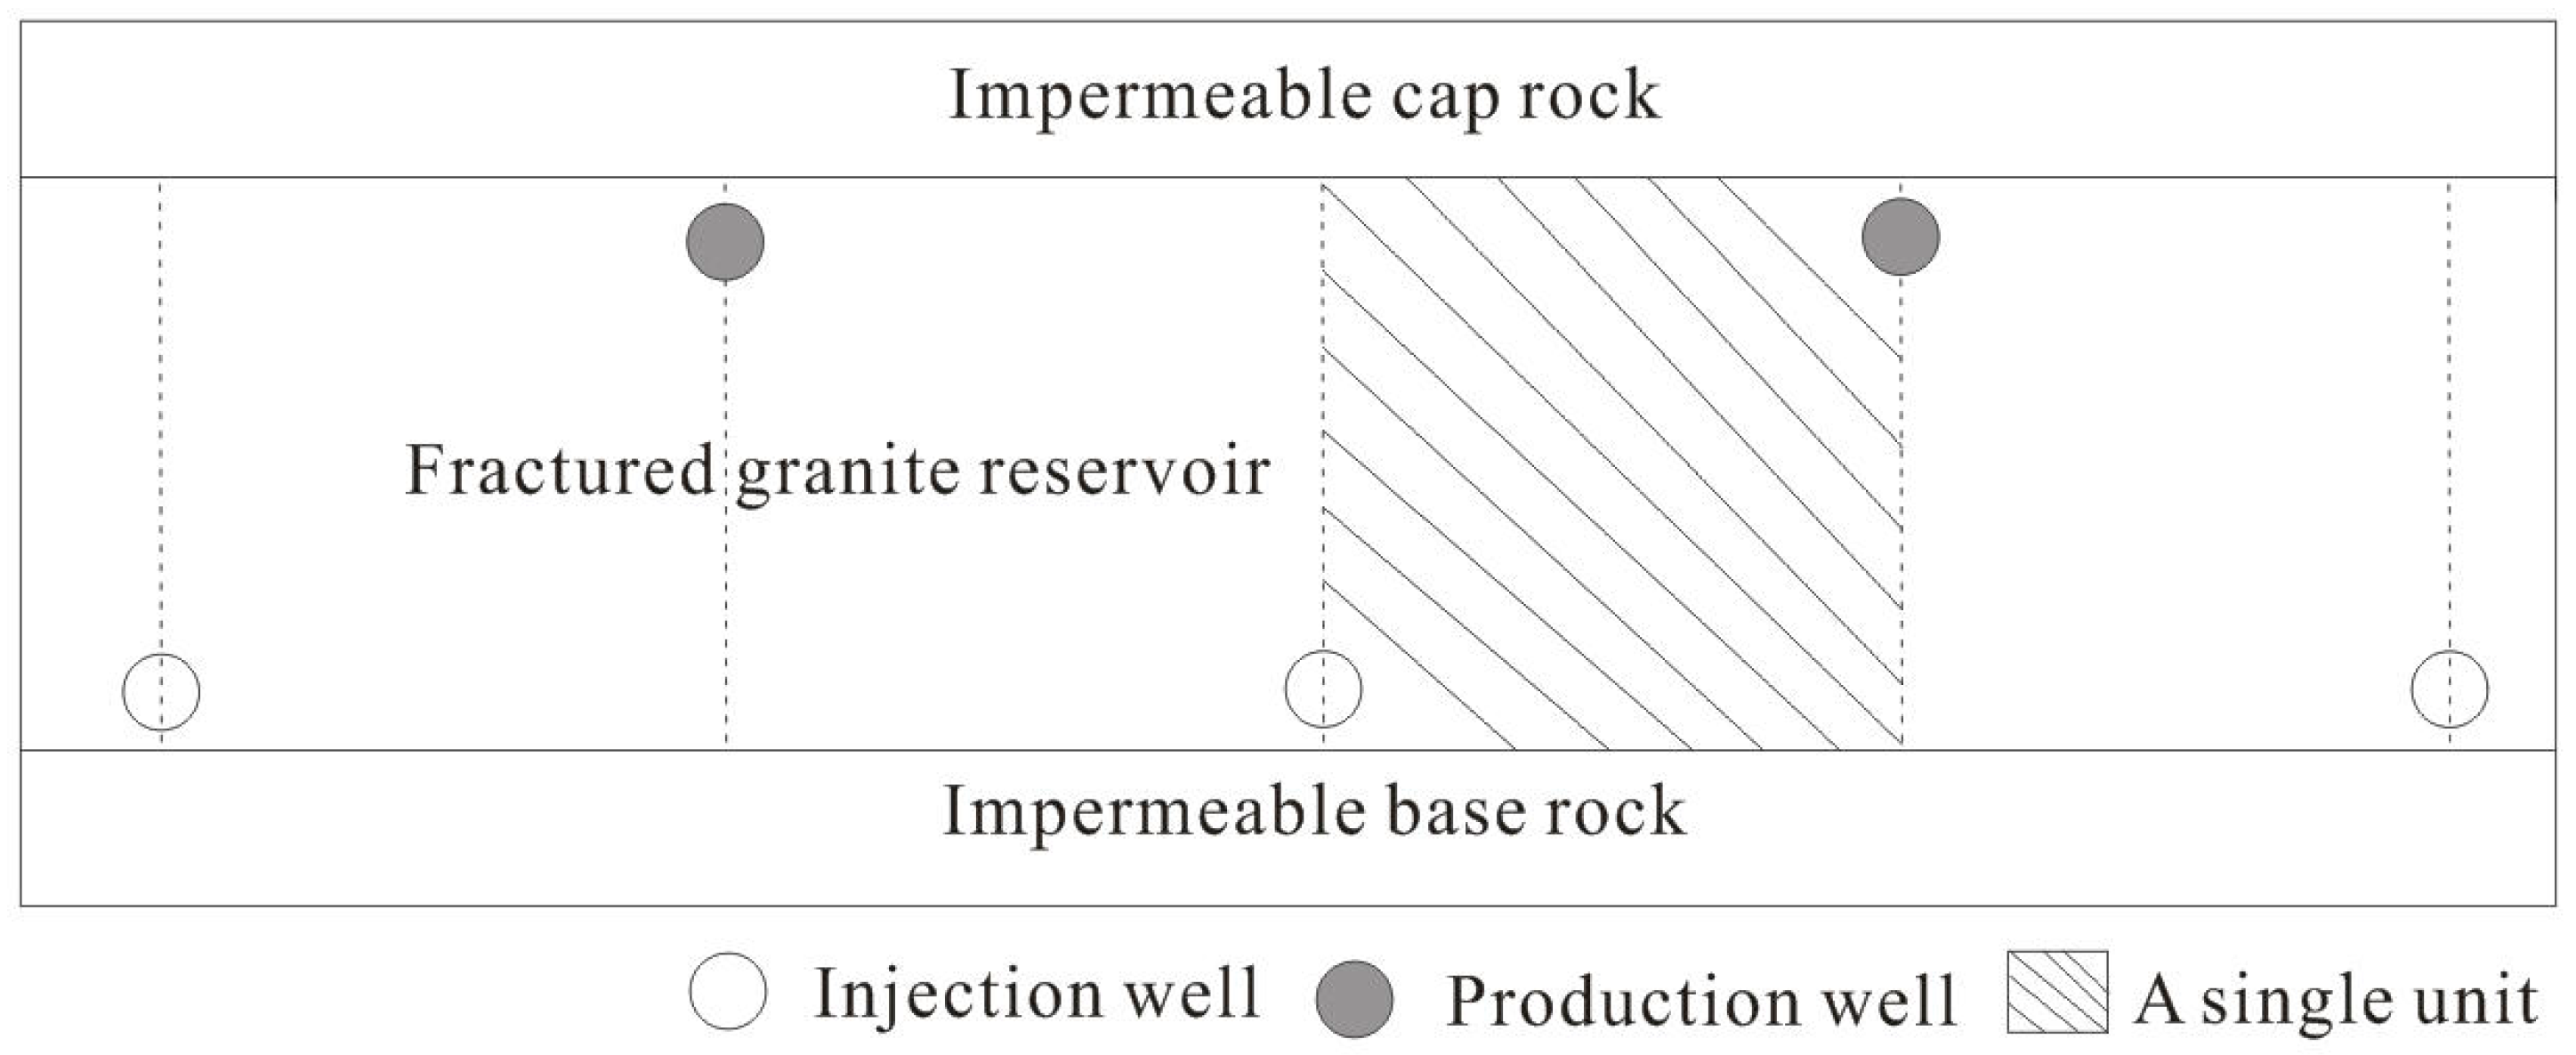
Enhanced geothermal systems employ artificial circulating water through underground fractured hot rocks to economically extract the heat energy to generate electricity, and are one of main areas of future geothermal development [1]. Because field tests of EGS are very expensive, time-consuming and difficult, the numerical simulation of EGS reservoirs has become an important research method to analyze the production performance of EGS. The numerical simulation of EGS reservoirs needs to consider and address two problems: one is to characterize and represent the subsurface fracture system, and the other is to simplify and address the coupled hydrologic-thermal-mechanical-chemical processes within the reservoirs [4,5]. There are two main methods to represent the fracture system: equivalent continuous porous media methods and discrete fracture network (DFN) methods. The equivalent continuous porous media methods mainly include the equivalent porous media (EPM) method, the double porosity media (DPM) method and the multiple interacting continua (MINC) method. For the multi-field coupling effect in the fractured porous reservoirs, the major factors affecting the heat production should be considered and the secondary factors should be neglected to establish a reduced and effective EGS reservoir model [4,5].
In recent years, numerical simulations of EGS reservoirs have made great progress centering on the two aspects of fracture representation and multi-field effect reduction. Zeng et al. employed the EPM method to investigate the electricity generation potential through a single horizontal well [6], multiple vertical wells [7], multiple horizontal wells [8], and a single vertical well [9] at Yangbajing geothermal field, and the results show that the horizontal well system has better electricity generation performance under the same conditions. Based on thermodynamic non-equilibrium assumption, Jiang et al. employed the EPM method to develop a three-dimensional transient model for an EGS subsurface hydraulic-thermal process and used the novel model to analyze the performance characteristics of the heat production of EGS [10,11]. Huang et al. undertook the reservoir-wellbore simulation through indirect coupling of Transport of Unsaturated Groundwater and Heat (TOUGH2) with the wellbore simulator HOLA with the EPM method and investigated the electricity generation performance through thermodynamic modeling [12]. Zhang et al. investigated the feasibility of generating electricity from EGS by oilfield produced water circulating through reservoir stimulated by staged fracturing technology for horizontal wells based on the geological data of Xujiaweizi area [13]. Cao et al. studied the thermophysical properties of heat transfer during heat extraction process in EGS and employed a new model to simulate the long-term heat extraction process of water-EGS and Super-critical (SC) CO2-EGS [14]. Chen et al. investigated multi-well layout for EGS to better exploit HDR geothermal energy, and the results enable a detailed analysis on the effects of well layout on EGS heat extraction performance [15]. Chen et al. found that the local thermal equilibrium model generally overestimates EGS performance and, for an EGS with better heat exchange conditions in the heat reservoir, the heat extraction process acts more like the local thermal equilibrium process [16]. Cheng et al. developed a three-dimensional hydrologic-thermal model considering water losses with the EPM method, and analyzed the influences of some factors on heat extraction [17]. Hu et al. developed a novel fully-coupled flow and geomechanics model in EGS, and analyzed pressure and temperature changes and deformation at the Geysers geothermal field [18]. Zeng et al. analyzed the influencing factors of production performance of EGS at Yangbajing geothermal field, and found that main factors affecting the energy efficiency are the reservoir permeability, the water production rate and the injection temperature [19]. Jiang et al. recently estimated the HDR geothermal resource in the Daqing Oilfield, Northeast China [20]. Li et al. conducted a comparative analysis of power plant options for enhanced geothermal systems [21]. While the enhancement of fractures with time due to thermal contraction of the rock is possible, the gradual closing of fractures or the degradation of fractures due to scaling is equally possible [22]. Therefore, we can simultaneously neglect the effects of rock deformation and chemical reaction and just assume that after stimulation the fracture aperture and spacing remain unchanged over the heat production lifetime. Previous studies prove that the effect of reservoir heterogeneities on the production performance of EGS is obvious and complicated; for the purpose of simplification, in this work, only the homogeneous reservoir is considered, and the detailed content on the reservoir heterogeneities will be addressed in future work [4,5,6,7,8,9,19,22].
Although the numerical simulations of EGS reservoirs have made great progresses, there is still a lack of systematic study on the conditions affecting the heat production performance. Cheng et al. conducted sensitivity analysis of heat extraction to main system parameters of EGS, and the results show that thermal breakthrough time mainly depends on production flow rate and water loss rate, showing the important effect of water losses [17]. Zeng et al. investigated the main factors influencing the electricity generation performance of EGS, and the results demonstrate that the main factors affecting the performance are reservoir permeability, water production rate and injection temperature [
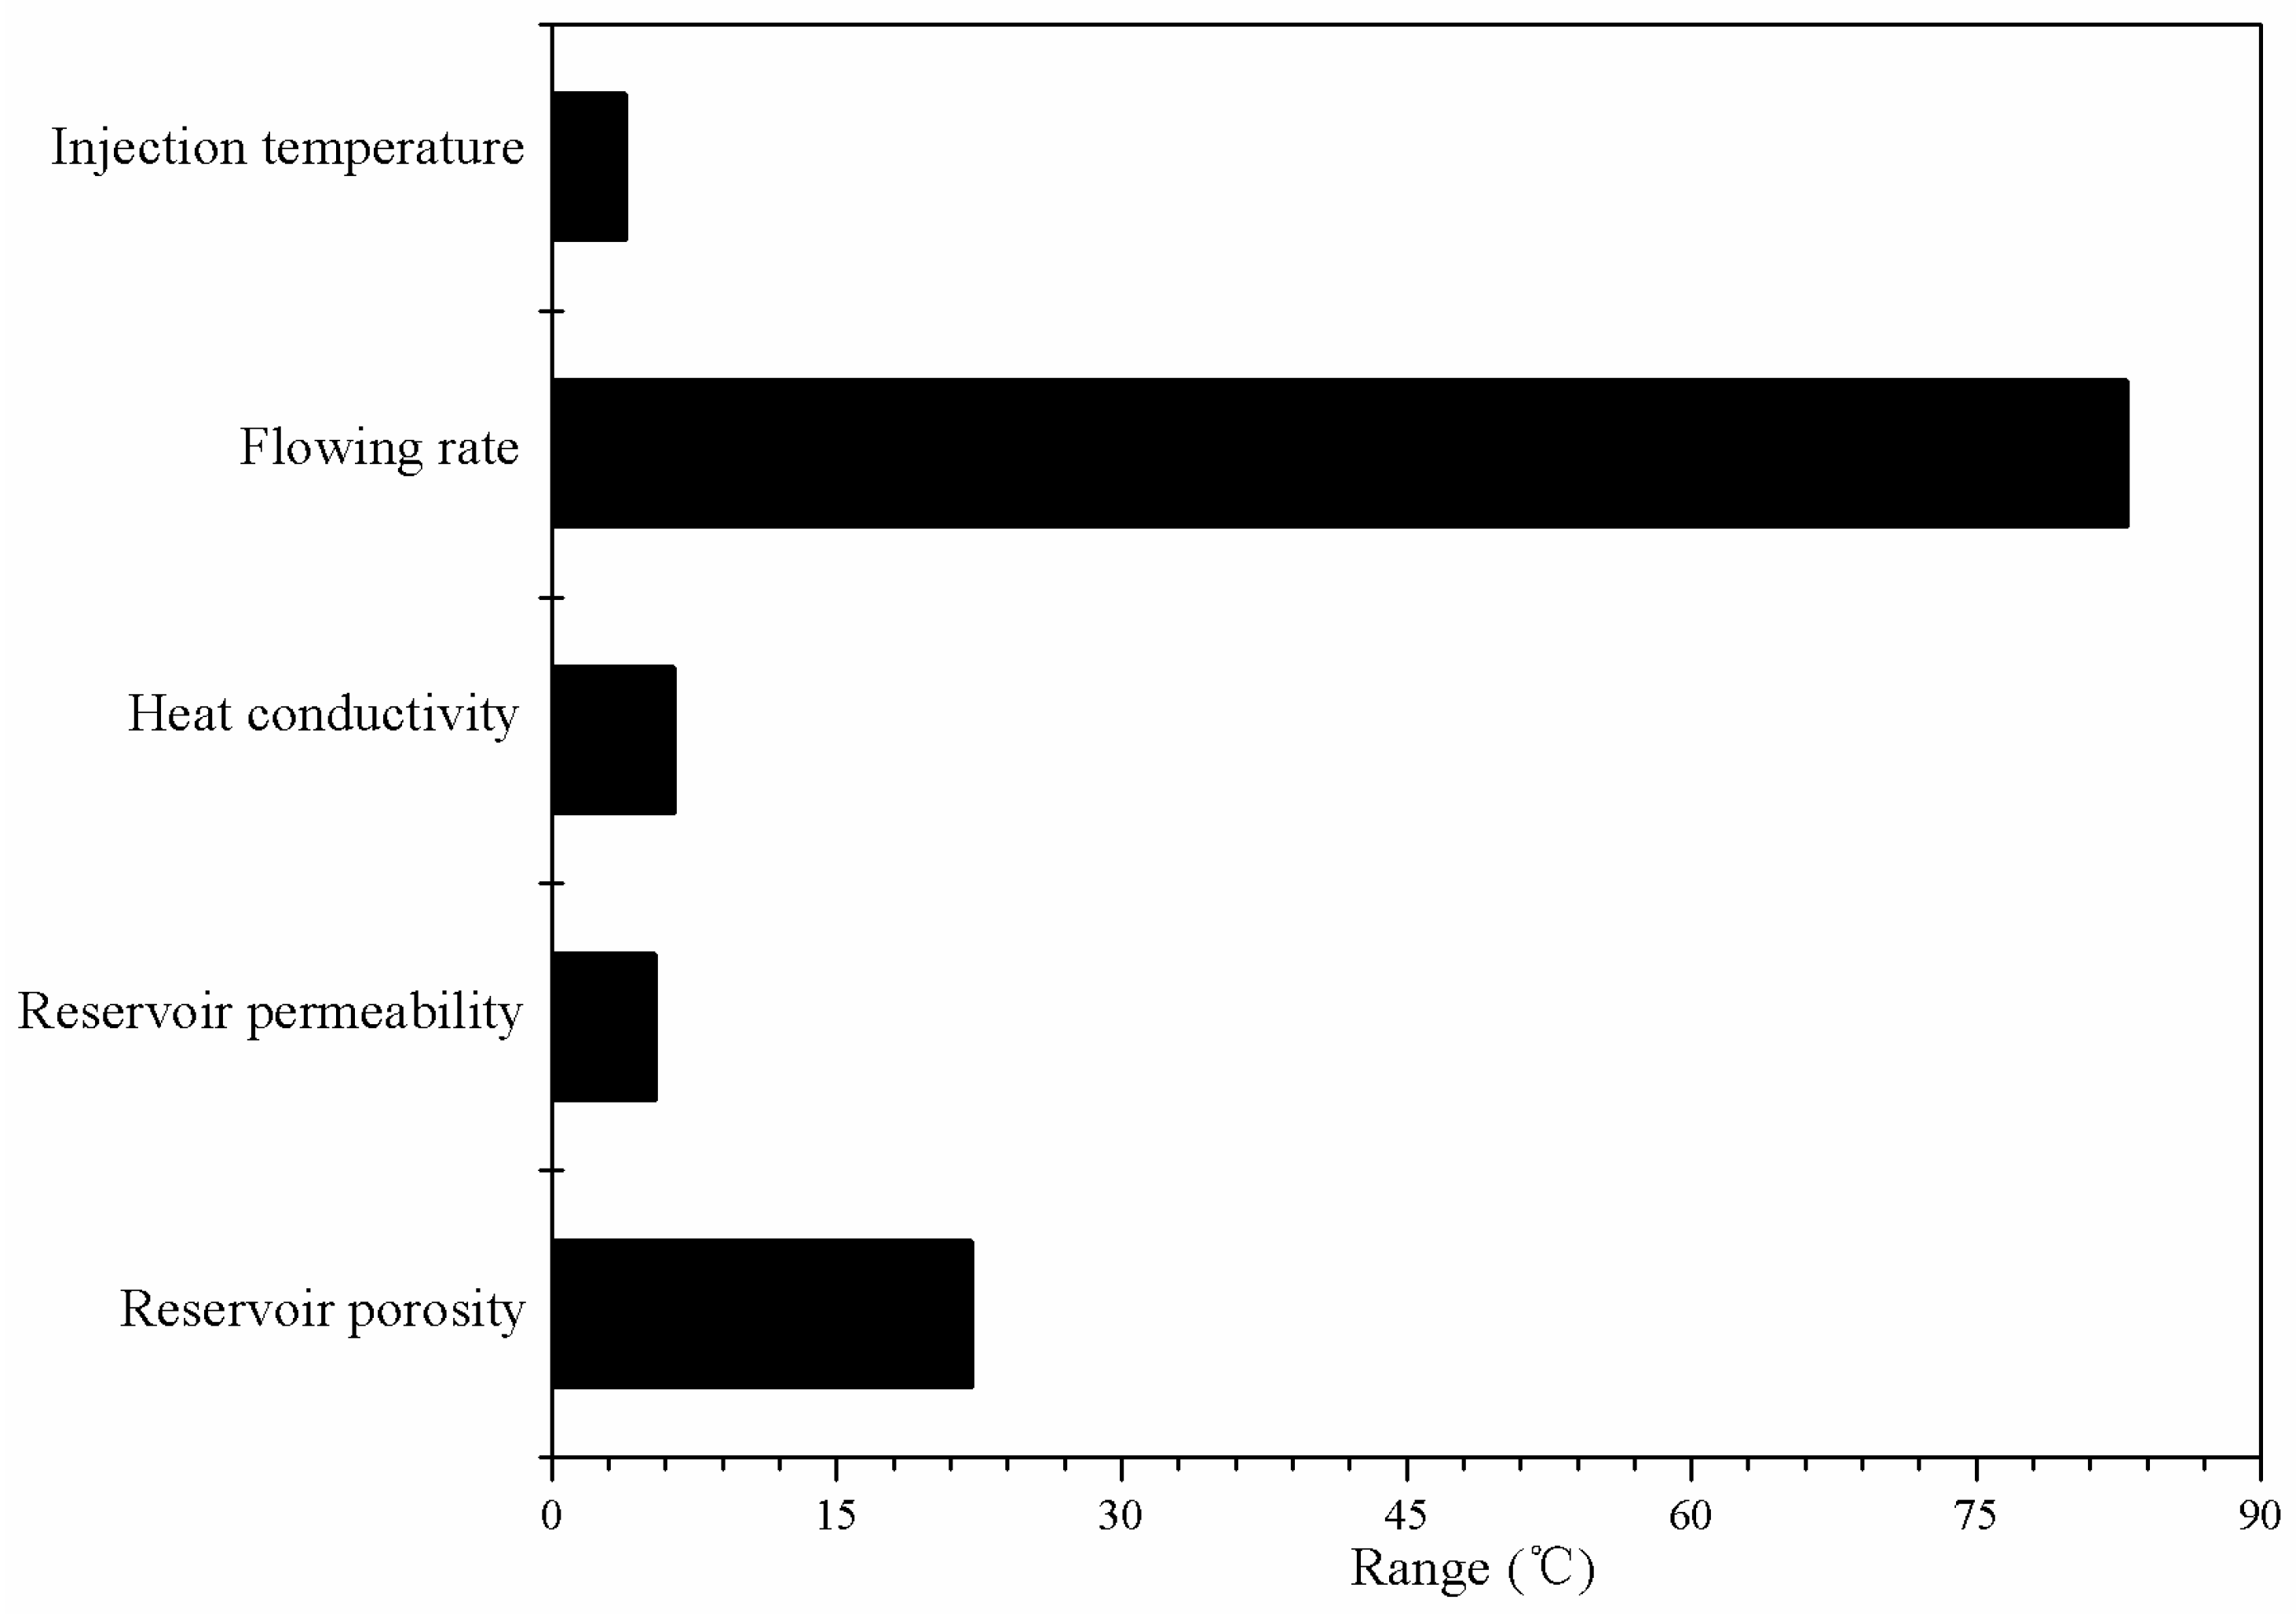
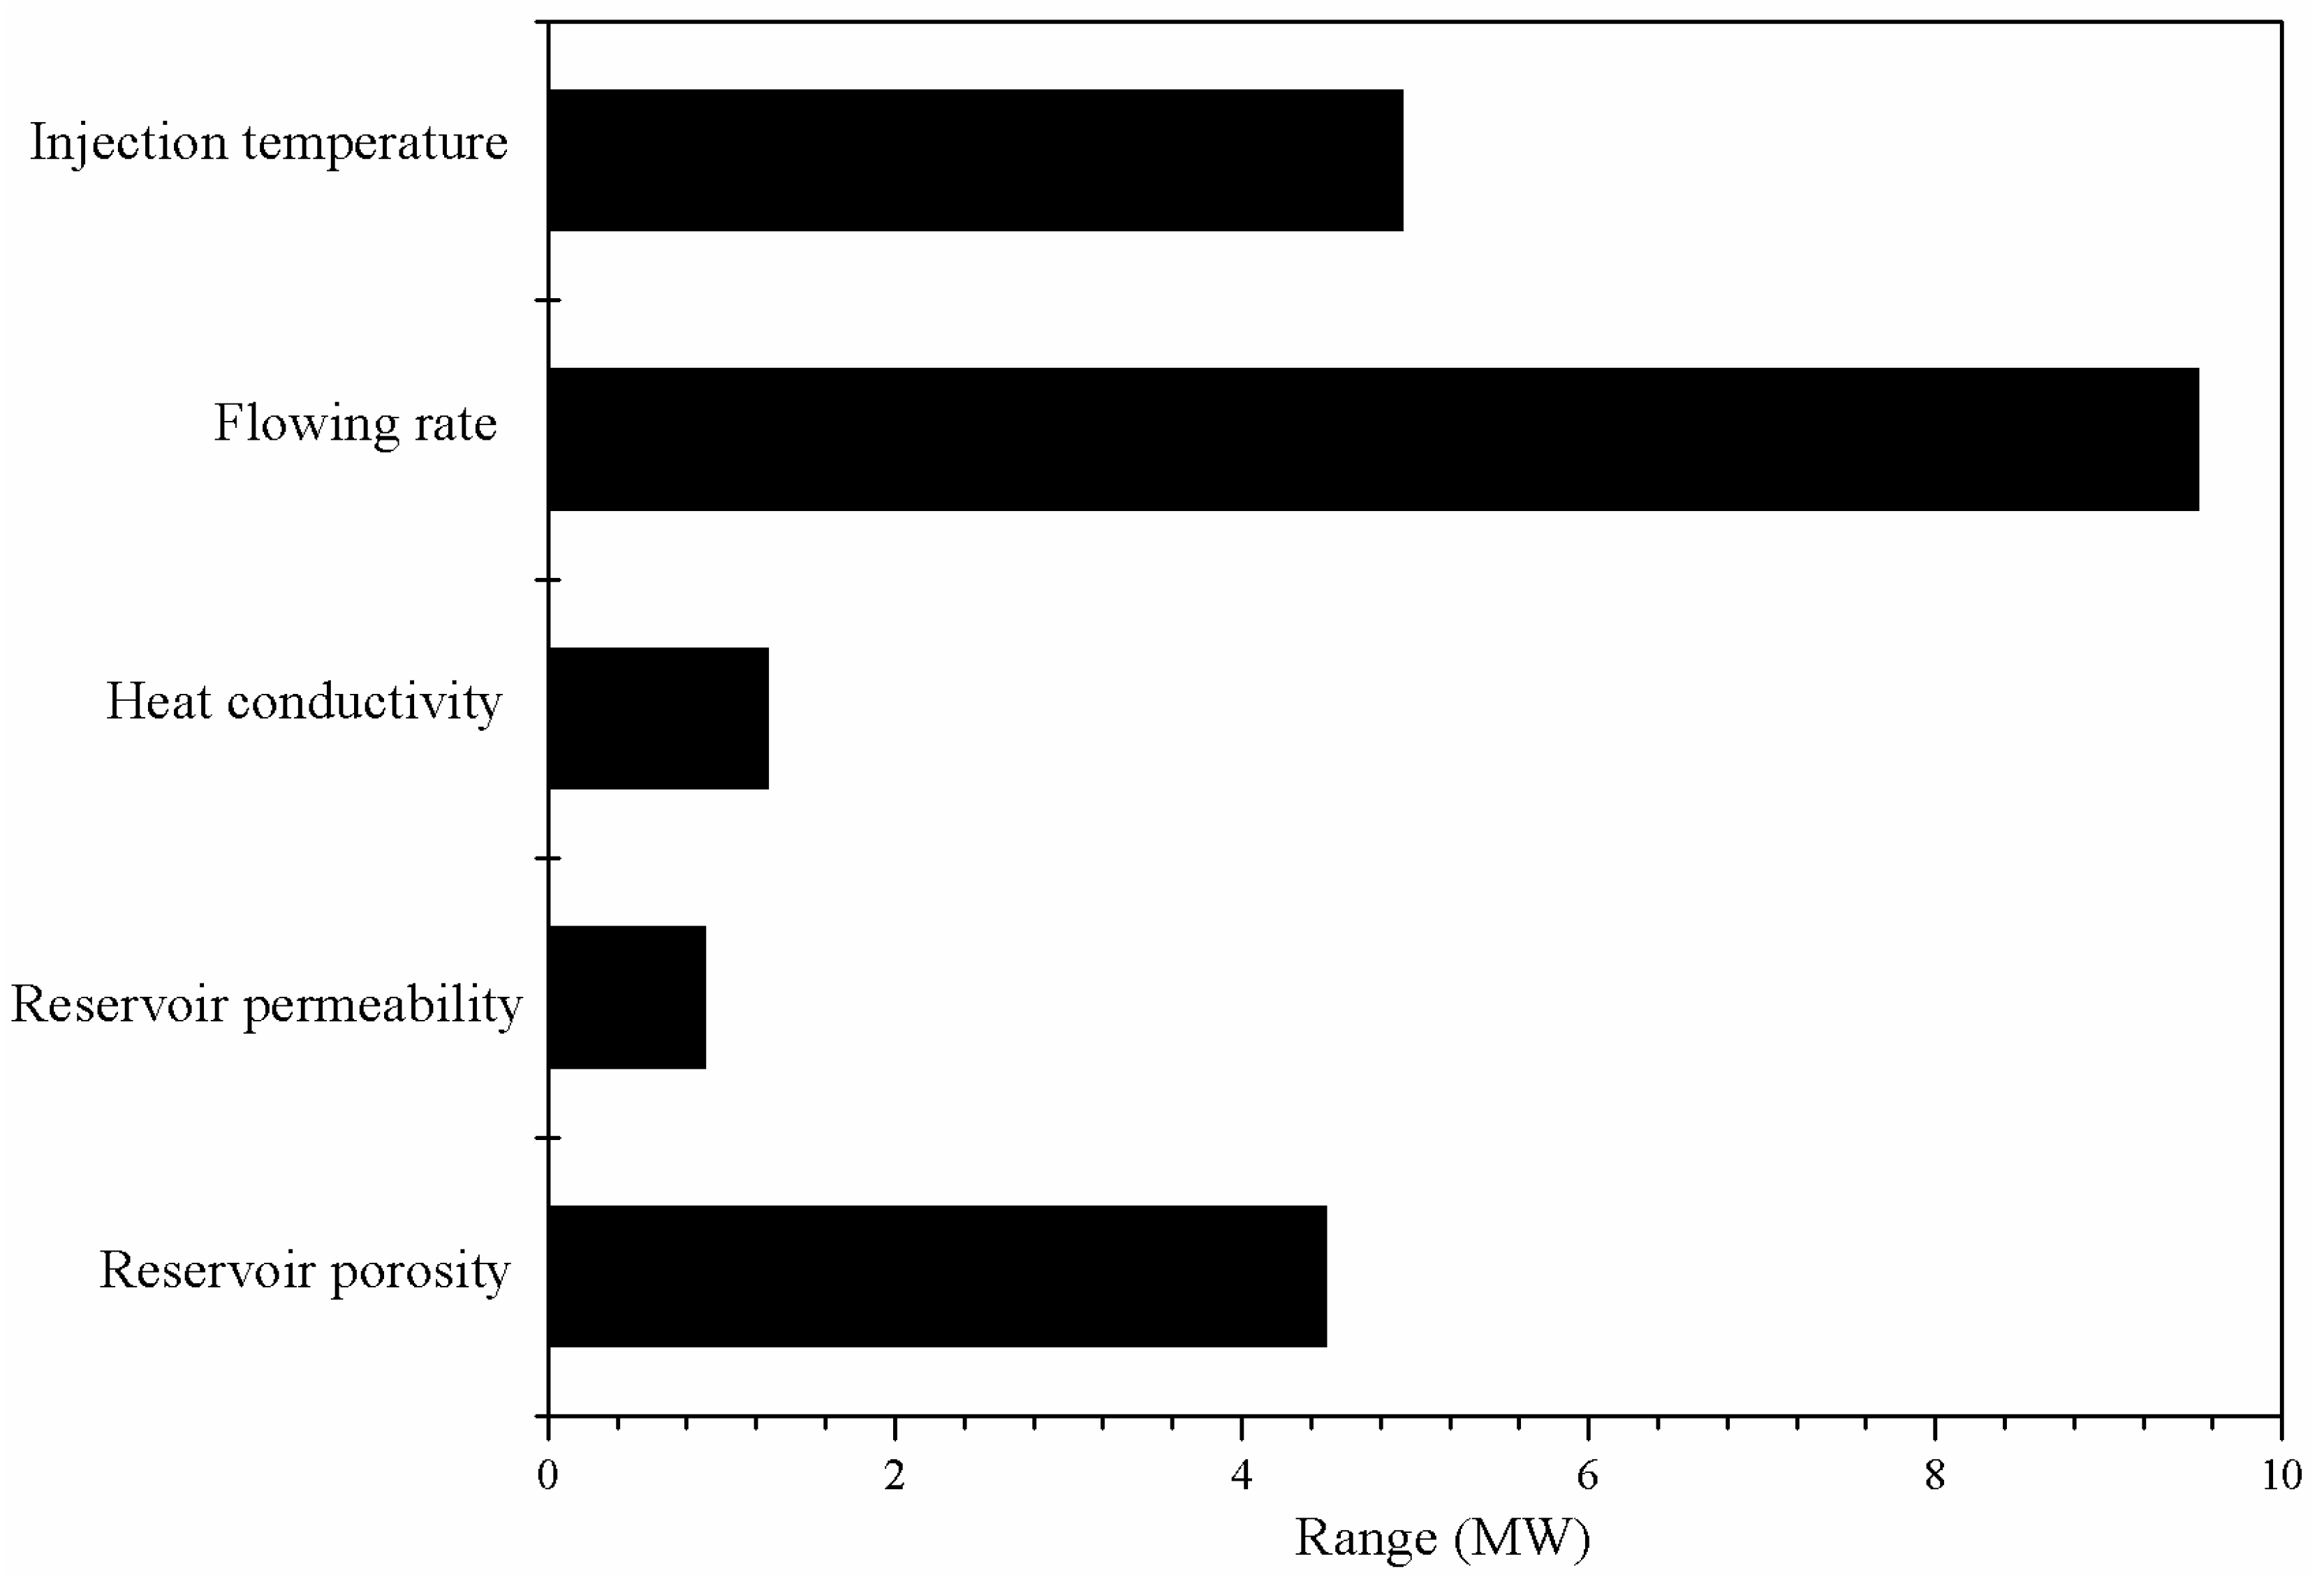
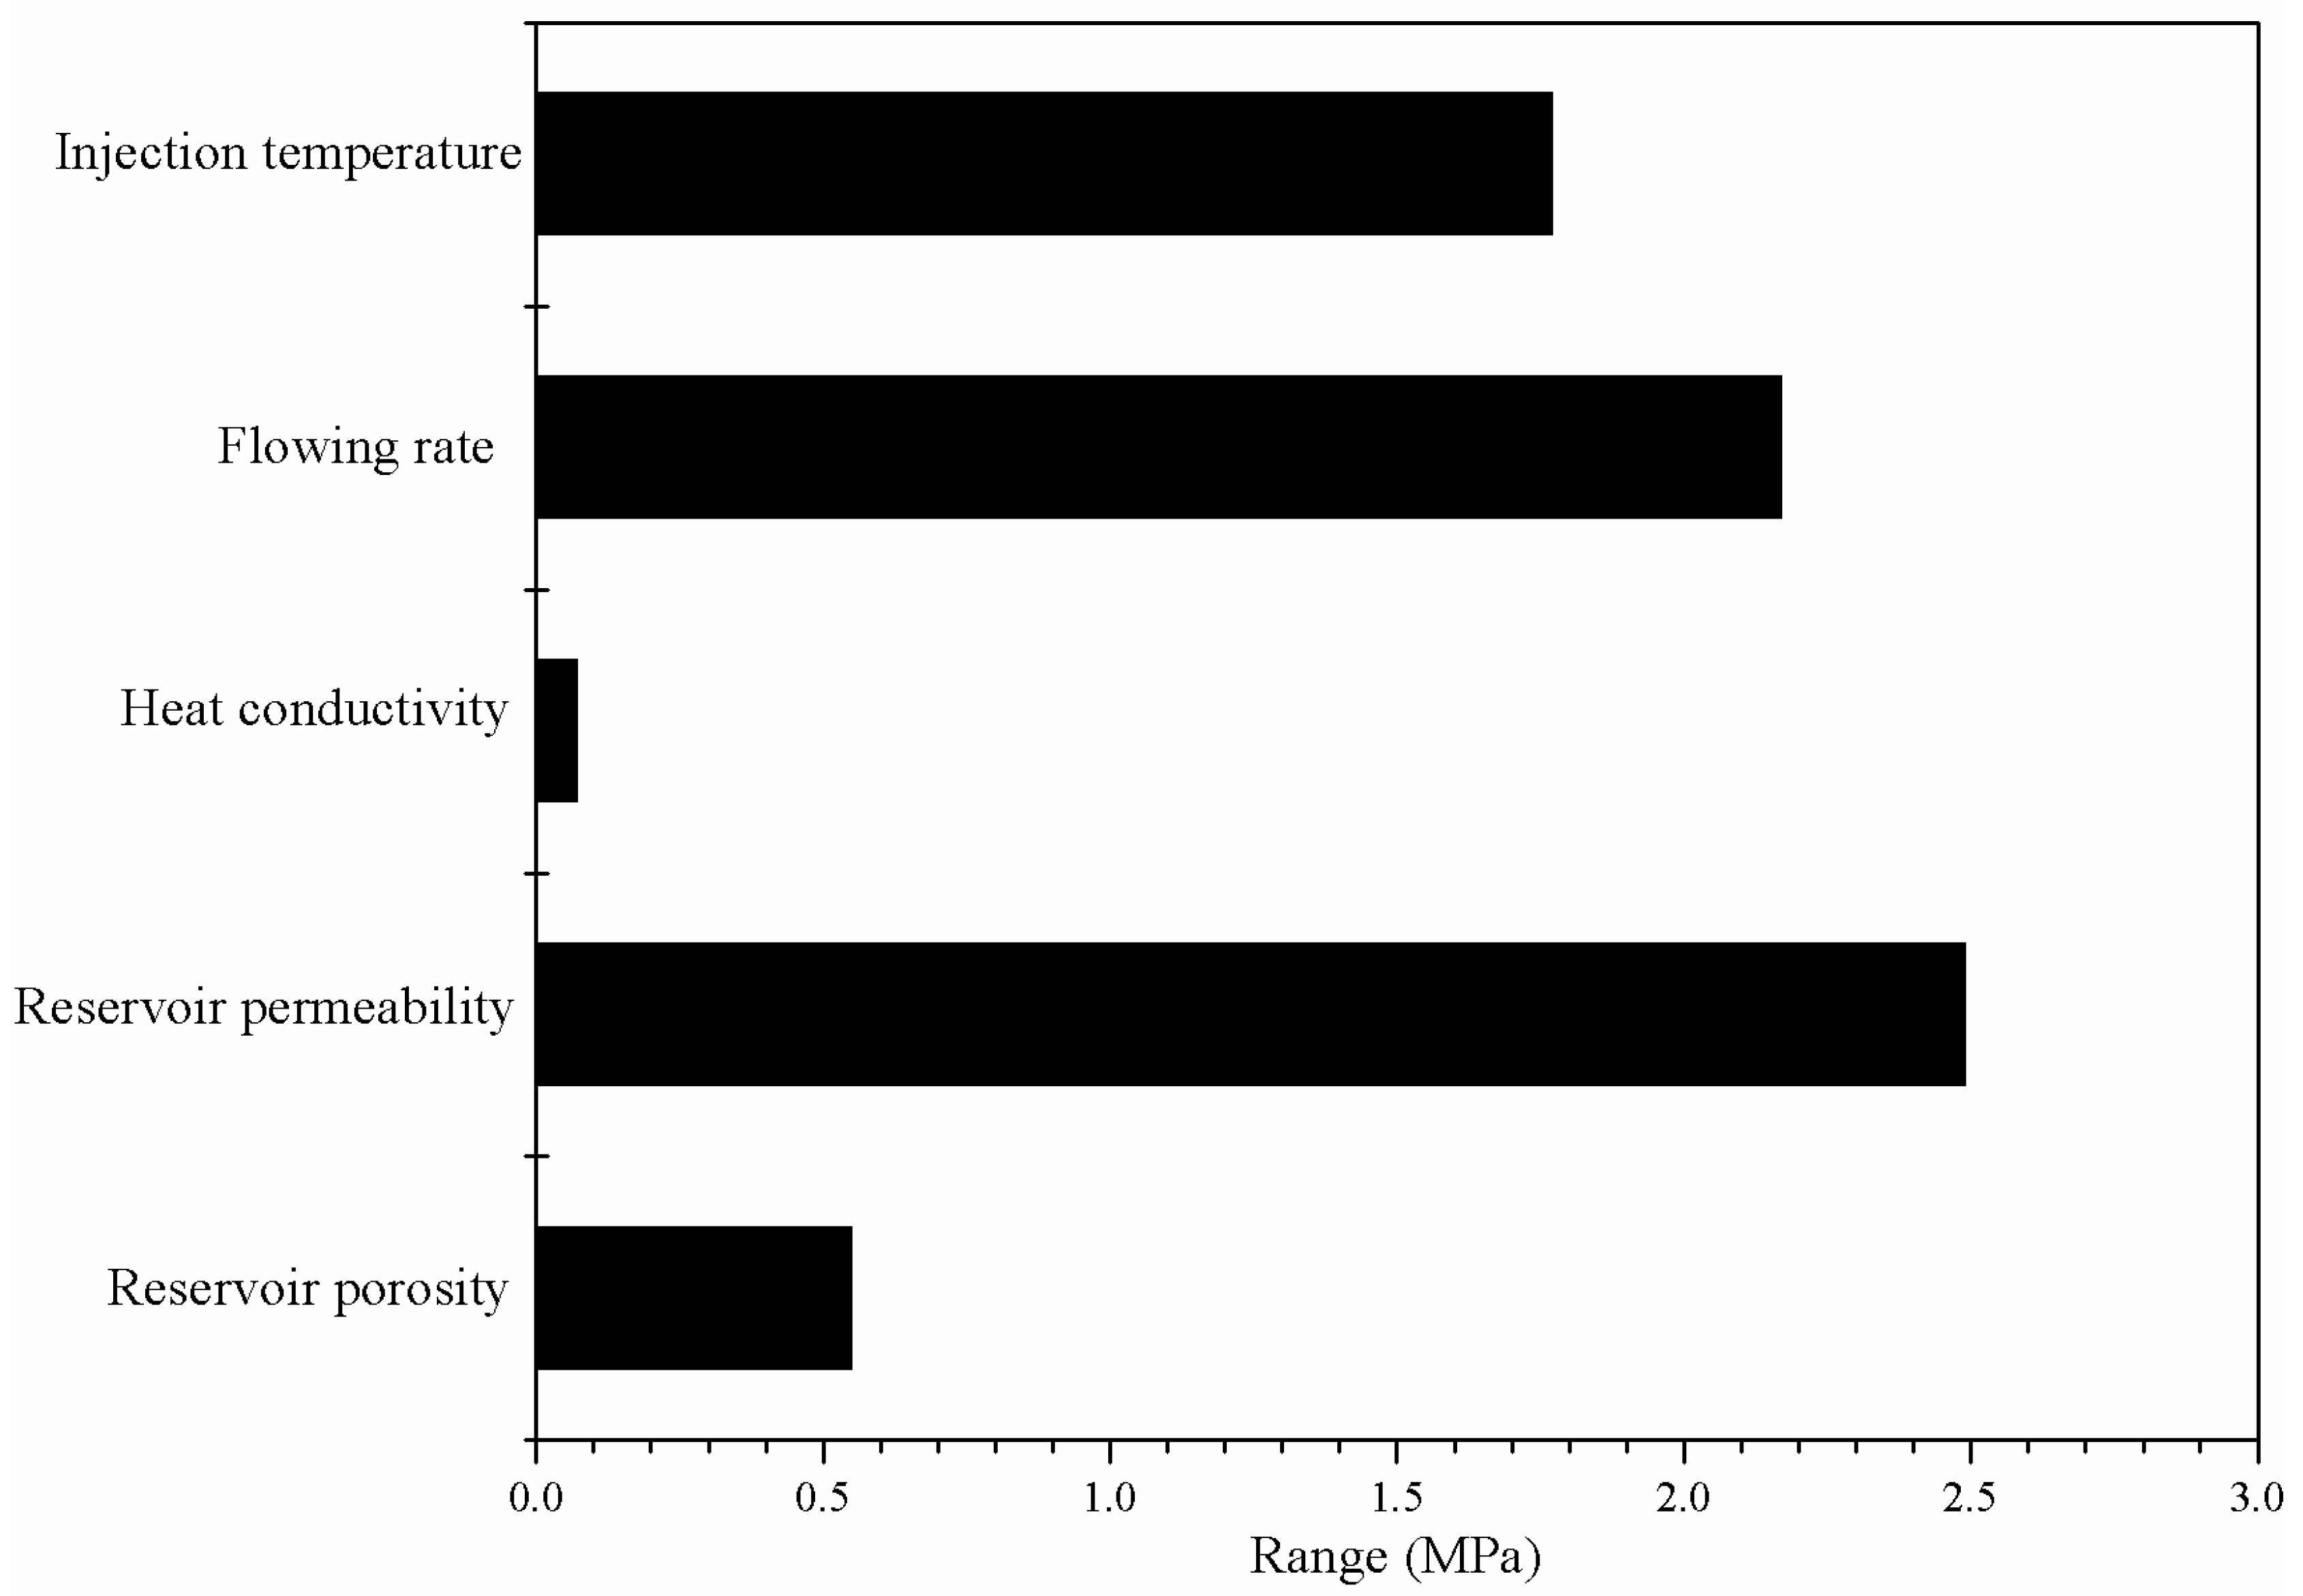
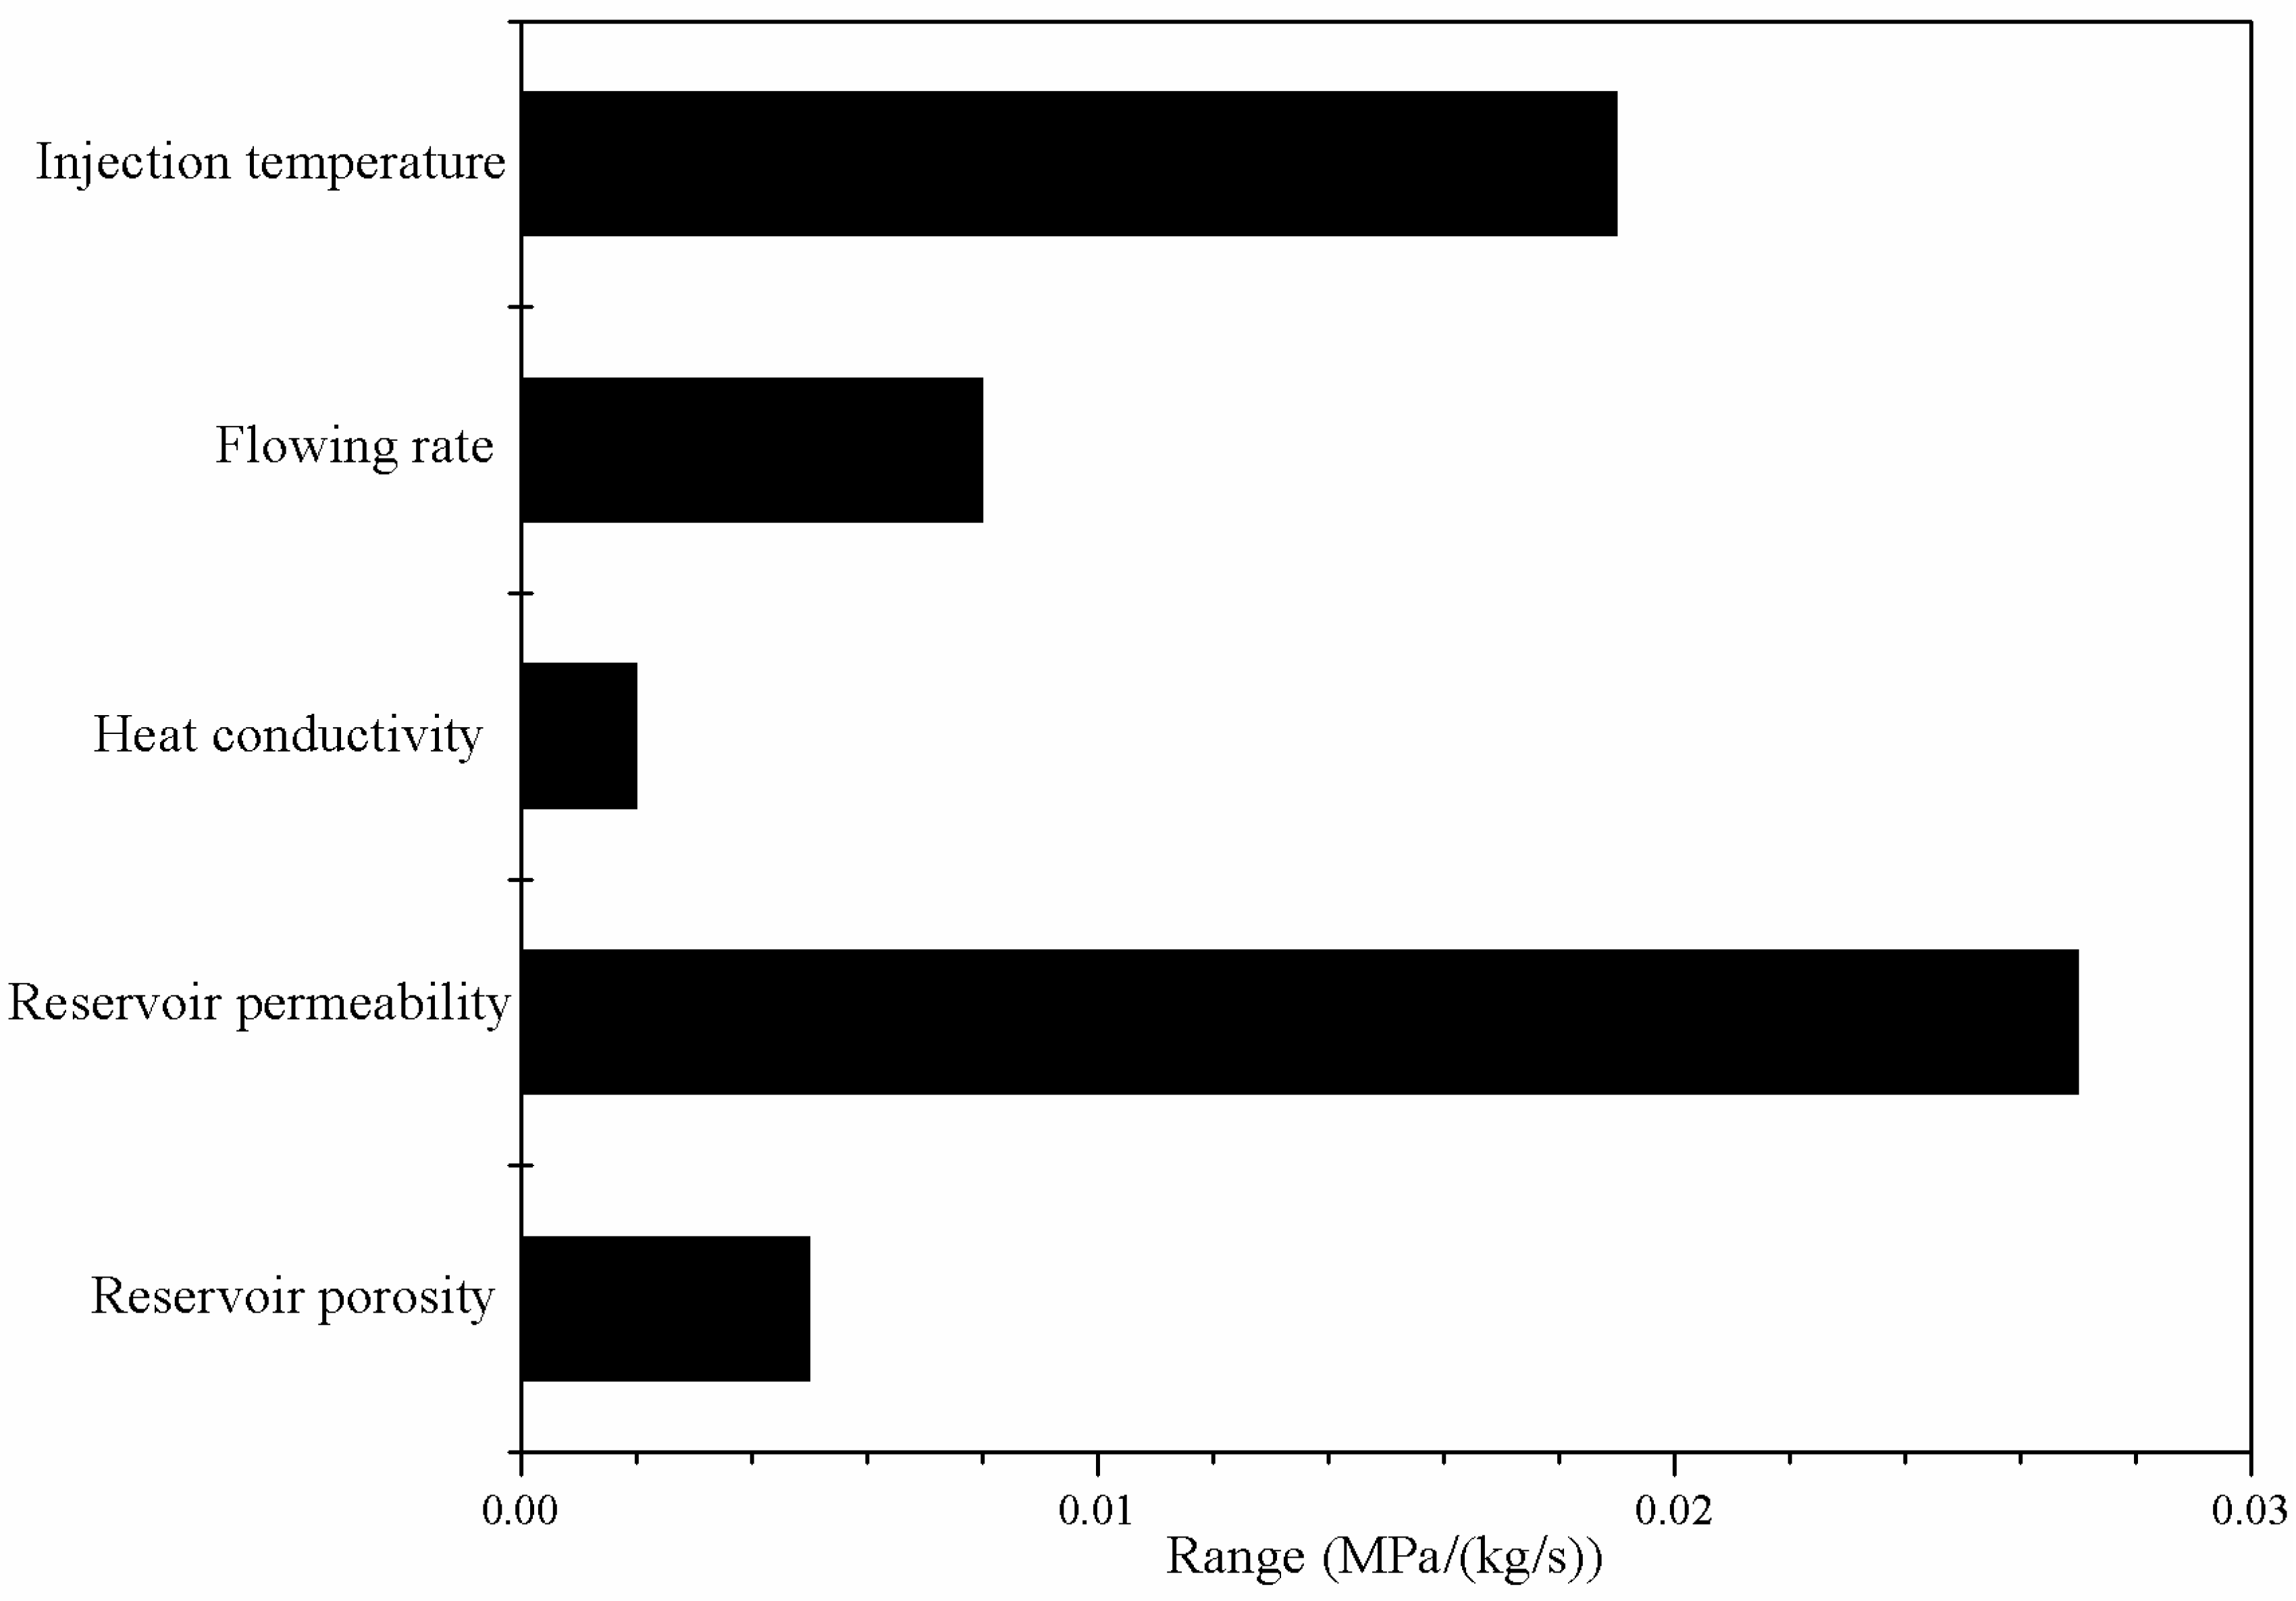
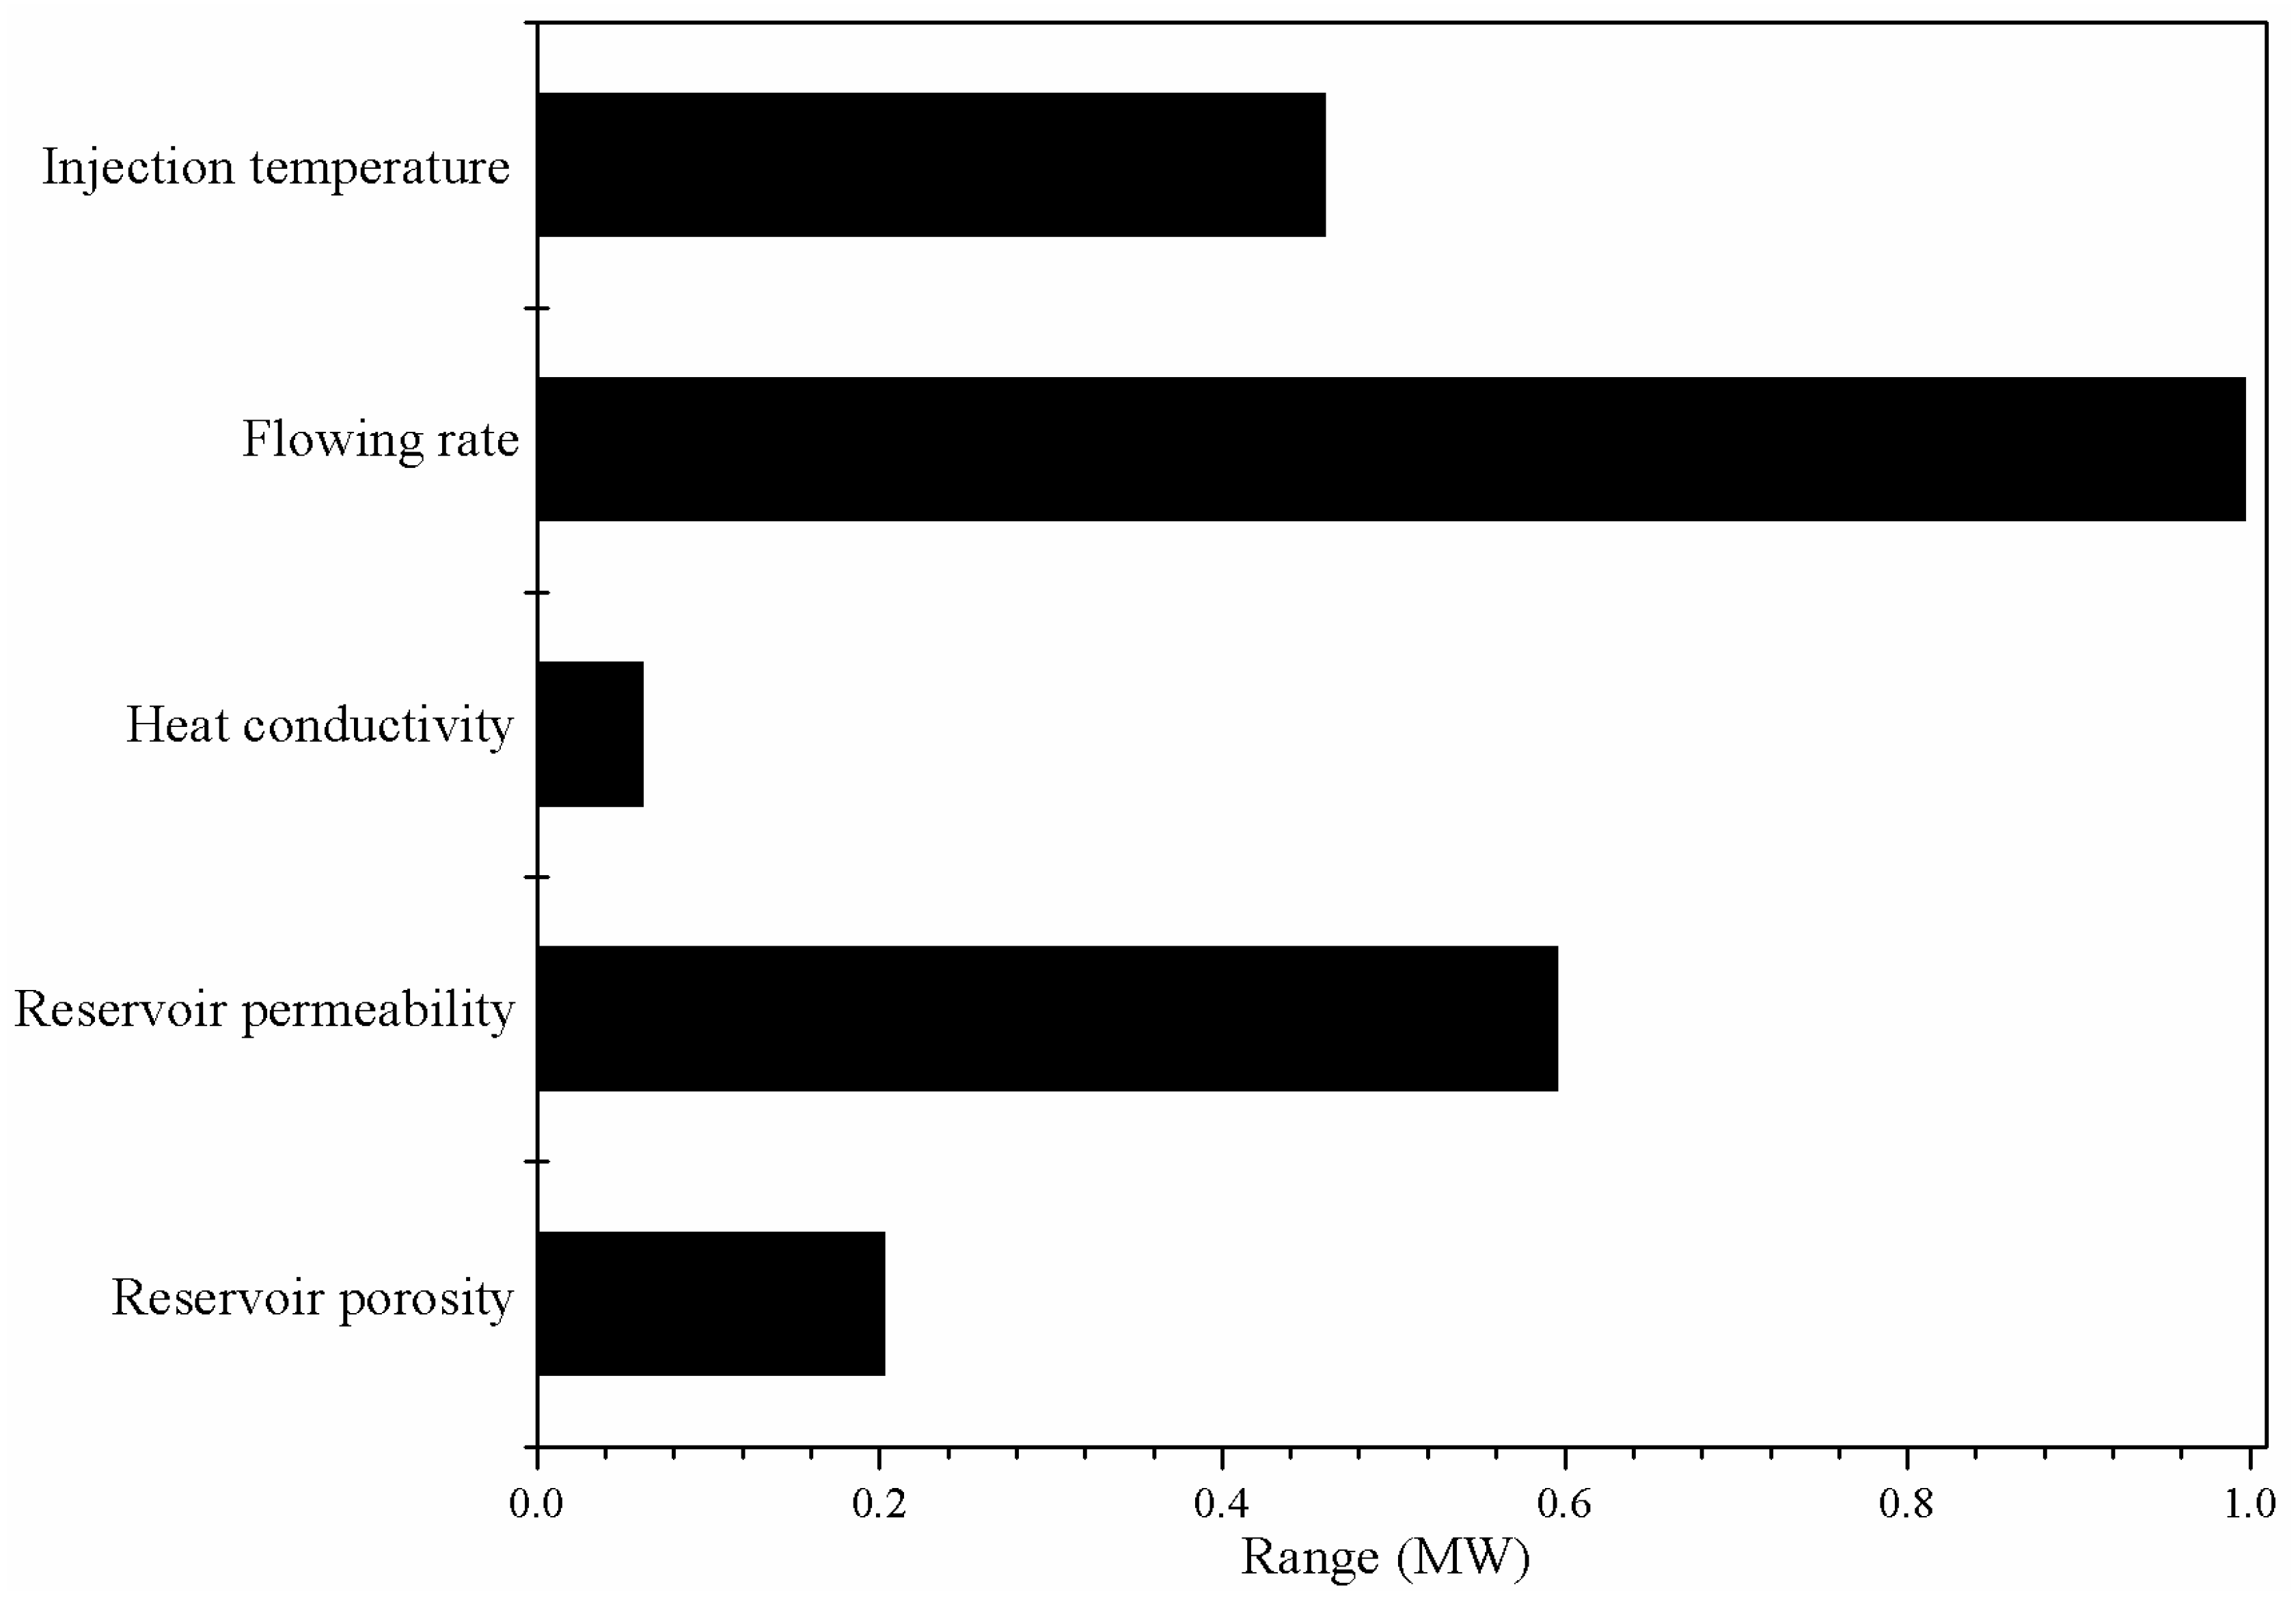
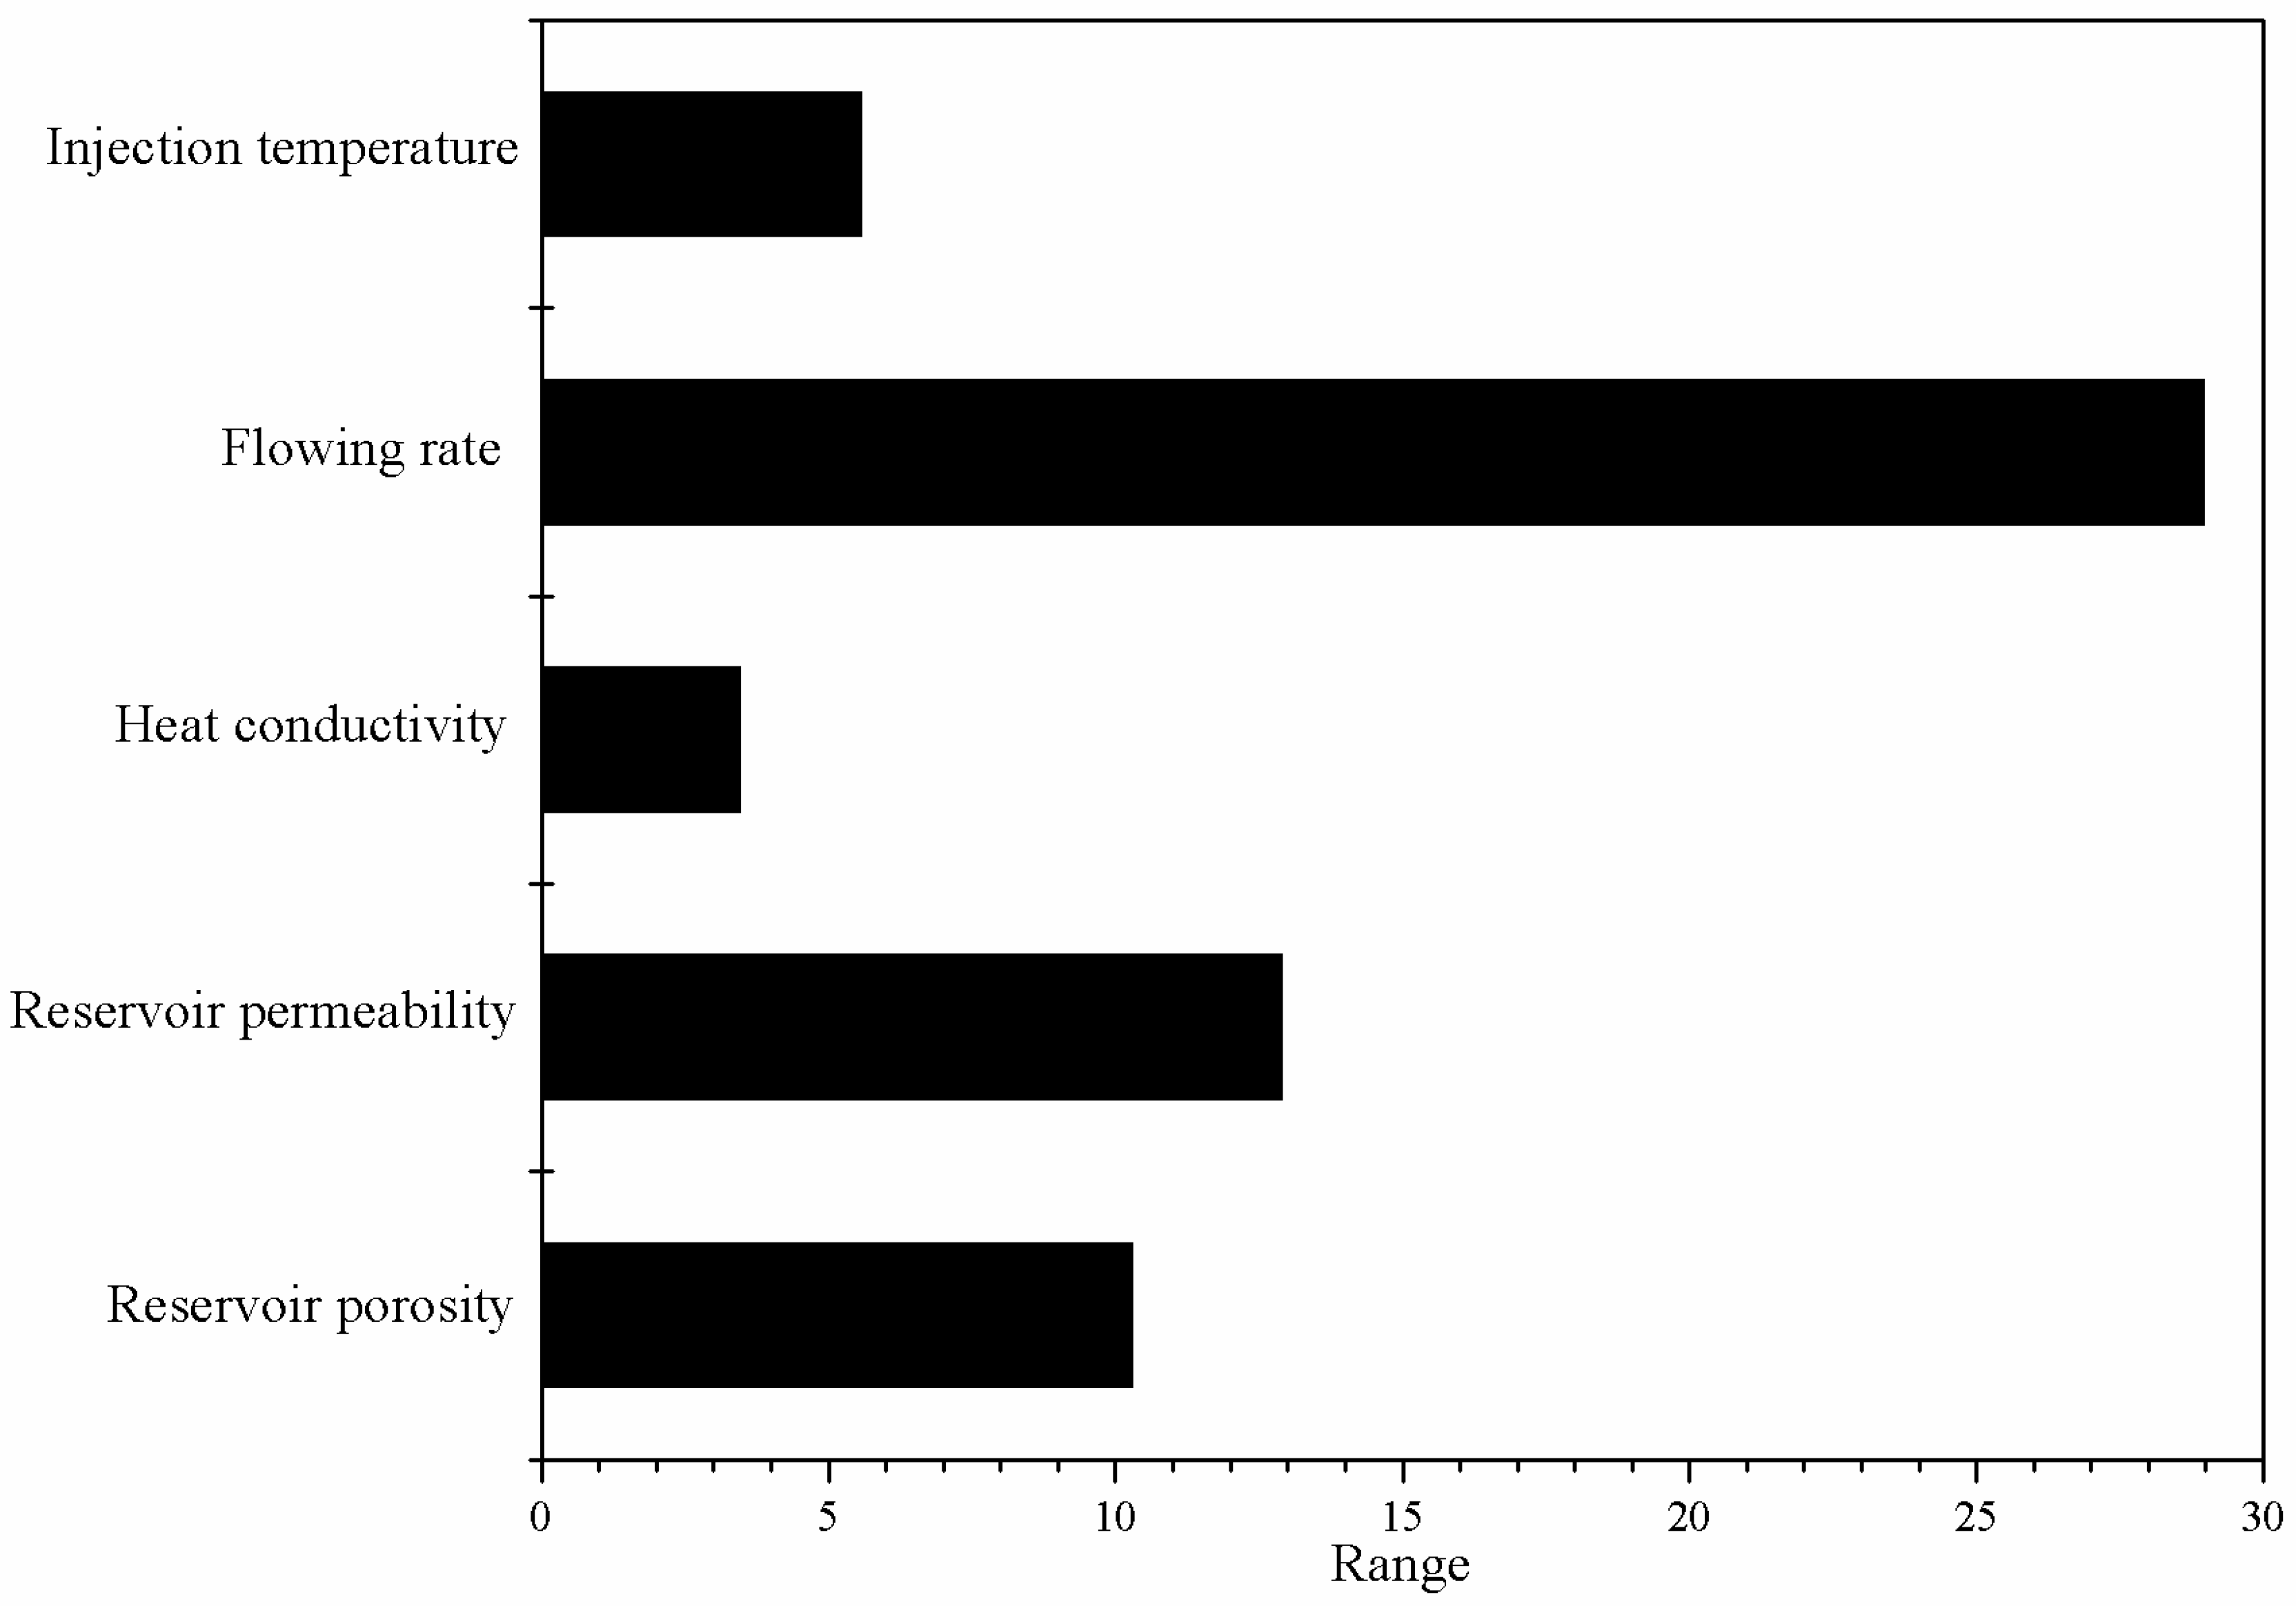
19]. These preliminary studies do not compare every condition and do not uncover the order of relative importance of the conditions affecting the electricity generation. The orthogonal test method is a kind of approach that can compare every condition and rank the order of relative importance of every condition. This method has been widely used in test design in science, engineering and business [23]. In order to systematically research the conditions affecting the electricity generation of EGS, to compare every condition and rank the order of relative importance of every condition, in this study we investigated the main conditions affecting the electricity generation of EGS and ranked the order of relative importance of every condition with the orthogonal test method based on the geological data at Yangbajing geothermal field. This helps to find out the main measures to improve the production performance of EGS and will provide a scientific basis for future exploration and exploitation of deep EGS reservoirs at the Yangbajing geothermal field.

1.2. The Yangbajing Geothermal Field

The Yangbajing geothermal field is located in the Yangbajing district in Dangxiong county, 94 km northwest of Lhasa, the capital of the Tibet Autonomous Region, China. Its geographic coordinate ranges from 30°01′ N to 30°05′ N and 90°27′ E to 90°31′ E, with elevation ranging from 4290 m to 4500 m above sea level [6]. It is the first high-temperature hydrothermal convective geothermal field in China [6,24,25]. Reference [6] reported the geologic structure, hydrological and geothermal features of the Yangbajing geothermal field in detail. In the northern part, well ZK4001 was drilled to 1450 m, and well ZK4002 was drilled to 2006.8 m; both are exploration wells for a deep heat reservoir [6,24,25]. Figure 1 shows the temperature and pressure logs from well ZK4001 [25]. There are two heat reservoirs in well ZK4001: the 240~450 m depth reservoir and the 950~1350 m depth reservoir. The 240~450 m reservoir is a shallow heat reservoir, mainly fractured granite, with an average temperature of 157 °C; it is the main reservoir currently exploited and its cap rock is mainly Tertiary volcanic clastic rock. The 950~1350 m reservoir is deep heat reservoir (at a depth of 785~1010 m in the well ZK4002) [25]; this deep reservoir is located within mylonitized granite, granitic mylonite and fractured granite that have characteristics of both ductile and brittle shearing, and is covered by intensely altered and impermeable granite, haplophyre and biotite-granite [25]. The average temperature of the 950~1350 m reservoir is 248 °C with a maximum temperature of 251 °C [25]. The corresponding pressure is within 8.01~11.57 MPa in the 950~1350 m reservoir. This pressure range is computed according to the relationship between pressure P (MPa) and depth z (m) as P = 0.0089 z 0.4444 ( MPa ) , which is also indicated in [25]. More information about the Yangbajing geothermal field can been found in reference [6,7,8,9,19,24,25].

1.3. Research Objective

The main research objectives of this study are to investigate the conditions affecting the heat production performance of EGS reservoirs with the orthogonal test method, to rank the order of relative importance of every condition, and to find out the main measures to improve the production performance of EGS. This will lay a good foundation for the future development and utilization of the Yangbajing geothermal field.

2. Model and Method

2.1. The Orthogonal Test Method

The orthogonal test method is a kind of method to analyze multi-factor and multi-level influence on system objectives, and was proposed by Fisher A. in 1920 [23,26]. Through very limited combination tests, the method can represent complete tests, thus greatly reducing the workload and obviously improving the computational efficiency. Due to very high efficiency this method has been widely used in science, engineering and business [23]. According to previous studies in this work, we investigated the influence of five conditions on electricity generation: reservoir porosity (φ); reservoir permeability (k); rock heat conductivity (λ); water production rate (q), and; injection temperature (Tinj) [17,19,27]; every condition has four levels, as shown in Table 1. The system objectives of EGS include six aspects: production temperature Tpro; electric power We; injection pressure Pinj; reservoir impedance IR; pump power Wp, and; energy efficiency η [17,19]. For the tests in this study of five factors involving four levels, a “complete factorial” experiment would test 4 × 4 × 4 × 4 × 4 = 1024 trials in total. It is a significant amount of work and may not be possible to complete in a limited time. Therefore, it is desirable to obtain a small, but representative, subset of combinations for the simulations [23]. Based on the five factors involving four levels, the corresponding orthogonal arrays are shown in Table 2, and we only need to do 16 trials to determine the relative importance of every factor. The four levels are based on the geological measurements at the Yangbajing geothermal field, they represent typical conditions of practical EGSs, so the analysis is widely applicable to common EGS reservoirs.

2.2. Heat Production Method

As shown in Figure 2, three horizontal wells are employed to mine the heat from the 950~1350 m fractured reservoir at the Yangbajing geothermal field. The injection well is located at bottom of the reservoir at z = −1325 m, and the cold water is injected into the reservoir through the injection well. Two production wells are located at the top of the reservoir at z = −975 m to produce the heated water. We install an injection pump on the ground, directly connected with the injection well, and the water injection rate is kept at a constant; for the production well we install a suction pump at ground level to draw the heated thermal water out from the reservoir, and the bottomhole production pressure is kept at a constant. This kind of production schedule can effectively reduce reservoir pressure and flowing impedance, and restrain water losses in the reservoir [4]. Because of symmetry, only half of the domain as shown as grey fraction in Figure 2 needs to be simulated. Assuming uniformity of property along the length of the horizontal well, only a single unit of the well is needed to be simulated, and the flow field is reduced from three dimensions to two dimensions. Assuming that the length of the horizontal well is 500 m, the length of the simulated domain is 10 m, the water production rate of the simulated domain is q, then the whole water production rate Q of the three horizontal wells is 100 times that of the simulated domain: Q = 50 × 2 × q = 100q. The initial pressure at the injection well at z = −1325 m is Pwo = 11.35 MPa. If the safety factor f is f = 1.32 [4,5,6,7,8,9], the maximum available pressure Pmax at the injection well is Pmax = f·Pwo = 14.98 MPa. During the whole 20 years of heat production, the injection pressure Pinj must be lower than Pmax = f·Pwo = 14.98 MPa. The initial pressure at the production well at z = −975 m is 8.23 MPa. Based on the production data at the Desert Peak geothermal field [22], the production wells were allowed a maximum drawdown of 3.4 MPa, thus the minimum pressure the production well can be operated is: 8.23 MPa − 3.40 MPa = 4.83 MPa. In this study, the bottomhole production pressure of the production well is maintained at P0 = 5.00 MPa. For the purpose of simplification, in this work the water losses are neglected and the water injection rate is equal to the water production rate: qinj = qpro = q. In this work, the EPM method is employed to simulate the heat mining process at the Yangbajing geothermal field. In the EPM method, the fracture system is represented as a single medium and energy balance equation is solved for a single porous temperature [4,5,6]. More information about the EPM method, the readers can refer to [4] and here we did not repeat.

2.3. Domain, Grid and Parameters

The cap rock and base rock of the 950~1350 m fractured granite reservoir at the Yangbajing geothermal field has only very slight permeability [6,7,8,9,19], and the cap rock and the base rock can be assumed to be impermeable, as shown as in Figure 2. Because there is only very slight conductive heat transfer between the permeable reservoir and the impermeable cap and base rock, this conductive heat transfer can be neglected [6,7,8,9,19]. As shown in Figure 3, after these simplifications are implemented, the simulated domain is within 0~500 m in the x direction, and is within −1350~−950 m in the z direction. Because the thickness of the simulated domain is only 10 m, the simulated domain is within 0~10 m in the y direction. Previous studies have proved that neglecting the slight water flow and heat transfer in the impermeable cap rock and base rock are reasonable and can greatly simplify the simulation problem [4].
Figure 3a shows geometric model of the above simulated domain, and Figure 3b shows grid system for domain discretization. In this study we used structured grids. The simulated domain is uniformly divided into 50 gridblocks along the x direction, and width of every gridblock is 10 m. It is uniformly divided into 40 gridblocks along the z direction and height of every gridblock is 10 m. There is only one gridblock along the y direction and width of this gridblock is 10 m. Therefore the whole two dimensional system in Figure 3b comprises 50 × 40 = 2000 gridblocks. Because the radius of the horizontal well is only rw = 0.10 m, far less than the size of the gridblock, the well is represented by the gridblock in which the well is located in the form of the source term. Similar to previous studies [4,5,6,7,8,9,19], in this study we employed the EPM method to represent the fractured granite reservoir, and the properties and conditions of the simulated domain of the 950~1350 m reservoir are shown in Table 3, in which the reservoir porosity (φ), reservoir permeability (k), rock heat conductivity (λ), water production rate (q) and injection temperature (Tinj) in each case are listed in Table 2.

2.4. Boundary and Initial Conditions

As stated above, because we have neglected the slight conductive heat exchange between the permeable reservoir and the impermeable cap rock or base rock, the boundaries at top and bottom of the reservoir in Figure 3 are no-flow for mass and heat. Because of symmetry, the left and right boundaries in Figure 3 are also no-flow for mass and heat. The initial reservoir pressure is P = 0.0089 z 0.4444 ( MPa ) , and the initial reservoir temperature is 248 °C. Because the bottomhole pressure at the production well is 5.00 MPa, far higher than saturated vapor pressure of 3.84 MPa corresponding to 248 °C, the water in the reservoir and wells is all maintained as liquid.

3. Results and Discussion

The production temperature Tpro, electric power We, injection pressure Pinj, reservoir impedance IR, pump power Wp and energy efficiency η of the system in the 20th year are all calculated and listed in Table 4, where the computational formulae of We, IR, Wp and η are stated as the following Equations (1)–(4).

3.1. Production Temperature

Table 5 shows mean effects of different levels of geologic conditions on the production temperature at t = 20 years and ranges of the five conditions, and Figure 4 shows ranking of the five conditions of the influential effects on the production temperature. The importance of the conditions can be determined by the range value, that is, condition with large range being the more influential one. Table 5 and Figure 4 show that for the production temperature, the order of significance levels of the geological conditions is as follows: q > φ > λ > k > Tinj. Sensitivity analysis from previous studies of Zeng et al. [19] show that the production temperature declines with the increasing of q, and q is the most important condition affecting the production temperature. This is in good agreement with the results of the orthogonal experiment analysis in this study. The production temperature obviously affects the electric power, although lower q can obtain higher production temperature and higher electricity generation efficiency, according to Equation (1) in the following part, lower q will obviously decrease the electric power. So the determination of q must be based on comprehensive consideration of the production temperature and electric power.

3.2. Electric Power

The electric power We is calculated as Equation (1), where the bottomhole production specific enthalpy h pro is calculated with h pro = h ( T pro , P pro ) , and the injection specific enthalpy h inj is listed in Table 2. The Yangbajing geothermal power plant comprises single-flash power plant and double-flash power plant, which are all open loop systems. The heat rejection temperature of the Yangbajing geothermal power plant is T0 = 9 °C = 282.15 K [6,7,8,9,19], and 0.45 is the utilization efficiency of maximum available work transferred to electric power [6].
W e = 0.45 Q ( h pro h inj ) ( 1 T o T pro ) = 45 q ( h pro h inj ) ( 1 T o T pro )
Table 6 shows mean effects of different levels of geologic conditions on the electric power at t = 20 years and ranges of the five conditions, and Figure 5 shows ranking of the five conditions of the influential effects on the electric power. Table 6 and Figure 5 show that, for the electric power, the order of significance levels of the geological conditions is as follows: q > Tinj > φ > λ > k. It can be found that the most important conditions affecting the electric power are the q and the Tinj, and this is in very good agreement with previous sensitivity analysis from Zeng et al. [19]. Based on Equation (1), the electric power is directly proportional to q. Appropriate q will increase the production temperature and generation efficiency and thus improve the electric power. Overall, the determination of q must be based on comprehensive consideration of the production temperature and the electric power.

3.3. Injection Pressure

Table 7 shows the mean effects of different levels of geologic conditions on the injection pressure at t = 20 years and ranges of the five conditions, and Figure 6 shows the ranking of the five conditions of the influential effects on the injection pressure. Table 7 and Figure 6 show that, for the injection pressure, the order of significance levels of the geological conditions is as follows: k > q > Tinj > φ > λ. This proves that higher permeability or more appropriate water production rate or more appropriate injection temperature can effectively reduce the injection pressure and greatly increase the safety. This is in good agreement with previous sensitivity analysis from Zeng et al. [19].

3.4. Reservoir Impedance

The reservoir impedance I R is calculated as Equation (2) [4,5,6,7,8,9,19]:
I R = ( P inj P pro ) / q 0
I R represents the power consumption of the unit production rate for penetrating the fractured reservoir, P pro = P0 = 5.00 MPa the bottomhole production pressure, and q0 = 50q is the water production rate between the injection well and the production well. Table 8 shows the mean effects of different levels of geologic conditions on the reservoir impedance at t = 20 years and ranges of the five conditions, and Figure 7 shows ranking of the five conditions of the influential effects on the reservoir impedance. Table 8 and Figure 7 show that for the reservoir impedance, the order of significance levels of the geological conditions is as follows: k > Tinj > q > φ > λ. Zeng et al. pointed out the most important factors affecting the reservoir impedance are the k, the Tinj and q, and this is in good agreement with results of this orthogonal test study [19]. Reducing the reservoir impedance is one of the biggest challenges for developing commercial EGS reservoirs, and Zeng et al. pointed out in previous studies that only when the k is within (10~100) mD, the reservoir impedance can be lower than 0.10 MPa/(kg/s) [6]. It can be found that the main measures to reduce the reservoir impedance are to increase k or to increase Tinj or to decrease the q, and this points out directions for reducing the reservoir impedance in engineering practices.

3.5. Pump Power

The internal energy consumption W p is mainly caused by the injection pump and the production pump [4,5,6,7,8,9,19]. If the energy loss due to duct friction and water internal fraction is neglected [4], the pump efficiency η p is 80%, then the internal energy consumption W p can be calculated as Equation (3) [4,5,6,7,8,9,19]:
W p = 100 q ( P inj P pro ) 100 q ρ g ( h 1 h 2 ) ρ η p
where h 1 is the depth of the injection well and h 2 is the depth of the production well. In this work, h 1 = 1325.0 m, h 2 = 975.0 m and h 1 h 2 = 350.0 m. The water density ρ changes versus temperature and pressure, and this will obviously influence the calculation of W p [4]. In this study, the average value of the maximum density and the minimum density is adopted for calculations in Equations (3) and (4), and this treat method has been proved to be effective in previous studies [4,5,6,7,8,9,19]. The maximum density is 998.0 kg/m3, the minimum density is 804.0 kg/m3, thus the average value of ρ = 901.0 kg/m3 is adopted for calculations in Equations(3) and (4). Table 9 shows mean effects of different levels of geologic conditions on the pump power at t = 20 years and ranges of the five conditions, and Figure 8 shows ranking of the five conditions of the influential effects on the pump power. Table 9 and Figure 8 show that for the pump power, the order of significance levels of the geological conditions is as follows: q > k > Tinj > φ > λ. This is in good agreement with sensitivity analysis results from Zeng et al. [19]. It can be found that main measures to decrease the pump power are to appropriately reduce the q, to increase the k or to increase the Tinj.

3.6. Energy Efficiency

The energy efficiency η of the system is defined as the ratio of the total produced electric energy to the internal energy consumption, and can be calculated as Equation (4) based on [4]:
η = W e W p = 0.45 ρ η p ( h pro h inj ) ( 1 T o / T pro ) ( P inj P pro ) ρ g ( h 1 h 2 )
As stated above, the average value of the water density of ρ = 901.0 kg/m3 is adopted in calculation of Equation (4). Table 10 shows the mean effects of different levels of geologic conditions on the energy efficiency at t = 20 years and ranges of the five conditions, and Figure 9 shows the ranking of the five conditions of the influential effects on the energy efficiency. Table 10 and Figure 9 show that, for the energy efficiency, the order of significance levels of the geological conditions is as follows: q > k > φ > Tinj > λ. It can be found that the most important conditions affecting the energy efficiency are the q and the k; in a certain range lower q or higher k will obviously increase the energy efficiency, and this is in good agreement with results of sensitivity analysis from Zeng et al. [19].

3.7. Application to Site Selection and System Design

In this study, we systematically researched the influence of the φ, the k, the λ, the q and the Tinj on the system production performance of Tpro, We, Pinj, IR, Wp and η. Through analysis and comparison with reference [4,5,6,7,8,9,19], the results demonstrate that: (1) the order of relative importance of the five conditions on Tpro is q > φ > λ > k > Tinj; within a certain range, lower q, higher φ or lower λ will increase the Tpro. (2) The order of relative importance of the five conditions on We is q > Tinj > φ > λ > k; within a certain range, higher q, lower Tinj or higher φ will greatly increase the We. (3) The order of relative importance of the five conditions on Pinj is k > q > Tinj > φ > λ; within a certain range, higher k, lower q or higher Tinj will decrease the Pinj. (4) The order of relative importance of the five conditions on IR is k > Tinj > q > φ > λ; within a certain range, higher k, higher Tinj or lower q will decrease the IR. (5) The order of relative importance of the five conditions on Wp is q > k > Tinj > φ > λ; within a certain range, lower q, higher k or higher Tinj will decrease the Wp. (6) The order of relative importance of the five conditions on η is q > k > φ > Tinj > λ; within a certain range, lower q, higher k or higher φ will increase the η. In practical engineering, the most important and controllable conditions are the k, the q and the Tinj; the determination of the k, the q and the Tinj should be based on the comprehensive objectives of the performance. An EGS reservoir with higher φ will have higher Tpro, higher We and higher η, but the influence on the Pinj, the IR and the Wp is very slight. An EGS reservoir with higher λ will have higher Tpro and We, but the influence on the Pinj, the IR, the Wp and the η is very slight. Overall, the construction of an EGS reservoir should be selected at geological formations with higher φ or higher λ, and the determination of the k, the q and the Tinj should be according to the comprehensive production objectives.

3.8. Limitation of This Research

As stated above, two aspects must be considered in numerical simulation of EGS reservoirs: fracture representation and hydrologic-thermal-mechanical-chemical processes simplification [28,29]. In the aspect of fracture representation, in this study we employed the EPM method and this method is reasonable only when the fracture spacing is lower than 2~3 m. For fracture spacing larger than 2~3 m, the MINC method or the MINC method should be employed. Thus, for the 950~1350 fractured granite reservoir at the Yangbajing geothermal field, we need to test and analyze the distribution characteristics of the facture spacing, aperture and orientation and to establish a more realistic EGS reservoir model. In the aspect of hydrologic-thermal-mechanical-chemical processes simplification, we only considered the coupling of hydrologic-thermal effects, the rock mechanical deformation and the chemical reaction between the hot fractured rock and the circulating water are simultaneously neglected, so in the future the mechanical and chemical effects must be considered in the numerical models. Moreover, the actual water losses in the reservoir are neglected, and in the future the two-dimensional or the three-dimensional water losses effects must be considered to establish a more realistic EGS reservoir model [17].

4. Conclusions

In this work, we systematically studied the five conditions affecting the electricity generation performance of EGS with the orthogonal test method at the Yangbajing geothermal field. Based on the simulation results, the following conclusions can be drawn:
(1)
The order of relative importance of the five conditions on Tpro is q > φ > λ > k > Tinj.
(2)
The order of relative importance of the five conditions on We is q > Tinj > φ > λ > k.
(3)
The order of relative importance of the five conditions on Pinj is k > q > Tinj > φ > λ.
(4)
The order of relative importance of the five conditions on IR is k > Tinj > q > φ > λ.
(5)
The order of relative importance of the five conditions on Wp is q > k > Tinj > φ > λ.
(6)
The order of relative importance of the five conditions on η is q > k > φ > Tinj > λ.
(7)
The construction of an EGS reservoir should be selected at geological formations with higher φ or higher λ, and the determination of the k, the q and the Tinj should be done according to the comprehensive production objectives.

Acknowledgments

The authors gratefully appreciate the financial supports from the Joint Foundation of NFSC and Guangdong Province (Grant U1401232); the Natural Science Foundation of Guangdong Province (Grant 2014A030308001); the Natural Science Foundation of China (Grants 41504067, 41572277).

Author Contributions

The authors have contributed equally to the research and writing of this manuscript.

Conflicts of Interest

The authors declare no conflict of interest.

Nomenclature

ggravity, 9.80 m/s2
hwell depth, m
h1depth of injection well, m
h2depth of production well, m
hinjinjection specific enthalpy, kJ/kg
h pro production specific enthalpy, kJ/kg
IRreservoir impedance, MPa/(kg/s)
kreservoir permeability, m2
kffracture permeability, m2
kmmatrix permeability, m2
kxintrinsic permeability along x, m2
kyintrinsic permeability along y, m2
kzintrinsic permeability along z, m2
Llatin square
Ppressure, MPa
Pmaxcritical pressure, MPa
P inj injection pressure, MPa
P pro production pressure, MPa
P0bottomhole production pressure, MPa
qwater production rate, kg/s
Qtotal water production rate, kg/s
Ttemperature, °C
T0mean heat rejection temperature, 282.15 K
T pro production temperature, °C
W p electric power of pump, MW
Weelectric power, MW
x, y, zcartesian coordinates, m
ϕ reservoir porosity
ηenergy efficiency
η p pump efficiency, 80%
ρwater density, kg/m3

References

  1. Tester, J.W.; Livesay, B.; Anderson, B.J.; Moore, M.C.; Batchelor, A.S.; Nichols, K.; Blackwell, D.D.; Petty, S.; Dipoppo, R.; Toksoz, M.N.; et al. The Future of Geothermal Energy: Impact of Enhanced Geothermal Systems (EGS) on the United States in the 21st Century. An Assessment by an MIT-Led Interdisciplinary Panel; MIT: Cambridge, MA, USA, 2006. [Google Scholar]
  2. Xu, S.G.; Guo, Y.S. Geothermal Energy Foundation; Science Press: Beijing, China, 2009. (In Chinese) [Google Scholar]
  3. Wang, J.; Hu, S.; Pang, Z.; He, L.; Zhao, P.; Zhu, C.; Rao, S.; Tang, X.; Kong, Y.; Luo, L.; et al. Estimate of geothermal resources potential for hot dry rock in the continental area of China. Sci. Technol. Rev. 2012, 30, 25–31. (In Chinese) [Google Scholar]
  4. Zeng, Y.; Su, Z.; Wu, N. Numerical simulation of heat production potential from hot dry rock by water circulating through two horizontal wells at Desert Peak geothermal field. Energy 2013, 56, 92–107. [Google Scholar] [CrossRef]
  5. Zeng, Y.; Wu, N.; Su, Z. Numerical simulation of heat production potential from hot dry rock by water circulating through a novel single vertical fracture at Desert Peak geothermal field. Energy 2013, 63, 268–282. [Google Scholar] [CrossRef]
  6. Zeng, Y.; Wu, N.; Su, Z. Numerical simulation of electricity generation potential from fractured granite reservoir through a single horizontal well at Yangbajing geothermal field. Energy 2014, 65, 472–487. [Google Scholar] [CrossRef]
  7. Zeng, Y.C.; Zhan, J.M.; Wu, N.Y.; Luo, Y.Y.; Cai, W.H. Numerical simulation of electricity generation potential from fractured granite reservoir through vertical wells at Yangbajing geothermal field. Energy 2016, 103, 290–304. [Google Scholar] [CrossRef]
  8. Zeng, Y.; Zhan, J.; Wu, N. Numerical investigation of electricity generation potential from fractured granite reservoir by water circulating through three horizontal wells at Yangbajing geothermal field. Appl. Therm. Eng. 2016, 104, 1–15. [Google Scholar] [CrossRef]
  9. Zeng, Y.; Zhan, J.; Wu, N. Numerical investigation of electricity generation potential from fractured granite reservoir through a single vertical well at Yangbajing geothermal field. Energy 2016, 114, 24–39. [Google Scholar] [CrossRef]
  10. Jiang, F.M.; Luo, L.; Chen, J.L. A novel three-dimensional transient model for subsurface heat exchange in enhanced geothermal systems. Int. Commun. Heat Mass Transf. 2013, 41, 57–62. [Google Scholar] [CrossRef]
  11. Jiang, F.M.; Chen, J.L.; Huang, W.B.; Luo, L. A three-dimensional transient model for EGS subsurface thermo-hydraulic process. Energy 2014, 72, 300–310. [Google Scholar] [CrossRef]
  12. Huang, X.X.; Zhu, J.L.; Niu, C.G.; Li, J.; Hu, X.; Jin, X. Heat extraction and power production forecast of a prospective Enhanced Geothermal System site in Songliao Basin, China. Energy 2014, 75, 360–370. [Google Scholar] [CrossRef]
  13. Zhang, Y.J.; Li, Z.W.; Guo, L.L.; Gao, P.; Jin, X.P.; Xu, T.F. Electricity generation from enhanced geothermal systems by oilfield produced water circulating through reservoir stimulated by staged fracturing technology for horizontal wells: A case study in Xujiaweizi area in Daqing Oilfield, China. Energy 2014, 78, 788–805. [Google Scholar] [CrossRef]
  14. Cao, W.J.; Huang, W.B.; Jiang, F.M. Numerical study on variable thermophysical properties of heat transfer fluid affecting EGS heat extraction. Int. J. Heat Mass Transf. 2016, 92, 1205–1217. [Google Scholar] [CrossRef]
  15. Chen, J.L.; Jiang, F.M. Designing multi-well layout for enhanced geothermal system to better exploit hot dry rock geothermal energy. Renew. Energy 2015, 74, 37–48. [Google Scholar] [CrossRef]
  16. Chen, J.L.; Jiang, F.M. A numerical study of EGS heat extraction process based on a thermal non-equilibrium model for heat transfer in subsurface porous heat reservoir. Heat Mass Transf. 2016, 52, 255–267. [Google Scholar] [CrossRef]
  17. Cheng, W.L.; Wang, C.L.; Nian, Y.L.; Han, B.B.; Liu, J. Analysis of influencing factors of heat extraction from enhanced geothermal systems considering water losses. Energy 2016, 115, 274–288. [Google Scholar] [CrossRef]
  18. Hu, L.T.; Winterfeld, P.H.; Fakcharoenphol, P.; Wu, Y.S. A novel fully-coupled flow and geomechanics model in enhanced geothermal reservoirs. J. Pet. Sci. Eng. 2013, 107, 1–11. [Google Scholar] [CrossRef]
  19. Zeng, Y.C.; Tang, L.S.; Wu, N.Y.; Cao, Y.F. Analysis of influencing factors of production performance of enhanced geothermal system: A case study at Yangbajing geothermal field. Energy 2017, 127, 218–235. [Google Scholar] [CrossRef]
  20. Jiang, G.Z.; Wang, Y.; Shi, Y.Z.; Zhang, C.; Tang, X.Y.; Hu, S.B. Estimate of hot dry rock geothermal resource in Daqing Oilfield, Northeast China. Energies 2016, 9, 731. [Google Scholar] [CrossRef]
  21. Li, M.Y.; Lior, N. Comparative analysis of power plant options for enhanced geothermal systems. Energies 2014, 7, 8427–8445. [Google Scholar] [CrossRef]
  22. Sanyal, S.K.; Butler, S.J. An analysis of power generation prospects from enhanced geothermal systems. In Proceedings of the World Geothermal Congress 2005, Antalya, Turkey, 24–29 April 2005; pp. 1–6. [Google Scholar]
  23. Huang, L.; Su, Z.; Wu, N.Y.; Cheng, J.W. Analysis on geologic conditions affecting the performance of gas production from hydrate deposits. Mar. Pet. Geol. 2016, 77, 19–29. [Google Scholar] [CrossRef]
  24. Fan, X. Conceptual Model and Assessment of the Yangbajing Geothermal Field, Tibet, China; Geothermal Training Programme, Orkusrofnun, Grensásvegur 9, IS-108 Reykjavík, Iceland. Number 5; United Nations University, Geothermal Training Programme: Reykjavík, Iceland, 2002. [Google Scholar]
  25. Dor, J.; Zhao, P. Characteristics and genesis of the Yangbajing geothermal field, Tibet. In Proceedings of the World Geothermal Congress 2000, Kyushu-Tohoku, Japan, 28 May–10 June 2000; pp. 1083–1088. [Google Scholar]
  26. Fisher, A. A mathematic examination of the methods of determining the accuracy of an observation by the mean error and by the mean square error. Mon. Not. R. Astron. Soc. 1920, 80, 758–770. [Google Scholar] [CrossRef]
  27. Huang, X.X.; Zhu, J.L.; Li, J.; Lan, C.Y.; Jin, X.P. Parametric study of an enhanced geothermal system based on thermo-hydro-mechanical modeling of a prospective site in Songliao Basin. Appl. Therm. Eng. 2016, 105, 1–7. [Google Scholar] [CrossRef]
  28. Hayashi, K.; Willis-Richards, J.; Hopkirk, R.J.; Niibori, Y. Numerical models of HDR geothermal reservoirs—A review of current thinking and progress. Geothermics 1999, 28, 507–518. [Google Scholar] [CrossRef]
  29. Sanyal, S.K.; Butler, S.J.; Swenson, D.; Hardeman, B. Review of the state-of-the-art of numerical simulation of enhanced geothermal system. In Proceedings of the World Geothermal Congress, Kyushu-Tohoku, Japan, 28 May–10 June 2000. [Google Scholar]
Figure 1. Temperature and pressure logs from well ZK4001 [25] (1 kgf/cm2 = 0.1 MPa).
Energies 10 02015 g001
Figure 2. Well arrangement of the 950~1350 m fractured granite reservoir.
Energies 10 02015 g002
Figure 3. A schematic of (a) the fractured reservoir at well ZK4001 and (b) the corresponding grid.
Energies 10 02015 g003
Figure 4. Ranking of the five conditions of the influential effects on the production temperature.
Energies 10 02015 g004
Figure 5. Ranking of the five conditions of the influential effects on the electric power.
Energies 10 02015 g005
Figure 6. Ranking of the five conditions of the influential effects on the injection pressure.
Energies 10 02015 g006
Figure 7. Ranking of the five conditions of the influential effects on the reservoir impedance.
Energies 10 02015 g007
Figure 8. Ranking of the five conditions of the influential effects on the pump power.
Energies 10 02015 g008
Figure 9. Ranking of the five conditions of the influential effects on the energy efficiency.
Energies 10 02015 g009
Table 1. Orthogonal problem with five influential geological factors and their levels. Reservoir porosity (φ); reservoir permeability (k); rock heat conductivity (λ); water production rate (q); injection temperature (Tinj).
Factors
φkλqTinj
Levels5%50 mD1.0 W/(m·K)1.50 kg/s40 °C
10%60 mD2.0 W/(m·K)1.75 kg/s60 °C
20%80 mD3.0 W/(m·K)2.00 kg/s70 °C
30%100 mD4.0 W/(m·K)2.25 kg/s80 °C
Table 2. Sixteen representative combinations of the geological conditions.
CaseFactors
φ (%)k (mD)λ (W/(m·K))q (kg/s)Tinj (°C)/hinj (kJ/kg)
15501.01.5040 (177.56)
25602.01.7560 (260.66)
35803.02.0070 (302.27)
451004.02.2580 (343.95
510502.02.0080 (343.95)
610601.02.2570 (302.27)
710804.01.5060 (260.66)
8101003.01.7540 (177.56)
920503.02.2560 (260.66)
1020604.02.0040 (177.56)
1120801.01.7580 (343.95)
12201002.01.5070 (302.27)
1330504.01.7570 (302.27)
1430603.01.5080 (343.95)
1530802.02.2540 (177.56)
16301001.02.0060 (260.66)
Table 3. The 950~1350 m reservoir properties and conditions at well ZK4001 [24,25].
ParameterValue
Rock thermal conductivity (Case1)1.00 W/(m·K)
Rock specific heat1000 J/(kg·K)
Rock density2650 kg/m3
Reservoir height400 m
Reservoir length (simulated domain)500 m
Reservoir width (simulated domain)10 m
Rock matrix porosity (Case1)5%
Rock matrix permeability (Case1)50 × 10−15 m2
Water production rate (simulated domain) q(Case1)1.5 kg/s
Bottomhole production pressure P05.00 MPa
Productivity index PI5.0 × 10−12 m3
Injection specific enthalpy h inj (Case1)177.56 kJ/kg (about 40 °C)
Initial temperature248 °C
Initial pressure P = 0.0089 z 0.4444 ( MPa )
Table 4. The electricity generation performance of the 16 geological models at t = 20 year. Production temperature (Tpro); electric power (We); injection pressure (Pinj); reservoir impedance (IR); pump power (Wp), and; energy efficiency (η).
CasePerformance Objectives
Tpro (°C)We (MW)Pinj (MPa)IR (MPa/(kg/s))Wp (MW)η
1217.6521.7013.310.1111.08619.97
2187.4016.3812.270.0831.01516.15
3155.1710.9011.620.0660.97911.13
4130.376.3111.220.0550.9776.46
5167.6911.9112.950.0801.3488.83
6131.187.7213.560.0761.7074.52
7216.8919.1710.660.0750.53535.85
8188.8319.2111.380.0730.79924.05
9144.0811.4414.960.0892.1445.33
10169.1817.6114.320.0931.72910.19
11206.1317.4110.620.0640.61428.34
12225.4319.559.930.0660.38351.07
13209.2819.4012.290.0831.02019.02
14229.4119.0710.740.0770.55134.58
15152.1615.9113.590.0761.7179.27
16188.0618.8711.030.0600.81623.14
Table 5. Mean effects of different levels of conditions on the production temperature at t = 20 years.
ItemφkλqTinj
L1172.65184.68185.76222.35181.96
L2176.15179.29183.17197.91184.11
L3186.21182.59179.37170.03180.27
L4194.73183.17181.43139.45183.40
Range22.085.396.3982.903.84
Table 6. Mean effects of different levels of conditions on the electric power at t = 20 years.
ItemφkλqTinj
L113.8216.1116.4319.8718.61
L214.5015.2015.9418.1016.47
L316.5015.8515.1614.8214.39
L418.3115.9915.6210.3513.68
Range4.490.911.279.524.93
Table 7. Mean effects of different levels of conditions on the injection pressure at t = 20 years.
ItemφkλqTinj
L112.1113.3812.1311.1613.15
L212.1412.7212.1911.6412.23
L312.4611.6212.1812.4811.85
L411.9110.8912.1213.3311.38
Range0.552.490.072.171.77
Table 8. Mean effects of different levels of conditions on the reservoir impedance at t = 20 years.
ItemφkλqTinj
L10.0790.0910.0780.0820.088
L20.0760.0820.0760.0760.077
L30.0780.0700.0760.0750.073
L40.0740.0640.0770.0740.069
Range0.0050.0270.0020.0080.019
Table 9. Mean effects of different levels of conditions on the pump power at t = 20 years.
ItemφkλqTinj
L11.0141.3401.0560.6391.333
L21.0971.2511.1160.8621.128
L31.2170.9611.1181.2181.022
L41.0260.7441.0651.6360.873
Range0.2030.5960.0620.9970.460
Table 10. Mean effects of different levels of conditions on the energy efficiency at t = 20 years.
ItemφkλqTinj
L113.4313.2918.9935.3715.87
L218.3116.3621.3321.8920.12
L323.7321.1518.7713.3221.44
L421.5026.1817.886.4019.55
Range10.3012.893.4528.975.57

