The Tripartite Game Model for Electricity Pricing in Consideration of the Power Quality


1
National Rail Transit Electrification and Automation Engineering Technology Research Center, School of Electrical Engineering, Southwest Jiaotong University, Chengdu 610031, China
2
State Key Laboratory of Security Control and Simulation of Power Systems and Large Scale Generation Equipment, Department of Electrical Engineering, Tsinghua University, Beijing 100084, China
*
Author to whom correspondence should be addressed.
Energies 2017, 10(12), 2025; https://doi.org/10.3390/en10122025
Submission received: 23 September 2017
/
Revised: 9 November 2017
/
Accepted: 29 November 2017
/
Published: 1 December 2017
(This article belongs to the Special Issue Energy Market Transitions)
Abstract
:Under the Energy Internet concept the distribution and management of resources in the electricity market have been gradually transiting from a centralized pattern to a decentralized pattern. Correspondingly, the methodological model for the analysis of economic behaviors needs to be upgraded too. Based on the idea of non-cooperative game theory, this paper puts forward a tripartite game model for electricity pricing in consideration of the power quality, which is applicable to the electricity market under the Energy Internet with distributed generation, including the State Grid Corporation of China (SGCC), generating companies (GENCOs) and the marketers which correspond to the regional power-retailing companies. Then, the sequential quadratic programming based on the quasi-Newton method is given to solve the game model. Finally, four sets of tests with different game factors are carried out to verify the validity and feasibility of the proposed model and algorithm. The SGCC price, the cost and the number of GENCOs and the cross-regional environment are considered in each test, respectively. The results show that this model can adapt well to the various conditions.
1. Introduction
Nowadays, environmental issues such as global fossil energy depletion and the contradiction between energy supply and demand are worsening day by day. In order to address energy challenges and to improve the drawbacks of traditional power grid, Rifkin put forward the concept of Energy Internet based on the combination of smart grid on the Internet and the new energy, which has been leading an industrial change all over the world. As an essential part of Energy Internet, the electricity market has become a research hotspot.
With the emergence of a large number of distributed generation and energy storage entities, controllable loads, electric vehicles and many other new objects, the electricity market under the Energy Internet will become more open, more complex, and more competitive. In view of the complexity of the economic behaviors in the electricity market, it is necessary to carry on the research of advanced methods, such as the game theory which is derived from economics. The game theory deals with the problems when several players implement strategies according to their own conditions and the information they have in a certain constraint. It has been widely applied to politics, economics, management, bioengineering, etc., and it has been used by lots of studies on the electricity market as well. To name a few, the supply function model or Cournot model on the competition of the generation entities are given respectively in [1,2,3]. The bidding strategies of three traditional generation companies with different levels of power system demand in a single auction market are analyzed in [4]. The Nash equilibrium of the market is studied in [5] using the incomplete information non-cooperative game theory, to help game players determine their optimal pricing strategies. In [6], an abstract market model is proposed for demand response, where a supply function bidding is applied to match power supply deficit or surplus. A Nash bargaining demand side management scheme optimizes the demand loads to achieve a balanced interest distribution in [7]. A proposed distributed demand-side management strategy using game theoretic approaches [8] is developed to reduce the peak. In terms of the transmission and distribution of power, the cooperative game theory is used in [9] to address the transmission network planning. Meanwhile, game theory is also used in [10] to develop a fair distribution model for the transport cost among all users, with the purpose to maintain the short- and long-term operation of the system and the investment needed to strengthen the power grid in the future. Based on the Nash equilibrium theory and the supply function theory, a dynamic supply function model considering both the inherent characteristics of the transmission network and the transmission network constraints is proposed in [11].
For the time being, there are two main problems in the utilization of the game theory for the bidding strategy. The first one is related to incomplete and imperfect information. In this aspect, the equilibrium problem for the oligopoly electricity market, network constraint and power generation constraint are presented respectively in [12,13,14]. The other one is related to the problem of n-person game, in contrast to the two-person game. The theory and algorithm of the n-person game is not well developed yet. Particularly, the calculation for an n-person game is much more complex than that for a two-person game. In this paper, an n-person game model including the state grid corporation of China (SGCC), generating companies (GENCOs) and marketers (MKTs) is constructed.
As a feature of the transaction product between the power suppliers and users, power quality is a cost factor must be considered on both sides to determine the pattern of the electricity market in the future. However, it is quite difficult to negotiate a unified pricing mechanism due to the complexity in generation conditions and the difference in the quality of distributed generation. Thus, it is imperative to develop an appropriate pricing mechanism in accordance with the power quality.
In the future electricity market without the monopoly of the State Grid Corporation of China, many entities of various economic forms, for instance, distributed power suppliers and independent power agents will appear and participate in electricity trading. The electricity market will be more active and more diversified. Based on the analysis above and the background of the electricity market in China, a tripartite game model taking SGCC, GENCOs and the MKTs as players is established in this paper, which is in consideration of the power quality. When SGCC and GENCOs set their pricing strategies, and MKTs bid their power demand on the previous day, the model can be applied to the day ahead market. In the purpose of solving the game model for electricity market, the sequential quadratic programming based on the quasi-Newton method is given. Then, four sets of examples are tested in this paper to test the validity and feasibility of the established model and the proposed algorithm. Each example addresses different conditions, such as the price of SGCC, the cost and the number of GENCOs. Meanwhile, the last example is set to be in a cross-regional environment.
This paper is organized as follows: the existing research achievements on power quality assessment are summarized in Section 2. The tripartite game model for the electricity market involving SGCC, GENCOs and the MKTs is proposed in Section 3. The SQP based on the quasi-Newton method is elaborated in Section 4, which is used to solve the Nash equilibrium of the game. At last, the validity and reliability of the model and algorithm are tested with examples in Section 5.
2. The Achievements of Power Quality Assessment
In the future power grid, distributed generation will grow rapidly in the market, but due to natural conditions, operation modes, generation modes, power electronic devices and many other factors, this will occur in the face of serious power quality problems when it must connect to the power grid [15]. These problems may lead to adverse consequences, such as the impact on the operation safety, the reduction of energy efficiency, and the damage of equipment. Meanwhile, the power quality related problem is one of the most important technical barriers to market access in most cases of distributed power supply. Obviously, it cannot be guaranteed that the power generated by different power generators or the power generated at the same time is of the same quality, the power would not be disturbed in the process of transmission and distribution, and customers can directly obtain the power with the quality they required. In [16,17,18,19,20], it has been put forward that different customers require different power quality, and the power on different quality level matches various price. Consequently, it is necessary to develop an effective and reasonable evaluation method for power quality, which is of great significance to the construction of a fair trading environment. Meanwhile, the power suppliers will also be encouraged to improve their management efficiency and power quality. The power quality issues are drawing increasingly more attention nowadays, especially in power pricing.
Currently, a large number of articles have reported comprehensive evaluations on power quality, where the multi-index evaluation model is often used owing to the complexity of this subject. Generally, voltage deviation, voltage fluctuations and flicker, frequency deviation, harmonics and three-phase imbalance are the most commonly used indices for power quality [21]. In [22,23,24], the instantaneous power is redefined, and multiple indices are constructed to evaluate the power quality. In normal circumstances, each index is assigned a weight. A detailed analysis on the weight assignment and quality index grading is presented in [25]. In fact, weight assignment will directly affect the scientificity, rationality and reliability of the comprehensive evaluation results and it therefore plays a vital role in the reliable and accurate assessment. For the time being, the methods of weight determination can be classified into two categories. The first one, which is relatively subjective, is to assign weight by the decision maker, such as the analytic hierarchy process (AHP) in [26]. The other one, which is relatively objective, is to assign weight according to the raw data, such as the entropy method in [27]. Besides, many combinations of subjective and objective methods are proposed as well. The combination of AHP and the entropy method is used in [28] to develop a comprehensive evaluation of the impact of distributed PV on the distribution network. In [29], a combination method is proposed to sort the power quality levels at every evaluation point by integrating the objective and subjective weights obtained from the maximizing deviations and the fuzzy method. In [30], the compatibility matrix method and the entropy weight method are used to calculate the weights of power quality indices in order to reduce the subjectivity of the evaluation.
The current methods of comprehensive evaluation for power quality include the data envelopment analysis, the Monte Carlo-based power quality assessment method, the Technique for Order Preference by Similarity to an Ideal Solution (TOPSIS) approach, the fuzzy theory method, etc. For instance, a comprehensive evaluation method based on data envelopment analysis (DEA) is proposed in [31], which is used to construct an index system of distributed generation quality. The impact evaluation of network geometric model on power quality indices is propose in [32] using simulation techniques, which includes a short-circuit model into the sequential Monte Carlo algorithm in order to assess the power quality indices through estimates. Besides, the fuzzy theory is used in [33,34,35,36,37] to evaluate the power quality. In [33], a comprehensive evaluation model based on the blind number and the variable fuzzy set theory is proposed, in view of the dynamic variability and uncertainty in the comprehensive evaluation of power quality. In [34], a power quality evaluation method based on the maximum tree algorithm and the fuzzy clustering algorithm is proposed, and in [35], a synthetic evaluation method for power quality is put forward based on the fuzzy cluster analysis (FCA). In addition, the approach combining the compatibility matrix methodology and entropy weight method with connection degree modeling in Set Pair Analysis (SPA) theory is presented in [38] to obtain the index weights for power quality assessment. On the basis of the principal components of the projection method [39], projection values of boundary data and data to be evaluated are obtained, and these values are used to locate a grade range for power quality. The concept of waveform distance based on the energy space is proposed in [40], where the energy variation coefficient is defined to evaluate the voltage quality. In [41], a new comprehensive rating evaluation method for power quality based on the four electromagnetic compatibility (EMC) levels and the Cask principle is discussed. Moreover, the least squares support vector machine (LSSVM) theory [42], the wavelet packet decomposition and fuzzy logic [43] are also applied in practical cases for power quality assessment. In recent years, the evaluation methods with a higher level of intelligence or feasibility have been developed, such as the artificial neural networks. In [44], a new method for classifying various types of power quality disturbances based on artificial neural networks is presented, which is carried out in the sets of multiple neural networks using a learning vector quantization network.
The meaning of power quality assessment is that, power quality grading will be a motivation of that generators produce high-quality energy and power demanders use high-quality energy. For the high-quality power, it is unfair to price all levels of power at a uniform standard, because the production and management costs of power must be higher when the power quality is higher.
Current studies on power quality evaluation have been relatively mature. The work about the power quality assessment which combines AHP and entropy weight method is completed in our work. Concretely speaking, seven indicators of the power, involving voltage deviation, voltage fluctuations and flicker, frequency deviation, harmonics and three-phase imbalance, are calculated to obtain a set of data which is an index of the power quality and a basis for classifying the power quality into five levels, using the approach combined analytic hierarchy process and entropy weight method. However, the work will not be described in details here since it is not the main work of this paper. In order to model the tripartite game, the grading of power quality is regarded as the basis for pricing. To satisfy the demand of customers, MKTs will make a power quality improvement with the solution similar to the technology proposed in [16] before their distribution service.
3. The Description of the Game Model for Electricity Pricing
Based on the non-cooperative game principle, there is no agreement of mutual-restriction among the various game players, and therefore, all players need to make decisions rationally with the target of interest maximization. And the equilibrium point of the non-cooperative game can be achieved when each player thinks that he has made the optimal strategy. Therefore, a tripartite game model for the electricity market with distributed generation, which involves SGCC, GENCOs and the MKTs, is proposed here. The model in this paper can be briefly summarized as follows: SGCC and GENCOs are the power suppliers, providing power to the power demanders such as the marketers, and deciding their own pricing. As the game leader, SGCC sets its selling price based on the grading of power quality. Then GENCOs give their respective price considering their own conditions and referring to the price of SGCC, while MKTs choosing their power suppliers in accordance with all pricing strategies. That means, SGCC and GENCOs participate in the game following their respective pricing strategies, while MKTs participate in the game following their selection strategies. Finally, the payoffs of all players in the game when all MKTs’ have chosen their respective power suppliers, are calculated in order to solve the electricity model.
Concretely speaking, with no electricity production, when SGCC buys electricity from a cooperative power plant and sells the power to power demanders, it is equivalent to an agent of a large power plant without an independent sales organization. The generating company (GENCO) is an entity that is not affiliated with the SGCC, and could compete for selling energy to customers by submitting competitive bids to the electricity market; the marketer is an entity or a firm that buys and re-sells electric power but does not own generating facilities [45]. A diagram is given as Figure 1, for better illustration of this.
Power quality is the basis of the game strategy for all the players. That means each price strategy formulated by SGCC and GENCOs is a vector of price according to the classification of power quality; the elements in this vector are the unit prices corresponding to the various quality levels. The marketers will clarify the user demand on different quality levels, and then formulate their optimal selection strategies over all power suppliers accordingly. In this model, the power quality is classified into five levels, which are regarded as the basis for pricing; that is, each player’s cost, benefit and trading volume are calculated according to the power quality, the sets of SGCC and GENCOs’ power price are as well. Meanwhile, GENCOs can be classified as thermal electricity generation entities, hydroelectricity entities and renewable and alternate energy power generation entities according to the method of power generation. The unit price of the same quality level may vary for different generation methods. Obviously, the higher the power quality level, the higher the pricing and generation cost, since the higher level of power quality requires more sophisticated means of treatment and more security.
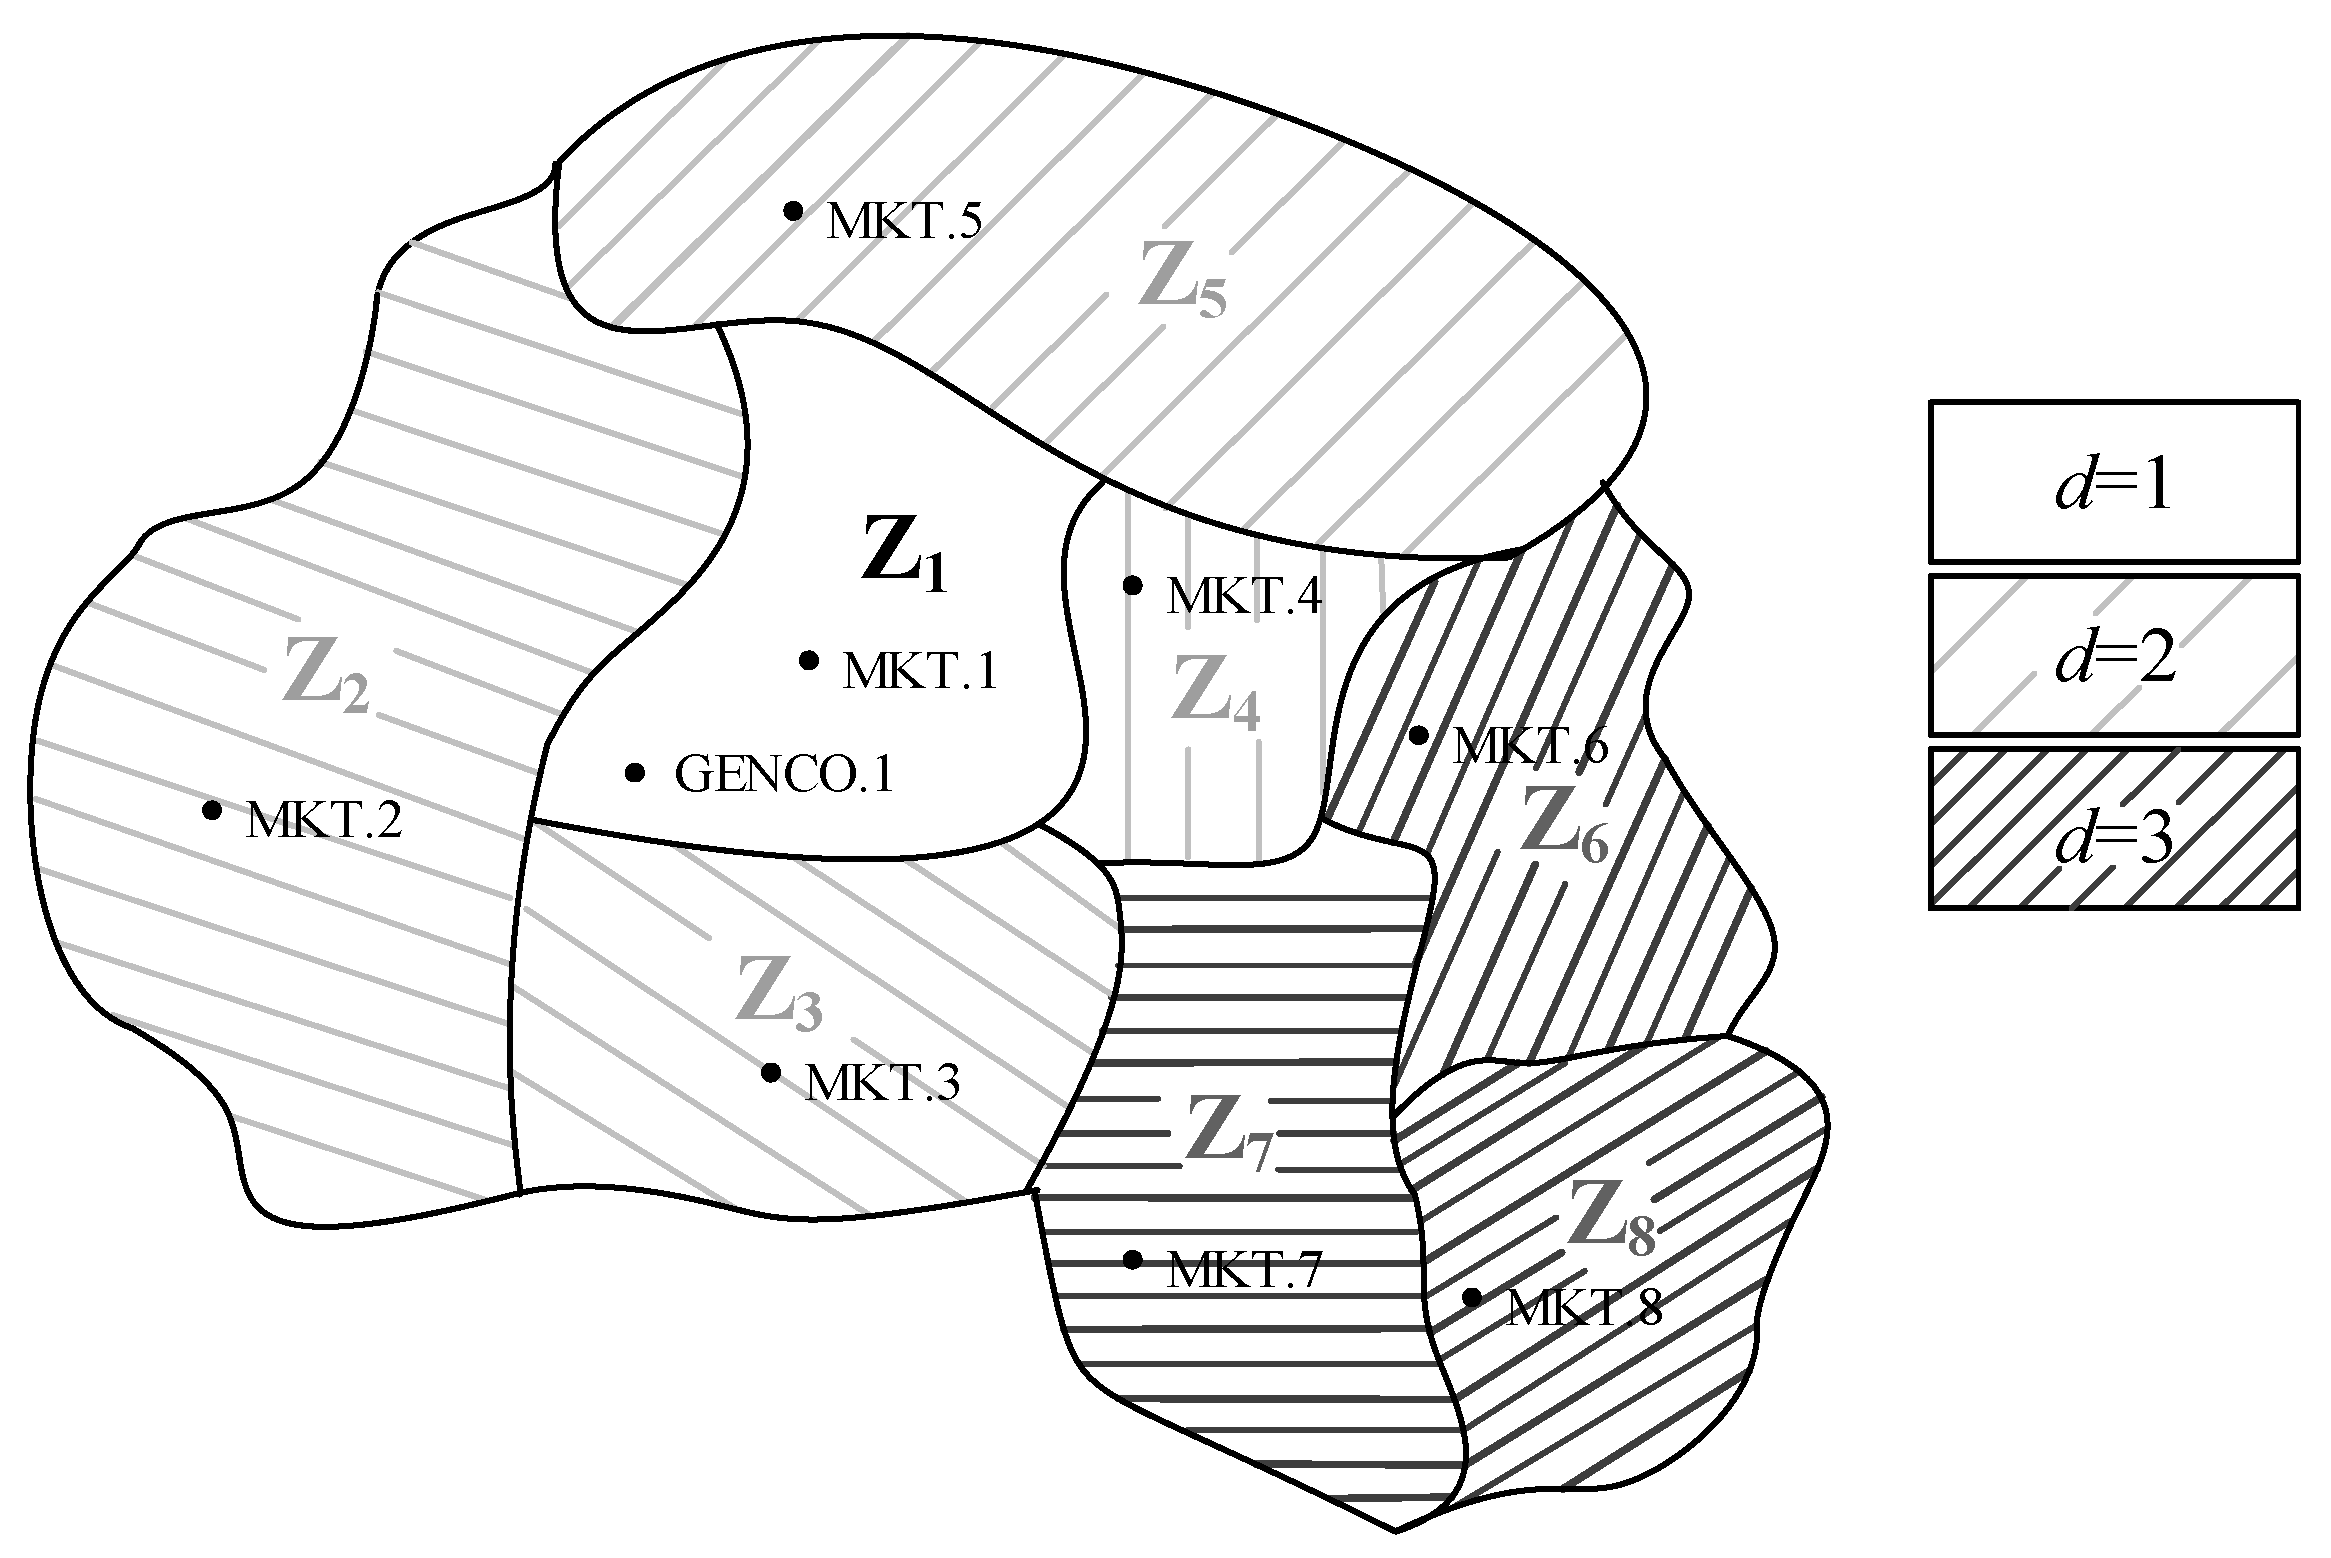
In addition, this paper assumes that GENCOs are distributed in various regions. Centering on a GENCO, the area covered by this supplier is classified into three zones in terms of the distance between it and the marketers in the various regions. The farther the area where a marketer is located away from the GENCO, the higher the cross-regional level between them. The cross-regional level is divided into three levels. This GENCO needs to pay SGCC for the uploading of electricity and the use of related equipment and resources. At the same time, the marketers also need to pay SGCC for the transmission of electricity based on the cross-regional level. The introduction of cross-regional level is as follows.
Assuming that the number of GENCOs is m, the set of GENCOs’ geographical locations can be noted as lm = (l1, l2, l3, …, lm). In general, the line loss and the transmission cost are higher because of a larger cross-regional span. The cross-regional spans correspond to cross-regional level respectively, which is defined as Figure 2.
To facilitate the expression and calculation, the cross-regional level between SGCC and all the marketers is set to 0, and the distances between GENCOs and the marketers are set to 1–3 accordingly. Then, the cross-regional levels of all marketers and GENCOs are grouped together to form a matrix named cross-regional matrix and expressed as D (n × m), while the matrix element dig representing the cross-regional level between marketer i (1 and GENCO g (1 . Taking Figure 2 as an example, the GENCO in Z1 can provide power to the MKT in Z1, and the MKTs in other areas as well. The cross-regional level between MKT.6 and GENCO.1 is 3, and the cross-regional matrix can be expressed as D = [1 2 2 2 2 3 3 3]T.
3.1. Construction of the Selection Vector
The marketer will choose one power supplier from SGCC or GENCOs based on the electricity price and geographical location. The selection vector involving all marketers for each power supplier is constructed as follows.
SGCC is numbered as Supplier 0, and GENCOs are numbered as Supplier 1 − m. Then, the correspondence between all the marketers and each power supplier can be represented as below:
The selection vector of the marketers over SGCC:
where, n is the number of the marketers; , i = 1, 2, …, n.
The selection vector of the marketers over GENCO g (g = 1, 2, 3, …, m):
where, .
Then, the selection matrix of the marketers over GENCOs (n × m) is:
The selection vector of the marketers over GENCO g (g = 1, 2, 3, …, m), with cross-regional level j (j = 1, 2, 3) is:
where, .
The construction of the selection vector can provide direct guidance in describing and calculating the cost, income and benefit of SGCC and GENCOs. It is the key connection between the marketers and the various power suppliers.
3.2. The Model of Marketer (SM)
In this study, it is assumed that the marketer model (SM) is formed by n marketers which each marketer can only choose one supplier. This marketer is in charge of buying electricity from the power supplier and selling it to the users. After collecting the information of user demand for power quality, the marketer will choose the power supplier that can maximize its interest according to the prices given by different suppliers. For this marketer, the candidate power suppliers include SGCC, GENCOs within its region, and GENCOs in other regions.
3.2.1. The Cost of Marketer (CM)
According to the classification of power quality, a 5-dimensional vector can be obtained for marketer i by consolidating all the user demand information on power quality. The users specify their demand the power of specific level, and they put their demand information to the marketers who administer them. The elements in this vector represent the user demand of different qualities of electricity.
The power demand vector of marketer i is expressed as: , where denotes the power demand of marketer i for the electricity of quality level-k. Then, the total power demand of marketer i can be expressed as: .
Thus, the power demand matrix involving all the marketers (5 × n) is: .
The following assumptions apply: the price vector formulated by SGCC according to the quality level is ; there are a total of m GENCOs, and the price vector of GENCO g is ; the marketers may choose a power supplier according to their electricity demand, geographical location, as well as the price vectors of the various suppliers; λt (t = 1, 2, 3) represents the distance coefficient between the target marketer and its choice of electricity supplier.
Then, if marketer i chooses power supplier s(s = 0, 1, 2, …, m), the corresponding cost equation can be expressed as:
where, is the unit price corresponding to quality level-k purchased by marketer i: ; is the unit price corresponding to quality level-k of the s-th supplier chosen by marketer i.
Thus, the cost matrix involving all the marketers (1 × n) can be obtained as follows:
Taking into account the production costs of the marketers in terms of operation and maintenance, as well as the transmission loss in the actual power grid, a differentiable quadratic function [46] is introduced into this model to characterize the relationship between the cost and the total power consumption:
where, represents the operation and maintenance cost of the marketer, including the cost of power quality improvement; ai, bi and ci represent the cost coefficients of the marketer after considering all cost factors, which are all greater than 0. In addition, as the recipients, the marketers need to pay SGCC for the power transmission cost.
When a marketer chooses SGCC as the power supplier, the transmission and distribution cost can be expressed as:
where, λ0 represents the unit transmission and distribution cost that the marketer needs to pay when SGCC is chosen.
When a marketer chooses a GENCO as the power supplier, the transmission and distribution cost is:
where, λj represents the unit transmission and distribution cost corresponding to cross-regional level j, j = dig(j = 1, 2, 3).
Then, the total cost matrix of the marketers can be expressed as:
where, is the set of operation and maintenance costs for all the marketers: ; is the set of transmission and distribution costs for all the marketers: .
3.2.2. The Income of Marketer (YM)
The unit price formulated by marketer n is , where represents the unit price of marketer i corresponding to quality level-k. Since the income of a marketer all comes from the electricity fees paid by the users, the income of the marketer can be calculated as:
Then, the income matrix of the marketer can be expressed as:
where, YM is the set of incomes for all the marketers.
3.2.3. The Profit of Marketer (WM)
The profit of marketer is defined as the difference between the income and cost corresponding to the electricity consumption in a certain period of time. It can be expressed as:
where, WM is the set of profits for all the marketers: WM = [WM1 WM2…WMn].
3.3. The Model of SGCC (S0)
3.3.1. The Cost of SGCC (C0)
Taking into account the production costs of SGCC in terms of operation, equipment investment and grid maintenance, as well as the transmission loss in the actual power grid, a differential quadratic function is introduced, similar to the calculation of the cost of marketer in the previous section, to characterize the relationship between the cost and the power generation volume of SGCC:
where, A0 is the unit cost matrix of the various quality levels of electricity (1 × n): A0 = [ρ1 ρ2 ρ3 ρ4 ρ5]; Q0 is the total power volume provided by SGCC: (E = [1 1 1 1 1]).
3.3.2. The Income of SGCC
SGCC charges the marketers for supplying electricity. Meanwhile, SGCC charges GENCOs and those marketers which choose a GENCO as the power supplier for the transmission and distribution fees. Therefore, the income of SGCC consists of three parts: (1) the electricity fees paid by the marketers that choose SGCC as the power supplier; (2) the transaction service fees paid by GENCOs, and (3) the transmission and distribution fees paid by the marketers which choose a GENCO as the power supplier. Based on the buying cost matrix Φ and the selection matrix of the marketer as described earlier, the income of SGCC can be calculated as follows:
where, Rg represents the transmission fee paid by GENCO g to SGCC.
3.3.3. The Profit of SGCC (W0)
Thus, the profit of SGCC can be expressed as follows:
3.4. The Model of GENCO (SG)
GENCOs are the competitors of SGCC in the game. Price is their main approach of competition. The most significant difference between GENCOs and SGCC lies in the decentralization of the distribution approach. GENCOs are subject to a maximum power supply limit, and their overall costs are relatively low. Taking into account the difference in generation method, the power generated by the various GENCOs can be classified into three categories: thermal power generation, hydropower, and renewable and alternate energy power generation. The power generated by different methods corresponds to different cost price vectors.
3.4.1. The Cost of the GENCO (CG)
Referencing to the definition of income, cost and profit in the model of SGCC, the corresponding definitions can be obtained for GENCOs in a similar way.
The cost of GENCO g:
where represents the generation cost of GENCO g; represents the other costs of GENCO g, a differentiable quadratic term is here to characterize the relationship between power volume and costs such as transmission, distribution, and operation; Ag represents the unit generation cost of GENCO g; Qg represents the total power volume that GENCO g needs to generate; Rg represents the transmission fee that GENCO g needs to pay to SGCC; βj represents the transmission fee coefficient of the cross-regional level j.
Thus, the cost matrix for all GENCOs (1 × m) can be expressed as:
3.4.2. The Income of GENCO (YG)
Similar to SGCC, GENCOs provide electricity to the marketers and charge them for the electricity fees as the income. Thus, the income matrix for all GENCOs (1 × m) can be expressed as:
3.4.3. The Profit of GENCO (WG)
The profit matrix for all GENCOs (1 × m) can be expressed as:
4. The Algorithm to Solve the Game Model for Electricity Pricing
For the game described above, the problem to compute the Nash equilibrium of can be simplified as an optimization problem. First, a finite n-person non-cooperative game is defined as follows:
where, N is a finite set of players; Si is the space of pure strategies of player i and ui is the payoff function of player i.
If N = {1, 2,…,n}, then is the space of possible pure strategy combinations in game Γ, and ui: S→R. Supposing that player i has Ki pure strategies, then the number of pure strategies in the game is and the number of pure strategy combinations in the game is , which are denoted by K and M, respectively.
To represent the game, the pure strategy combinations are arranged according to the following ranking:
For instance, if a game has three players, each having two pure strategies, that is, n = 3, K1 = K2 = K3 = 2, then the number of pure strategies is 6 (=K) and the number of pure strategy combinations is 8 (=M). The ranking of pure strategy combinations in this case is as follows:
where denotes the j-th pure strategy of the i-th player.
A player has an associated payoff with respect to each pure strategy combination, so the payoff matrix of each player can be realized as a vector of length M. For that matter, the input format of a non-cooperative game, which includes n players with Ki (i = 1, 2, ..., n) pure strategies for each one, and has M combinations of pure strategies, can be described as follows:
A mixed strategy of player i is interpreted as a probability distribution over space Si and the space of all mixed strategies of player i can be denoted by . For , the probability assigned to pure strategy is . The strategy space of the game is .
If a mixed strategy combination σ is used, then the probability that the pure strategy combination occurs is given by . In such a situation, the payoff assigned to player i is given by , where ui(s) denotes the payoff to player i at pure strategy combinations.
If σ−i denotes the mixed strategy vector formed by all the players except player i, then the mixed strategy combination σ can be replaced by (σ−i, σi). The primary concern to solve a game is the computation of Nash equilibrium, which is defined next.
Definition 1.
Nash equilibrium: A mixed strategy profile σ* is called the Nash equilibrium of game Γ if .
This means that a random player i cannot attain a better payoff than that at Nash equilibrium by changing only his/her own mixed strategy while all other players remain their strategies unchanged.
The principle of optimization for each player is to maximize his/her payoff when others are playing their Nash equilibrium strategies. Consequently, an individual player attempts to minimize the gap between the optimal payoff and the actual payoff by applying an appropriate mixed strategy combination.
Now if βi is the optimal payoff to player i, the optimization problem of player i, i ∈ N can be expressed as:
(Pi)
where, denotes the mixed strategy combination in which player i plays the jth pure strategy, that is, in this mixed strategy, the jth pure strategy of the ith player is assigned the probability 1.
Although the convexities of the problem (Pi), i ∈ N are not assured, there are definitely local optimal solutions. A local optimum needs to satisfy the KKT first order necessary conditions. Applying the KKT optimality conditions to the problems above, the following result, which provides a simple characterization for the Nash equilibrium of game Γ as the solution to a system of equalities and inequalities, can be obtained.
Lemma 1.
The necessary and sufficient condition for σ to be the Nash equilibrium of game Γ is:
It can be seen that if such a σ exists, it is certainly an optimal solution of the nonlinear programming problem (Pi), for i ∈ N, with the global optimal value equal to 0. The Nash equilibrium strategy is an optimal solution of a single optimization problem.
Theorem 1.
The necessary and sufficient condition for σ* to be the Nash equilibrium of game Γ is that it must be the optimal solution of the following minimization problem:
(P)
The optimal value of this problem is 0. The value of βi at the optimal point demonstrates the expected payoff of player i.
The proof can be found in [47].
Thus, the problem to compute the Nash equilibrium of Γ is simplified as to solve the optimization problem (P) with the optimal value equal to zero. In order to solve problem (P), which is a nonlinear minimization problem with nonlinear constraints, the sequential quadratic programming (SQP) based on the quasi Newton method is used in the present study. SQP is a kind of approximate Newton’s method for solving constrained optimization problems. Its basic idea can be illustrated as follows. The original nonlinear programming problem is simplified as a quadratic sub-programming problem at a certain solution, and the solution of the sub-programming problem is regarded as the iterative search to continue the one-dimensional search. Then, the iterative process is repeated until the nearest approximation of the original problem is solved.
First of all, this method needs to be reformulated in terms of a vector in the K + n dimensional Euclidean space. For this purpose, some necessary modifications are made to the variables as follows.
Take x to be a vector of length K + n described as follows. Sorting the strategies of players 1 to n in order, a total of m strategies can be obtained. Take xi’s in order as: , where the subscripts of σ denote the index of strategies and the superscripts denote the index of players. Then take xK+i = βi, i = 1, 2, … n. Performing this transformation of variables in (P), the optimization problem (P) can be converted to the following form:
(Pnew)
where:
The working process of the proposed approach is summarized below:
- (1)
- Initialize all parameters and assign values to specific parameters, for instance, the cost factors of all players and the power consumption of the marketers.
- (2)
- Represent the game in the form described in this section.
- (3)
- According to the strategies of the game players which involve the pricing of SGCC, the price coefficient of GENCOs, and the power supplier probably chosen by the marketers, rank all possible pure strategy combinations.
- (4)
- Calculate the payoff of each pure strategy combination to construct the payoff matrix.
- (5)
- Take variables x1 to xK+n and reformulate the optimization problem to establish the model (Pnew).
- (6)
- Solve the problem (Pnew) using SQP based on the quasi-Newton method.
The working process of the proposed method for solving the Nash equilibrium of an n-person game is illustrated in Figure 3.
5. Numerical Experiments
To validate the feasibility of the proposed model and the effectiveness and reliability of the approach which is used to solve the game model presented in Section 4, several numerical experiments have been performed.
The mixed strategy Nash equilibrium is a strategy probability combination of each player with respect to his/her own policy space. The sum of probabilities of all the strategies is equal to 1 for each player; that is, the solution of the mixed strategy Nash equilibrium of a two-player or multiple-player game is a probability matrix. The realization of SQP is based on the “fmincon” function in MATLAB (R2013a, MathWorks, Natick, MA, USA). In order to ensure the accuracy of the algorithm, the parameters of MATLAB are set as follows: the maximum number of iterations “MaxIter” is 400; the maximum number of function evaluations is 100 times the number of variables; the constraint violation, and the termination tolerance is set to 1.0 × 10⁻⁶. All simulations in the present study are set with the same parameters (Note: GENCO.1 means the first GENCO, the rest are the similar; MKT presents the marketers, and the MKT.1 means the first marketer, the rest are the similar. To simplify the simulation and facilitate the understanding of the results, it is supposed that there is one MKT in each region. The expressions above apply to the full text).
5.1. The Game Simulation without Consideration of the Cross-Regional Factor
A case study is carried out to validate the reliability of the established model, as well as the feasibility and effectiveness of the proposed algorithm in solving this model. It is assumed that there is SGCC, ≥two GENCOs and three marketers. The cross-regional factor is ignored. Based on the price strategy given by SGCC, GENCOs will choose a coefficient of variation to develop their own price strategies. The strategy space of each marketer is the collection of all power suppliers.
5.1.1. The Game Simulation When the Electricity Price Varies
This simulation set assumes that there is SGCC, three GENCOs and three marketers. A total of 31 different groups of electricity price are set for SGCC, which are sorted in ascending order. The algorithm model when SGCC’s price varies without consideration of the cross-regional factor is shown as Figure 4. The list of electricity prices is shown in Table 1 (k denotes the power quality level).
In the strategy space of the GENCOs, the coefficient of variation can be equal to 1.01, 1 or 0.99. The price strategy of a GENCO is calculated as the product of the price of SGCC and the chosen coefficient. Taking Case 1 as an example, the mixed strategy Nash equilibrium can be solved using the algorithm above, as shown in Table 2.
The mixed strategy Nash equilibrium represents the probability distribution of each player’s strategy in the game. In order to demonstrate the tendency of GENCOs in choosing the coefficient of variation, this paper consolidates and converts the probabilities of all GENCOs to obtain the overall strategy distribution for the coefficient of variation. The calculation method is shown in Equation (36), and the obtained probability distribution is shown in Table 3:
where, σi denotes the integrated strategy probability of strategy i (i = 1, 2, 3); σij denotes the strategy probability of GENCO j over strategy i; M denotes the number of GENCOs.
Based on the table above, the changing pattern of GENCOs’ strategy probability distribution with the increase of the SGCC price can be obtained as shown in Figure 5. As demonstrated by this figure, when the game reaches equilibrium, the GENCOs’ overall strategy probability distribution exhibits a fluctuating changing pattern with the increase of the price of SGCC. Neither an increasing nor decreasing trend can be clearly observed. Meanwhile, there is no linear relationship between this distribution and the SGCC price. It shows that, although the GENCOs formulate electricity prices based on the SGCC price, which is commonly regarded as the market benchmark, they may also be affected by other practical situations. Therefore, there is no direct relationship between the GENCOs’ overall choice of electricity price and the price of SGCC.
5.1.2. The Game Simulation When GENCOs’ Generation Cost Varies
This set of simulation assumes that there is SGCC, three GENCOs and three marketers. As shown in Figure 6, a total of six groups of generation costs are set for the GENCOs, which are sorted in ascending order. The list of generation cost is shown in Table 4 (k denotes the power quality level).
In these six examples, the generation cost of SGCC is (0.25, 0.2, 0.15, 0.1, 0.05), and the coefficient of variation in the strategy space of GENCOs can be equal to 1.01, 1 or 0.99. The price strategy of a GENCO is calculated as the product of the price of SGCC and the chosen coefficient. The strategy probabilities of GENCOs at the equilibrium can be obtained as shown in Table 5.
Similar to the earlier section, after consolidating the probabilities of all GENCOs, the GENCOs’ overall strategy distribution over the coefficient of variation can be obtained as shown in Table 6.
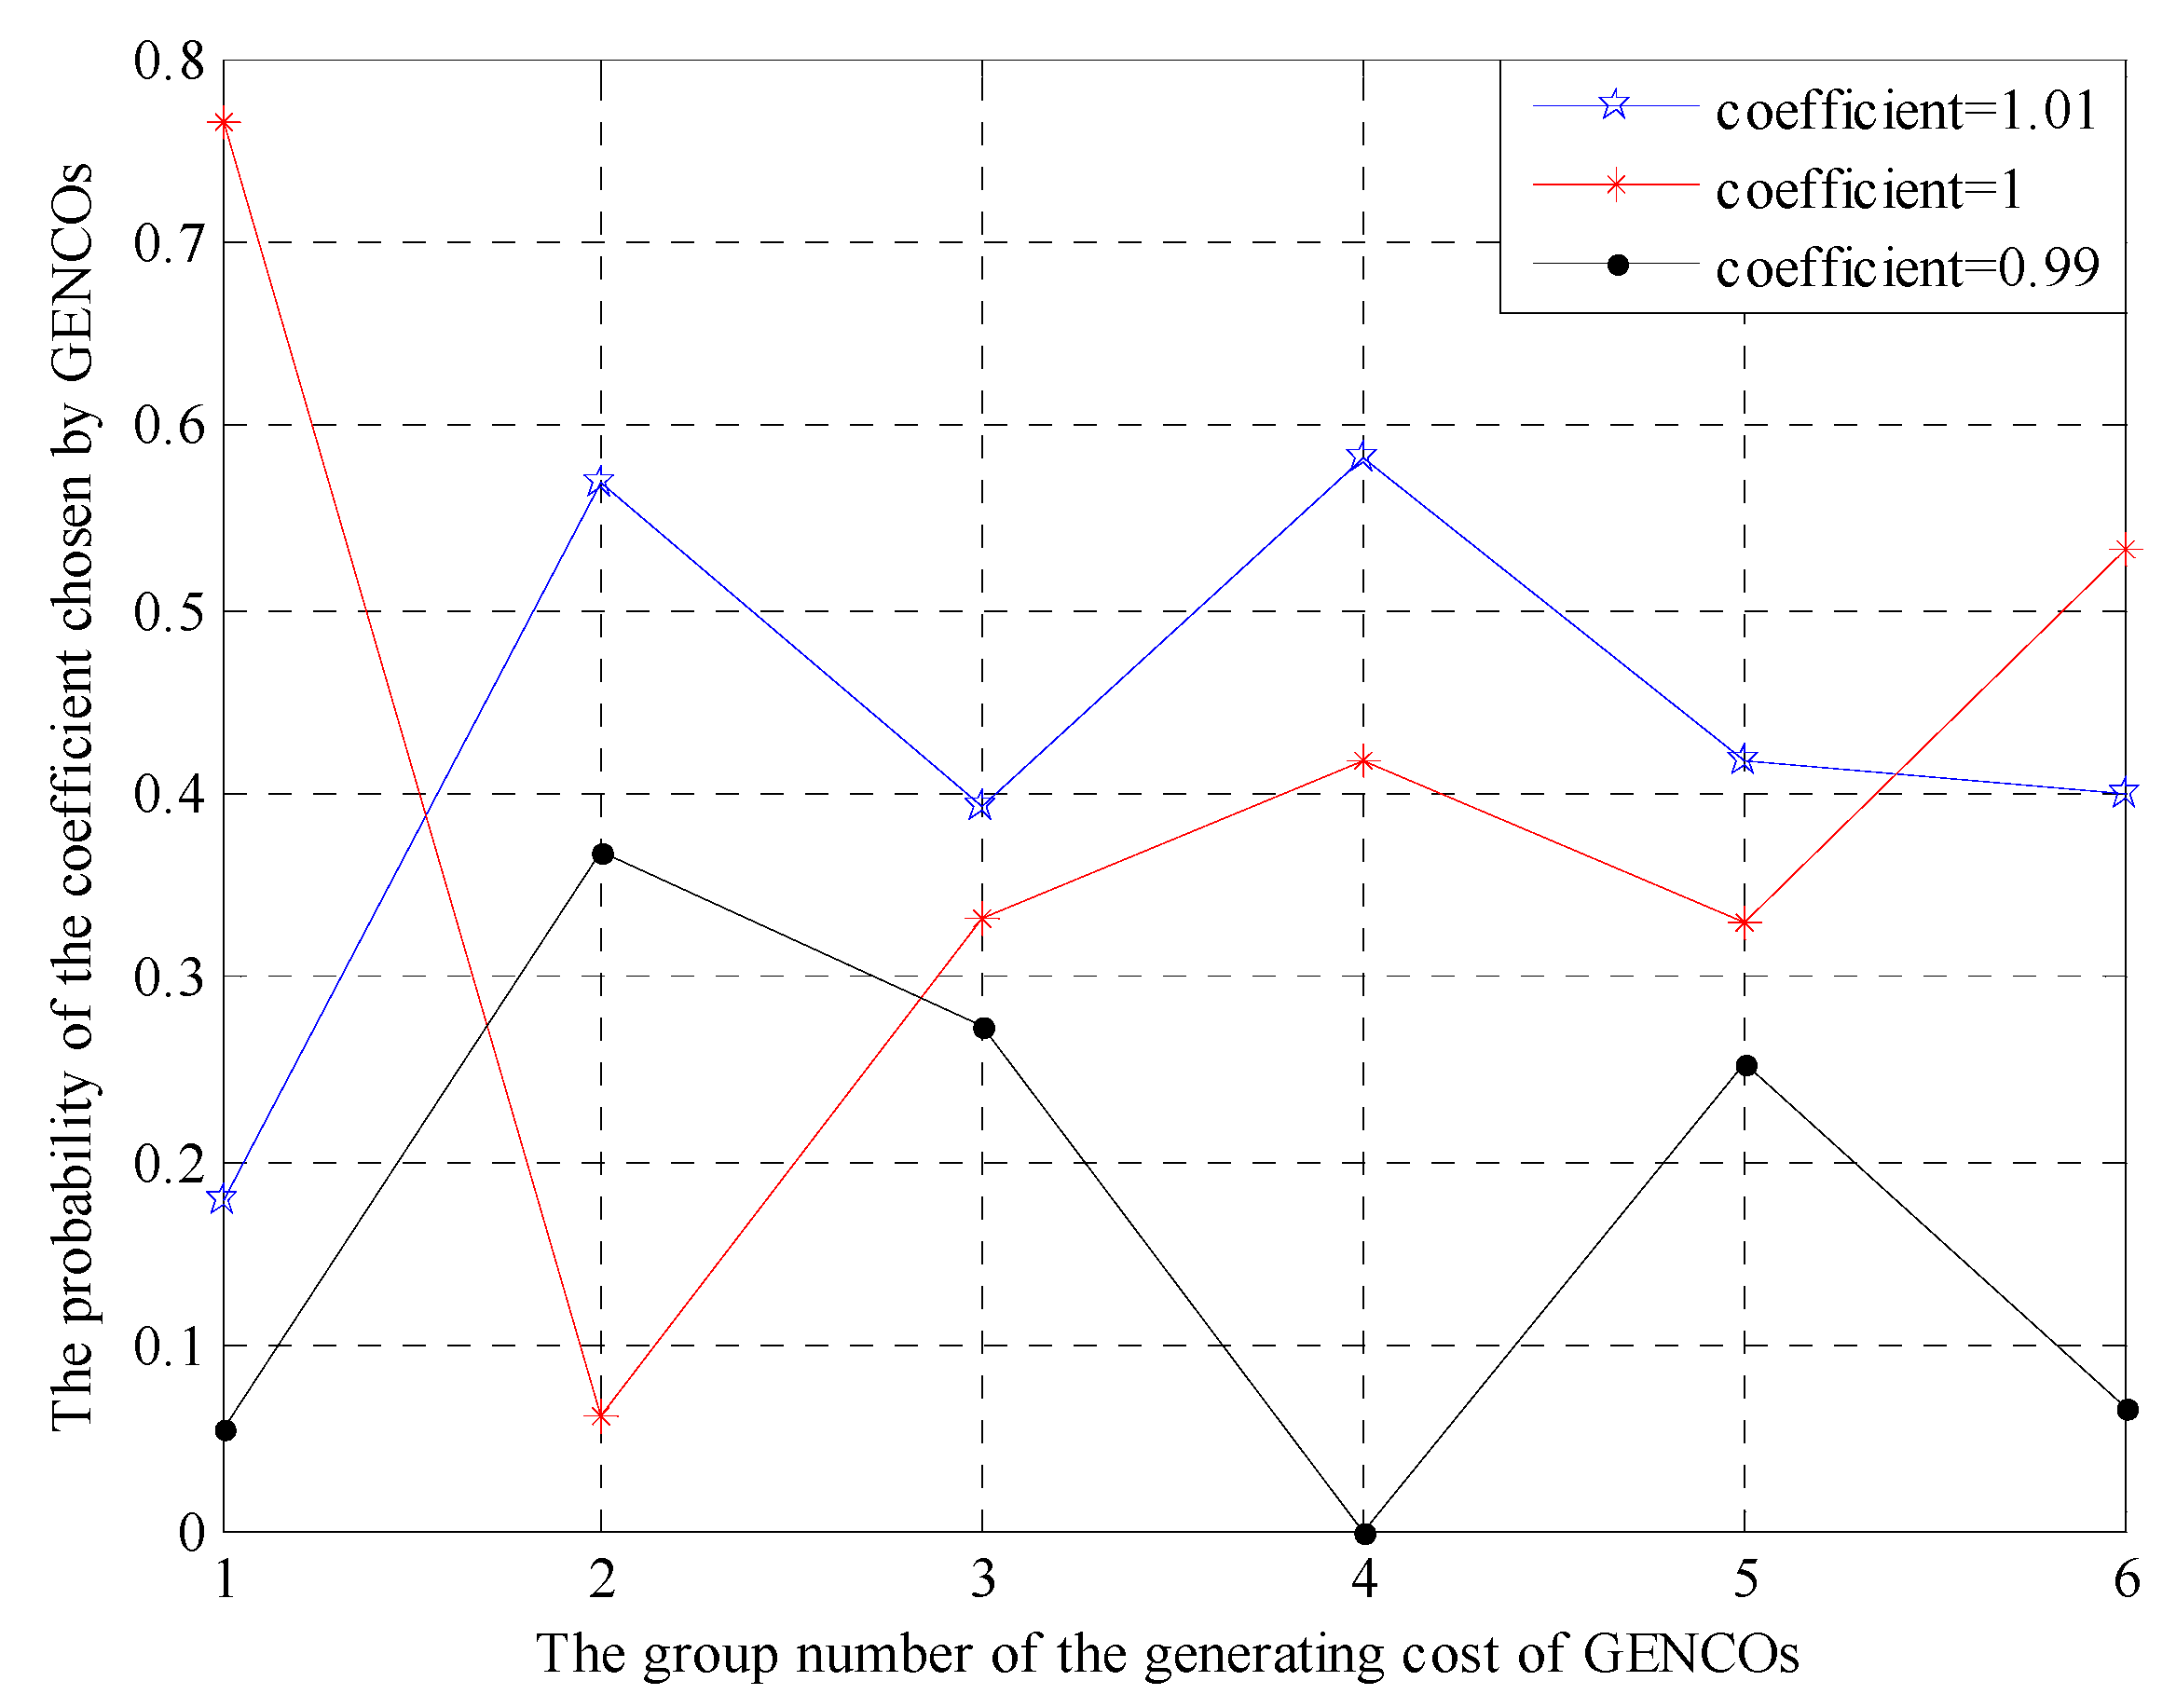
Based on the table above, the changing pattern of GENCOs’ overall strategy probability distribution with the increase of the generation cost can be obtained, as shown in Figure 7.
As demonstrated by Figure 7, when the game reaches equilibrium, the GENCOs’ overall strategy probability distribution exhibits a fluctuating changing pattern with the increase of the generation cost. Neither an increasing nor decreasing trend can be clearly observed. Meanwhile, there is no linear relationship between this distribution and the generation cost. These findings suggest that there is no direct relationship between GENCOs’ overall choice of electricity price and their generation cost.
Based on the simulation data of both Group 1 and Group 2, the importance of the proposed game method can be clearly seen. The electricity market is affected by many factors. When the market condition is unpredictable, it is necessary to perform game analysis according to the reality. The tripartite game model proposed in the present paper can appropriately realize this game process, and its mixed strategy Nash equilibrium can be well solved using SQP based on the quasi-Newton method.
5.1.3. The Game Simulation When the Number of GENCOs Varies
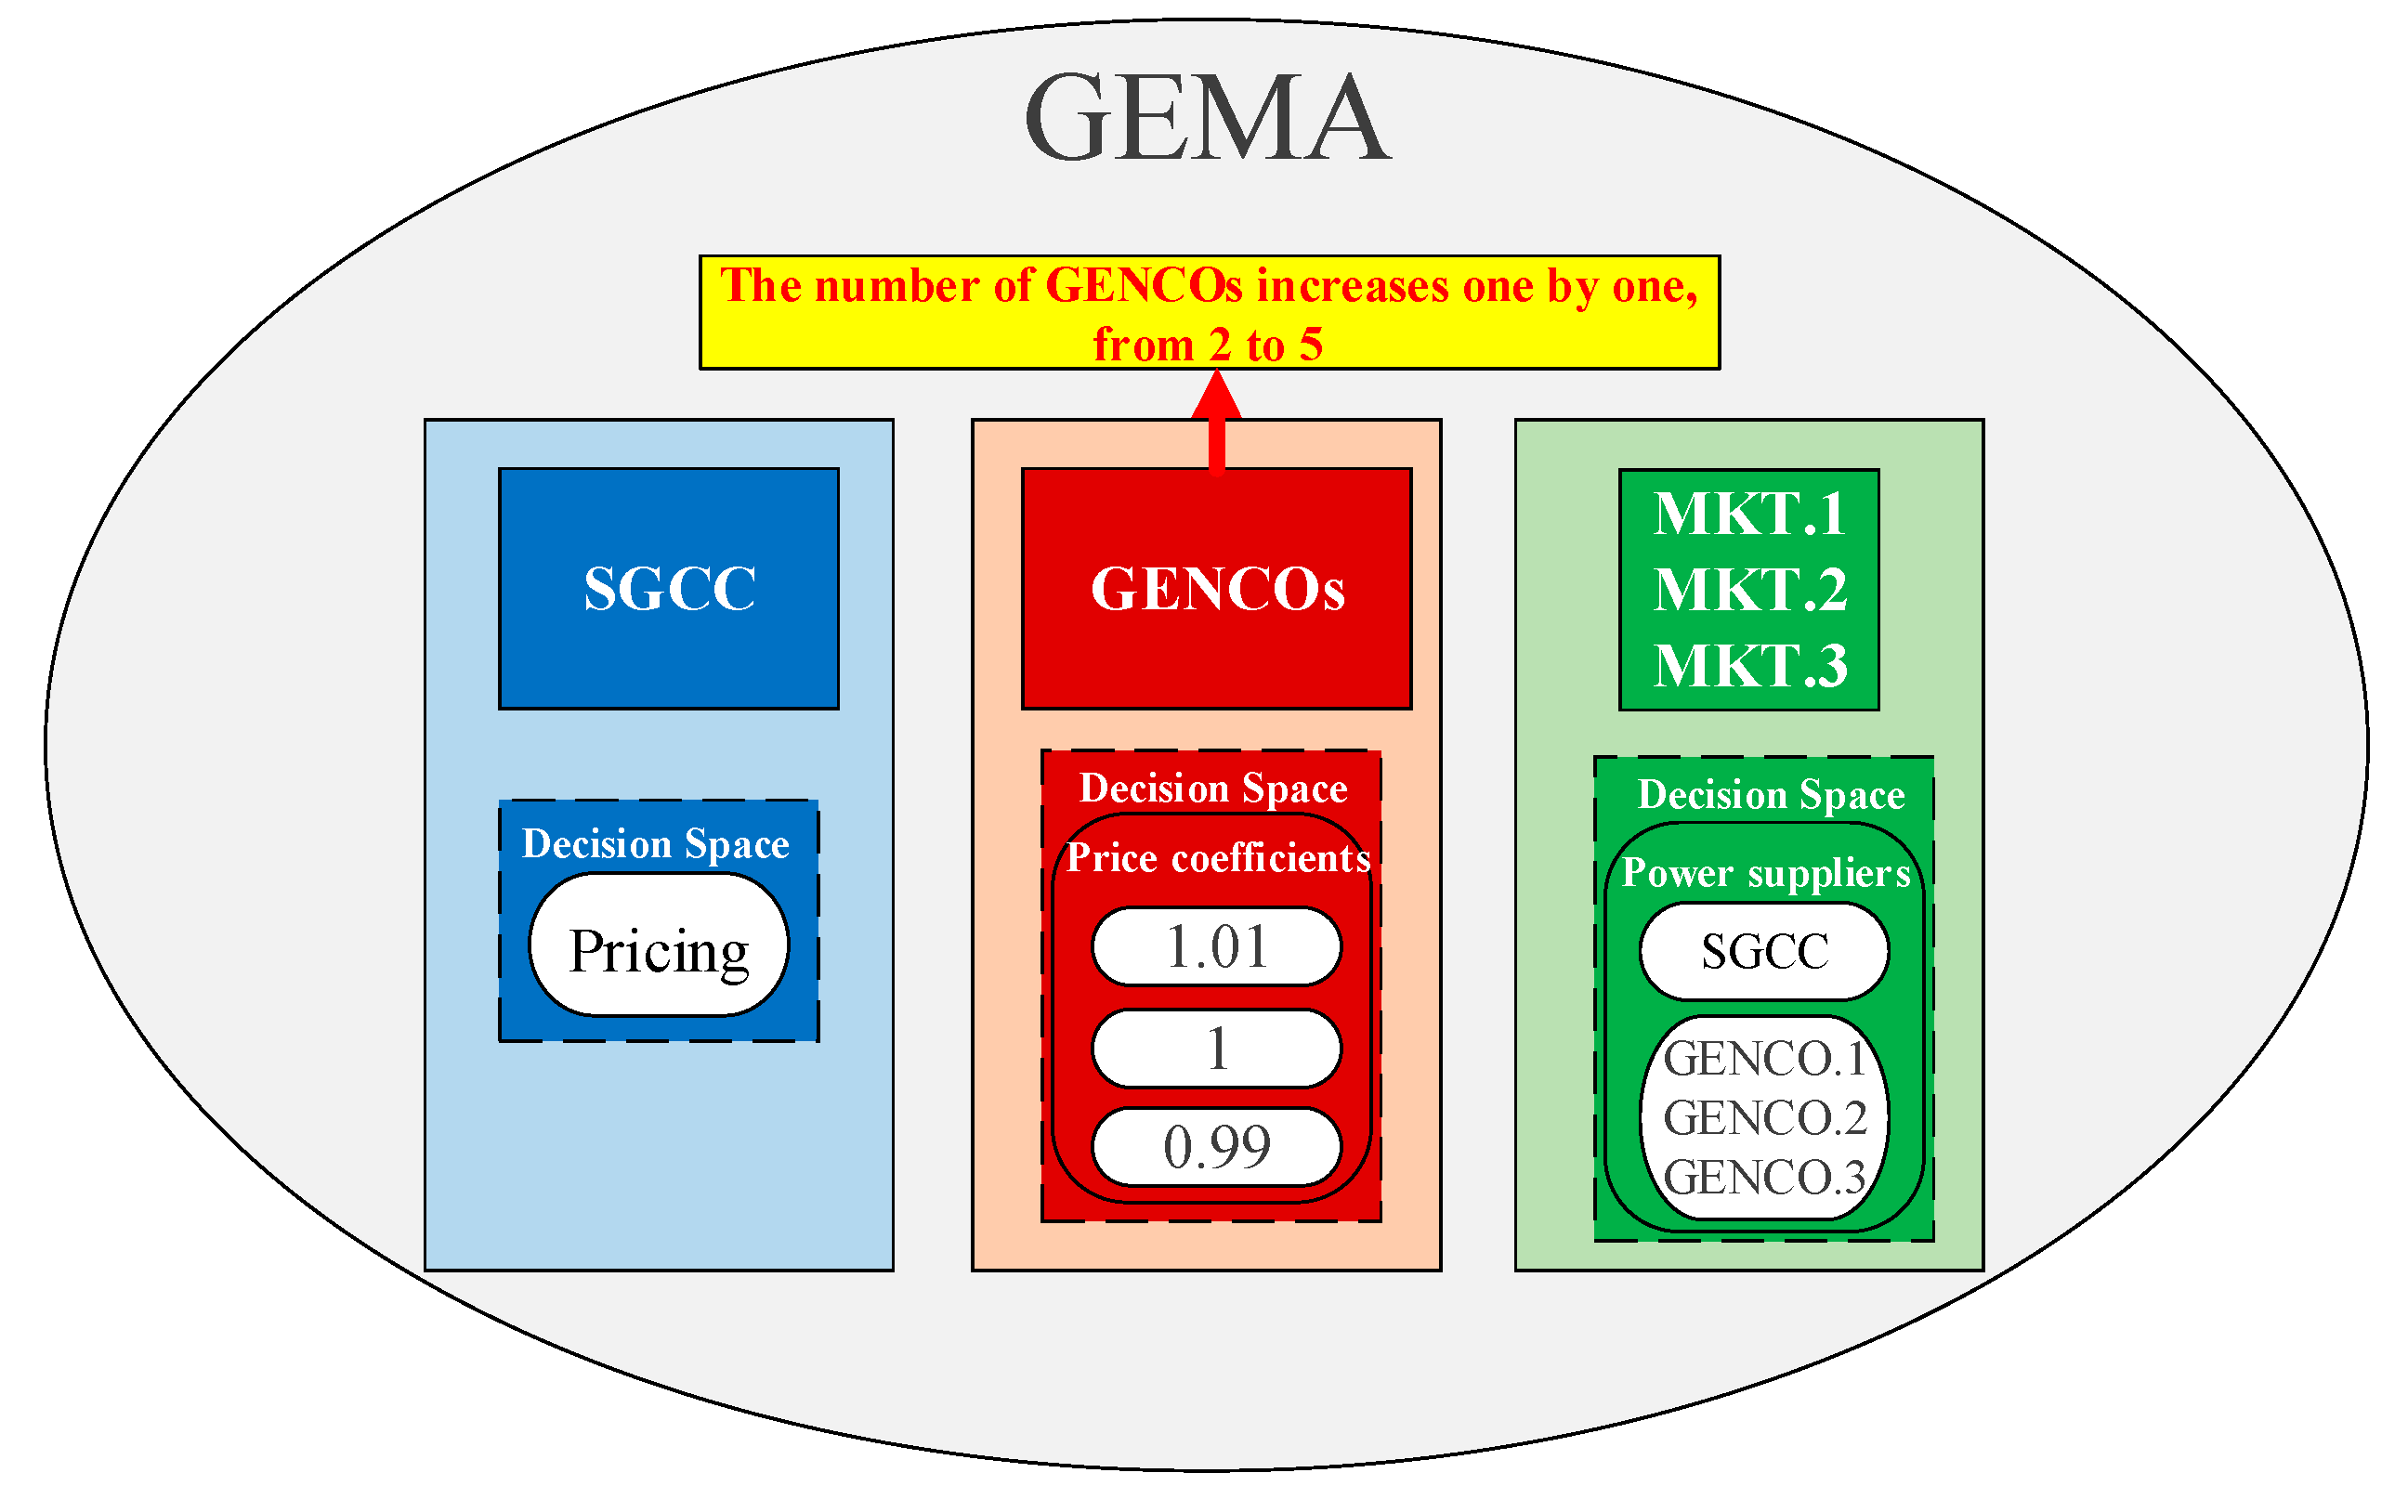
This set of simulation assumes that there is SGCC, ≥two GENCOs and three marketers. As illustrated in Figure 8, the number of GENCOs is increasing constantly. The basic parameter settings are shown in Table 7.
The coefficient of variation in the strategy space of GENCOs can be equal to 1.01, 1 or 0.99. The price strategy of a GENCO is calculated as the product of the price of SGCC and the chosen coefficient. Then, the strategy probabilities of GENCOs at the equilibrium for m = 2–5 can be obtained (see Table 8).
Similar to Section 1, after consolidating the probabilities of all GENCOs, the GENCOs’ overall strategy distribution over the coefficient of variation can be obtained (see Table 9).
Based on the table above, the changing pattern of GENCOs’ overall strategy probability distribution with the increase of the number of GENCOs can be obtained (Figure 9).
Figure 9 suggests that the probability that a GENCO chooses a low coefficient of variation increases with the increase of the number of GENCOs. However, in view of the complexity of the electricity market, such regularity does not always exist.
Figure 10 presents the convergence curve of the Nash equilibrium solutions obtained by SQP based on the quasi-Newton method for m = 2–5 (m is the number of GENCOs). This figure shows that, when the number of GENCOs equals 2 to 5, all four games can be effectively converged. It suggests that the SQP algorithm adopted in the present study, which is based on the quasi-Newton method, can solve the Nash equilibrium of the tripartite game model effectively, and the solutions are reliable.
5.2. The Game Simulation in the Cross-Regional Scenario
With the commercialization of the power system and the rapid development of the energy Internet, the importance of cross-regional power transaction has been deepening steadily. Thus, the tripartite game model proposed in this paper for the electricity market has also investigated the cross-regional trading scenario. In this set of simulation, it is assumed that there is SGCC, ≥2 GENCOs and 3 marketers in a cross-regional environment, and each power supplier has two price strategies, where the price of Strategy 1 is higher than that of Strategy 2. As is shown in Figure 11b, the cross-regional matrix between the six GENCOs and the three MKTs described here is as follows:
By increasing the number of GENCOs in the game model successively, the mixed strategy Nash equilibrium solutions of each game can be obtained for different numbers of GENCOs (1 to 6). Figure 13 presents the percentage stacked histogram plotted on these solutions (m is the number of GENCOs).
Based on the mixed strategy Nash equilibrium solutions above, the probability proportions of low-price strategy of all power suppliers (including SGCC) can be obtained for each game. Taking the number of GENCOs as the independent variable and the probability proportion of low-price strategy as the dependent variable, the tendency chart showing how the number of GENCOs influences the electricity price can be plotted as shown in Figure 14.
As shown in Figure 13 and Figure 14, with the increase of the number of GENCOs in the cross-regional scenario, all power suppliers’ overall choice of price strategy is gradually shifting from a higher price to a lower one. However, in view of the complexity of the electricity market, especially in the cross-regional scenario, this regularity does not always exist. Figure 15 shows the convergence curve of the Nash equilibrium solutions obtained by SQP based on the quasi-Newton method for m = 2, 4, 6 (m is the number of GENCOs).
Figure 15 shows that, when m = 2, 4, 6, the solutions of all the 3 games can be effectively converged. It again suggests that the SQP algorithm adopted in the present study, which is based on the quasi-Newton method, can solve the Nash equilibrium of the tripartite game model effectively, and the solutions are reliable.
It can be demonstrated from all of the above simulations and the convergence curves that the proposed model is feasible and the approach which is used to solve the game model presented in this paper is effective and reliable. And these simulations are finished on the assumption that there is one MKT in each region. In fact, as long as the marketers’ power volume and the cross-regional level between marketers and GENCOs can be determined, the model in which MKTs are freely distributed in all areas can be solved using the method proposed in this paper.
6. Conclusions
In view of the rapid development of the Energy Internet, a growing number of distributed generation entities and emerging power-retailing companies will enter the market. Power supply will no longer be dominated by the government. A variety of emerging power suppliers will participate in the market competition in various ways. In the face of such a diversified environment, the first contribution of this paper is to propose a tripartite game model for the electricity market in consideration of the power quality. This model can properly describe the game process among SGCC, GENCOs and the marketers (marketers) in the fierce competition nowadays. Specifically, the pricing foundation is formed based on the level of power quality, and then the cost, income and profit of each player are characterized based on the quality classification. It provides reference and an approach to solve the game problems in this regard. The second contribution lies in that this paper converts the Nash equilibrium problem into a nonlinear programming problem, and uses the SQP algorithm based on the quasi-Newton method to solve the aforementioned model. At the same time, as the user demand on power quality is increasing constantly, the quality factor will occupy an important position in the future electricity market. The concern of power quality in the proposed model has great innovative and forward-looking values, and it will urge the power suppliers to improve their power quality.
This paper has presented four sets of examples to test the feasibility of the proposed model and to validate the effectiveness and reliability of the equilibrium solutions obtained by SQP based on the quasi-Newton method. Meanwhile, according to the convergence of the simulation results under different game conditions, it can be found that the tripartite game model proposed in this paper for the electricity market has strong compatibility, transferability and good scalability. This model can be also applied to the game of electricity market in which sale agencies, social individuals of power generation and a national enterprise coexist.
However, the deterministic optimization algorithm used in this paper has a momentous drawback—its time cost is high. At present, a number of high-quality studies and applications have been reported in the field of the optimization algorithm based on swarm intelligence. In the future, random intelligence algorithms may be employed to solve the Nash equilibrium of this model.
Acknowledgments
The authors acknowledge the support by the National Natural Science Foundation for Distinguished Young Scholars of China under Grant 51525702, Innovative Think-tank Foundation for Young Scientists of China Association for Science and Technology under Grant DXB-ZKQN-2017-042, Open Project of Key Laboratory of electric Power Big Data of Guizhou Province and Guizhou Fengneng Science and Technology Development Co., Ltd.
Author Contributions
Tianlei Zang and Jianwei Yang conceived and designed the experiments; Tianlei Zang and Yueping Xiang performed the experiments and analyzed the data; Tianlei Zang, Yueping Xiang and Jianwei Yang wrote the paper. All authors have read and approved the final manuscript.
Conflicts of Interest
The authors declare no conflict of interest.
References
- Younes, Z.; Ilic, M. Generation strategies for gaming transmission constraints. Will the deregulated electric power market be an oligopoly? In Proceedings of the Thirty-First Hawaii International Conference on System Sciences, Kohala Coast, HI, USA, 9 January 1998; pp. 112–121. [Google Scholar]
- Green, R. Competition in generation: The economic foundations. Proc. IEEE 2000, 88, 128–139. [Google Scholar] [CrossRef]
- Hobbs, B.F. Linear complementarity models of Nash-Cournot competition in bilateral and POOLCO power markets. IEEE Trans. Power Syst. 2001, 16, 194–202. [Google Scholar] [CrossRef]
- Lazaroiu, G.C.; Dumbrava, V.; Costoiu, M.; Roscia, M. Game theory and competitive aspects in electricity markets. In Proceedings of the 2017 IEEE International Conference on Environment and Electrical Engineering and 2017 IEEE Industrial and Commercial Power Systems Europe (EEEIC/I&CPS Europe), Milan, Italy, 6–9 June 2017; pp. 1–6. [Google Scholar]
- Ferrero, R.W.; Rivera, J.F.; Shahidehpour, S.M. Application of games with incomplete information for pricing electricity in deregulated power pools. IEEE Trans. Power Syst. 2002, 13, 184–189. [Google Scholar] [CrossRef]
- Li, N.; Chen, L.; Dahleh, M.A. Demand Response Using Linear Supply Function Bidding. IEEE Trans. Smart Grid 2015, 6, 1827–1838. [Google Scholar] [CrossRef]
- Wang, P.; Ma, J.; Song, L. Balanced Interest Distribution in Smart Grid: A Nash Bargaining Demand Side Management Scheme. In Proceedings of the 2016 IEEE Global Communications Conference (GLOBECOM), Washington, DC, USA, 4–8 December 2016; pp. 1–6. [Google Scholar]
- Mohsenian-Rad, A.H.; Wong, V.W.S.; Jatskevich, J.; Schober, R.; Leon-Garcia, A. Autonomous demand-side management based on game-theoretic energy consumption scheduling for the future smart grid. IEEE Trans. Smart Grid 2010, 1, 320–331. [Google Scholar] [CrossRef]
- Contreras, J.; Wu, F.F. Coalition formation in transmission expansion planning. IEEE Trans. Power Syst. 1999, 14, 1144–1152. [Google Scholar] [CrossRef] [Green Version]
- Lo, K.L.; Lozano, C.A.; Gers, O.J.M. Game theory application for determining wheeling charges. In Proceedings of the International Conference on Electric Utility Deregulation and Restructuring and Power Technologies (DRPT2000), London, UK, 4–7 April 2000; pp. 308–313. [Google Scholar]
- Tong, X.J.; Bing, P.P.; Yang, H.M. Analysis of dynamic bidding model for power markets based on Nash equilibrium theory. Proc. CSEE 2008, 28, 84–90. [Google Scholar]
- Wen, F.S.; David, A.K. Oligopoly electricity market production under incomplete information. IEEE Power Eng. Rev. 2001, 21, 58–61. [Google Scholar] [CrossRef]
- Zhang, Y.; Fang, J.; Hu, F.; Chen, S.; Ni, Y. Analysis of the network constraints’ effects on strategic behavior in an incomplete information environment. In Proceedings of the International Conference on Power System Technology, Kunming, China, 13–17 October 2002; pp. 428–432. [Google Scholar]
- Zhang, Y.B.; Luo, X.J.; Xue, J.Y. Constrained competitive Cournot equilibrium with incomplete information in electricity market. In Proceedings of the International Conference on Power System Technology, Kunming, China, 13–17 October 2002; pp. 2385–2389. [Google Scholar]
- Dolezal, J.; Santarius, P.; Tlusty, J.; Valouch, V.; Vybiralik, F. The effect of dispersed generation on power quality in distribution system. In Proceedings of the CIGRE/IEEE PES International Symposium Quality and Security of Electric Power Delivery Systems, Montreal, QC, Canada, 8–10 October 2003; pp. 204–207. [Google Scholar]
- Brenna, M.; Faranda, R.; Tironi, E. A New Proposal for Power Quality and Custom Power Improvement: OPEN UPQC. IEEE Trans. Power Deliv. 2009, 24, 2107–2116. [Google Scholar] [CrossRef]
- Jun, Y.; Hiroyuki, K.; Eiichi, T.; Jun, H.; Hiroshi, K.; Shigeru, Y. Reliability and power quality evaluation of high-voltage supplied customers: Estimation of outage cost by fuzzy reasoning. Electr. Eng. Jpn. 2010, 153, 41–51. [Google Scholar]
- Nelson, J.P.; Lankutis, J.D. Putting a Price on Power Interruptions: How Utilities and Customers Can Share Interruption Costs. IEEE Ind. Appl. Mag. 2016, 22, 30–40. [Google Scholar] [CrossRef]
- Tao, S.; Xiao, X.; Hadjsaid, N. Comprehensive Hierarchy Evaluation of Power Quality Based on an Incentive Mechanism. World Acad. Sci. Eng. Technol. 2010, 66, 1517. [Google Scholar]
- Söderberg, M. A choice modelling analysis on the similarity between distribution utilities’ and industrial customers’ price and quality preferences. Energy Econ. 2008, 30, 1246–1262. [Google Scholar] [CrossRef]
- Hu, W.J.; Wu, Z.G.; Zhang, Y.; Ye, L.H.; Zhong, Q. The impact of Nan’ao wind farm integration on power quality of Shantou Power Grid. In Proceedings of the 2008 International Conference on Electrical Machines and Systems, Wuhan, China, 17–20 October 2008; pp. 2596–2601. [Google Scholar]
- Kim, H. Evaluating power quality at a point of common coupling in single-phase systems and three-phase systems. In Proceedings of the Power Conversion Conference, Osaka, Japan, 2–5 April 2002; pp. 1393–1398. [Google Scholar]
- Kim, H.; Blaabjerg, F.; Bak-Jensen, B. Spectral analysis of instantaneous powers in single-phase and three-phase systems with use of p-q-r theory. IEEE Trans. Power Electron. 2002, 17, 711–720. [Google Scholar]
- Kim, H.; Akagi, H. The instantaneous power theory on the rotating p-q-r reference frames. In Proceedings of the IEEE 1999 International Conference on Power Electronics and Drive Systems (PEDS’99), Hong Kong, China, 27–29 July 1999; pp. 422–427. [Google Scholar]
- Ding, Z.J.; Yuan, J.J.; Huang, R.Y.; Sen, Q.Y.; Duan, Y.H.; Dong, X.Z.; Zeng, J. Research of fuzzy synthetic evaluation method of power quality based on improved membership function. In Proceedings of the IEEE Power Engineering and Automation Conference, Wuhan, China, 18–20 September 2012; pp. 1–4. [Google Scholar]
- Farghal, S.A.; Kandil, M.S.; Elmitwally, A. Quantifying electric power quality via fuzzy modelling and analytic hierarchy processing. IEE Proc. Gener. Transm. Distrib. 2002, 149, 44–49. [Google Scholar] [CrossRef]
- Chen, Y.; Ji, T.Y.; Li, M.S.; Wu, Q.H. Power quality disturbance detection based on morphology singular entropy. In Proceedings of the 2015 IEEE Innovative Smart Grid Technologies-Asia (ISGT ASIA), Bangkok, Thailand, 3–6 November 2015; pp. 1–5. [Google Scholar]
- Dong, X.; Gao, Y.; Ma, T.; Liu, J.; Xia, R.; Huang, Y. The comprehensive evaluation of impact of distributed PV on distribution network. In Proceedings of the 2015 5th International Conference on Electric Utility Deregulation and Restructuring and Power Technologies (DRPT), Changsha, China, 26–29 November 2015; pp. 2046–2050. [Google Scholar]
- Zhai, X.L.; Lin, Z.Z.; Wen, F.S.; Huang, J.S. Power quality comprehensive evaluation based on combination weighting method. In Proceedings of the International Conference on Sustainable Power Generation and Supply (SUPERGEN 2012), Hangzhou, China, 8–9 September 2012; pp. 1–5. [Google Scholar]
- Wang, L.; Chen, H.; Xu, K. A method of power quality evaluation based on vague sets. In Proceedings of the 2015 IEEE Power & Energy Society General Meeting, Denver, CO, USA, 26–30 July 2015; pp. 1–5. [Google Scholar]
- Fu, X.Q.; Chen, H.Y.; Liu, G.T.; Jin, X.M. Power Quality Comprehensive Evaluation Method for Distributed Generation. Proc. CSEE 2014, 34, 4270–4276. [Google Scholar]
- Rosa, M.A.D.; Bolacell, G.; Costa, I.; Calado, D.; Issicaba, D. Impact evaluation of the network geometric model on power quality indices using probabilistic techniques. In Proceedings of the 2016 International Conference on Probabilistic Methods Applied to Power Systems (PMAPS), Beijing, China, 16–20 October 2016; pp. 1–8. [Google Scholar]
- Zhong, H.; Li, Q. A comprehensive evaluation model of power quality based on blind number and variable fuzzy sets theory. In Proceedings of the 2016 International Conference on Integrated Circuits and Microsystems (ICICM), Chengdu, China, 23–25 November 2016; pp. 279–285. [Google Scholar]
- Duan, X.; Chen, K. Research on the application of maximal tree method based on fuzzy clustering for Power Quality Evaluation. In Proceedings of the 2014 China International Conference on Electricity Distribution (CICED), Shenzhen, China, 23–26 September 2014; pp. 1284–1287. [Google Scholar]
- Duan, X.; Zhou, M.; Li, G.; Yang, J. Synthetic Evaluation of Power Quality Based on Fuzzy Cluster Analysis. In Proceedings of the 2006 International Conference on Power System Technology (ICPST), Chongqing, China, 22–26 October 2006; pp. 1–6. [Google Scholar]
- Morsi, W.G.; El-Hawary, M.E. Power quality evaluation in smart grids considering modern distortion in electric power systems. Electr. Power Syst. Res. 2011, 81, 1117–1123. [Google Scholar] [CrossRef]
- Yuan, X.; Zhao, J.; Tang, G.; Han, Z. Multi-level fuzzy comprehensive evaluation of power quality. In Proceedings of the 2004 IEEE International Conference on Electric Utility Deregulation, Restructuring and Power Technologies, Hong Kong, China, 5–8 April 2004; pp. 290–294. [Google Scholar]
- Sun, R.; Yan, W.; Yang, Q.; Bao, Z.; Zhang, J. Power quality assessment of offshore wind farm based on PSCAD/EMTDC models. In Proceedings of the 2013 Sixth International Conference on Advanced Computational Intelligence (ICACI), Hangzhou, China, 19–21 October 2013; pp. 339–344. [Google Scholar]
- Wang, J.; Pang, W.; Wang, L.; Pang, X.; Yokoyama, R. Synthetic evaluation of steady-state power quality based on combination weighting and principal component projection method. CSEE J. Power Energy Syst. 2017, 3, 160–166. [Google Scholar]
- Zhao, C.; Zhao, X.; Jia, X. A new method for power quality assessment based on energy space. In Proceedings of the Power Engineering Society General Meeting, Denver, CO, USA, 6–10 June 2004. [Google Scholar]
- Tao, S.; Xiao, X. Synthetic grading evaluation of power quality based on cask principle. In Proceedings of the 2008 Third International Conference on Electric Utility Deregulation and Restructuring and Power Technologies, Nanjing, China, 6–9 April 2008; pp. 2353–2357. [Google Scholar]
- Ding, Z.; Zhu, Y.; Chen, C. Comprehensive evaluation of power quality based on meaningful classification. In Proceedings of the 2010 5th International Conference on Critical Infrastructure (CRIS), Beijing, China, 20–22 September 2010; pp. 1–4. [Google Scholar]
- Hai, Y.; Chen, J.Y. Power quality evaluation based on wavelet packet decomposition and fuzzy logic. In Proceedings of the 2012 IEEE International Conference on Computer Science and Automation Engineering (CSAE), Zhangjiajie, China, 25–27 May 2012; pp. 504–507. [Google Scholar]
- Kaewarsa, S.; Attakitmongcol, K. Wavelet-based neural classification for power quality disturbances. In Proceedings of the 2004 International Symposium on Intelligent Signal Processing and Communication Systems (ISPACS), Seoul, South Korea, 18–19 November 2004; pp. 299–304. [Google Scholar]
- Shahidehpour, M.; Yamin, H.; Li, Z. Market Operations in Electric Power Systems: Forecasting, Scheduling, and Risk Management; Wiley-IEEE Press: Hoboken, NJ, USA, 2002. [Google Scholar]
- Gaing, Z. Particle swarm optimization to solving the economic dispatch considering the generator constraints. IEEE Trans. Power Syst. 2003, 18, 1187–1195. [Google Scholar] [CrossRef]
- Chatterjee, B. An optimization formulation to compute Nash equilibrium in finite games. In Proceedings of the 2009 International Conference on Methods and Models in Computer Science (ICM2CS), Delhi, India, 14–15 December 2009; pp. 1–5. [Google Scholar]
Figure 1.
The tripartite game model for the electricity market.

Figure 2.
Schematic diagram of power supply region.

Figure 3.
The working process of the proposed approach.

Figure 4.
The algorithm model when SGCC’s price varies without consideration of the cross-regional factor.
Figure 4.
The algorithm model when SGCC’s price varies without consideration of the cross-regional factor.

Figure 5.
The changing pattern of the converted strategy probability of GENCOs with the change of the price of SGCC.
Figure 5.
The changing pattern of the converted strategy probability of GENCOs with the change of the price of SGCC.

Figure 6.
The algorithm model when GENCOs’ generation cost varies without consideration of the cross-regional factor.
Figure 6.
The algorithm model when GENCOs’ generation cost varies without consideration of the cross-regional factor.

Figure 7.
The changing pattern of GENCOs’ converted strategy probability with the increase of the generation cost.
Figure 7.
The changing pattern of GENCOs’ converted strategy probability with the increase of the generation cost.

Figure 8.
The algorithm model when the number of GENCOs varies without consideration of the cross-regional factor.
Figure 8.
The algorithm model when the number of GENCOs varies without consideration of the cross-regional factor.

Figure 9.
The changing pattern of the GENCOs’ converted strategy probability with the change of the number of GENCOs.
Figure 9.
The changing pattern of the GENCOs’ converted strategy probability with the change of the number of GENCOs.

Figure 10.
The convergence curve when the number of GENCOs in the game equals to 2–5.

Figure 11.
The cross-regional game model: (a) The algorithm model when the number of GENCOs varies; (b) The distribution of MKTs and GENCOs in the simulation.
Figure 11.
The cross-regional game model: (a) The algorithm model when the number of GENCOs varies; (b) The distribution of MKTs and GENCOs in the simulation.

Figure 12.
The price strategies of all power suppliers in the cross-regional game.

Figure 13.
The Nash equilibrium solutions of the cross-regional game (m = 1–6).

Figure 14.
The changing pattern of all power suppliers’ converted strategy probability with the change of the number of GENCOs.
Figure 14.
The changing pattern of all power suppliers’ converted strategy probability with the change of the number of GENCOs.

Figure 15.
The convergence curve when m = 2, 4, 6 in the cross-regional scenario.


Table 1.
The list of electricity prices for the 31 examples.
| The Group Number | The Price of SGCC/yuan | ||||
|---|---|---|---|---|---|
| k = 1 | k = 2 | k = 3 | k = 4 | k = 5 | |
| 1 | 0.30 | 0.25 | 0.20 | 0.15 | 0.10 |
| 2 | 0.32 | 0.27 | 0.22 | 0.17 | 0.12 |
| 3 | 0.34 | 0.29 | 0.24 | 0.19 | 0.14 |
| 4 | 0.35 | 0.30 | 0.25 | 0.20 | 0.15 |
| 5 | 0.36 | 0.31 | 0.26 | 0.21 | 0.16 |
| 6 | 0.38 | 0.33 | 0.28 | 0.23 | 0.18 |
| 7 | 0.40 | 0.35 | 0.30 | 0.25 | 0.20 |
| 8 | 0.42 | 0.37 | 0.32 | 0.27 | 0.22 |
| 9 | 0.44 | 0.39 | 0.34 | 0.29 | 0.24 |
| 10 | 0.45 | 0.40 | 0.35 | 0.30 | 0.25 |
| 11 | 0.46 | 0.41 | 0.36 | 0.31 | 0.26 |
| 12 | 0.48 | 0.43 | 0.38 | 0.33 | 0.28 |
| 13 | 0.50 | 0.45 | 0.40 | 0.35 | 0.30 |
| 14 | 0.52 | 0.47 | 0.42 | 0.37 | 0.32 |
| 15 | 0.54 | 0.49 | 0.44 | 0.39 | 0.34 |
| 16 | 0.55 | 0.50 | 0.45 | 0.40 | 0.35 |
| 17 | 0.56 | 0.51 | 0.46 | 0.41 | 0.36 |
| 18 | 0.58 | 0.53 | 0.48 | 0.43 | 0.38 |
| 19 | 0.60 | 0.55 | 0.50 | 0.45 | 0.40 |
| 20 | 0.62 | 0.57 | 0.52 | 0.47 | 0.42 |
| 21 | 0.64 | 0.59 | 0.54 | 0.49 | 0.44 |
| 22 | 0.66 | 0.61 | 0.56 | 0.51 | 0.46 |
| 23 | 0.68 | 0.63 | 0.58 | 0.53 | 0.48 |
| 24 | 0.69 | 0.64 | 0.59 | 0.54 | 0.49 |
| 25 | 0.70 | 0.65 | 0.60 | 0.55 | 0.50 |
| 26 | 0.72 | 0.67 | 0.62 | 0.57 | 0.52 |
| 27 | 0.74 | 0.69 | 0.64 | 0.59 | 0.54 |
| 28 | 0.75 | 0.70 | 0.65 | 0.60 | 0.55 |
| 29 | 0.76 | 0.71 | 0.66 | 0.61 | 0.56 |
| 30 | 0.78 | 0.73 | 0.68 | 0.63 | 0.58 |
| 31 | 0.80 | 0.75 | 0.70 | 0.65 | 0.60 |
Table 2.
The solution of the mixed strategy Nash equilibrium for Case 1.
| Strategy | The Probability of Each Strategy of Each Player | ||||||
|---|---|---|---|---|---|---|---|
| SGCC | GENCO.1 | GENCO.2 | GENCO.3 | MKT.1 | MKT.2 | MKT.3 | |
| Strategy 1 | 1 | 0.9418 | 0.3462 | 0.0000 | 1.0000 | 1.0000 | 1.0000 |
| Strategy 2 | - | 0.0000 | 0.6538 | 1.0000 | 0.0000 | 0.0000 | 0.0000 |
| Strategy 3 | - | 0.0582 | 0.0000 | 0.0000 | 0.0000 | 0.0000 | 0.0000 |
| Strategy 4 | - | - | - | - | 0.0000 | 0.0000 | 0.0000 |
Table 3.
The converted strategy probability of GENCOs when the price of SGCC varies.
| Coefficient | The Convert Probability of Each Coefficient | |||||||
| 1 | 2 | 3 | 4 | 5 | 6 | 7 | 8 | |
| 1.01 | 0.429333 | 0.666633 | 0.300633 | 0.125304 | 0.589133 | 0.695467 | 0.127033 | 0.058333 |
| 1 | 0.551267 | 0.333333 | 0.602600 | 0.845195 | 0.300733 | 0.194500 | 0.807867 | 0.932667 |
| 0.99 | 0.019400 | 0.000003 | 0.096700 | 0.029501 | 0.110100 | 0.146067 | 0.065100 | 0.009000 |
| 9 | 10 | 11 | 12 | 13 | 14 | 15 | 16 | |
| 1.01 | 0.622700 | 0.525367 | 0.533033 | 0.774033 | 0.670800 | 0.333333 | 0.291467 | 0.709200 |
| 1 | 0.433767 | 0.211367 | 0.349367 | 0.082700 | 0.222767 | 0.666667 | 0.471533 | 0.238800 |
| 0.99 | 0.039500 | 0.263267 | 0.117600 | 0.143233 | 0.106433 | 0.000000 | 0.236967 | 0.052000 |
| 17 | 18 | 19 | 20 | 21 | 22 | 23 | 24 | |
| 1.01 | 0.347333 | 0.491233 | 0.413767 | 0.588167 | 0.717500 | 0.484933 | 0.413400 | 0.616100 |
| 1 | 0.627467 | 0.413867 | 0.562400 | 0.293300 | 0.050167 | 0.406133 | 0.363867 | 0.197933 |
| 0.99 | 0.025200 | 0.094900 | 0.023833 | 0.118467 | 0.232333 | 0.108933 | 0.222733 | 0.186000 |
| 25 | 26 | 27 | 28 | 29 | 30 | 31 | - | |
| 1.01 | 0.429367 | 0.440467 | 0.516667 | 0.455415 | 0.749433 | 0.251867 | 0.502298 | - |
| 1 | 0.565200 | 0.360100 | 0.392500 | 0.349178 | 0.057800 | 0.745767 | 0.102460 | - |
| 0.99 | 0.005433 | 0.200367 | 0.090833 | 0.195407 | 0.192800 | 0.000237 | 0.395243 | - |
Table 4.
The list of GENCOs’ generation cost for the 6 examples.
| GENCOs | The Grade of Power Quality | The Generating Costs of GENCOs | |||||
|---|---|---|---|---|---|---|---|
| 1 | 2 | 3 | 4 | 5 | 6 | ||
| GENCO.1 | k = 1 | 0.23 | 0.24 | 0.25 | 0.26 | 0.27 | 0.28 |
| k = 2 | 0.18 | 0.19 | 0.20 | 0.21 | 0.22 | 0.23 | |
| k = 3 | 0.13 | 0.14 | 0.15 | 0.16 | 0.17 | 0.18 | |
| k = 4 | 0.08 | 0.09 | 0.10 | 0.11 | 0.12 | 0.13 | |
| k = 5 | 0.03 | 0.04 | 0.05 | 0.06 | 0.07 | 0.08 | |
| GENCO.2 | k = 1 | 0.22 | 0.23 | 0.24 | 0.25 | 0.26 | 0.27 |
| k = 2 | 0.17 | 0.18 | 0.19 | 0.20 | 0.21 | 0.22 | |
| k = 3 | 0.12 | 0.13 | 0.14 | 0.15 | 0.16 | 0.17 | |
| k = 4 | 0.07 | 0.08 | 0.09 | 0.10 | 0.11 | 0.12 | |
| k = 5 | 0.02 | 0.03 | 0.04 | 0.05 | 0.06 | 0.07 | |
| GENCO.3 | k = 1 | 0.21 | 0.22 | 0.23 | 0.24 | 0.25 | 0.26 |
| k = 2 | 0.16 | 0.17 | 0.18 | 0.19 | 0.20 | 0.21 | |
| k = 3 | 0.11 | 0.12 | 0.13 | 0.14 | 0.15 | 0.16 | |
| k = 4 | 0.06 | 0.07 | 0.08 | 0.09 | 0.10 | 0.11 | |
| k = 5 | 0.01 | 0.02 | 0.03 | 0.04 | 0.05 | 0.06 | |
Table 5.
The solutions of the mixed strategy Nash equilibrium for the 6 examples.
| Case | Price Coefficient | The Probability of Coefficient Chosen by Each GENCO | ||
|---|---|---|---|---|
| GENCO.1 | GENCO.2 | GENCO.3 | ||
| Case 1 | 1.01 | 0.0389 | 0.0789 | 0.4222 |
| 1 | 0.9569 | 0.9166 | 0.4192 | |
| 0.99 | 0.0042 | 0.0045 | 0.1586 | |
| Case 2 | 1.01 | 0.5021 | 0.4419 | 0.7626 |
| 1 | 0.0000 | 0.1823 | 0.0025 | |
| 0.99 | 0.4979 | 0.3758 | 0.2349 | |
| Case 3 | 1.01 | 0.6590 | 0.0006 | 0.5205 |
| 1 | 0.0000 | 0.9991 | 0.0000 | |
| 0.99 | 0.3410 | 0.0003 | 0.4795 | |
| Case 4 | 1.01 | 1.0000 | 0.2144 | 0.5324 |
| 1 | 0.0000 | 0.7856 | 0.4676 | |
| 0.99 | 0.0000 | 0.0000 | 0.0000 | |
| Case 5 | 1.01 | 0.7467 | 0.0232 | 0.4857 |
| 1 | 0.0002 | 0.9572 | 0.0297 | |
| 0.99 | 0.2531 | 0.0196 | 0.4846 | |
| Case 6 | 1.01 | 1.0000 | 0.0000 | 0.2011 |
| 1 | 0.0000 | 1.0000 | 0.5979 | |
| 0.99 | 0.0000 | 0.0000 | 0.2011 | |
Table 6.
The converted strategy probability of GENCOs when the generation cost varies.
| Price Coefficient | The Covert Probability of Each Coefficient | |||||
|---|---|---|---|---|---|---|
| Case 1 | Case 2 | Case 3 | Case 4 | Case 5 | Case 6 | |
| 1.01 | 0.180000 | 0.568867 | 0.393367 | 0.582267 | 0.418533 | 0.400353 |
| 1 | 0.764233 | 0.061600 | 0.333033 | 0.417733 | 0.329033 | 0.532616 |
| 0.99 | 0.055767 | 0.369533 | 0.273600 | 0.000000 | 0.252433 | 0.067031 |
Table 7.
The simulation parameters when the number of GENCOs varies.
| The Grade of Power Quality | The Price of SGCC (yuan) | The Generating Costs of GENCO (yuan) | The Power Consumptions of MKT (kw·h) |
|---|---|---|---|
| k = 1 | 0.62 | 0.25 | 6000 |
| k = 2 | 0.57 | 0.20 | 7000 |
| k = 3 | 0.52 | 0.15 | 5500 |
| k = 4 | 0.47 | 0.10 | 5000 |
| k = 5 | 0.42 | 0.05 | 4500 |
Table 8.
The mixed strategy Nash equilibrium solutions when the number of GENCOs varies.
| The Number of GENCOs | The Price Coefficient | The Probability of Coefficient Chosen by Each GENCO | ||||
|---|---|---|---|---|---|---|
| GENCO.1 | GENCO.2 | GENCO.3 | GENCO.4 | GENCO.5 | ||
| m = 2 | 1.01 | 0.8714 | 0.2561 | - | - | - |
| 1 | 0.1174 | 0.6703 | - | - | - | |
| 0.99 | 0.0111 | 0.0735 | - | - | - | |
| m = 3 | 1.01 | 0.0012 | 0.2258 | 0.8954 | - | - |
| 1 | 0.9988 | 0.6972 | 0.0477 | - | - | |
| 0.99 | 0.0000 | 0.0769 | 0.0569 | - | - | |
| m = 4 | 1.01 | 0.3578 | 0.0353 | 0.6014 | 0.5575 | - |
| 1 | 0.4676 | 0.9484 | 0.0504 | 0.0737 | - | |
| 0.99 | 0.1746 | 0.0163 | 0.3482 | 0.3689 | - | |
| m = 5 | 1.01 | 0.6763 | 0.6213 | 0.4397 | 0.4693 | 0.6661 |
| 1 | 0.2599 | 0.0048 | 0.2351 | 0.0686 | 0.2206 | |
| 0.99 | 0.0638 | 0.3739 | 0.3251 | 0.4621 | 0.1133 | |
Table 9.
The converted strategy probability when the number of GENCOs varies.
| The Price Coefficient | The Covert Probability of Each Coefficient | |||
|---|---|---|---|---|
| m = 2 | m = 3 | m = 4 | m = 5 | |
| 1.01 | 0.563750 | 0.374133 | 0.388000 | 0.574540 |
| 1 | 0.393850 | 0.581233 | 0.385025 | 0.157800 |
| 0.99 | 0.042300 | 0.044600 | 0.227000 | 0.267640 |
Table 10.
The price strategies of all power suppliers in the cross-regional game.
| Power Suppliers | Strategies | The Price of Each Power Supplier | ||||
|---|---|---|---|---|---|---|
| k = 1 | k = 2 | k = 3 | k = 4 | k = 5 | ||
| SGCC | 1 | 0.65 | 0.60 | 0.55 | 0.45 | 0.35 |
| 2 | 0.63 | 0.58 | 0.49 | 0.40 | 0.33 | |
| GENCO.1 | 1 | 0.64 | 0.58 | 0.52 | 0.42 | 0.33 |
| 2 | 0.62 | 0.56 | 0.48 | 0.39 | 0.32 | |
| GENCO.2 | 1 | 0.62 | 0.56 | 0.46 | 0.38 | 0.32 |
| 2 | 0.61 | 0.55 | 0.44 | 0.35 | 0.30 | |
| GENCO.3 | 1 | 0.61 | 0.55 | 0.45 | 0.36 | 0.30 |
| 2 | 0.60 | 0.53 | 0.44 | 0.35 | 0.28 | |
| GENCO.4 | 1 | 0.61 | 0.54 | 0.45 | 0.35 | 0.30 |
| 2 | 0.59 | 0.52 | 0.42 | 0.33 | 0.28 | |
| GENCO.5 | 1 | 0.60 | 0.53 | 0.45 | 0.35 | 0.28 |
| 2 | 0.59 | 0.52 | 0.42 | 0.33 | 0.26 | |
| GENCO.6 | 1 | 0.59 | 0.53 | 0.43 | 0.35 | 0.28 |
| 2 | 0.58 | 0.50 | 0.40 | 0.32 | 0.25 | |
© 2017 by the authors. Licensee MDPI, Basel, Switzerland. This article is an open access article distributed under the terms and conditions of the Creative Commons Attribution (CC BY) license (http://creativecommons.org/licenses/by/4.0/).
Share and Cite
MDPI and ACS Style
Zang, T.; Xiang, Y.; Yang, J. The Tripartite Game Model for Electricity Pricing in Consideration of the Power Quality. Energies 2017, 10, 2025. https://doi.org/10.3390/en10122025
AMA Style
Zang T, Xiang Y, Yang J. The Tripartite Game Model for Electricity Pricing in Consideration of the Power Quality. Energies. 2017; 10(12):2025. https://doi.org/10.3390/en10122025
Chicago/Turabian StyleZang, Tianlei, Yueping Xiang, and Jianwei Yang. 2017. "The Tripartite Game Model for Electricity Pricing in Consideration of the Power Quality" Energies 10, no. 12: 2025. https://doi.org/10.3390/en10122025
Note that from the first issue of 2016, this journal uses article numbers instead of page numbers. See further details here.