Multiscale Modeling of a Packed Bed Chemical Looping Reforming (PBCLR) Reactor †

1
Department of Energy and Process Engineering, Norwegian University of Science and Technology (NTNU), NO-7491 Trondheim, Norway
2
Department of Chemical Engineering, University of Coimbra, Rua Sílvio Lima, Polo II, 3030-790 Coimbra, Portugal
3
SINTEF Materials and Chemistry, Flow Technology Department, S. P. Andersens veg 15 B, NO-7031 Trondheim, Norway
*
Author to whom correspondence should be addressed.
†
This article is an extension of the recently published conference paper in Energy Procedia.
Energies 2017, 10(12), 2056; https://doi.org/10.3390/en10122056
Submission received: 31 October 2017
/
Revised: 29 November 2017
/
Accepted: 1 December 2017
/
Published: 5 December 2017
(This article belongs to the Special Issue Selected Papers from ICEER 2017: 2017 the 4th International Conference on Energy and Environment Research)
Abstract
:Packed bed reactors are broadly used in industry and are under consideration for novel reactor concepts such as packed bed chemical looping reforming (PBCLR). Mass and heat transfer limitations in and around the particles in packed bed reactors strongly affect the behavior of these units. This study employs a multiscale modeling methodology to simulate a PBCLR reactor. Specifically, small-scale particle-resolved direct numerical simulation is utilized to improve large-scale mass transfer models for use in an industrial scale 1D model. Existing intra-particle mass transfer models perform well for simple first order reactions, but several model enhancements were required to model the more complex steam methane reforming reaction system. Three specific aspects required enhanced modeling: the generation of additional gas volume by the reforming reactions, the lack of clear reaction orders in the equilibrium reactions, and the diffusion of multiple reactant species into the particle. Large-scale simulations of the PBCLR reactor with the enhanced 1D model showed that the highly reactive Ni-based catalyst/oxygen carrier employed allows for the use of large particle sizes and high gas flowrates, offering potential for process intensification.
1. Introduction
Packed beds are broadly deployed in the chemical and process industry, with a wide variety of uses in adsorption, heat exchangers, chemical reforming, etc. Gas–solid reaction systems in packed beds can be classified under heterogeneous catalytic and/or non-catalytic reactions. Packed beds generally use relatively large particles to minimize pressure drop over the reactor. These large particles result in significant mass and heat transfer limitations affecting the reactor performance. Significant research efforts have been invested over several decades to correctly model these limitations in catalytic and non-catalytic reactions, the latter being more complex as the solid is altered in the reactions [1].
With the development in the field of computational resources, it is now possible to obtain resolved 3D CFD simulations of flow around arrays of packed particles to directly simulate these mass and heat transfer limitations. Particle resolved direct numerical simulations (PR-DNS) provides insight into the local phenomena of velocities and void fractions in packed beds, which cannot be obtained from experiments. There have been several studies on intra particle diffusion, but most of these studies used the particles as the porous regions [2,3,4,5,6]. A detailed review of several studies on intra particle diffusion is given by Dixon [7] in a recent work with 3D CFD simulations for heterogeneous catalytic reactions in a tube packed bed (3 ≤ N ≤ 10). Dixon [7] included reactions inside the catalytic particle for the endothermic steam methane reforming (SMR) reaction.
The objective of the current work is to utilize multiscale modeling to improve the accuracy of 1D models for a packed bed process running SMR reactions. Firstly, PR-DNS is used on a geometry of ~100 densely packed mono-disperse spherical particles (ε = 0.355) extracted according to the methodology outlined in our previous works [8,9,10]. Secondly, the PR-DNS results are used to improve a computationally affordable 1D packed bed model [10,11,12,13] which is based on appropriate models for effectiveness factor [14] and external heat and mass transfer [8]. This method does not resolve any gradients inside the particles as is done in the models utilizing the colocation method [7,15]. As a result, the model is very fast so that it can be conveniently used for large-scale transient simulations of processes such as the packed bed chemical looping reforming (PBCLR) reactor investigated in this work.
In essence, the PBCLR concept is an SMR reactor where the catalyst also acts as an oxygen carrier used in a typical chemical looping combustion reactor. The oxygen carrier material can be reduced by fuel and subsequently oxidized by air to facilitate fuel combustion without any direct contact between N2 and CO2. In this way, the PBCLR process supplies heat to the endothermic SMR reactions by combusting fuel with integrated CO2 capture. Given that the heat is directly stored in the catalyst/oxygen carrier particles, the process also achieves perfect heat transfer from fuel combustion to the SMR reactions.
The process configuration incorporating the PBCLR reactors will be similar to the gas switching reforming (GSR) reactor concept previously investigated by the authors [16,17], with the main difference being the use of packed beds instead of fluidized beds. As in the GSR concept, a cluster of several dynamically operated PBCLR reactors will be required to create a steady state process unit. The efficient GSR process configuration for pure hydrogen production can also utilize PBCLR reactors. Specifically, process efficiency is maximized by feeding the off-gas fuel from the pressure swing adsorption (PSA) unit back to the fuel stage of the PBCLR reactors, thus ensuring complete fuel conversion and CO2 capture with no direct energy penalty.
2. Methodology
2.1. PR-DNS Setup
The realistically packed bed geometry of monodisperse spherical particles (ε = 0.355) is generated using the discrete element method (DEM) in ANSYS FLUENT as explained in detail in our previous works [8,10]. The geometry is meshed with polyhedral elements using FLUENT Meshing both inside and outside the particles with a cell size of dp/30 on the particle surfaces. A growth rate of 20% is used to propagate the mesh into the domain. More detail can be obtained from previous work of the authors [8,9,10,11,13].
The SMR reaction takes place inside the porous particles (grain model [18]) according to Equations (1)–(3). The simulation parameters used are given in Table 1. The reactions were modeled using the kinetic model of Langmuir–Hinshelwood proposed by Xu and Froment [19] with appropriate kinetic and equilibrium constants from [20]. Simulations are completed for three different values for inlet temperature (Table 1). The molecular diffusivity and gas thermal conductivity are obtained according to the kinetic theory of gases.
2.2. 1D Packed Bed Model
The 1D model setup used is developed considering 100 cells in one direction with solid phase velocity fixed to zero in all these cells. The model is consistent with the previous work of the authors [10,11,12,13]. The closures [8,14] represented in Equations (4)–(7) are used in conjunction with the same reaction kinetics and boundary conditions as the PR-DNS simulation. The Thiele modulus (φ) represents the ratio of kinetic rate to diffusion rate, so higher values represent greater mass transfer limitation. The effective diffusivity (𝐷𝑒) is composed of the molecular diffusivity (𝐷), the internal void fraction of porous particles (ε = 0.3) and the tortuosity (τ = 1). In realistic cases, tortuosity will be greater than 1, but, since tortuosity cannot be directly resolved in PR-DNS, it was omitted by setting τ = 1. A more realistic tortuosity of τ = 3 was used in the large scale simulations of the PBCLR reactor presented at the end of the paper.
In comparison to the previous work [10,13], four important complications are introduced: multiple reactions, multiple reactants per reaction, the generation of gas volume during the reaction, and reactions without a clear reaction order. However, the effect of multiple reactions is not so important because the overall steam methane reforming (OSMR) (R × 3) reaction is much faster than the others. Comparisons between the PR-DNS and 1D modeling showed that the remaining three effects required adjustments to the 1D model to yield accurate results. In this way, results from the PR-DNS scale were used to propose model improvements to increase the accuracy of large scale 1D simulations. The resulting enhanced 1D model was then used to simulate a large scale packed bed chemical looping reforming (PBCLR) reactor.
The complexity of the catalytic SMR reactions involving gas volume generation and reactions without a clear reaction order posed the most important challenge. The standard intra-particle mass transfer model (Equation (6)), was derived for a simple first order reaction without any gas volume generation, and significant adjustments were necessary to achieve accurate results in the more complex SMR reaction system. The reaction rate expression for the OSMR reaction, which is about an order of magnitude faster than the others, is given below as an example [19].
The OSMR reaction can be viewed as approximately first order with respect to CH4 and second order with respect to H2O. With this in mind, Thiele moduli (i.e., Equation (5)) can be calculated from approximate reaction rate constants defined by dividing the reaction rate by the appropriate reactant species concentrations:
The challenge posed by this practice is that the reaction rate constants, , defined in this manner vary with the species concentration, especially when the hydrogen partial pressure ( in Equation (8)), is low (due to in the denominator). As a result, this approximation of the reaction rate constant will generally decrease towards the center of the particle as more H2 is formed by CH4 and H2O diffusing into the particle. The mass transfer model (Equation (6)) assumes a reaction rate constant that actually remains constant with changing reactant concentrations (in an isothermal particle) and will therefore overpredict the effective reaction rate in this case.
This reaction rate overprediction is further augmented by the generation of additional gas volume by the SMR (Equation (1)) and OSMR (Equation (3)) reactions. Additional volume of lighter gases will create a density gradient inside the particle with lower densities in the particle center. A gradual decrease in gas density within the particle slows down the diffusive flux of the incoming reactants. This effect is not accounted for in the standard mass transfer model (Equation (6)) and will therefore lead to further overpredictions of the effective reaction rate.
Comparisons between PR-DNS and 1D model results revealed that these effective reaction rate overpredictions can be accurately accounted for by adjusting the effective diffusivity for use in the calculation of the Thiele modulus (Equation (5)). To account for the gas volume generation, dedicated PR-DNS simulations revealed that the effective diffusivity simply needs to be multiplied by the ratio of the gas density of reaction products to reactants. For example, the ratio is 0.5 for the SMR reaction (2 moles of reactants yield 4 moles of products) and 0.6 for the OSMR reaction (3 moles of reactants yield 5 moles of products). This adjustment (Equation (12)) will lower the effective diffusivity in reactions with gas volume generation, leading to a higher Thiele modulus and a lower effectiveness factor.
The sensitivity of the approximated reaction rate constant to reactant concentrations at low values of required a similar adjustment. In this case, it was found that an almost perfect match to PR-DNS data could be achieved if the effective diffusivity in the OSMR reaction is adjusted by the factor , thus increasing the effective mass transfer resistance at low values of where the reaction rate constants defined in Equations (10) and (11) will decrease rapidly towards the inside of the partilcle. Thus, the effective diffusivity in the OSMR reaction is defined as follows:
Finally, PR-DNS results revealed that it is important to account for the intra-particle diffusion resistance of multiple reacting species. This could be accomplished by simply treating the effectiveness factors calculated for individual reactants via Equation (6) as parallel resistances:
Experience also showed that the heat transfer rate (described by Equation (4)) had to be multiplied by a factor to match well with PR-DNS results. The modification factor () becomes necessary because of the multifluid approach followed in the simulations. The multifluid approach is a convenient method for this problem, but it models the solid and fluid phase as interpenetrating continua and can therefore lead to numerical inacuracies when the volume fraction field changes abruptly (as is the case on the surface of the particles).
Because of this numerical challenge, the external heat transfer rate was significantly underpredicted by the PR-DNS simualtions using the multifluid approach relative to a PR-DNS simulation where particle surfaces are designated as walls [8,9]. This required the use of the factor,, when comparing the PR-DNS and 1D simulation results. The generalised correlation for obtaining the modification factor based on the Reynolds number is fitted as shown in Figure 1 represented by . The equation is valid up to Reynolds number (Re < 200) and for the packed bed with particle void fraction (~0.35), used in this work.
3. Results
3.1. PR-DNS Results
Contour plots for methane mole fraction and temperature are shown in Figure 2. The effects of heat and mass transfer limitations are clearly visible. A gradual species concentration gradient is visible inside the particles (Figure 2, left) signifying an internal mass transfer limitation. However, the temperature inside the particles is relatively uniform (Figure 2, right), implying that external heat transfer limitations dominate.
3.2. Comparison of 1D Model to PR-DNS Results
Figure 3 illustrates the influence of the 1D model adjustments proposed from PR-DNS through this multiscale modeling exercise. Clearly, use of the standard intra-particle mass transfer model (Equations (5)–(7)) results in substantial overpredictions of the effective reaction rate. This is evident from the dotted lines in Figure 3 showing that methane is consumed and hydrogen is produced too rapidly. The temperature also drops too rapidly due to the overprediction of the endothermic reaction rate.
When the effect of gas volume generation Equation (12) is included and the effectiveness factor is calculated from the parallel mass transfer resistances (Equation (14)) instead of only the reactant with the highest Thiele modulus, the solution improves markedly. The dashed lines in Figure 3 show that these adjustments still show significant deviations in the slopes of the curves at the start of the domain, while the slopes become similar further away from the inlet. This implies that the reaction rate close to the inlet remains too high.
In this region, the hydrogen mole fration is low, emphasizing the effect of the varying reaction rate constant as defined in Equations (10) and (11). The solid lines in Figure 3 show that the adjustment to the effective diffusivity proposed in Equation (13) with the model coefficient set to 0.2 resulted in an excellent match to the PR-DNS results. These results show that this fully adjusted model is generally accurate over a wide range of temperatures and gas species concentrations. The Thiele moduli (Equation (5)) and effectiveness factors (Equation (6)) in the three cases varied over wide ranges ( and ) proving that the model accurately describes a broad range of intra-particle mass transfer resistances in the SMR reaction system.
3.3. The Packed Bed Chemical Looping Reforming Process
The mass transfer model from the previous sections (solid lines in Figure 3) is employed to simulate the behavior of an industrial scale packed bed chemical looping reforming (PBCLR) reactor. One important difference from the small scale comparison in the previous section is that the tortuosity was set to a more realistic value of 3 to increase the mass transfer resistance simulated in the PBCLR reactor. As mentioned in the discussion of Figure 3, the proposed model enhancements perform well over a wide range of Thiele moduli and effectiveness factors. Good accuracy can therefore also be expected in this case where the Thiele modulus would be moderately increased by a factor of by increasing the tortuosity from 1 to 3 in Equation (7). In addition, the modification to the heat transfer correlation that was required only for comparison to the PR-DNS results (Figure 1) is not included in this large scale simulation.
As outlined in the introduction, the PBCLR process consists of three stages: oxidation with air, reduction with residual fuel from the PSA unit, and reforming of methane with steam. The PBCLR process is very similar in nature to the packed bed chemical looping combustion (PBCLC) process [12,21]. The primary difference between PBCLR and PBCLC is that the heat from fuel combustion is used for the endothermic reforming reaction (PBCLR) instead of driving a gas turbine for power production (PBCLC).
Heterogeneous reactions occurring in the oxidation and reduction stages are described by the kinetics for Ni40Al-FG oxygen carrier given in Abad et al. [22]. These extremely fast reactions are moderated by the mass transfer limitation model presented in Yang et al. [15]. Even with this mass transfer limitation, the overall reaction rate of this highly active oxygen carrier remained very high and had to be lowered by an additional order of magnitude to allow for reasonably large time steps in the simulation with 5 mm particles (Figure 4 and Figure 5). This artificial lowering of the reaction rate did not have a significant influence on the results because the reactions remained fast enough to create almost perfect plug-flow behavior of the reactor during these two stages. Note that this artificial modification was not required for the final simulation with 20 mm particles (Figure 6) due to the larger mass transfer limitation in this case.
Boundary conditions for the reactor simulation are given in Table 2. Gas flow rates were selected to keep the maximum reactor pressure drop below 1 bar (the classic Ergun pressure drop equation [23] was employed). Other important simulation information is summarized in Table 3. In addition, the effective thermal conductivity model of Tsotsas et al. [24] was implemented and that the heat capacities of Ni, NiO and Al2O3 were implemented as functions of temperature based on data from Robie et al. [25].
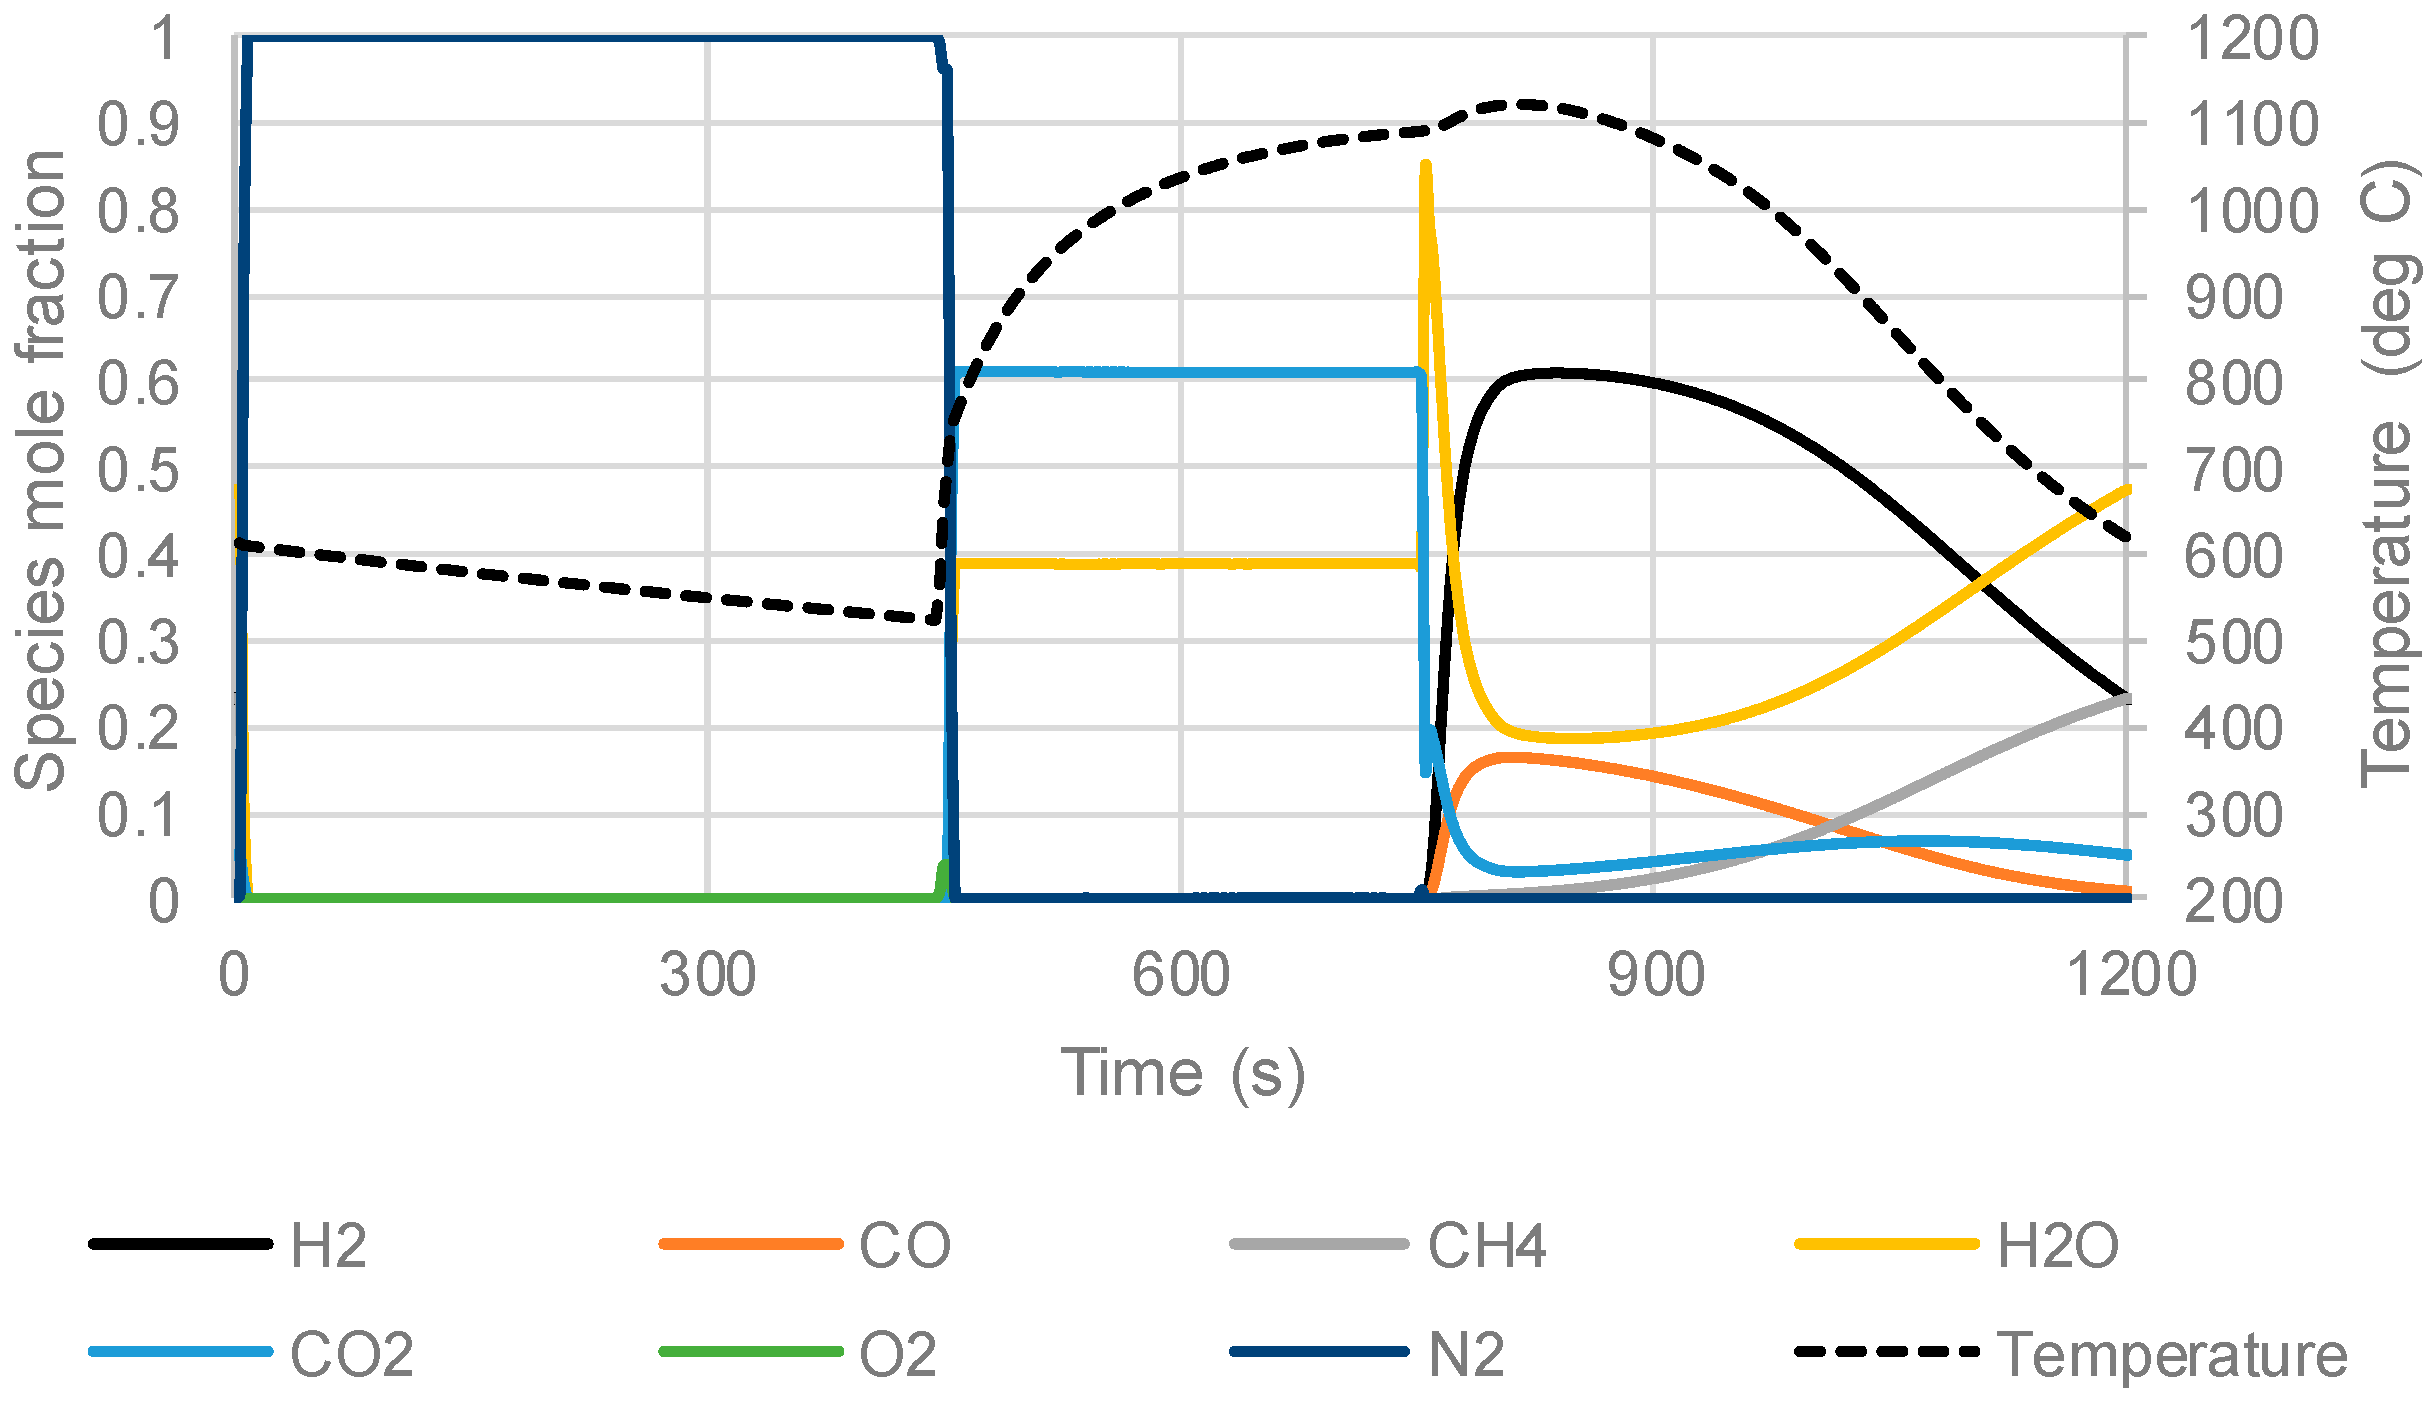
Transient outlet gas stream composition and temperature from one cycle of oxidation, reduction and reforming stages are shown in Figure 4. The first 900 s of the cycle is the oxidation stage where all the oxygen in the incoming air is consumed and only nitrogen exits the reactor. Even though a lot of heat is released from the exothermic oxidation reaction, the outlet gas temperature remains relatively low due to the plug-flow nature of the PBCLR reactor.
The reduction stage takes place during the next 600 s of the cycle. All the incoming fuel gases are converted to CO2 and H2O during this stage and the heat generated during the preceding oxidation stage starts to exit the reactor.
Finally, the reforming stage takes place in the final 900 s of the cycle. As shown just after 1500 s in Figure 4, the first few seconds of the reforming stage still yields combustion products (CO2 and H2O) because the oxygen carrier was not fully reduced at the end of the preceding reduction stage. Full reduction of the oxygen carrier in the reduction stage can lead to some fuel slip that will reduce process efficiency and reduce CO2 purity. During the remainder of the reforming stage, the oxygen carrier is fully reduced and catalyses the steam methane reforming reactions.
The temperature close to the reactor outlet primarily influences the outlet gas composition during the reforming stage. During the first ~600 s of the reforming stage, the temperature in this region of the reactor is high, leading to almost complete methane conversion and high hydrogen yield. However, the last ~300 s of the reforming stage sees a substantial drop in the temperature close to the reactor outlet, leading to much lower methane conversion. Ideally, the reforming stage would be stopped before this drop in conversion occurs, but the reactor must be cooled down before the next oxidation stage to prevent overheating of the oxygen carrier. Fortunately, the PBCLR process can afford a substantial amount of fuel slip during reforming because the unconverted methane is returned to the reduction stage of the PBCLR reactor from the PSA unit.
For more insight into the reactor behavior, Figure 5 shows axial reactor profiles at various points in the cycle. As outlined earlier, most of the reactor is hot at the end of the oxidation stage, but the heat generated during the reaction has not yet reached the reactor outlet. At the end of the reduction stage, the axial profiles show that catalytic reactions take place in the part of the reactor that is fully reduced (<8 m) and the resulting reformed fuel gases react rapidly in a narrow reaction front just after 8 m.
During the reforming stage, the gas composition closely tracks the local oxygen carrier temperature. Higher temperatures lead to a higher equilibrium conversion and more heat consumption by the endothermic reforming reactions. As a result, the reactor is cooled down by the reforming reactions in a plug-flow manner. However, Figure 5 shows that the temperature gradient developing in the bed during the reforming stage is not very sharp. This causes the large amount of unconverted methane shown at the end of the cycle in Figure 4 as the reforming stage must be continued until the end of the reactor is at a low enough temperate to accommodate the large temperature rise in the subsequent oxidation stage.
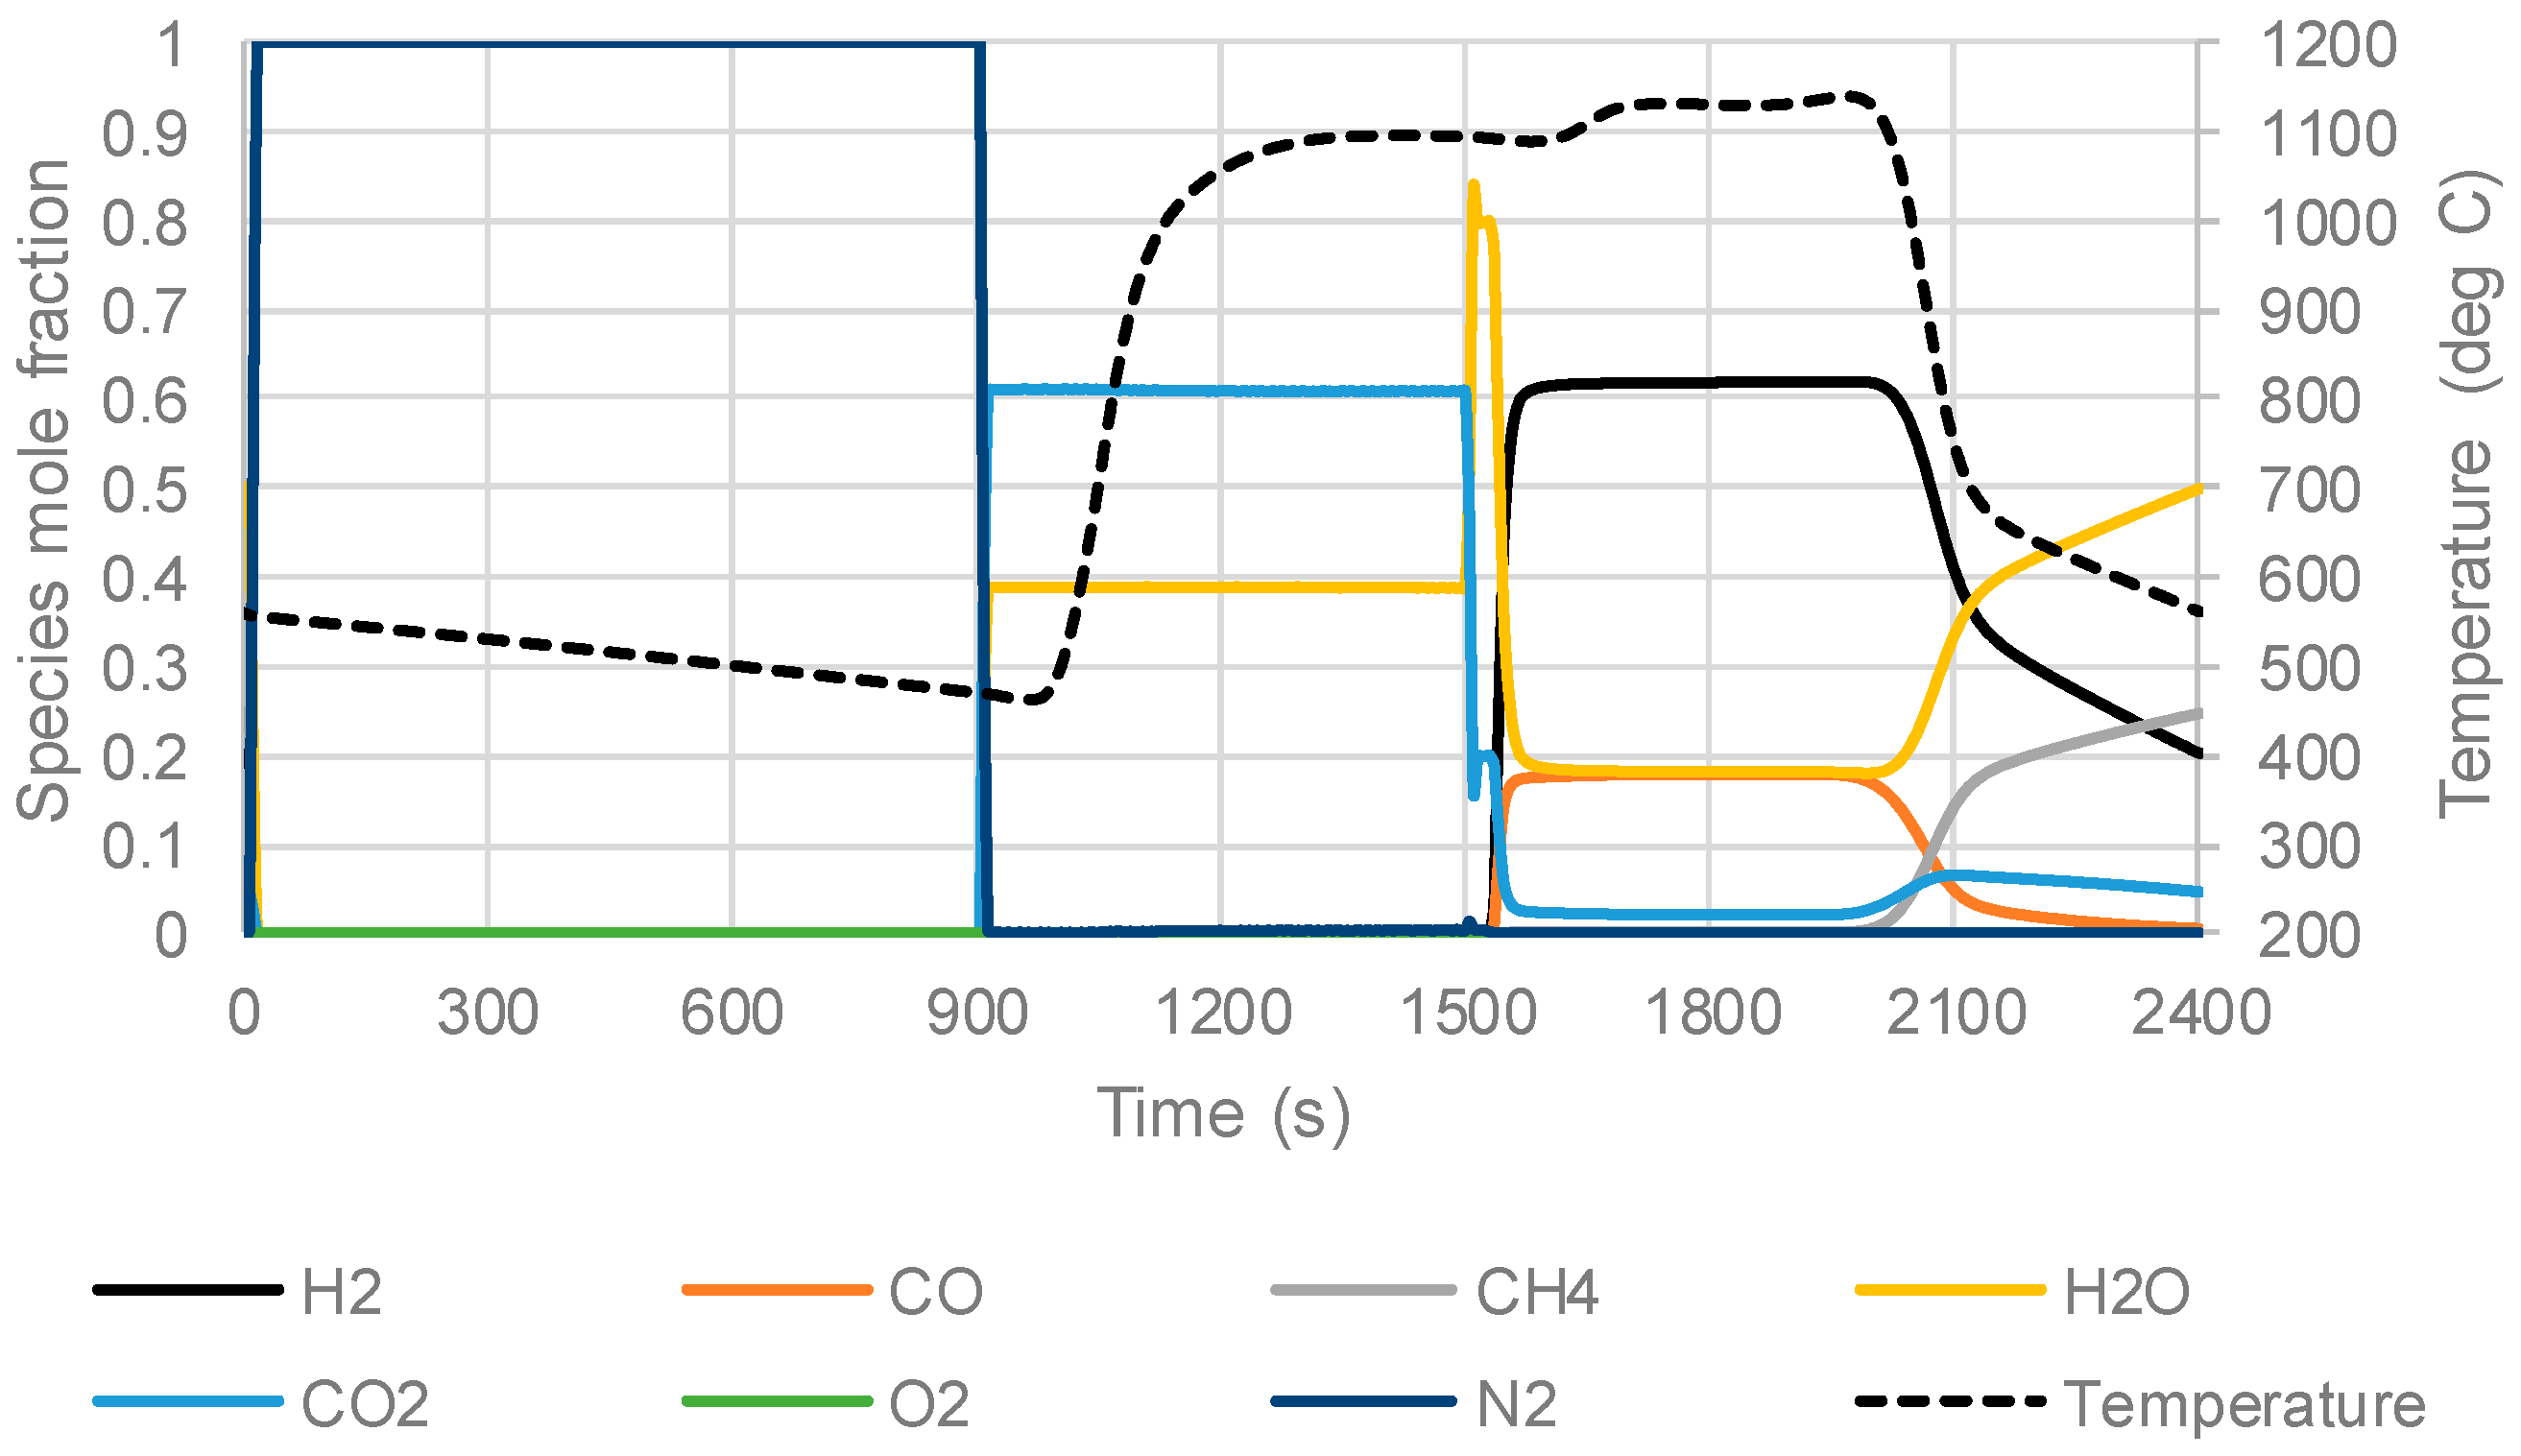
Another clear feature in Figure 5 is that, despite the significant mass transfer limitations implemented, the reforming reactions are generally fast enough to get very close to the equilibrium conversion at all points in the reactor. This can be observed from the very strong correlation between the hydrogen mole fraction and the temperature. For this reason, the PBCLR reactor can be designed with substantially larger particles, allowing for a larger gas flowrate. To investigate this possibility, the simulation was repeated with gas feed rates double the values given in Table 2 and a particle size that is quadruple the value given in Table 3 (20 mm). This modification allows the pressure drop to stay roughly constant. In addition, the stage times in Table 2 were halved to accommodate the doubling in the gas feed rates.
The resulting outlet gas composition and temperature profiles are plotted in Figure 6. In comparison to Figure 4, the very fast redox reactions ensure that the oxidation and reduction stages are almost unchanged, aside from a slight increase in the average outlet temperature. This increased temperature is the result of less reaction occurring in the reforming stage to consume heat.
The increased mass transfer limitations in the reforming stage are more clearly visible. In general, methane slip starts significantly earlier than was the case in Figure 4, and the maximum rate of change in species and temperature outlet profiles is smaller. However, even with such very large particles, the reaction rate remains quite high, allowing for good conversion of the incoming fuel. PBCLR using a highly reactive Ni-based oxygen carrier can therefore benefit from significant process intensification via high gas throughput rates and, possibly, shorter reactors.
Acknowledgments
This work is part of a European Union project under Seventh research framework program (FP7/2007-2013) under grant agreement No. 604656 called NanoSim—a multi-scale Simulation based design platform for Cost effective CO2 capture Processes using Nano-structured materials. The authors are grateful to European Research Council for its support. Additionally, the computational resources at NTNU provided by NOTUR, http://www.notur.no, were used during this project. This work is an extension of the work presented at ICEER2017 and has been published in Energy Procedia.
Author Contributions
Arpit Singhal and Schalk Cloete conceived and designed the idea for multiscale modeling and performed the simulations; Rosa Quinta-Ferreira and Shahriar Amini helped in the review of the paper and contributed to certain improvements; Arpit Singhal wrote the paper.
Conflicts of Interest
The authors declare no conflict of interest.
Nomenclature
| Greek Symbols | |
| α | Volume fraction |
| ε | Void fraction |
| φ | Thiele modulus (Th) |
| Effectiveness factor | |
| ρ | Density (kg/m3) |
| Latin Symbols | |
| a | Characteristic length of spherical particle (rp/3) |
| Cp | Specific heat capacity of gas [J/kg·K] |
| Ea | Activation energy [J/mol] |
| he | effective heat transfer coefficient [W/m2·K] |
| k0 | Arrhenius constant [1/s] |
| kg | Thermal conductivity of gas [W/m·K] |
| Nu | Nusselt number (h dp/kg) |
| P | Pressure [Pa], 1 bar = 101,325 Pa |
| Pr | Prandtl number (μ Cp/kg) |
| R | Gas constant [8.314 J/mol/K] |
| r | Radius [m] |
| Re | Reynolds number (ρ us dp/μ) |
| Sc | Schmidt number (μ/ρ D) |
| T | Temperature [K] |
| us | Superficial velocity of the gas [m/s] |
| xi | Mass fraction of species i |
| yi | Mole fraction of species i |
| Sub/superscripts | |
| g | Gas |
| p | Particle |
References
- Ramachandran, P.A.; Doraiswamy, L.K. Modeling of noncatalytic gas-solid reactions. AIChE J. 1982, 28, 881–900. [Google Scholar] [CrossRef]
- Karthik, G.M.; Buwa, V.V. Effect of particle shape on fluid flow and heat transfer for methane steam reforming reactions in a packed bed. AIChE J. 2017, 63, 366–377. [Google Scholar] [CrossRef]
- Augier, F.; Idoux, F.; Delenne, J.Y. Numerical simulations of transfer and transport properties inside packed beds of spherical particles. Chem. Eng. Sci. 2010, 65, 1055–1064. [Google Scholar] [CrossRef]
- Dixon, A.G.; Nijemeisland, M.; Stitt, H. CFD simulation of reaction and heat transfer near the wall of a fixed bed. Int. J. Chem. React. Eng. 2003. [Google Scholar] [CrossRef]
- Magnico, P. Pore-scale simulations of unsteady flow and heat transfer in tubular fixed beds. AIChE J. 2009, 55, 849–867. [Google Scholar] [CrossRef]
- Nijemeisland, M.; Dixon, A.G.; Hugh Stitt, E. Catalyst design by cfd for heat transfer and reaction in steam reforming. Chem. Eng. Sci. 2004, 59, 5185–5191. [Google Scholar] [CrossRef]
- Dixon, A.G. Local transport and reaction rates in a fixed bed reactor tube: Endothermic steam methane reforming. Chem. Eng. Sci. 2017, 168, 156–177. [Google Scholar] [CrossRef]
- Singhal, A.; Cloete, S.; Radl, S.; Quinta-Ferreira, R.; Amini, S. Heat transfer to a gas from densely packed beds of monodisperse spherical particles. Chem. Eng. J. 2017, 314, 27–37. [Google Scholar] [CrossRef]
- Singhal, A.; Cloete, S.; Radl, S.; Quinta-Ferreira, R.; Amini, S. Heat transfer to a gas from densely packed beds of cylindrical particles. Chem. Eng. Sci. 2017, 172, 1–12. [Google Scholar] [CrossRef]
- Singhal, A.; Cloete, S.; Radl, S.; Quinta-Ferreira, R.; Amini, S. Comparison of particle-resolved direct numerical simulation and 1d modelling of catalytic reactions in a packed bed. In Progress in Applied CFD—CFD2017, Proceedings of the 12th International Conference on CFD in Oil & Gas, Metallurgical and Process Industries, Trondheim, Norway, 30 May–1 June 2017; SINTEF Academic Press: Oslo, Norway, 2017; pp. 667–674. [Google Scholar]
- Singhal, A.; Cloete, S.; Quinta-Ferreira, R.; Amini, S. Multiscale modelling of packed bed chemical looping reforming. Energy Procedia 2017, 136, 349–355. [Google Scholar] [CrossRef]
- Cloete, S.; Gallucci, F.; van Sint Annaland, M.; Amini, S. Gas switching as a practical alternative for scaleup of chemical looping combustion. Energy Technol. 2016, 4, 1286–1298. [Google Scholar] [CrossRef]
- Singhal, A.; Cloete, S.; Quinta-Ferreira, R.; Amini, S. Comparison of particle-resolved direct numerical simulation and 1d modelling of catalytic reactions in a cylindrical particle bed. In Proceedings of the V International Conference on Particle-Based Methods, Fundamentals and Applications, Hannover, Germany, 26–28 September 2017; International Center for Numerical Methods in Engineering (CIMNE): Barcelona, Spain, 2017; pp. 802–812. [Google Scholar]
- Levenspiel, O. Chemical Reaction Engineering, 3rd ed.; John Wiley & Sons: New York, NY, USA, 1999. [Google Scholar]
- Yang, W.; Cloete, S.; Morud, J.; Amini, S. An effective reaction rate model for gas-solid reactions with high intra-particle diffusion resistance. Int. J. Chem. React. Eng. 2016, 14, 331–342. [Google Scholar] [CrossRef]
- Francisco Morgado, J.; Cloete, S.; Morud, J.; Gurker, T.; Amini, S. Modelling study of two chemical looping reforming reactor configurations: Looping vs. Switching. Powder Technol. 2016, 316, 599–613. [Google Scholar] [CrossRef]
- Wassie, S.A.; Gallucci, F.; Zaabout, A.; Cloete, S.; Amini, S.; van Sint Annaland, M. Hydrogen production with integrated CO2 capture in a novel gas switching reforming reactor: Proof-of-concept. Int. J. Hydrogen Energy 2017, 42, 14367–14379. [Google Scholar] [CrossRef]
- Szekely, J.; Evans, J.W.; Sohn, H.Y. Gas-Solid Reactions; Academic Press: New York, NY, USA, 1976; p. 612. [Google Scholar]
- Xu, J.; Froment, G.F. Methane steam reforming, methanation and water-gas shift: I. Intrinsic kinetics. AIChE J. 1989, 35, 88–96. [Google Scholar] [CrossRef]
- Oliveira, E.L.G.; Grande, C.A.; Rodrigues, A.E. Methane steam reforming in large pore catalyst. Chem. Eng. Sci. 2010, 65, 1539–1550. [Google Scholar] [CrossRef]
- Noorman, S.; van Sint Annaland, M.; Kuipers, J.A.M. Packed bed reactor technology for chemical-looping combustion. Ind. Eng. Chem. Res. 2007, 46, 4212–4220. [Google Scholar] [CrossRef]
- Abad, A.; Adánez, J.; García-Labiano, F.; de Diego, L.F.; Gayán, P.; Celaya, J. Mapping of the range of operational conditions for Cu-, Fe-, and Ni-based oxygen carriers in chemical-looping combustion. Chem. Eng. Sci. 2007, 62, 533–549. [Google Scholar] [CrossRef] [Green Version]
- Ergun, S. Fluid flow through packed columns. Chem. Eng. Prog. 1952, 48, 89–94. [Google Scholar]
- Tsotsas, E.; Martin, H. Thermal conductivity of packed beds: A review. Chem. Eng. Process. Process Intensif. 1987, 22, 19–37. [Google Scholar] [CrossRef]
- Robie, R.A.; Hemingway, B.S. Thermodynamic Properties of Minerals and Related Substances at 298.15 k and 1 Bar (105 Pascals) Pressure and at Higher Temperatures; Series Number 2131; U.S. Geological Survey: Washington, DC, USA, 1995.
Figure 1.
Modification factor fitted over a range of Reynolds number for packed bed of spherical particles (with particle void fraction of 0.35).
Figure 1.
Modification factor fitted over a range of Reynolds number for packed bed of spherical particles (with particle void fraction of 0.35).
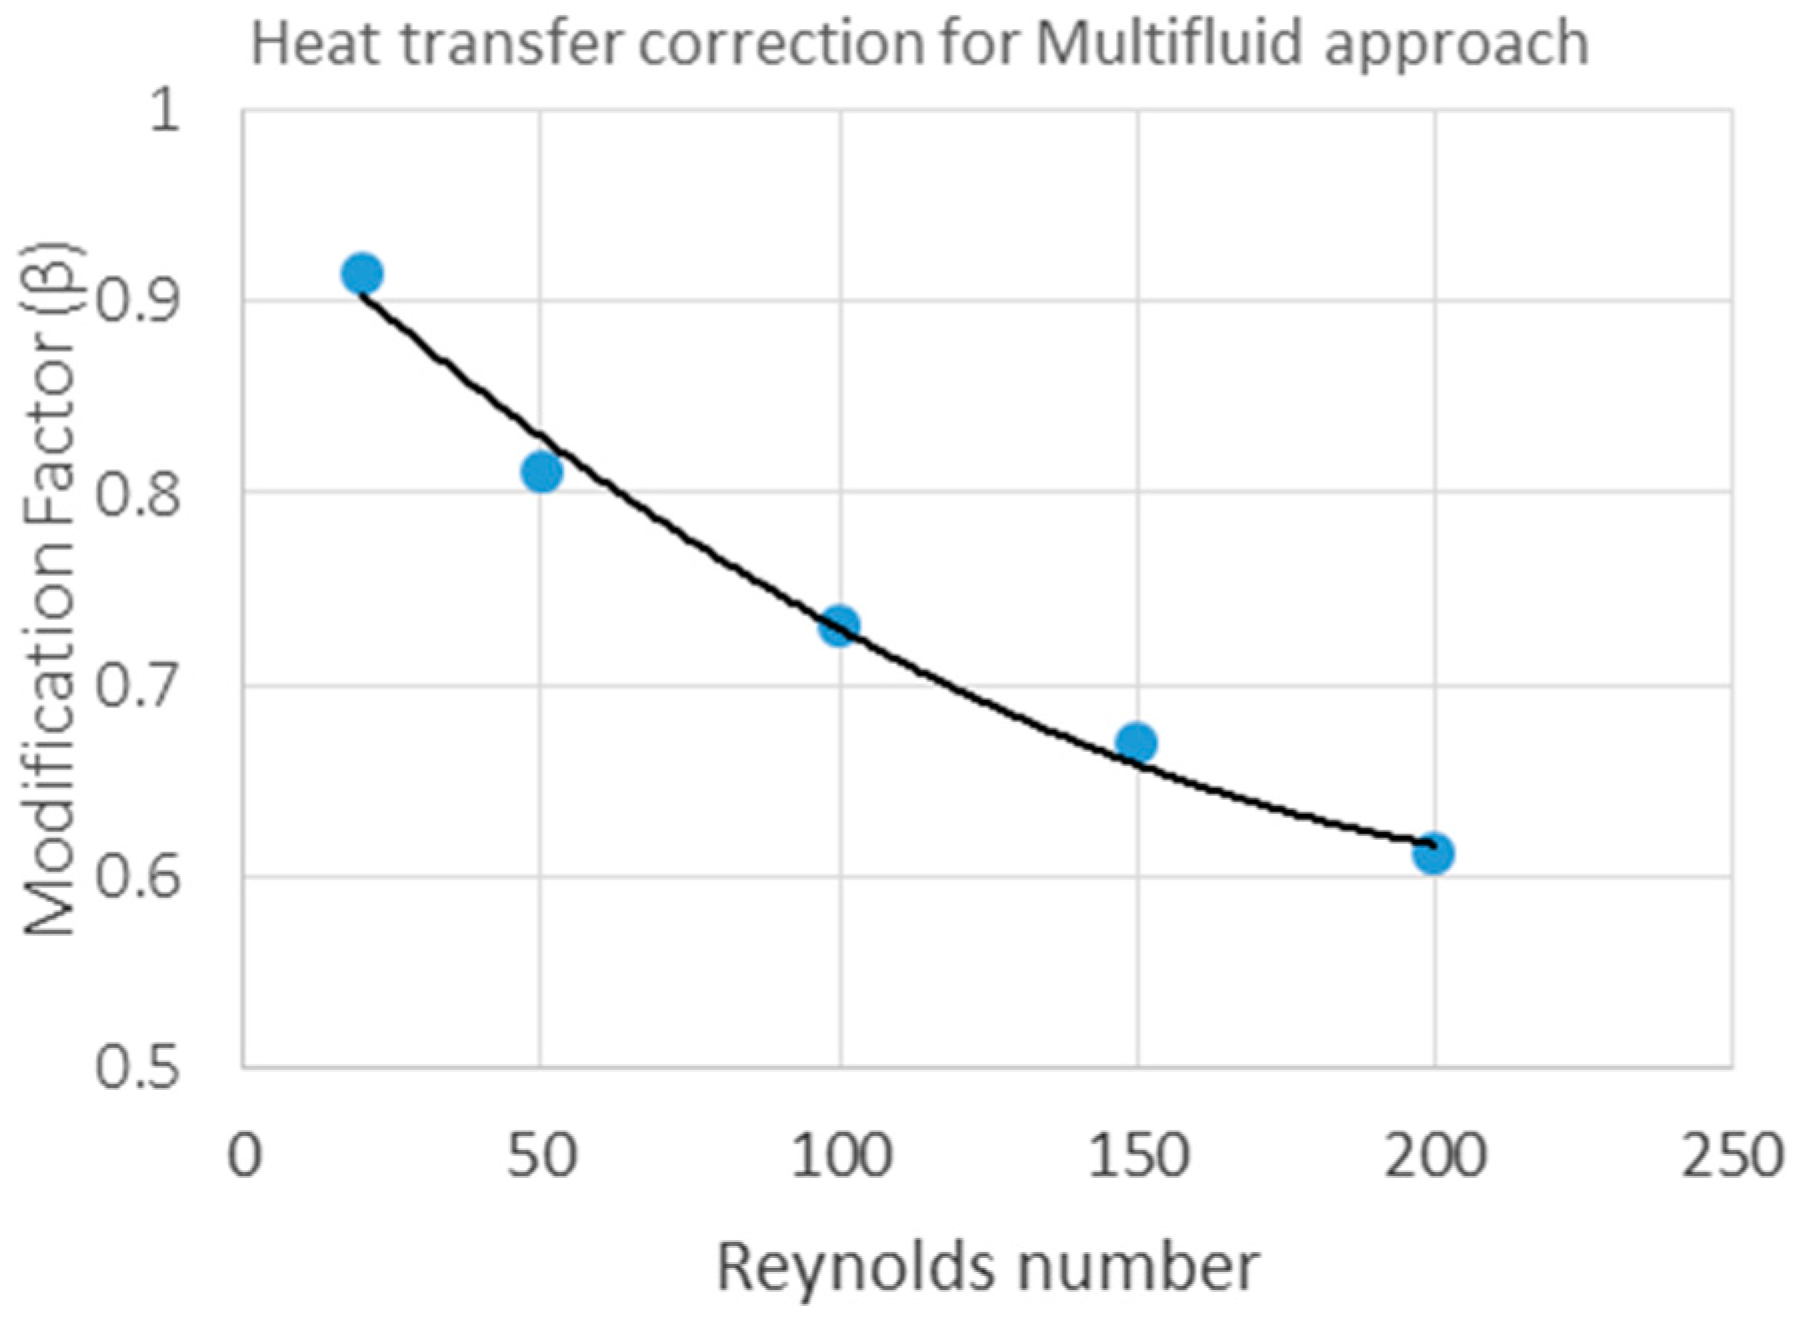
Figure 2.
Particle resolved direct numerical simulation (PR-DNS) results for molar concentration of CH4 (left); and gas temperature (K) variation at 1000 °C (1273 K) inlet temperature (right).
Figure 2.
Particle resolved direct numerical simulation (PR-DNS) results for molar concentration of CH4 (left); and gas temperature (K) variation at 1000 °C (1273 K) inlet temperature (right).
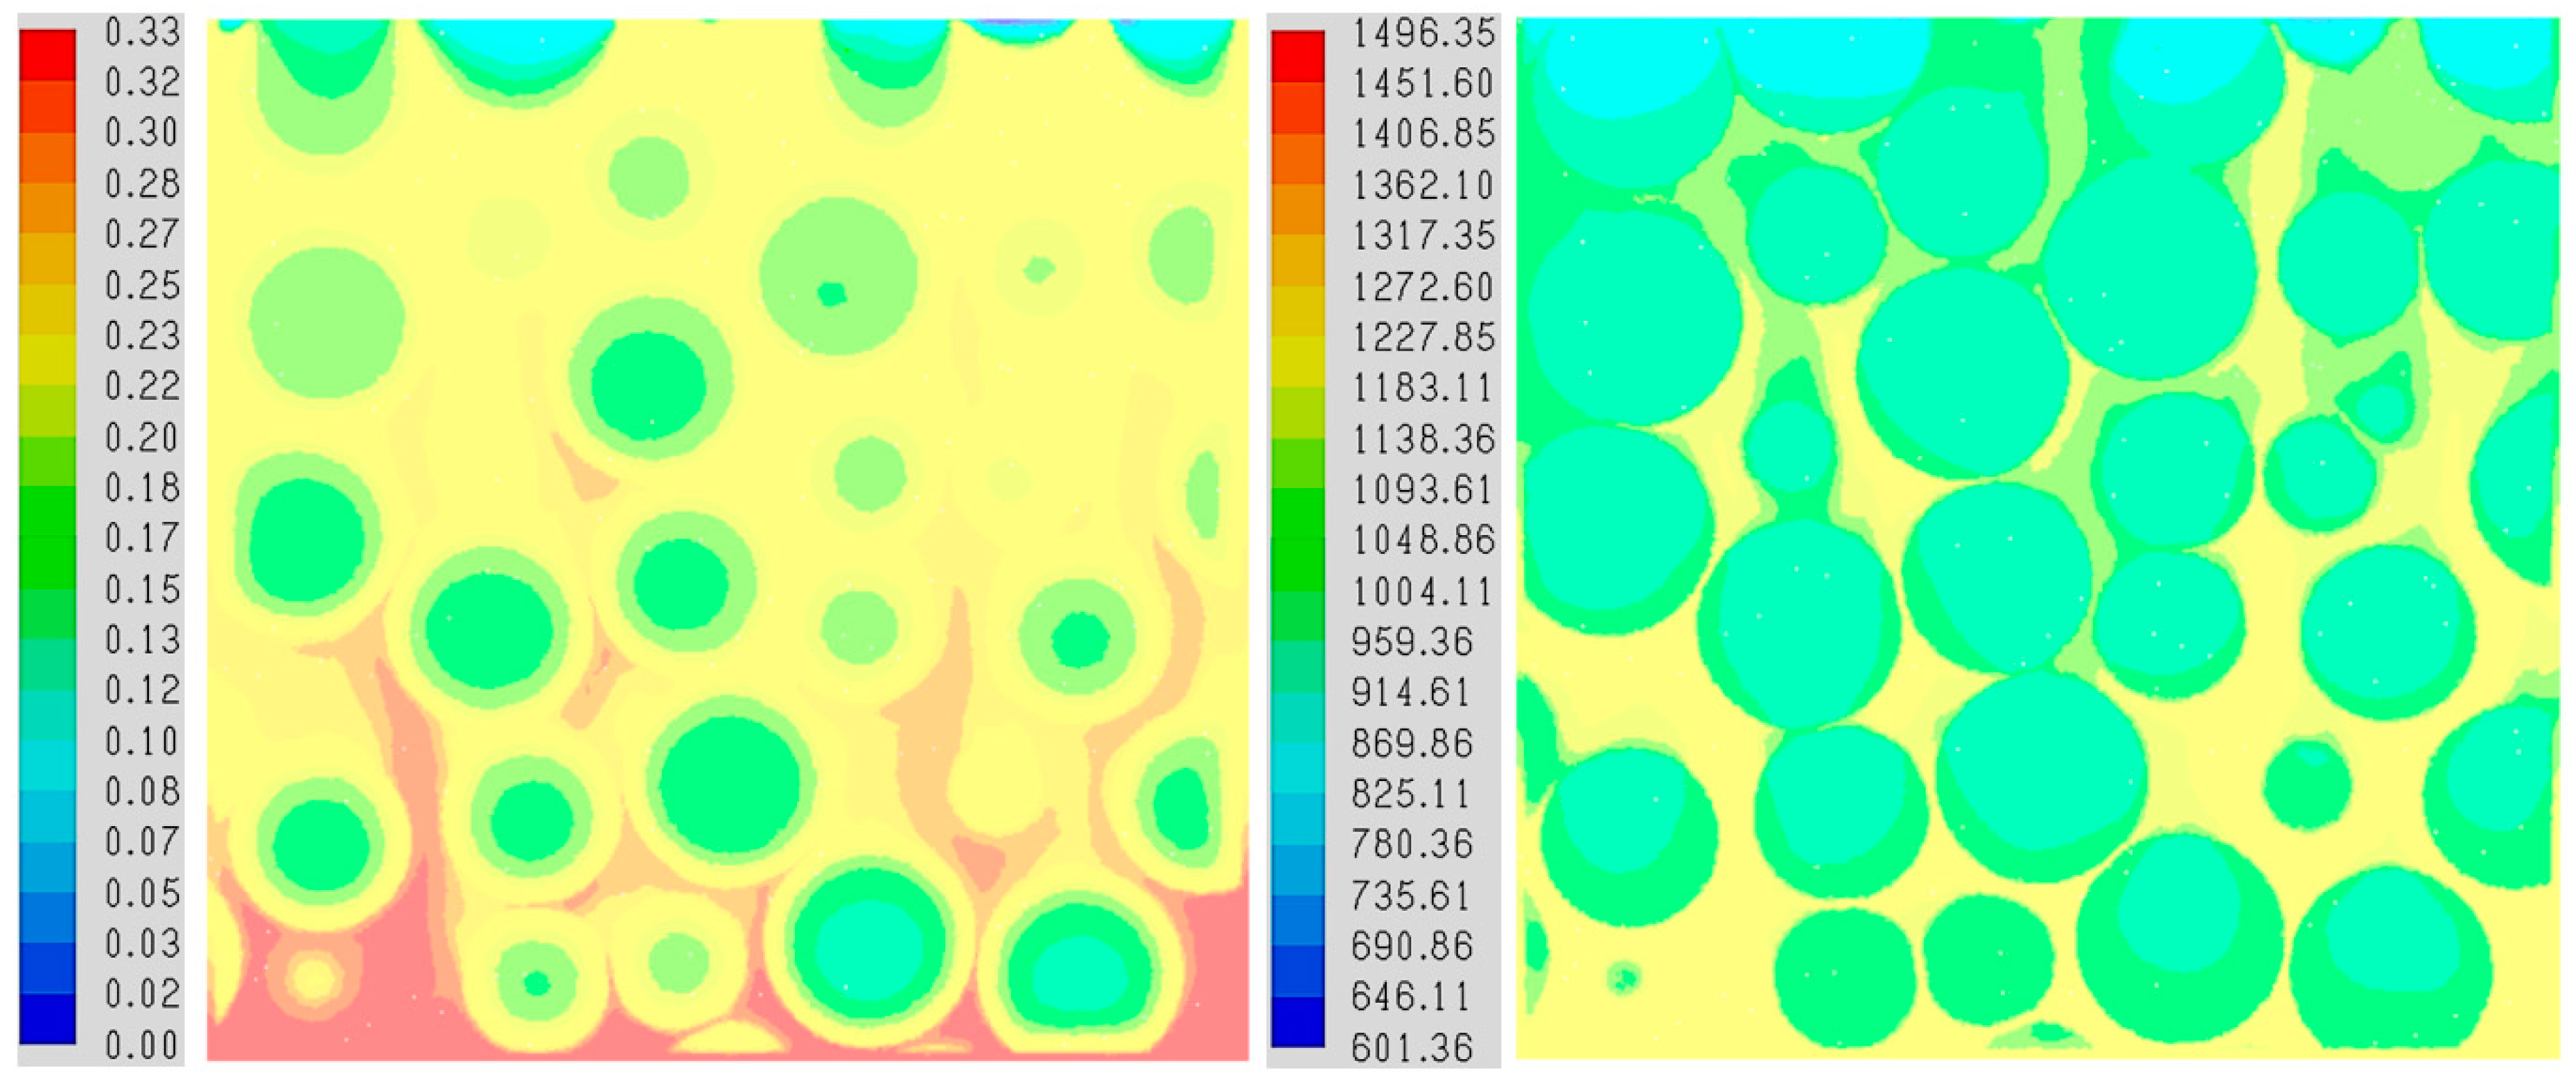
Figure 3.
Comparisons of different 1D model formulations to PR-DNS data at three different inlet temperatures. In each graph, the circles represent the PR-DNS results, the solid lines represent the full 1D model with all the proposed adjustments, the dashed lines represent the exclusion of the adjustment for the varying reaction rate constant (Equation (13)), and the dotted lines represent the exclusion of all model adjustments (Equations (12)–(14)).
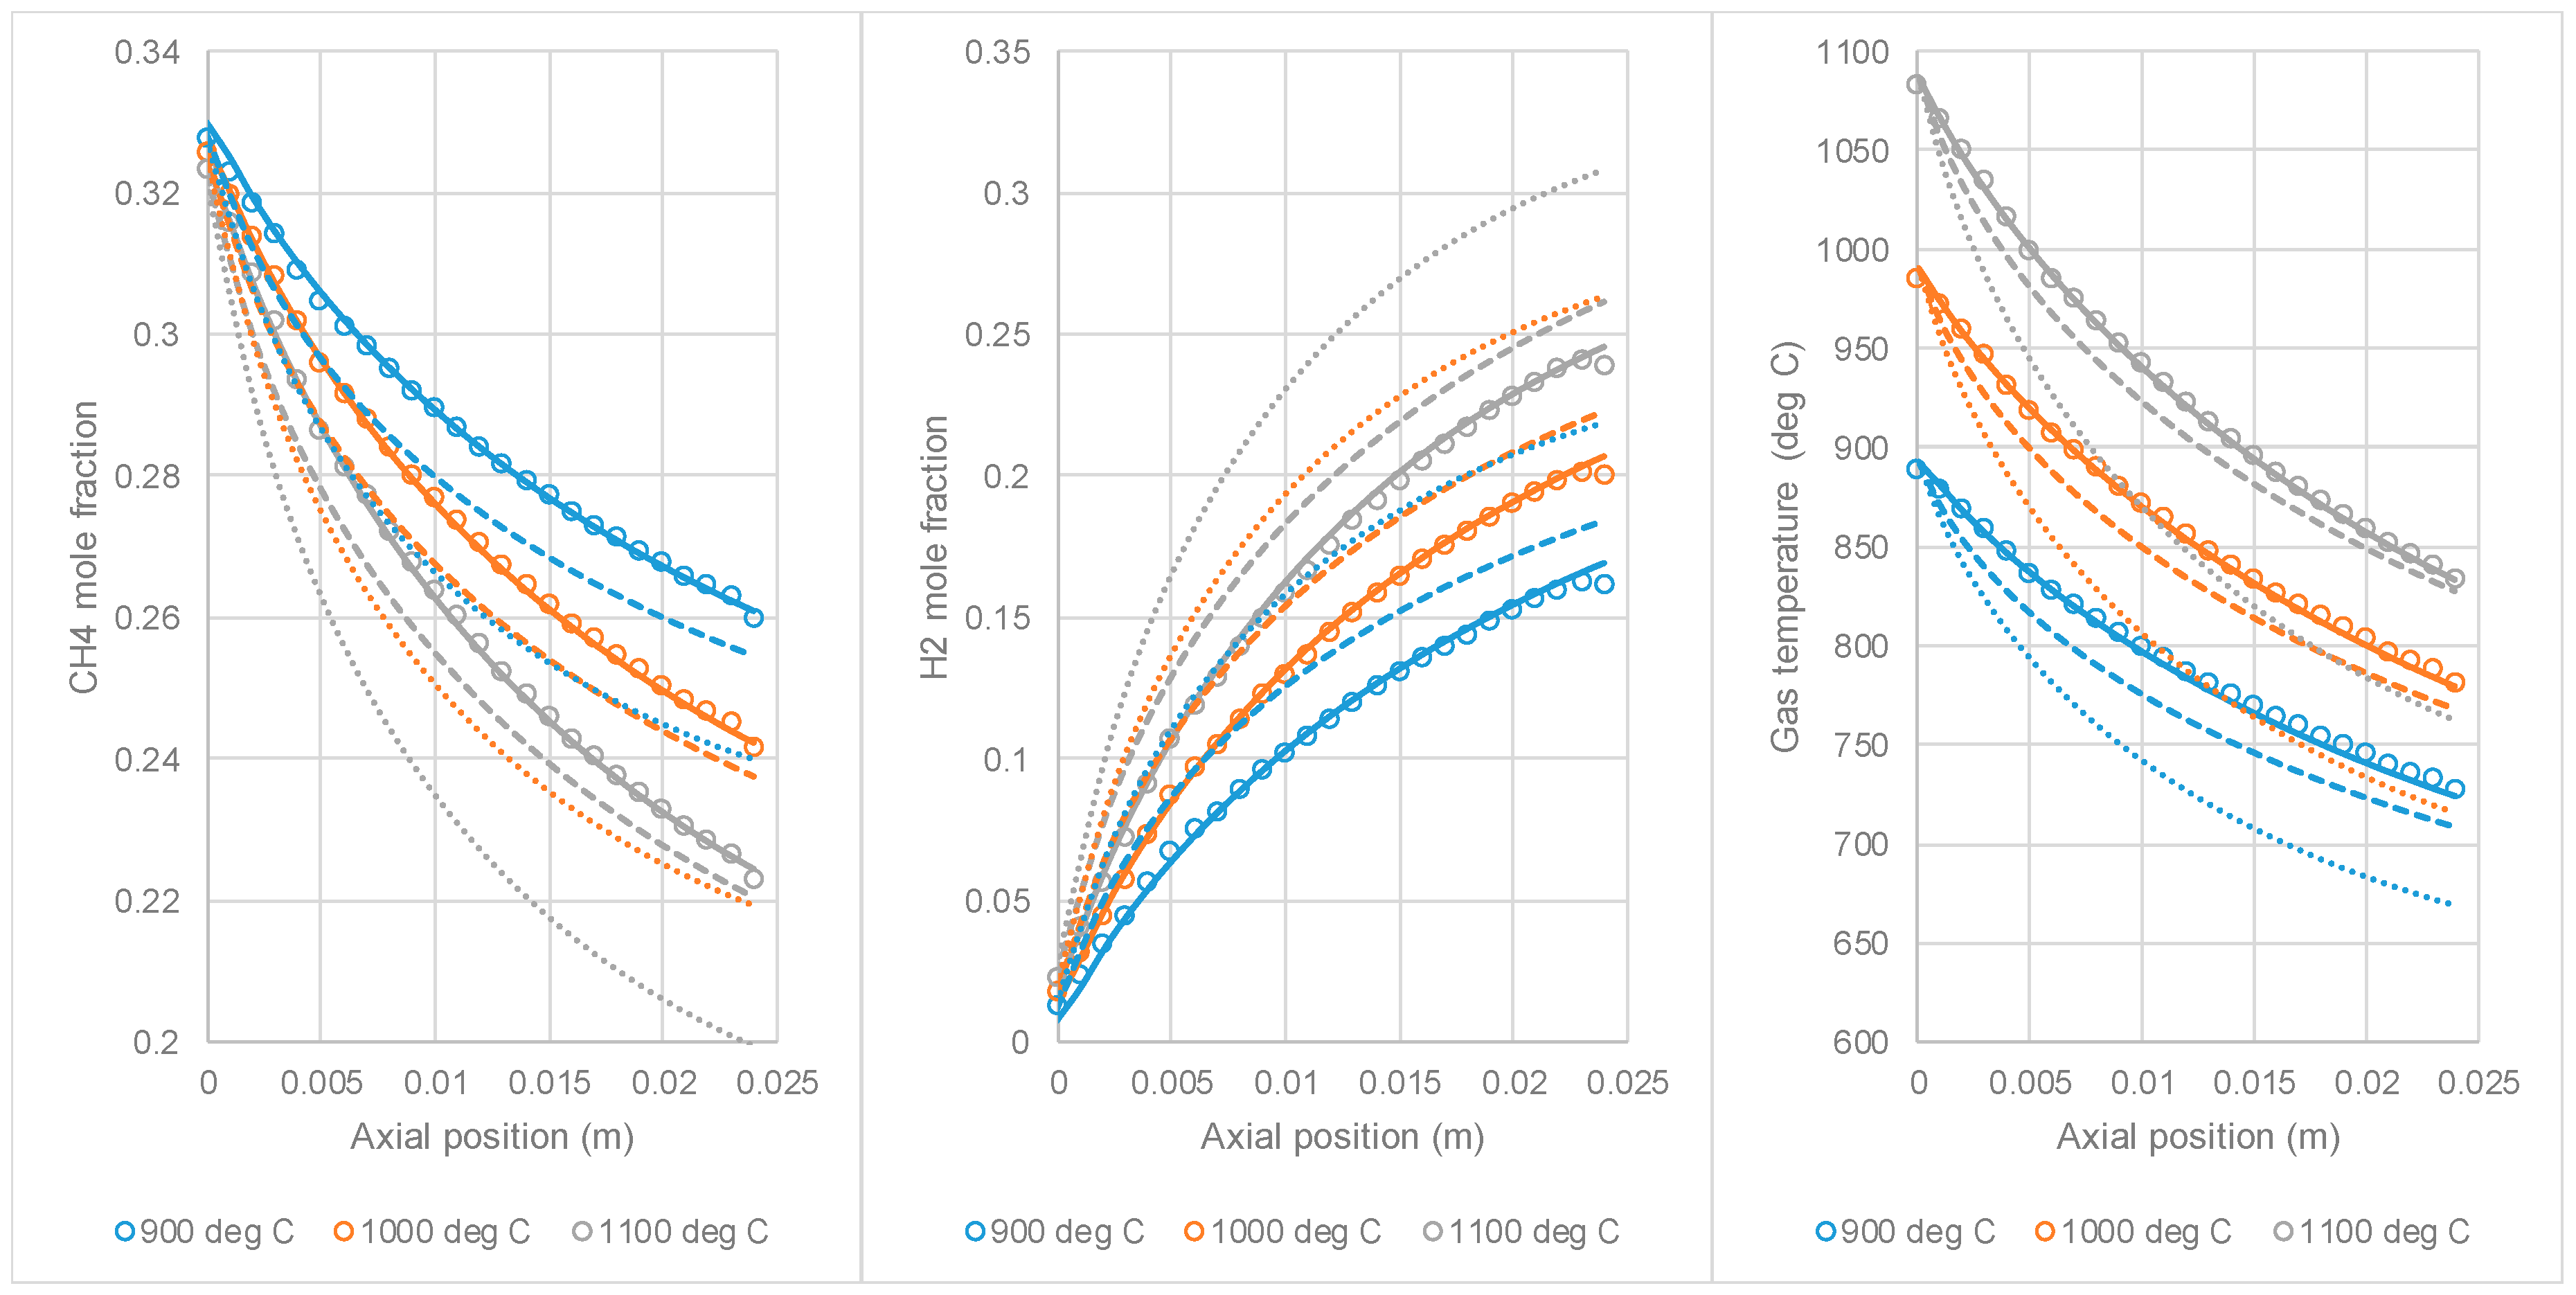
Figure 4.
Outlet gas species composition and temperature during one PBCLR cycle.

Figure 5.
Axial profiles of species and temperature in the PBCLR reactor at: the end of the oxidation stage [top left—900 s in Figure 4]; end of the reduction stage [top right—1500 s in Figure 4]; middle of the reforming stage [bottom left—1950 s in Figure 4]; and end of the reforming stage [bottom right—2400 s in Figure 4].
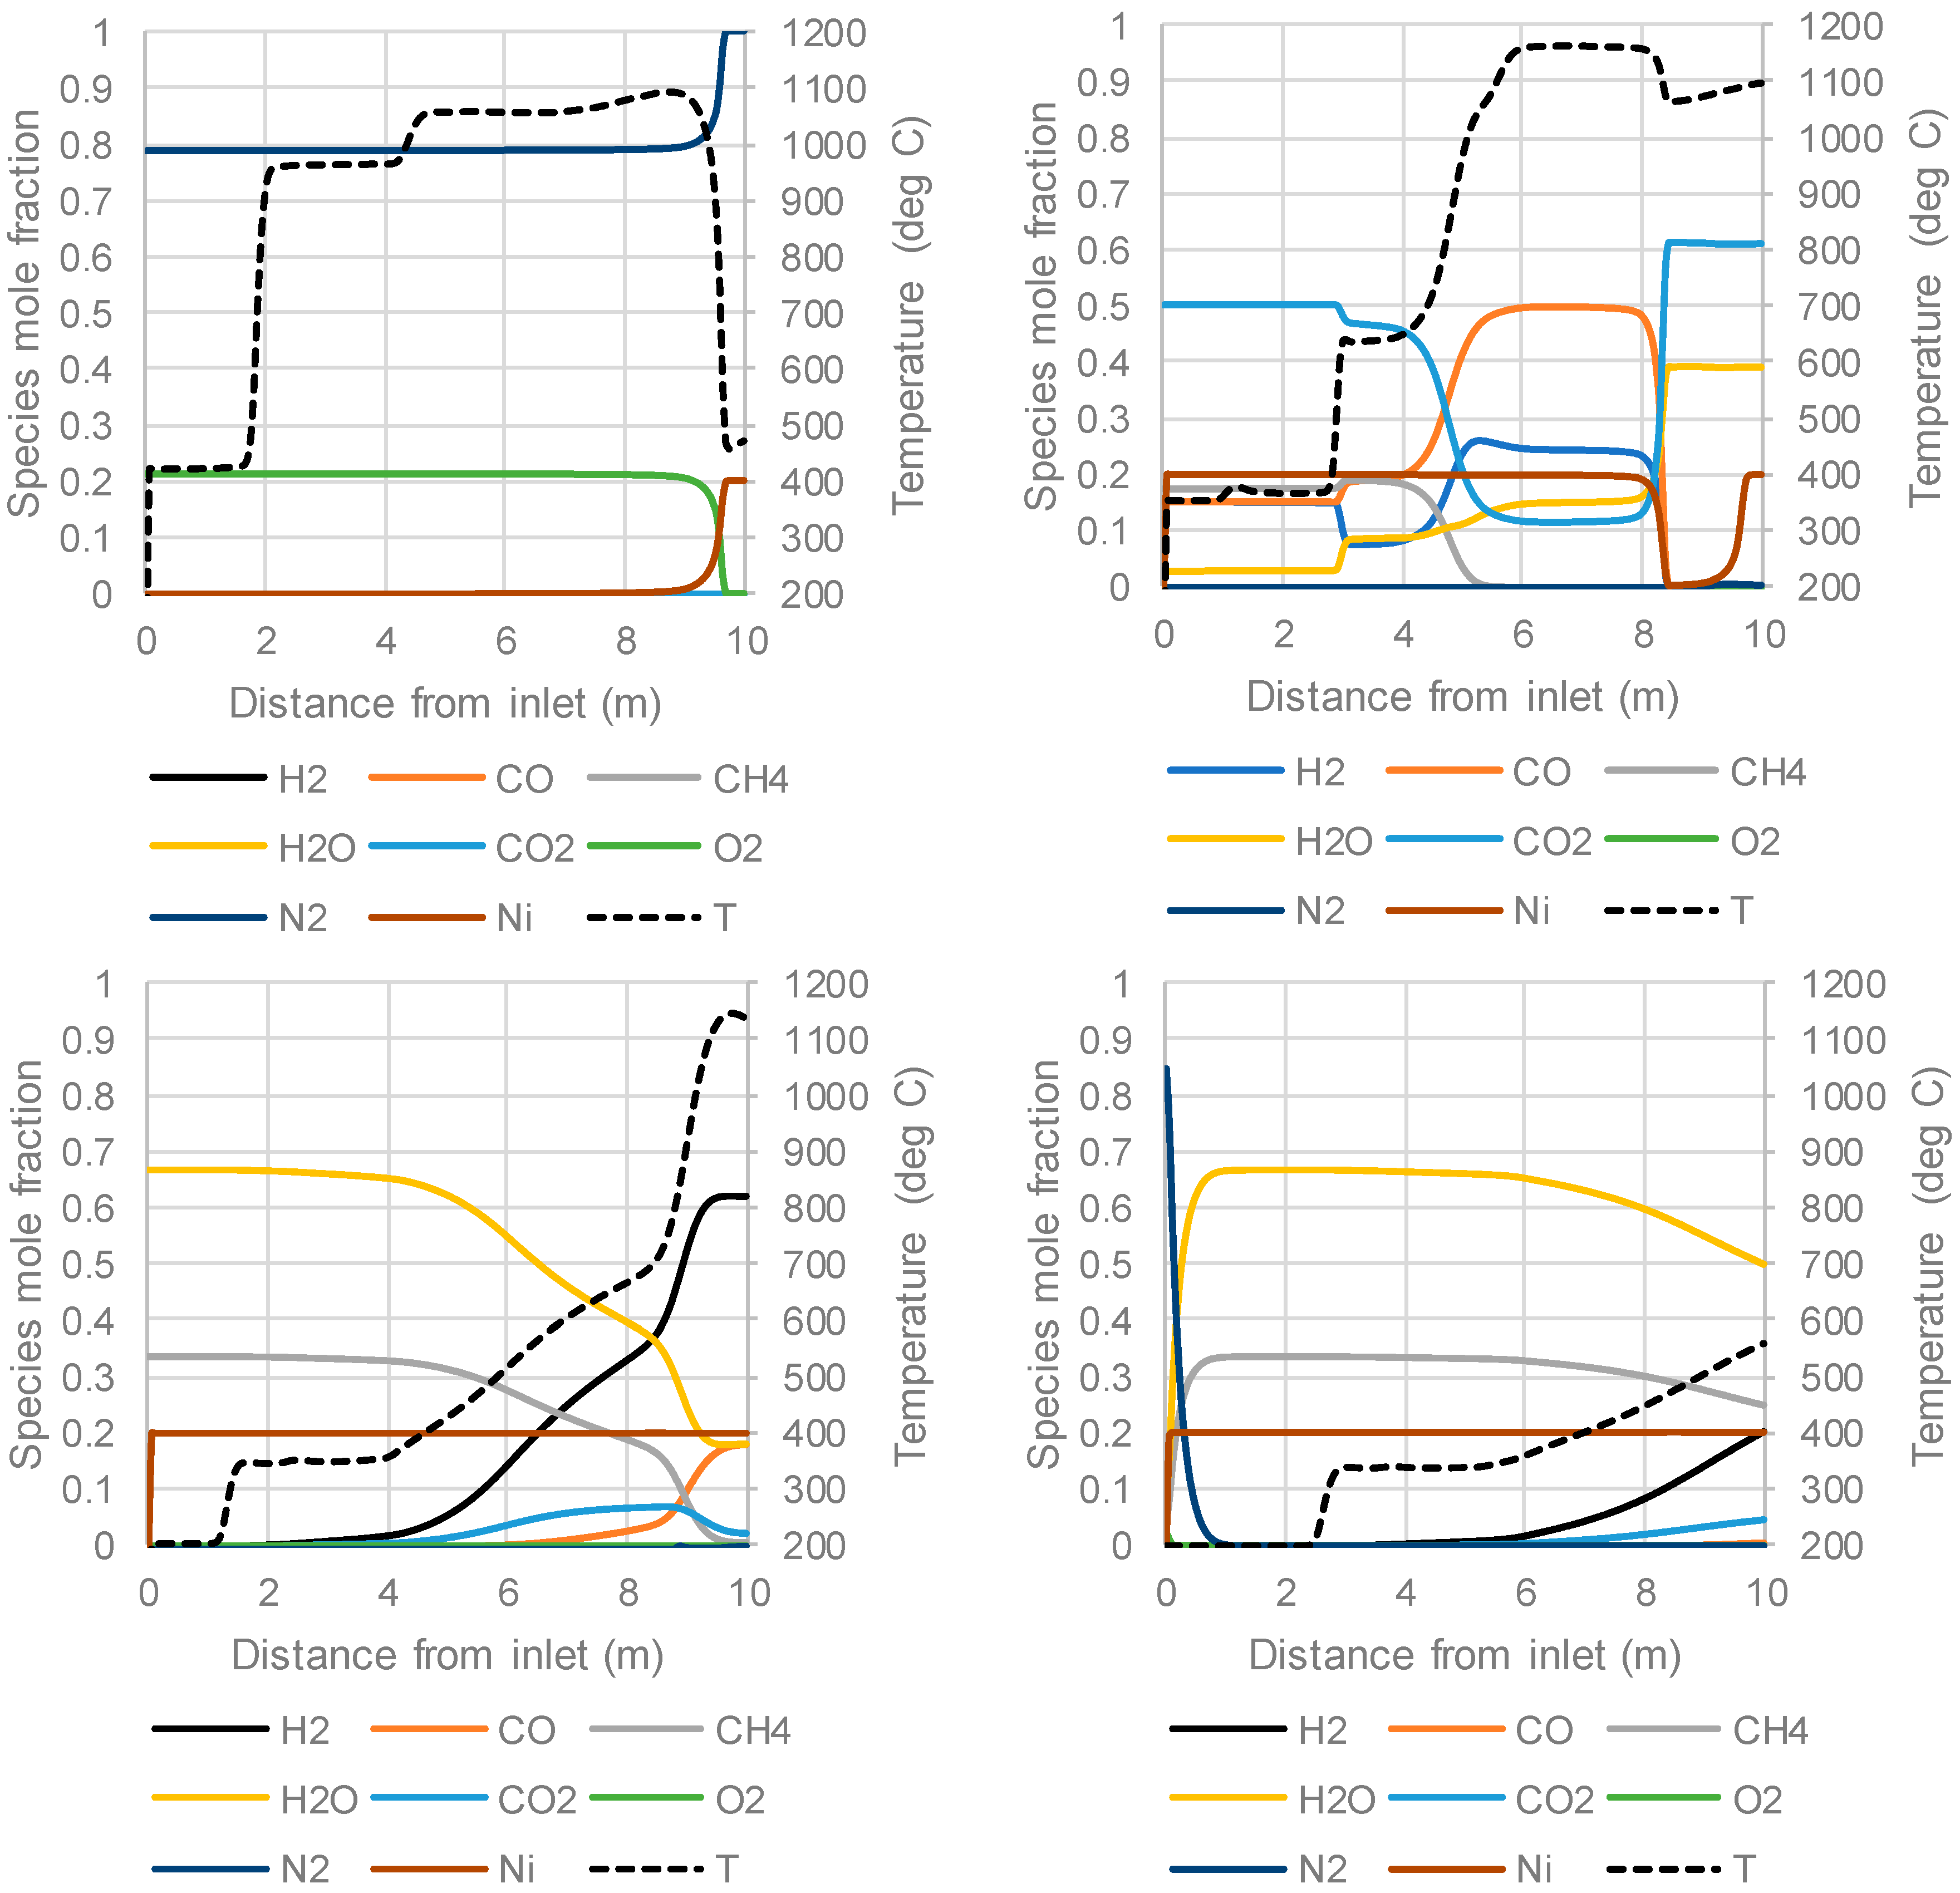
Figure 6.
Outlet gas species composition and temperature during one PBCLR cycle with 2× higher gas feed over 4× larger particles than in Figure 4.
Figure 6.
Outlet gas species composition and temperature during one PBCLR cycle with 2× higher gas feed over 4× larger particles than in Figure 4.

Table 1.
Parameters for particle resolved direct numerical simulation (PR-DNS).
| Parameter | Value | Parameter | Value |
|---|---|---|---|
| Particle diameter (dp) (m) | 0.005 | Inlet mole fraction ratio (CH4:H2O) | 1:2 |
| Packed bed voidage | 0.355 | Specific heat capacity (Cp) (solid) (J/kg/k) | 1200 |
| Particle void fraction (internal) | 0.3 | Thermal conductivity (solid) (W/m K) | 1.0 |
| Density (solid) (kg/m3) | 2500 | Operating pressure (bar) | 20 |
| Gas velocity (m/s) | 0.5 | Inlet temperature (°C) | 1100, 1000, 900 |
Table 2.
Boundary conditions employed in the PBCLR simulation.
| Stream | Stage Time (s) | Inlet Velocity (m/s) | Inlet Temperature (°C) | Composition (Mole Fraction) | |
|---|---|---|---|---|---|
| Compressed air to oxidation stage | 900 | 0.4 | 420 | O2 | 0.21 |
| N2 | 0.79 | ||||
| PSA off-gas fuel to reduction stage | 600 | 0.2 | 350 | H2 | 0.150 |
| CO | 0.150 | ||||
| CH4 | 0.175 | ||||
| H2O | 0.025 | ||||
| CO2 | 0.500 | ||||
| Methane and steam to the reforming stage | 900 | 0.25 | 200 | CH4 | 0.333 |
| H2O | 0.667 | ||||
Table 3.
Miscellaneous simulation parameters used in the PBCLR simulation.
| Parameter | Value |
|---|---|
| Bed length | 10 m |
| Active content (fully reduced) | 20% Ni |
| Oxygen carrier density | 2500 kg/m3 |
| Reactor void fraction | 0.4 |
| Particle void fraction | 0.3 |
| Particle tortuosity | 3 |
| Particle diameter | 5 mm |
| Reactor outlet pressure | 18 bar |
© 2017 by the authors. Licensee MDPI, Basel, Switzerland. This article is an open access article distributed under the terms and conditions of the Creative Commons Attribution (CC BY) license (http://creativecommons.org/licenses/by/4.0/).
Share and Cite
MDPI and ACS Style
Singhal, A.; Cloete, S.; Quinta-Ferreira, R.; Amini, S. Multiscale Modeling of a Packed Bed Chemical Looping Reforming (PBCLR) Reactor. Energies 2017, 10, 2056. https://doi.org/10.3390/en10122056
AMA Style
Singhal A, Cloete S, Quinta-Ferreira R, Amini S. Multiscale Modeling of a Packed Bed Chemical Looping Reforming (PBCLR) Reactor. Energies. 2017; 10(12):2056. https://doi.org/10.3390/en10122056
Chicago/Turabian StyleSinghal, Arpit, Schalk Cloete, Rosa Quinta-Ferreira, and Shahriar Amini. 2017. "Multiscale Modeling of a Packed Bed Chemical Looping Reforming (PBCLR) Reactor" Energies 10, no. 12: 2056. https://doi.org/10.3390/en10122056
Note that from the first issue of 2016, this journal uses article numbers instead of page numbers. See further details here.