Power Swing Generated in Francis Turbines by Part Load and Overload Instabilities
by
 , and
, and
David Valentín
* ,
,
Alexandre Presas
,
Eduard Egusquiza
,
Carme Valero
,
Mònica Egusquiza
and
Matias Bossio
Center for Industrial Diagnostics and Fluid Dynamics (CDIF), Polytechnic University of Catalonia (UPC), Av. Diagonal, 647, ETSEIB, 08028 Barcelona, Spain
*
Author to whom correspondence should be addressed.
Energies 2017, 10(12), 2124; https://doi.org/10.3390/en10122124
Submission received: 30 October 2017
/
Revised: 1 December 2017
/
Accepted: 7 December 2017
/
Published: 13 December 2017
(This article belongs to the Special Issue Hydropower 2017)
Abstract
:Hydropower plays a key role in the actual energy market due to its fast response and regulation capacity. In that way, hydraulic turbines are increasingly demanded to work at off-design conditions, where complex flow patterns and cavitation appear, especially in Francis turbines. The draft tube cavitation surge is a hydraulic phenomenon that appears in Francis turbines below and above its Best Efficiency Point (BEP). It is a low frequency phenomenon consisting of a vortex rope in the runner outlet and draft tube, which can become unstable when its frequency coincides with a natural frequency of the hydraulic circuit. At this situation, the output power can significantly swing, endangering the electrical grid stability. This study is focused on the detection of these instabilities in Francis turbines and their relationship with the output power swings. To do so, extensive experimental tests for different operating conditions have been carried out in a large prototype Francis turbine (444 MW of rated power) within the frame of the European Project Hyperbole (FP7-ENERGY-2013-1). Several sensors have been installed in the hydraulic circuit (pressure sensors in the draft tube, spiral casing, and penstock), in the rotating and static structures (vibration sensors, proximity probes, and strain gauges in the runner and in the shaft), as well as in the electrical side (output power, intensity, and voltage). Moreover, a numerical Finite Element Method (FEM) has been also used to relate the hydraulic excitation with the output power swing.
1. Introduction
Nowadays, hydraulic turbines are increasingly working at off-design conditions in order to extend their range of operation and to compensate the non-constant electricity generation of new renewable energy sources [1,2]. Hydraulic turbines are, however, optimized to work at their Best Efficiency Point (BEP). When the flow rate in the machine is regulated to generate more or less electricity than in the BEP, a swirl in the flow at the turbine runner outlet appears, especially in Francis turbines, which for certain condition could lead to draft tube surge cavitation or vortex rope [3,4]. This phenomenon has been studied for many years [5,6], experimentally in laboratory and by means of CFD (Computational Fluid Dynamics) simulations.
When the vortex rope occurs below the BEP (less flow rate), the cavitating core is formed with spiral shape in the draft tube with a frequency precession of about 0.25–0.35 the rotating speed of the runner. This phenomenon induces fluctuations in the draft tube cone at the precession frequency and it can be decomposed in two different components [7,8]: the asynchronous and the synchronous. The first one corresponds to the rotation of a pressure pattern, and the second one is an axial component that is propagated to the entire hydraulic circuit. When the frequency of this vortex rope coincides with a natural frequency of the hydraulic circuit (draft tube, runner or guide vanes passages, or penstock), a hydraulic resonance occurs, endangering the system stability. During this resonance, large pressure pulses are propagated through the whole hydraulic system, affecting also the mechanical behavior of the runner and the mechanical torque of the shaft, leading to an important power swing in the electricity output. In that way, all of the system becomes unstable, starting from the hydraulic part, but also affecting the mechanical and electrical components. This phenomenon is known as Part Load Instability [9]. This phenomenon has been observed and evaluated in hydroelectric power plants since many years ago [10,11].
However, when the vortex rope occurs over the BEP (more flow rate), the core is centered in the runner cone [5] rotating at the opposite direction than the runner. In this case, the convective or asynchronous component is less important than in the part load vortex rope, but it has a large synchronous component. This phenomenon is able to self-excite the natural frequencies of the hydraulic circuit [5] affecting the whole system stability. It is known as Overload Instability [9], and its consequences over the structure and the power swing are even larger than in the part load instability since the flow passing through the runner is larger, as well as the propagated pressure pulses.
Both part load and overload instabilities are dependent on the net head of the machine [5,6], especially on the lower reservoir level. Therefore, for different net heads, they can appear at different generating powers. All of the previous referenced studies are based on reduced-scale models in laboratory, and they are basically focused on explain the hydraulic phenomena and dynamics of both part load and overload vortex ropes and instabilities. The fact is that it is demonstrated that the mechanical torque and so the output generating power fluctuates at the instability frequency, but the effects on the runner, and therefore on the shaft torque, are not explained in detail.
In this paper, both part load and overload instabilities are studied in detail for a large prototype, from the hydraulic trigger mechanism (the vortex rope) to the shaft torque and output power swing. To do so, a large Francis turbine (444 MW of rated power) has been selected for an extensive study. Several sensors have been installed in the hydraulic system (pressure sensors in the draft tube, runner, spiral casing, and penstock), in the mechanical system (vibration sensors in the stationary parts and strain gauges in the runner and shaft) and in the electric system (power, voltage and intensity measurements). The machine was tested at the whole range of operation, from very deep part load to overload conditions. Moreover, a Finite Element Method (FEM) model of the machine has been also built up to better explain and relate the torque and power swing due to the hydraulic excitation of the vortex rope.
The paper is organized as follows: In Section 2, the experimental tests done in the Francis turbine prototype are explained, including the description of the selected turbine (Section 2.1), the instrumentation used (Section 2.2), and the testing procedure (Section 2.3). Section 3 explains the numerical model that is used to support the experimental data and Section 4 presents all of the results obtained. This Section 4 is divided in the results obtained on-site in the Francis turbine prototype (Section 4.1) and the results obtained by the numerical model (Section 4.2). Finally, Section 5 shows the conclusions reached in this paper.
2. Experimental Tests
2.1. Description of the Selected Turbine
For this study, a large medium-head Francis Turbine has been selected. This Francis Turbine has a specific speed (ns) of 46 (further information about hydraulic turbines specific speed can be found in [12]) and a rated power of 444 MW. This study is part of the collaborative European Project Hyperbole (FP7-ENERGY-2013-1) [13]. The runner has 16 blades, whereas the distributor has 20 guide vanes. The rotating speed of the machine is 128.6 rpm (2.14 Hz). The machine has two radial bearings (one in the generator side and another in the turbine side) and one thrust bearing in the generator side. Taking advantage of an overhaul in the power plant, the machine was accessible to install several sensors in the rotating parts and in the stationary parts. The objective of these tests was to identify all of the phenomena that occur in every operating point and how they are detected with the different sensors.
2.2. Instrumentation
A total of 63 channels, including sensors and operating conditions (wicket gate opening and rotating speed), of the machine were acquired simultaneously during the experimental tests. A distributed acquisition system LAN XI Type 3053 (Brüel & Kjaer, Naerum, Denmark) based on six modules of 12 channels was used. The acquisition frequency was set to 4096 Hz, without any hardware or software filtering. Different sensors were installed in the hydraulic, mechanical, and electrical systems of the machine.
2.2.1. Hydraulic System
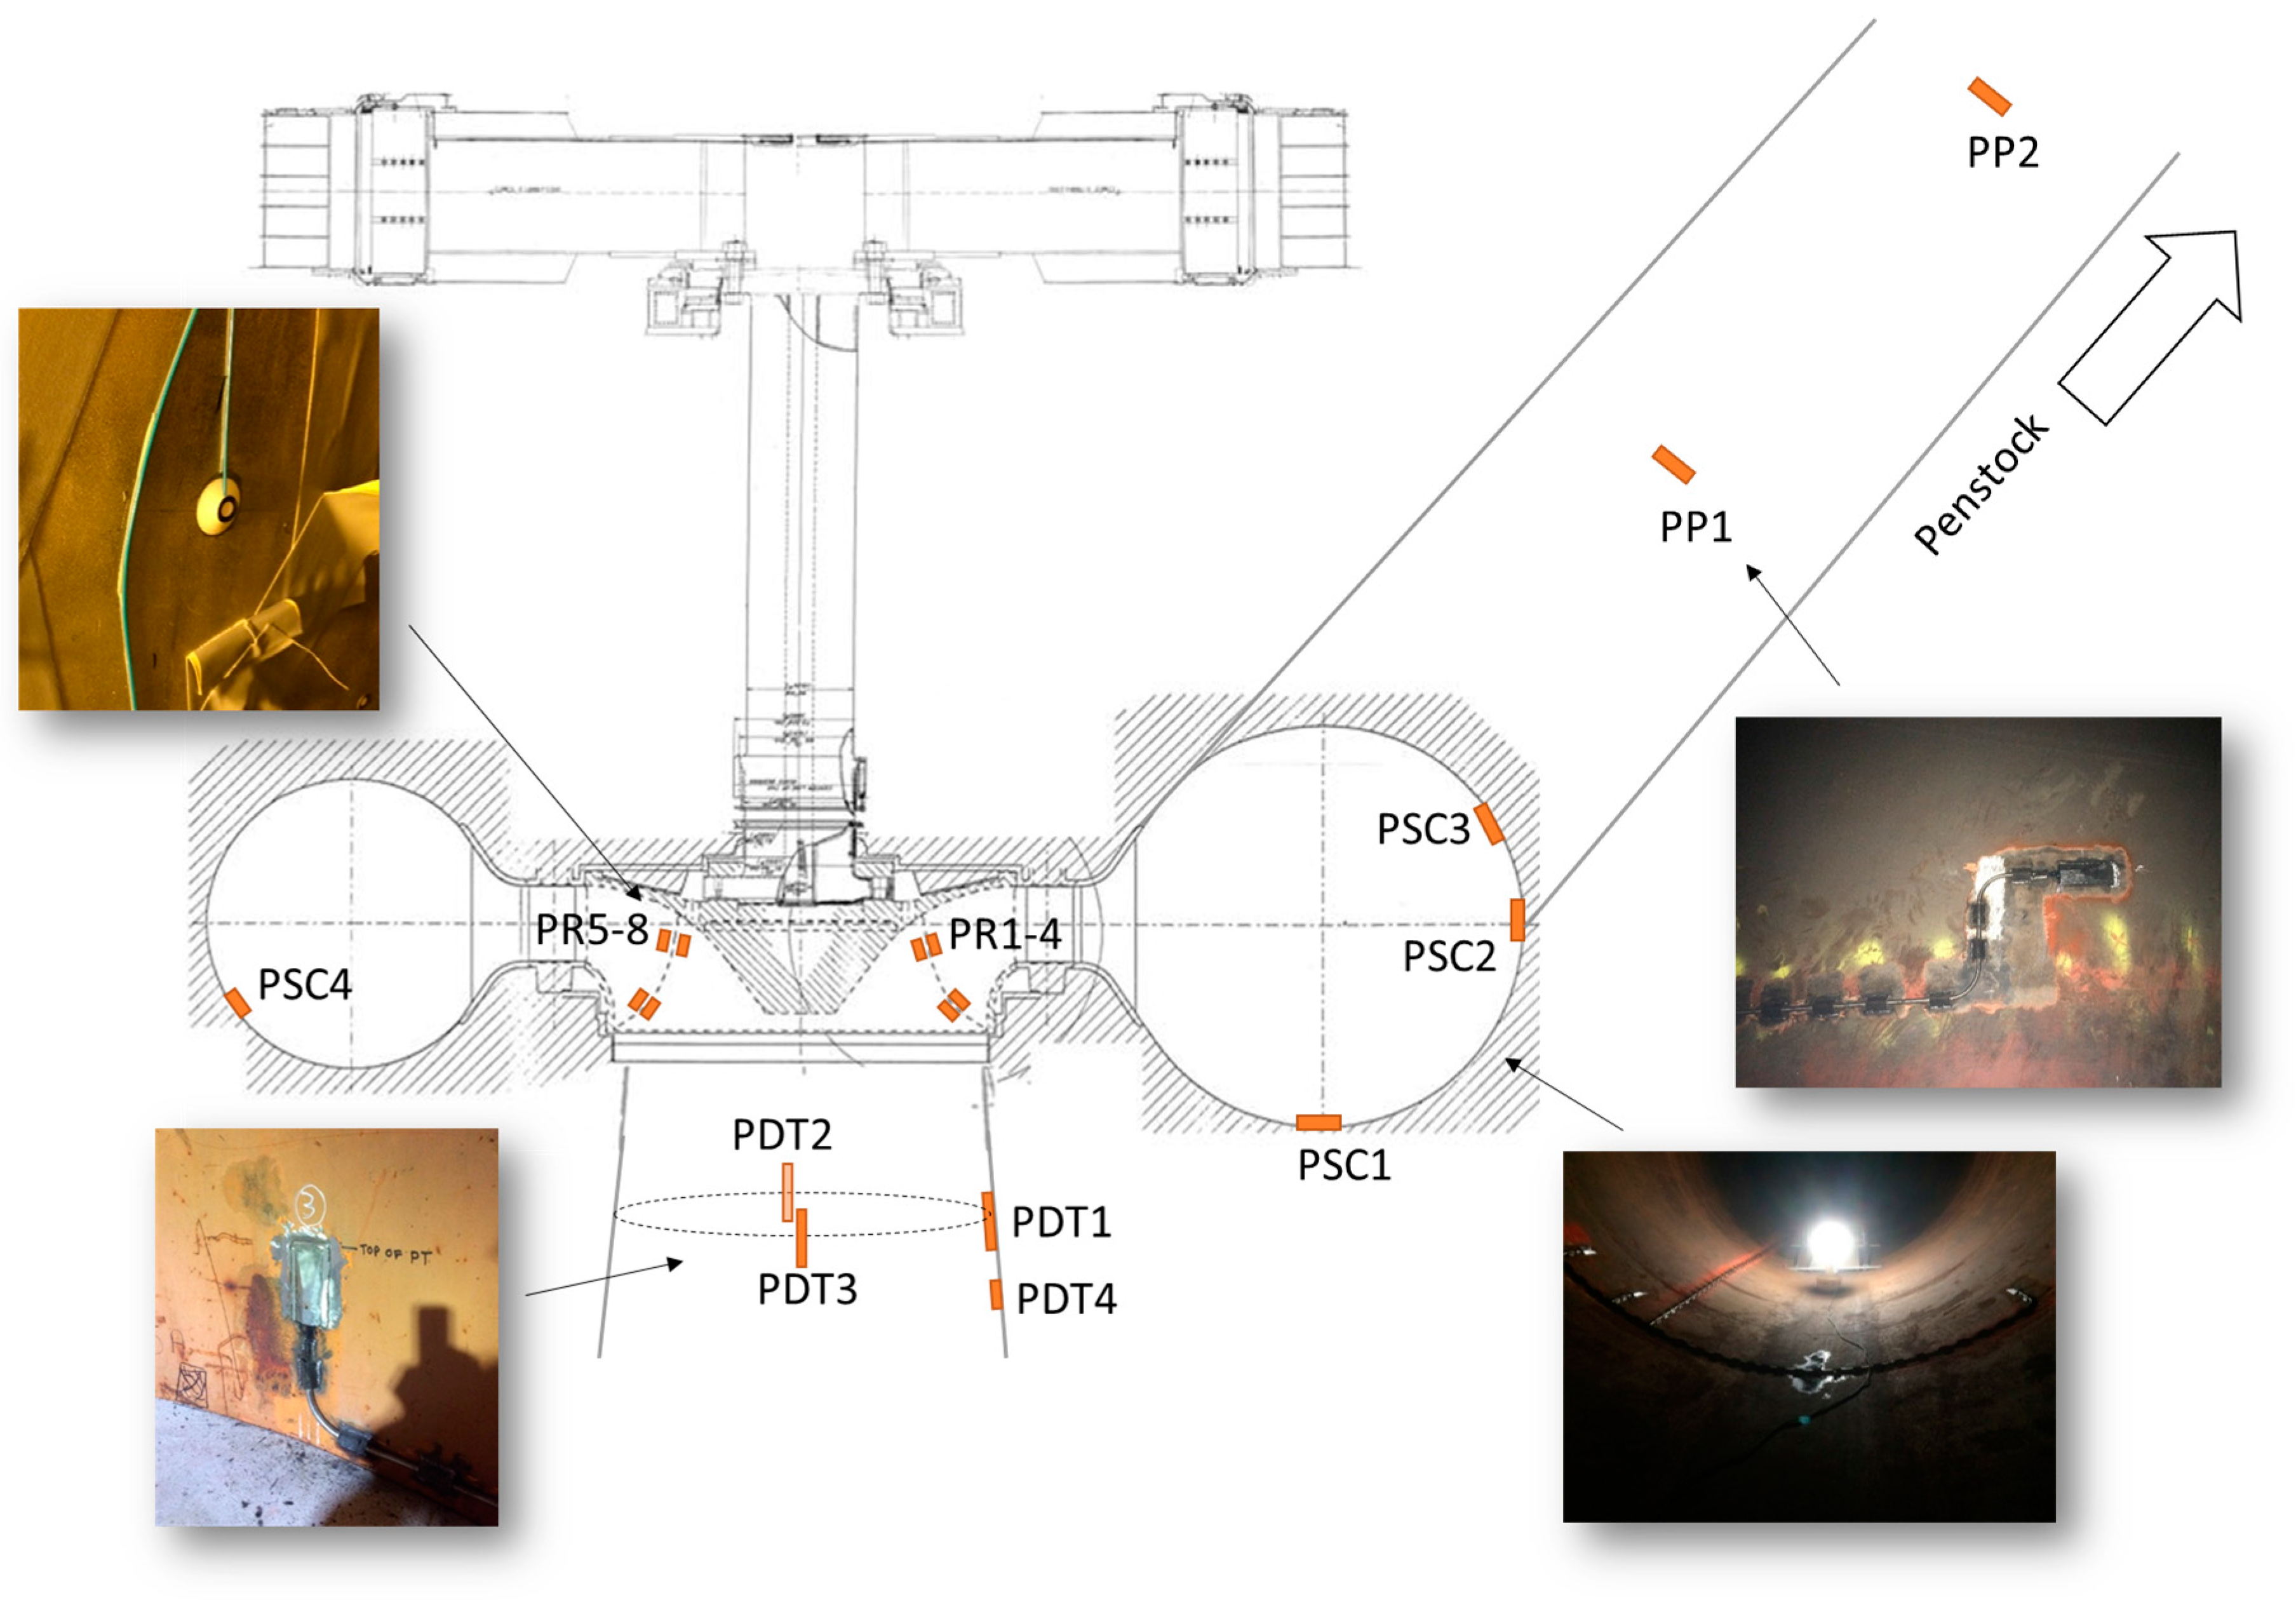
In the hydraulic system, different pressure sensors were installed in the draft tube, runner, spiral casing, and penstock in order to detect the propagation of pressure waves along all of the hydraulic circuit. A sketch showing all of them is shown in Figure 1. Four pressure sensors were installed in the draft tube: three were flush-mounted in the draft tube wall separated 90 degrees between them (PDT1 (Kyowa 5KC), PDT2 (EPL 3.5b), PDT3 (EPL 7b)) and another one was installed in an existing valve in the draft tube mandoor (PDT4 (K-line 0-20 bar (Kistler, Winterthur, Switzerland))). Other four pressure sensors were also installed in the spiral casing: three flush-mounted in one cross section in the spiral casing wall at the inlet (PSC1-3 (50KC (Kyowa, Tokyo, Japan))) and another one in an existing valve in the spiral casing mandoor (PSC4 (K-line 0-20 bar (Kistler, Winterthur, Switzerland))). In the penstock, two more pressure sensors were installed (PP1-2 (50KC (Kyowa, Tokyo, Japan))) separated about 14 m from the ones that were located in the spiral casing inlet and about 20 m between them. Finally, eight pressure sensors (PR1-8 (Kyowa, Tokyo, Japan)) were also installed in the runner blades: two in the pressure side and two in the suction side of two different blades separated 180 degrees between them. The signals of these pressure sensors were transmitted through a telemetry system that was located in the runner hub.
2.2.2. Mechanical System
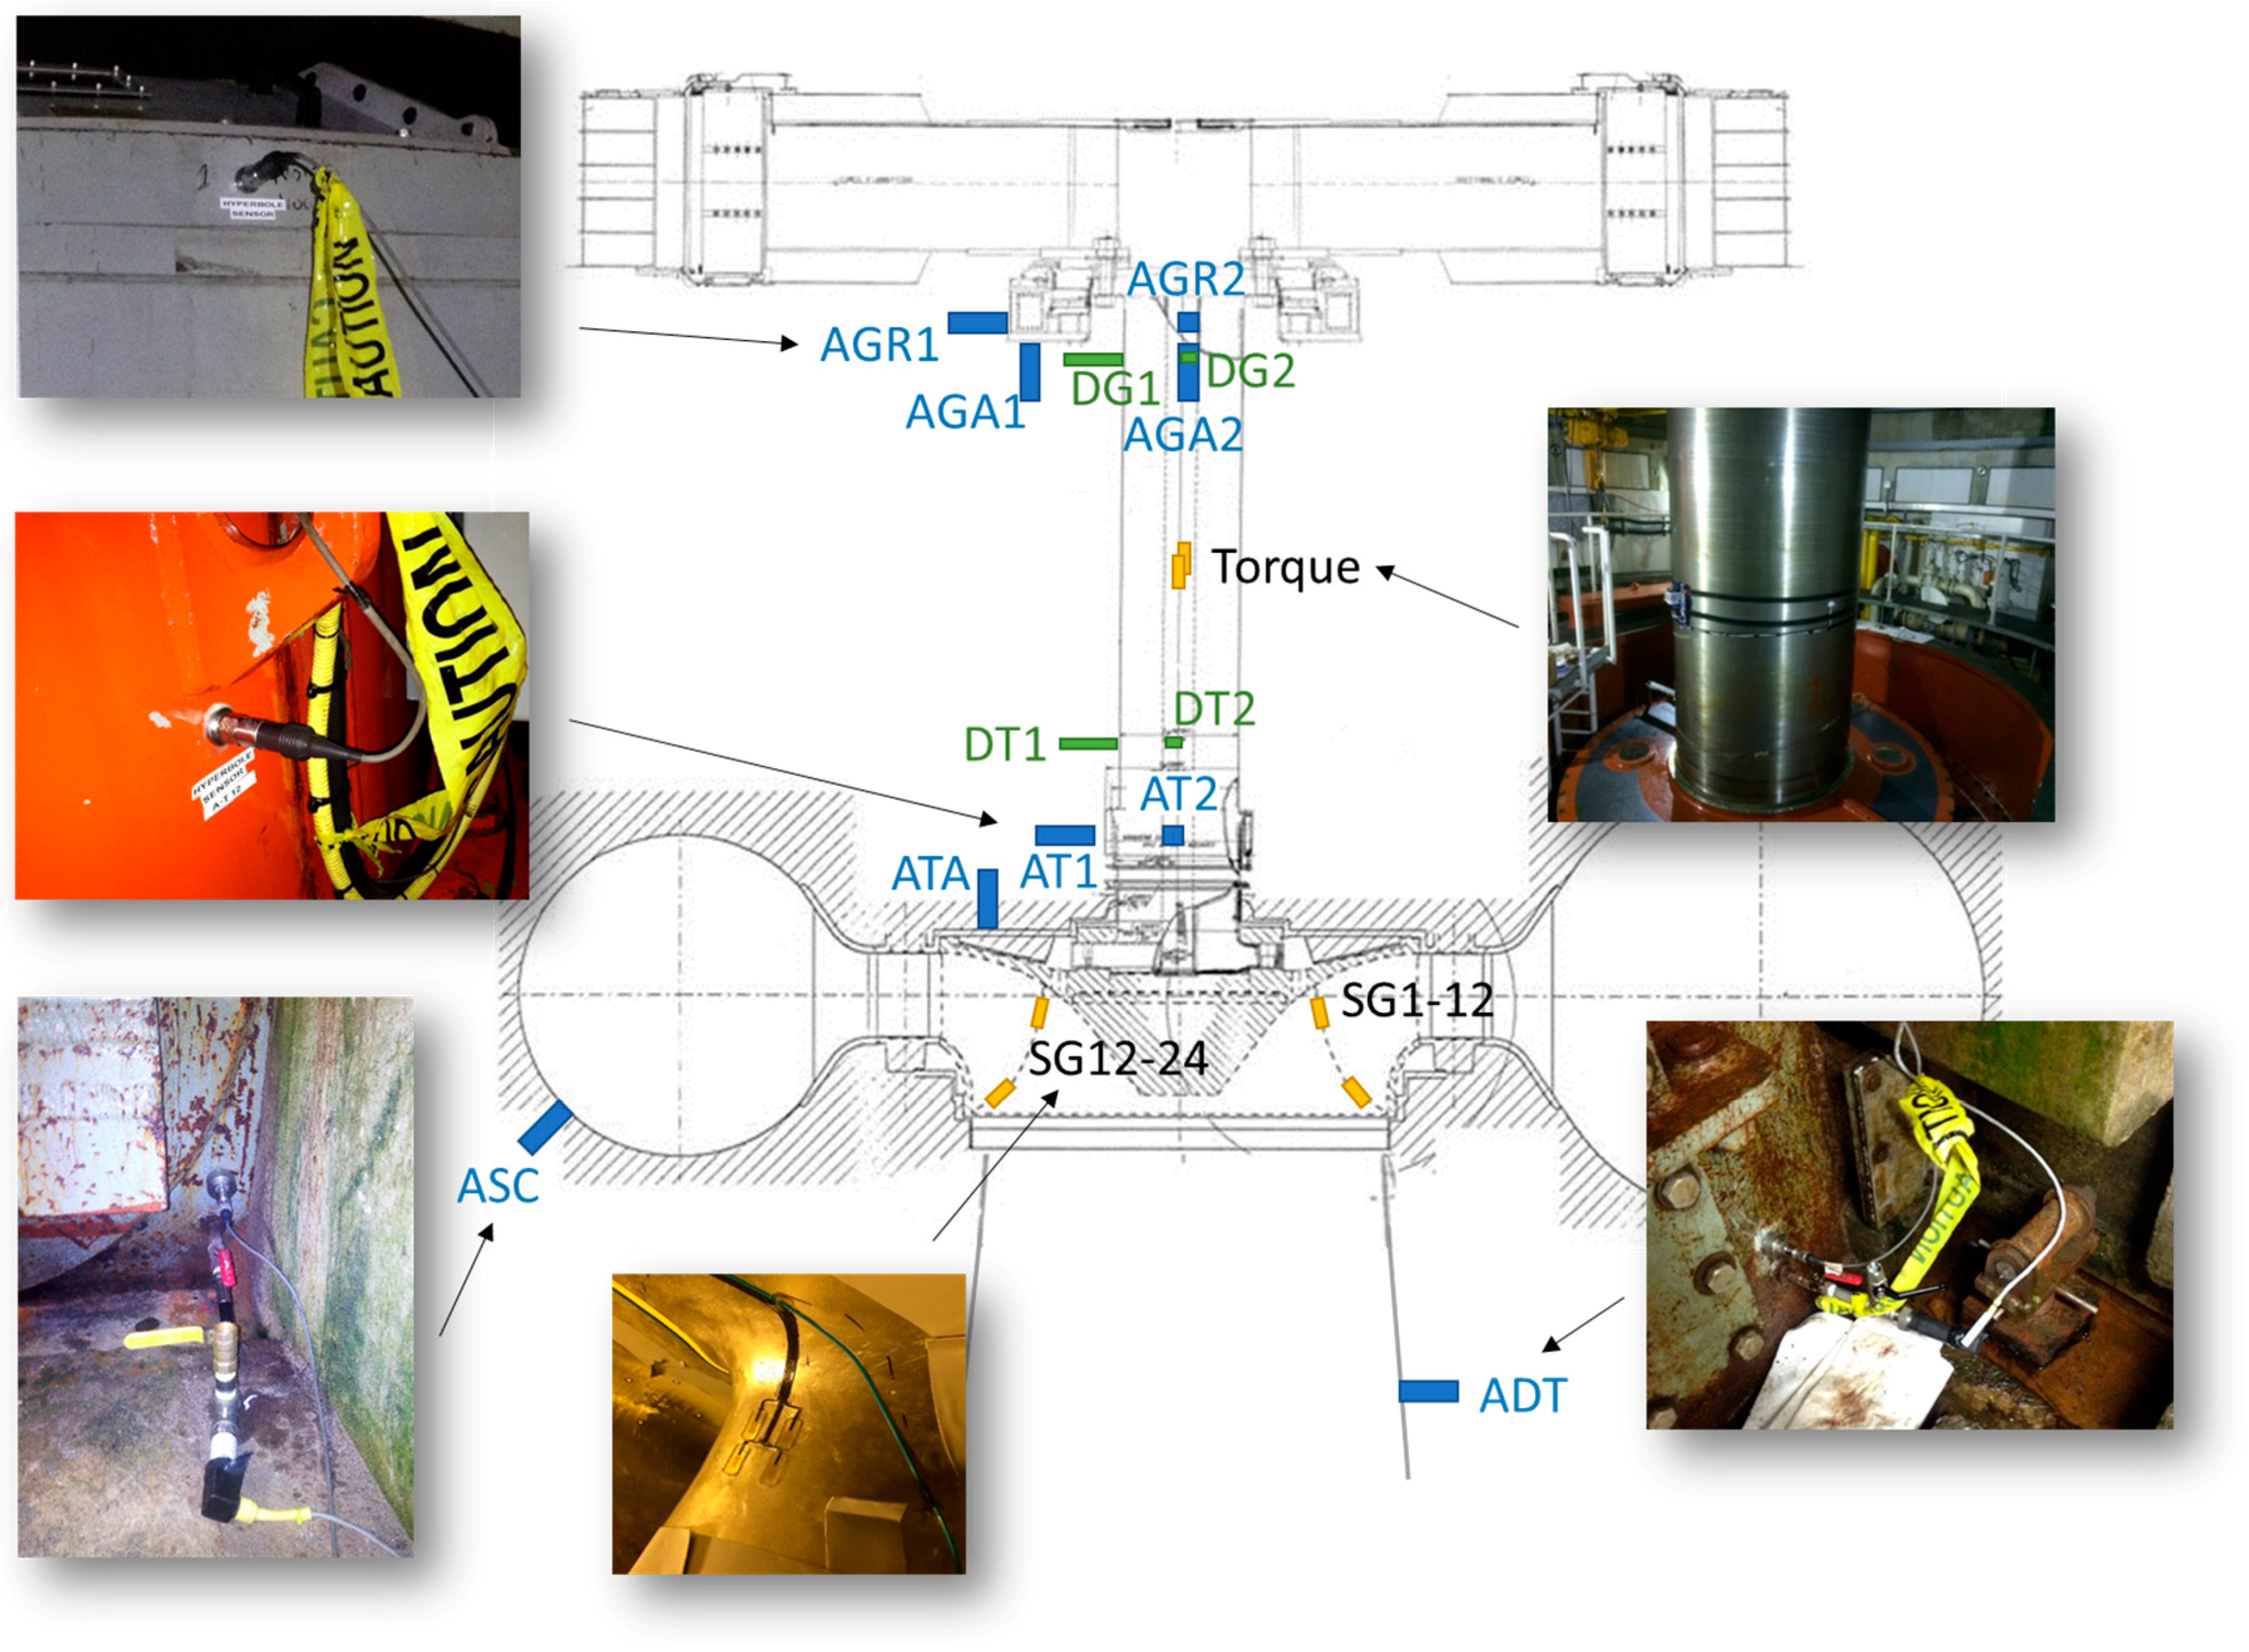
Different sensors have been installed in the mechanical system. Some of them are located in the rotating structures (runner and shaft) and other in the stationary parts, such as bearings or casings (see sketch in Figure 2). A total of nine accelerometers (8752A, 100 mV/g (Kistler, Winterthur, Switzerland)) were installed along the machine to detect the vibration behavior of the machine: four in the generator bearing (two axially (AGA1-2) and two radially (AGR1-2), two in the turbine bearing (AT1-2), one in the head cover (ATA), one in the spiral casing wall (ASC), and another one in the draft tube wall (ADT)). See Figure 2 for further details of the sensors nomenclature.
Moreover, four proximity probes were also used, two in the generator side (DG1-2 (3300 XL 8 mm Proximity Transducer System, Bently Nevada, Berkeley, CA, USA)) and two in the turbine side (DT1-2) to measure the absolute displacement of the shaft during operation. The torque of the shaft was also measured using two strain gauges that were installed in the shaft and connected to a telemetry system (see Figure 2). 24 strain gauges more were installed also in the runner in two different blades in order to obtain the dynamic stress of the runner under operation.
However, not all of the sensors that were installed in the mechanical system are used for discussion in the present paper since they do not explain the power swing phenomenon (strain gauges in the runner, displacement in the generator, radial vibration in the generator and turbine bearing and vibration in the draft tube and spiral casing).
2.2.3. Electrical System
Aside from the sensors installed in the hydraulic and mechanical system, the active power that is generated by the turbine and the intensity (electric field) and voltage of one phase were also acquired simultaneously. These signals were taken from existing transducers in the power plant.
2.3. Testing Procedure
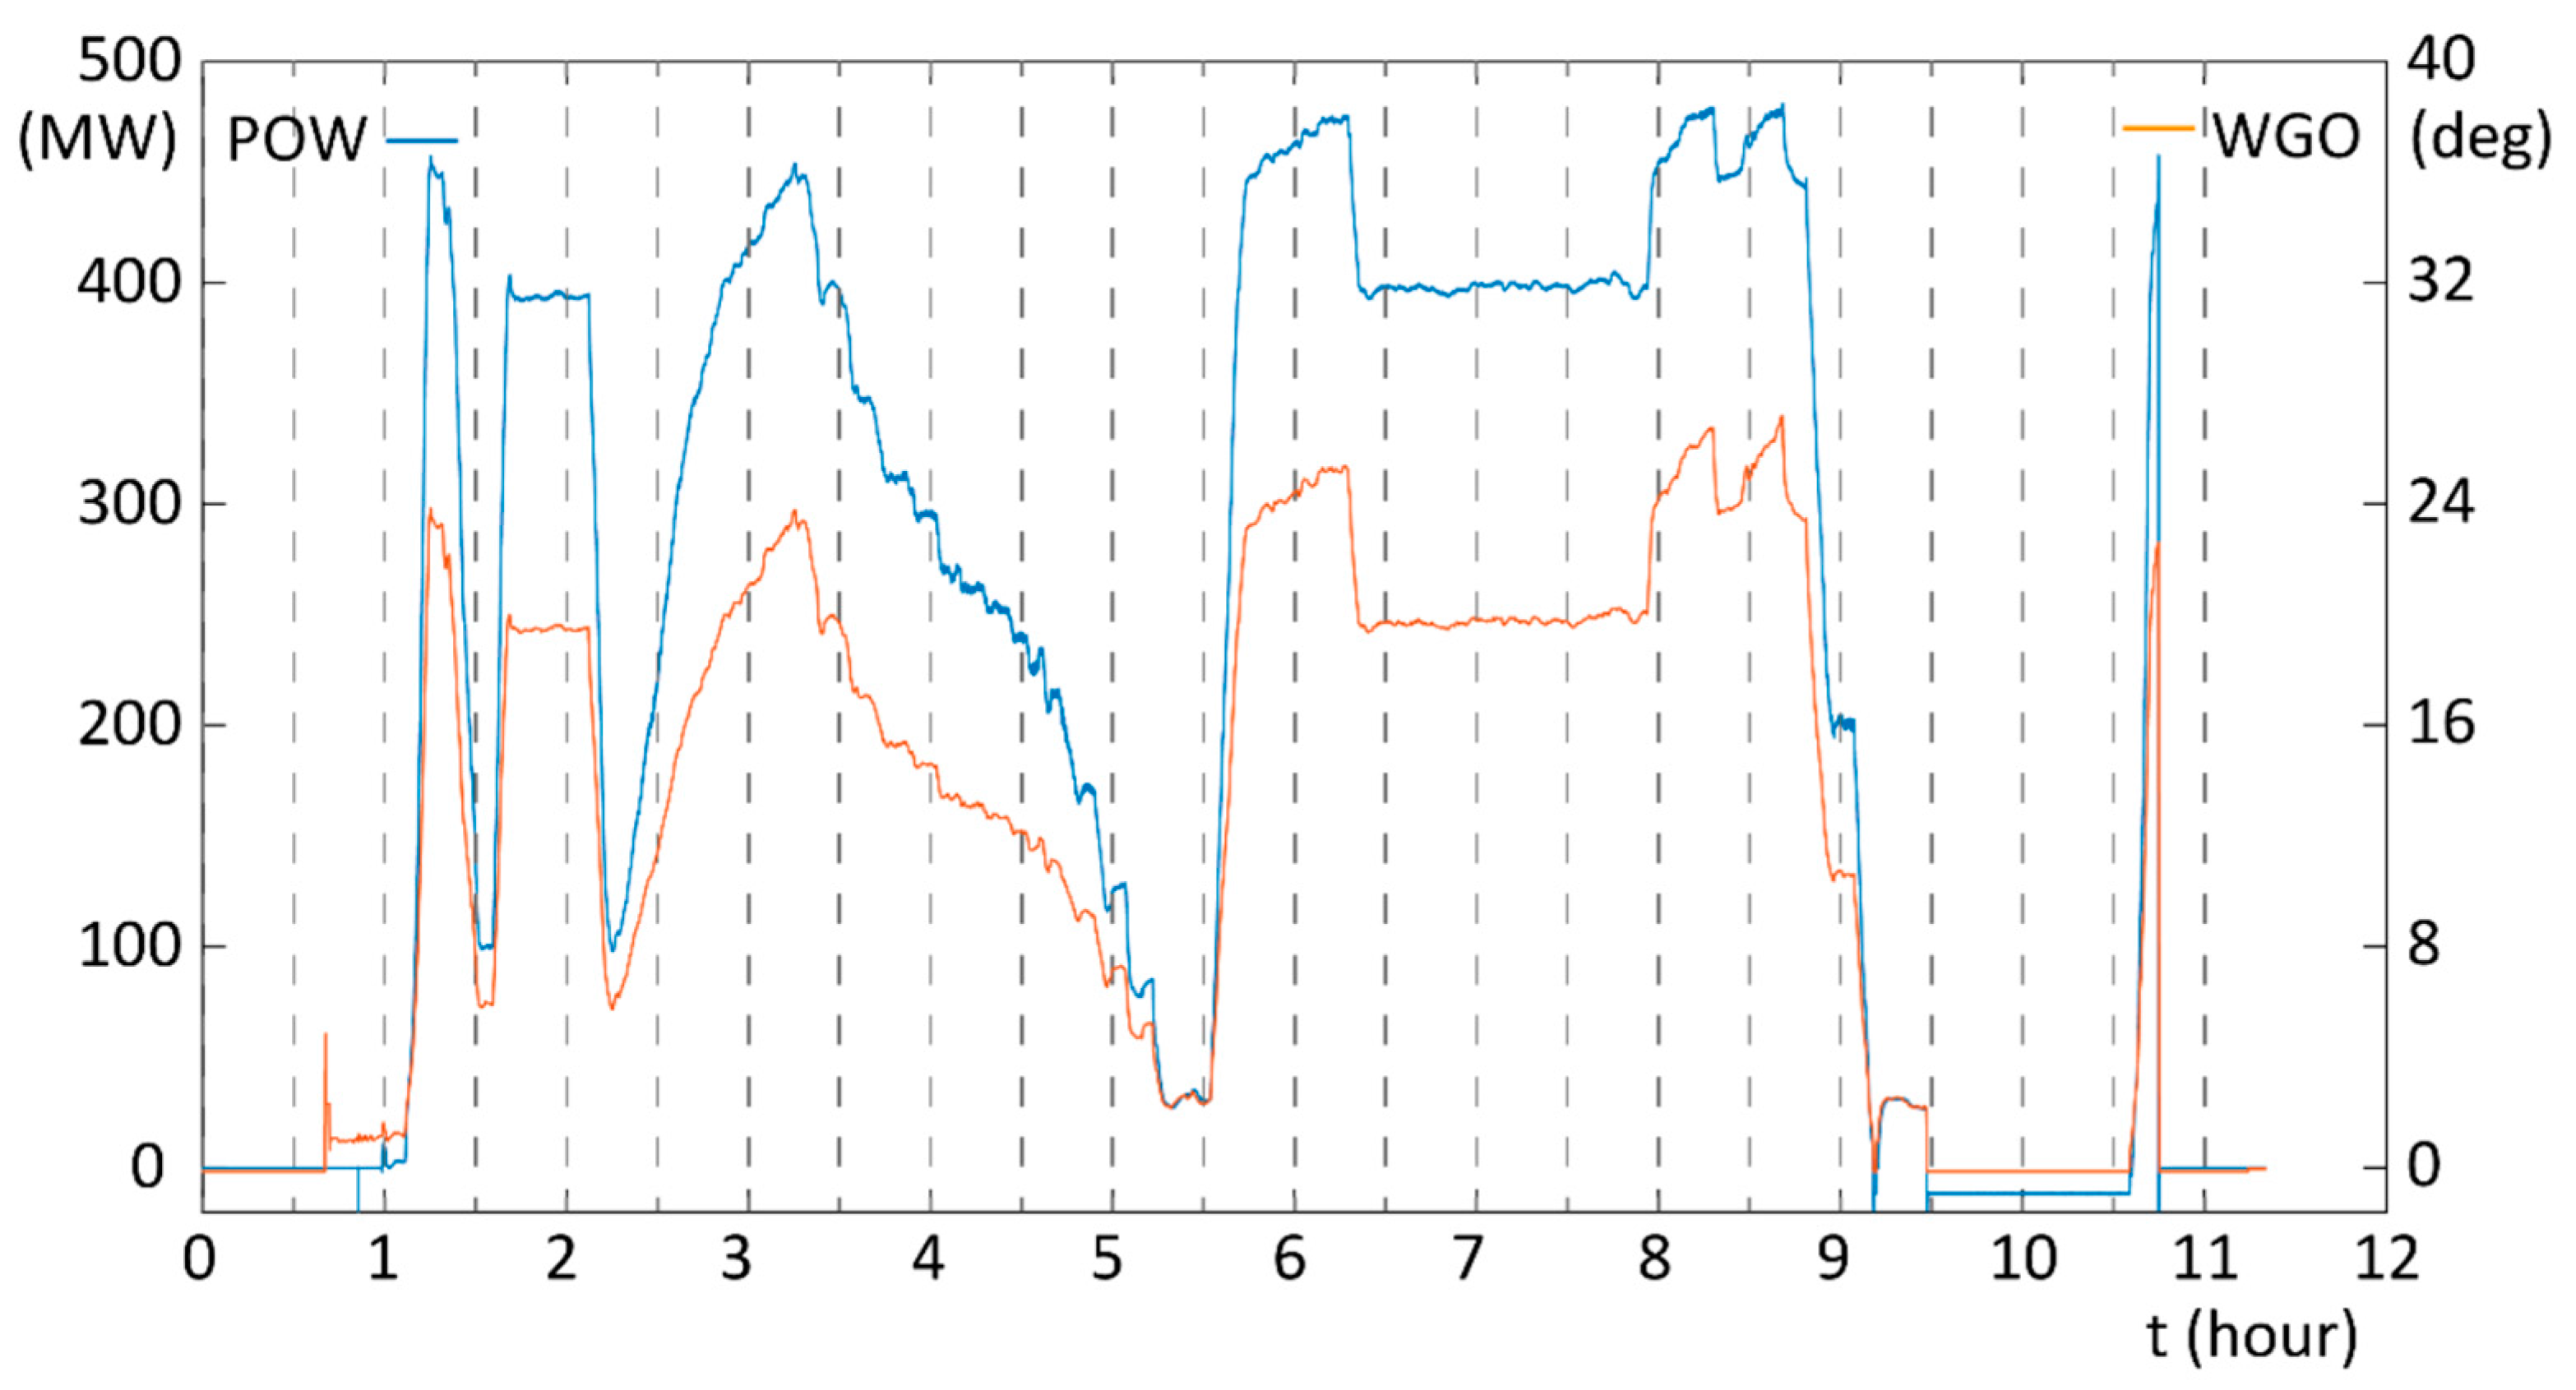
The experimental tests took about 10 h (see Figure 3). During this time, the machine was operated in all of the possible operating range for the head at that moment. Different slow ramp-up (from minimum to maximum power) and ramp-down (from maximum to minimum power) were done (see Figure 3). Moreover, different steps of constant power were also tested (10 min in every step, see Figure 3 between hours 3 and 5) to have real steady conditions of the machine.
3. Numerical Simulation
A numerical simulation of the machine has been performed using Ansys v.16.2 (Ansys®, Canonsburg, PA, USA) [14] in order to better relate the hydraulic phenomena of the part load and overload instabilities with the torque and power swing. To do so, the experimental values of the pressure in the draft tube for different operating conditions have been introduced as input in a harmonic analysis. In that way, the forced response of the machine due to the hydraulic excitation can be obtained and compared with the experimental data. The type of FEM Model and boundary conditions that were used for the numerical simulations are explained in the following sections.
3.1. FEM Model
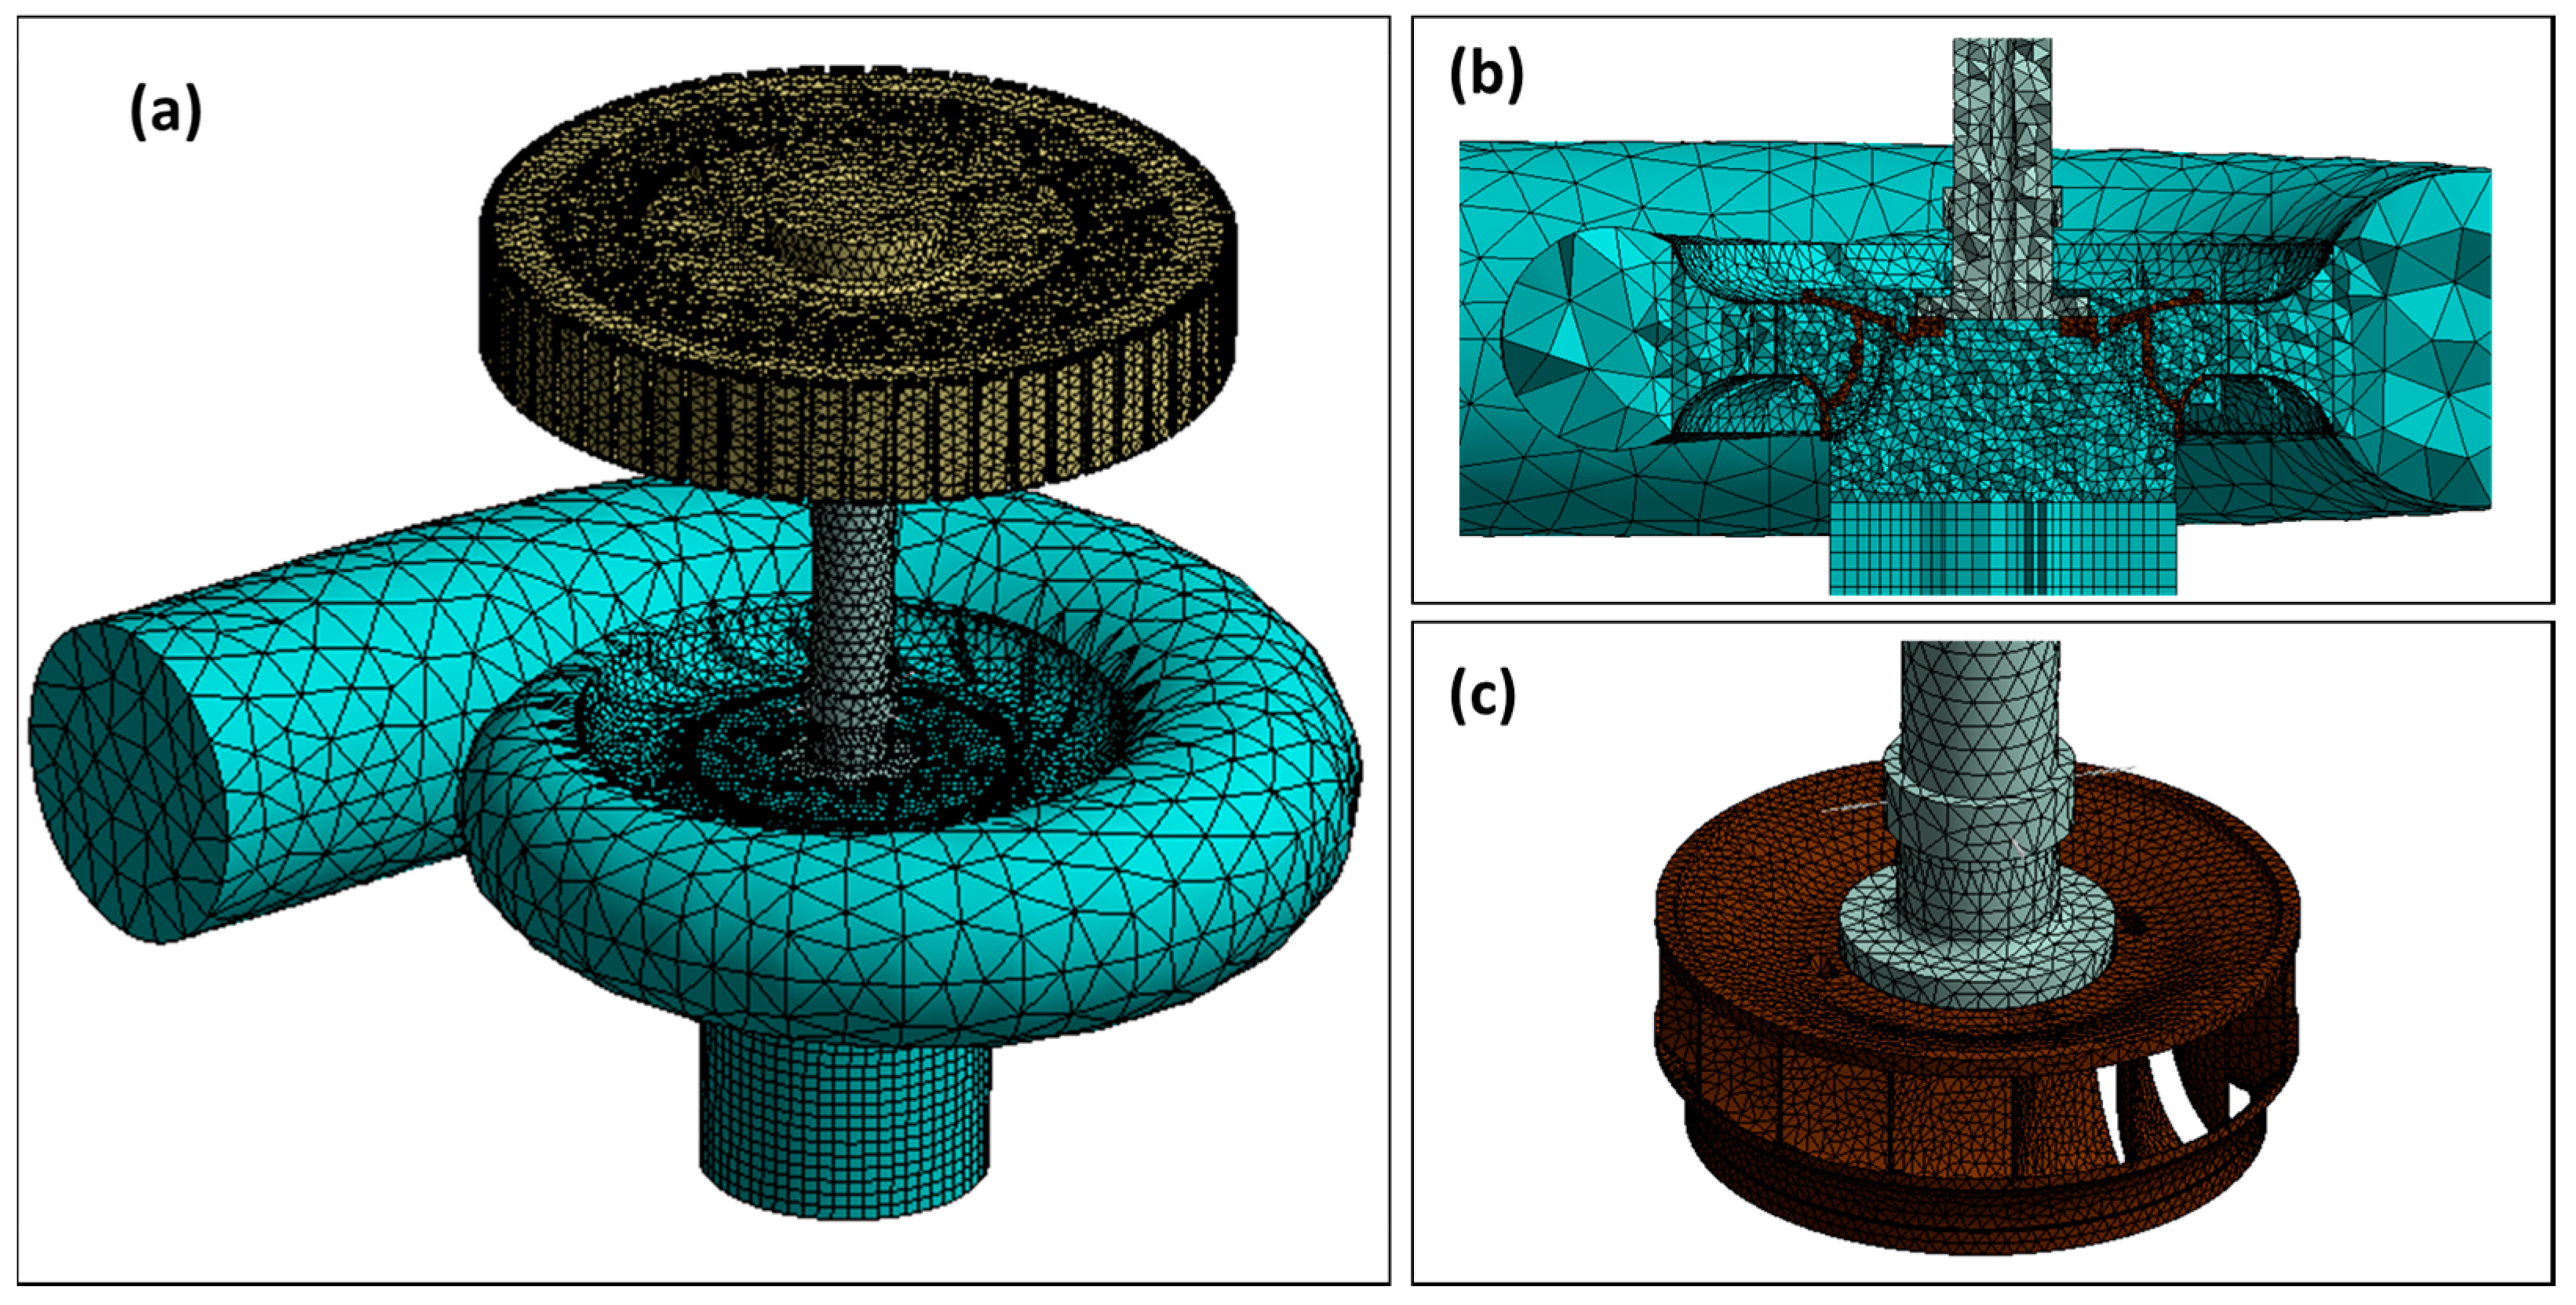
The simulation model includes the runner, the shaft, the generator, and the surrounding water formed by a part of the draft tube, the runner water passage, including the hydraulic seals, the distributor, and the spiral casing (see Figure 4). The structure is standing (not rotating) and the fluid is at rest. The fluid domain is modeled using acoustic formulation [15,16,17]. The mesh that is used for all of the components is formed by 10-node tetrahedral elements (SOLID187 for the solid parts and FLUID30 for the fluid elements. Further information about this kind of elements is found in [14]). A mesh sensitivity analysis was carried out by increasing the number of elements of each part until the difference in the results between the case of study and the densest mesh tested was below 1%. The optimal mesh obtained for the whole machine was formed by approximately 420,000 elements (8500 elements for the shaft, 140,000 elements for the generator, 56,000 for the runner, and 215,000 elements for the water).
3.2. Boundary Conditions
3.2.1. Bearings
The machine’s bearings are modelled in the simulation using four radial springs (with a separation of 90 degrees between them) in the turbine bearing, other four radial springs at 90 degrees in the generator bearing and four axial springs to model the thrust bearing.
3.2.2. Acoustic Boundary Conditions
The nodes of the water that are in contact with the static parts (walls) are fixed without any displacement in all directions, whereas the nodes of the water in contact with the runner are defined as FSI (Fluid Structure Interaction) interface. The spiral casing inlet has been defined as acoustic radiation boundary condition [14] (the acoustic waves can go across), and the draft tube outlet has been configured using as input a planar wave. The values of the amplitude of this planar wave have been introduced in the simulation according to the experimental values that were obtained at every operating condition.
4. Results and Discussion
In this section, the results obtained in the experimental tests for the different operating conditions and with the numerical simulation are presented and discussed.
4.1. Experimental Results
4.1.1. Time-Signals
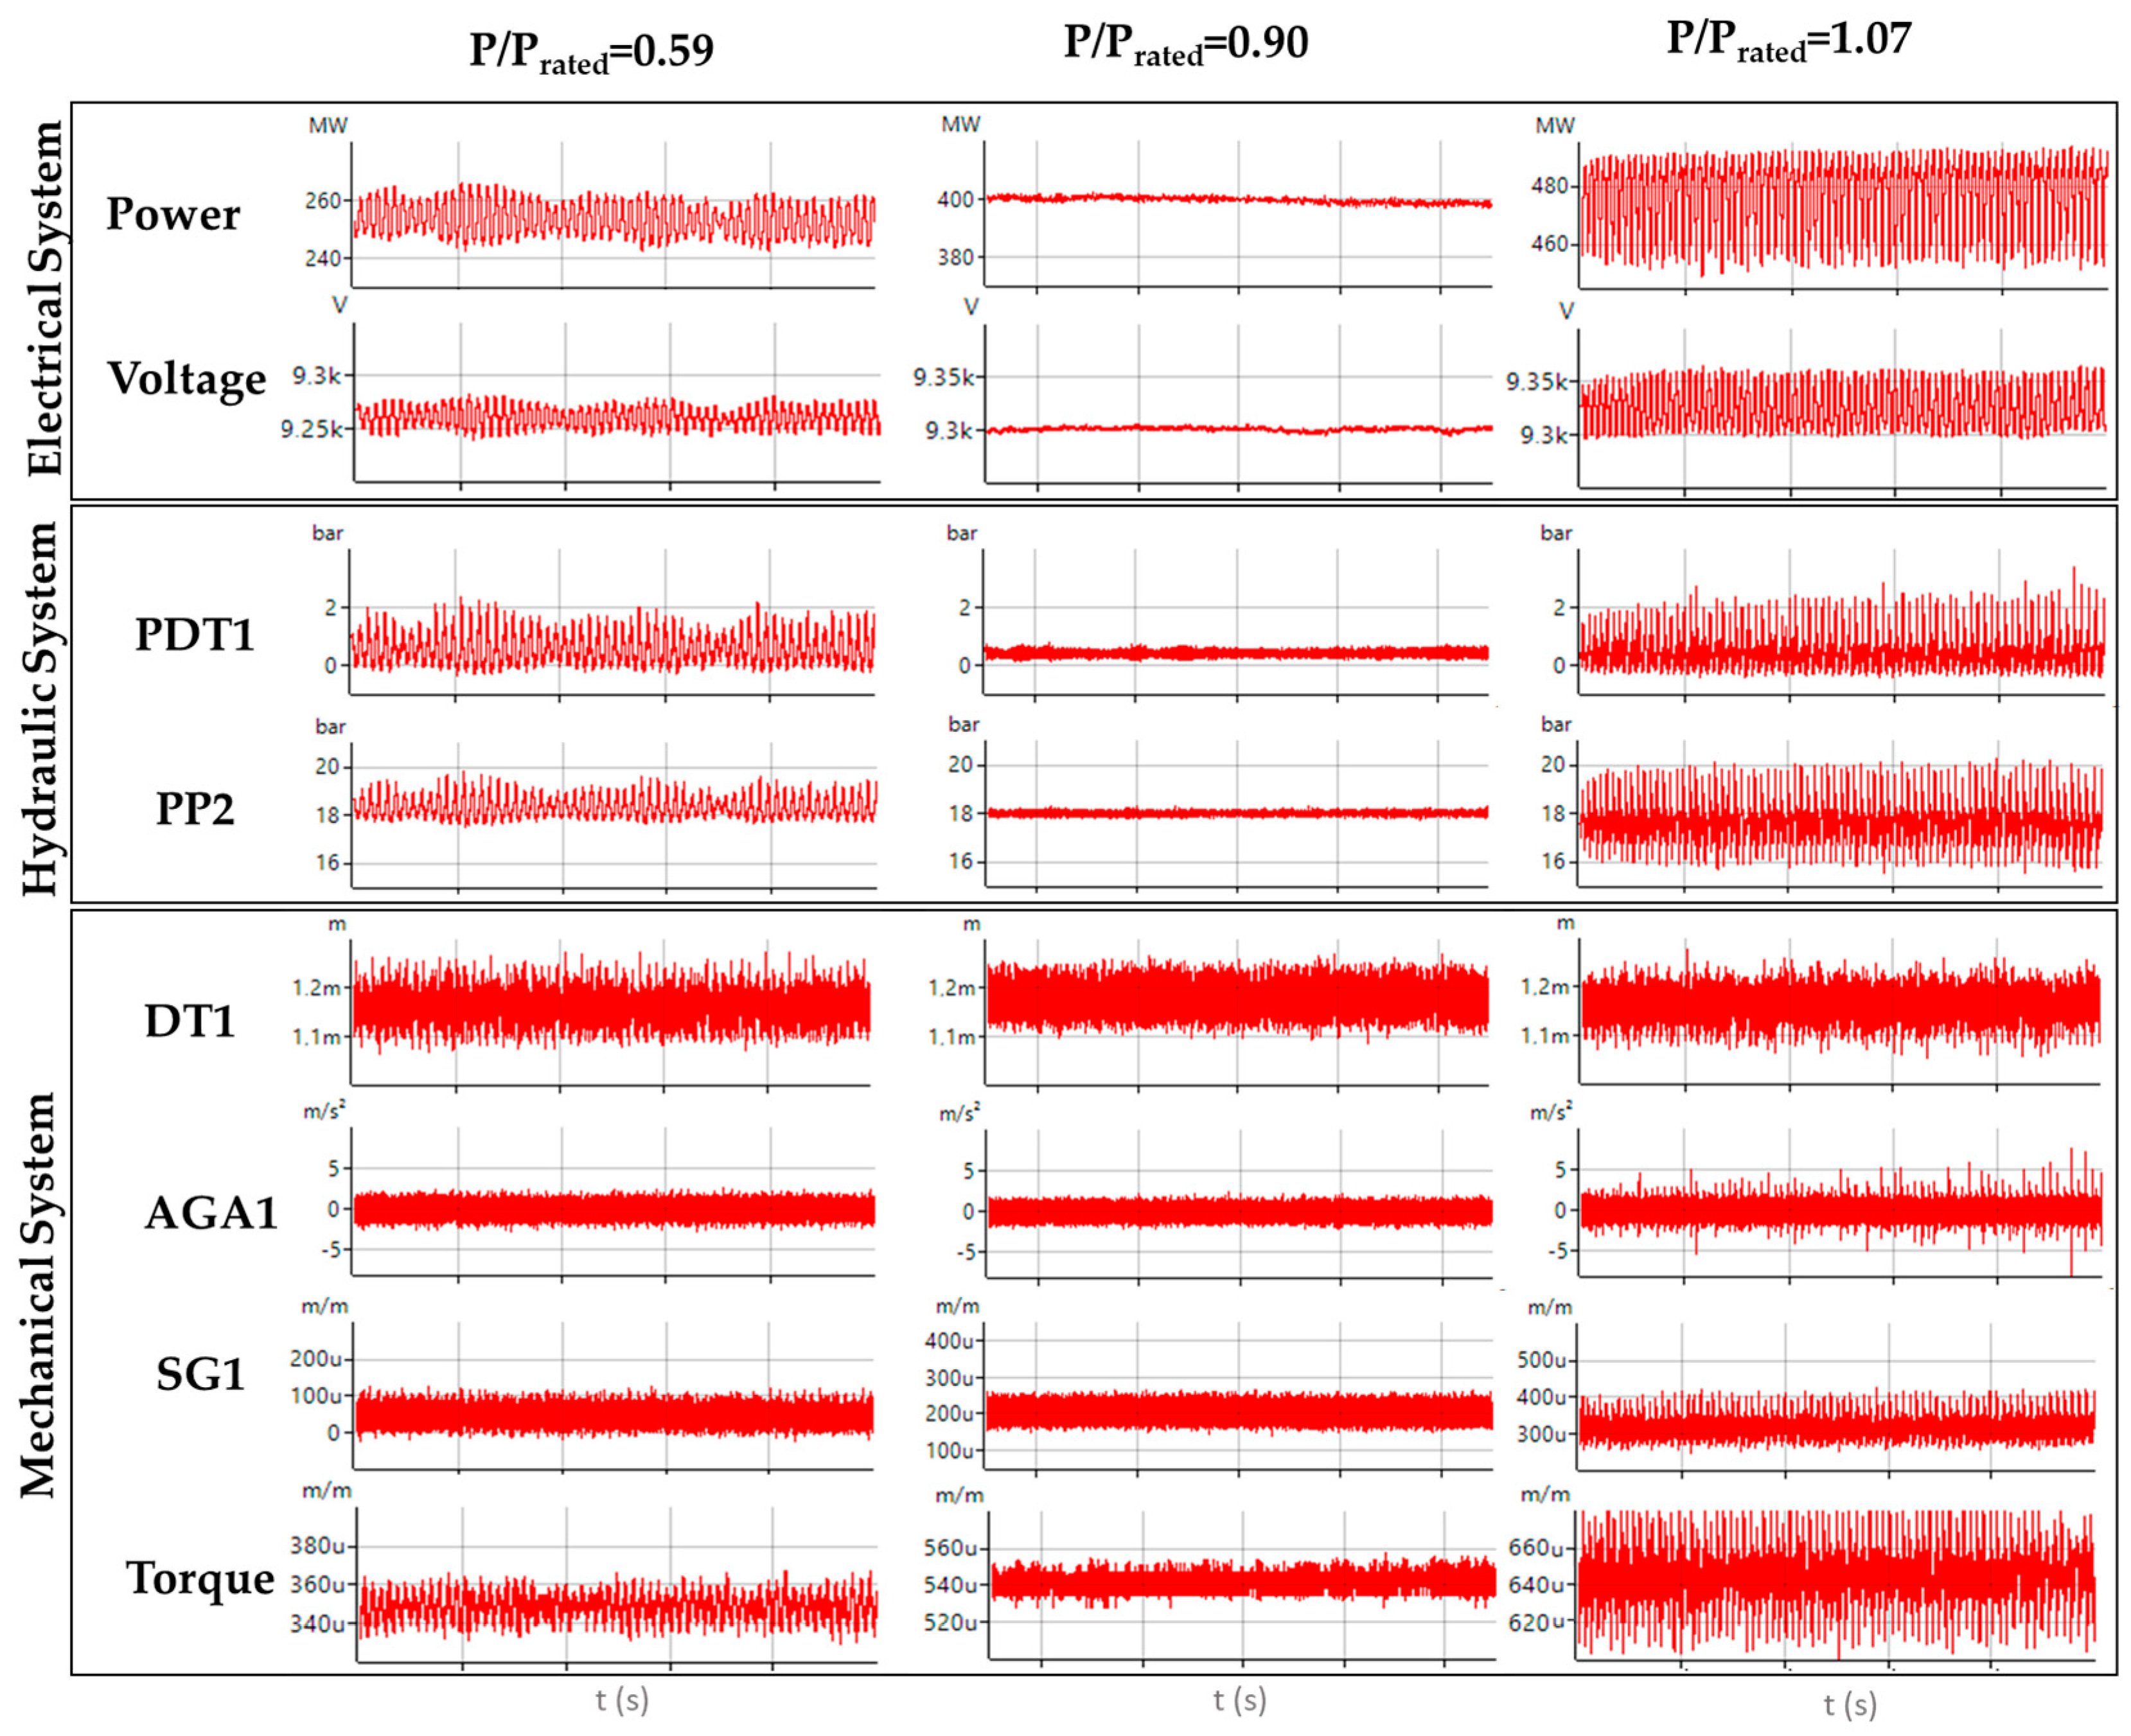
The time-signals (100 s of signal) of different sensors for three different operating conditions are seen in Figure 5. Three different operating conditions have been plotted in this figure: P/Prated = 0.59, which corresponds to the part load instability, P/Prated = 0.90, which is an operation near the BEP and P/Prated = 1.07, which is the overload instability. Moreover, different parameters from the electrical, hydraulic, and mechanical system are plotted with the same scale between operating conditions. It is clearly seen that for the part load and overload instabilities, the power fluctuates considerably, whereas for the BEP, it remains constant along the time. For these conditions, other parameters, such as the voltage, the pressure in draft tube (PDT1), or penstock (PP2) or the torque also fluctuate, while in the shaft displacement (DT1), strain in the runner (SG1), or the axial vibration in the generator no fluctuations are detected. The power fluctuation in both cases is rather important: about 20 MW peak to peak in the part load instability and about 35 MW peak to peak in the overload instability. These situations are dangerous for the grid instability and for the structural health of the machine; therefore, they should be avoided as far as possible. Mean values and peak to peak values for the same operating conditions and sensors are also presented in Table 1.
4.1.2. Torque and Power Fluctuation
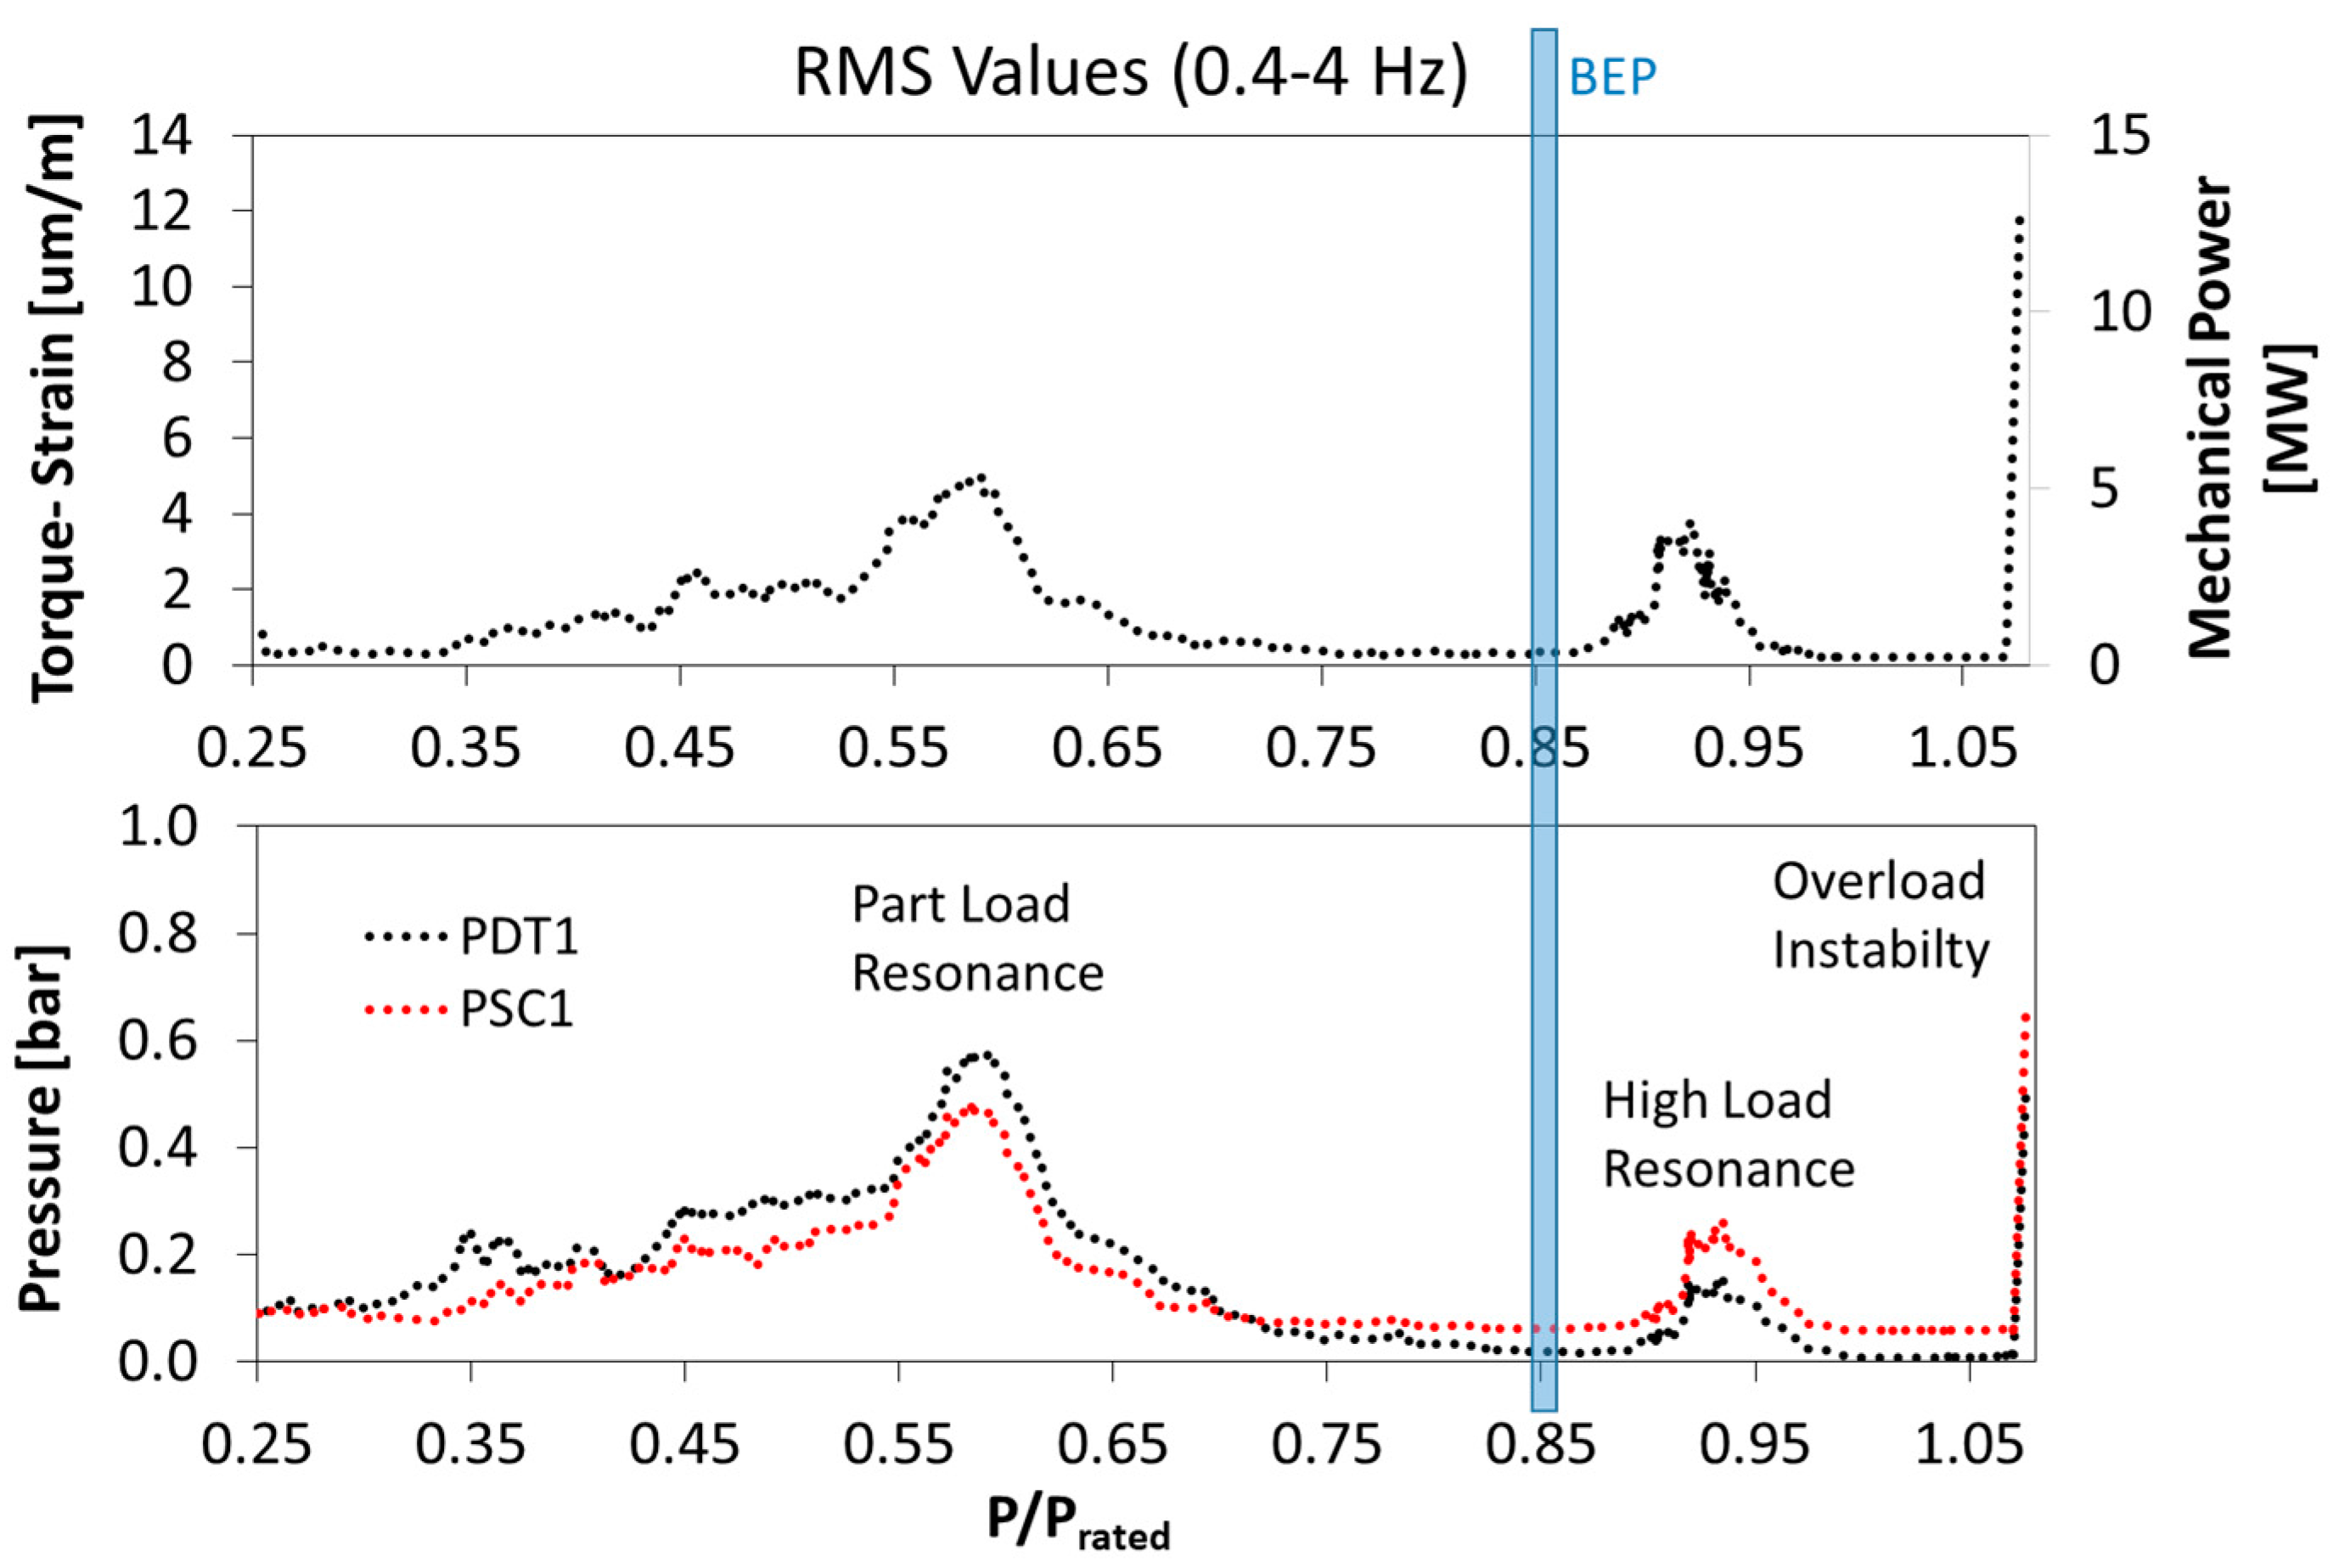
To demonstrate that the power and torque fluctuations presented in Figure 5 are due to the vortex rope and its propagation to the entire hydraulic system, an analysis of the low frequency phenomena that occurs in the whole range of operation of the Francis turbine has been performed. Figure 6 shows the Root Mean Square (RMS) values filtered from 0.4 to 4 Hz of the pressure in the draft tube (PDT1) and in the spiral casing (PSC1) at the same time than the mechanical torque and power in the shaft. There are the clearly detected three zones where the torque fluctuates significantly: the part load resonance (P/Prated = 0.59), a resonance called “high load resonance” (P/Prated = 0.92), because it is found over the BEP and the overload instability (P/Prated = 1.07). The pressure in the draft tube and in the spiral casing follows the same trend than the mechanical torque over the whole operating range.
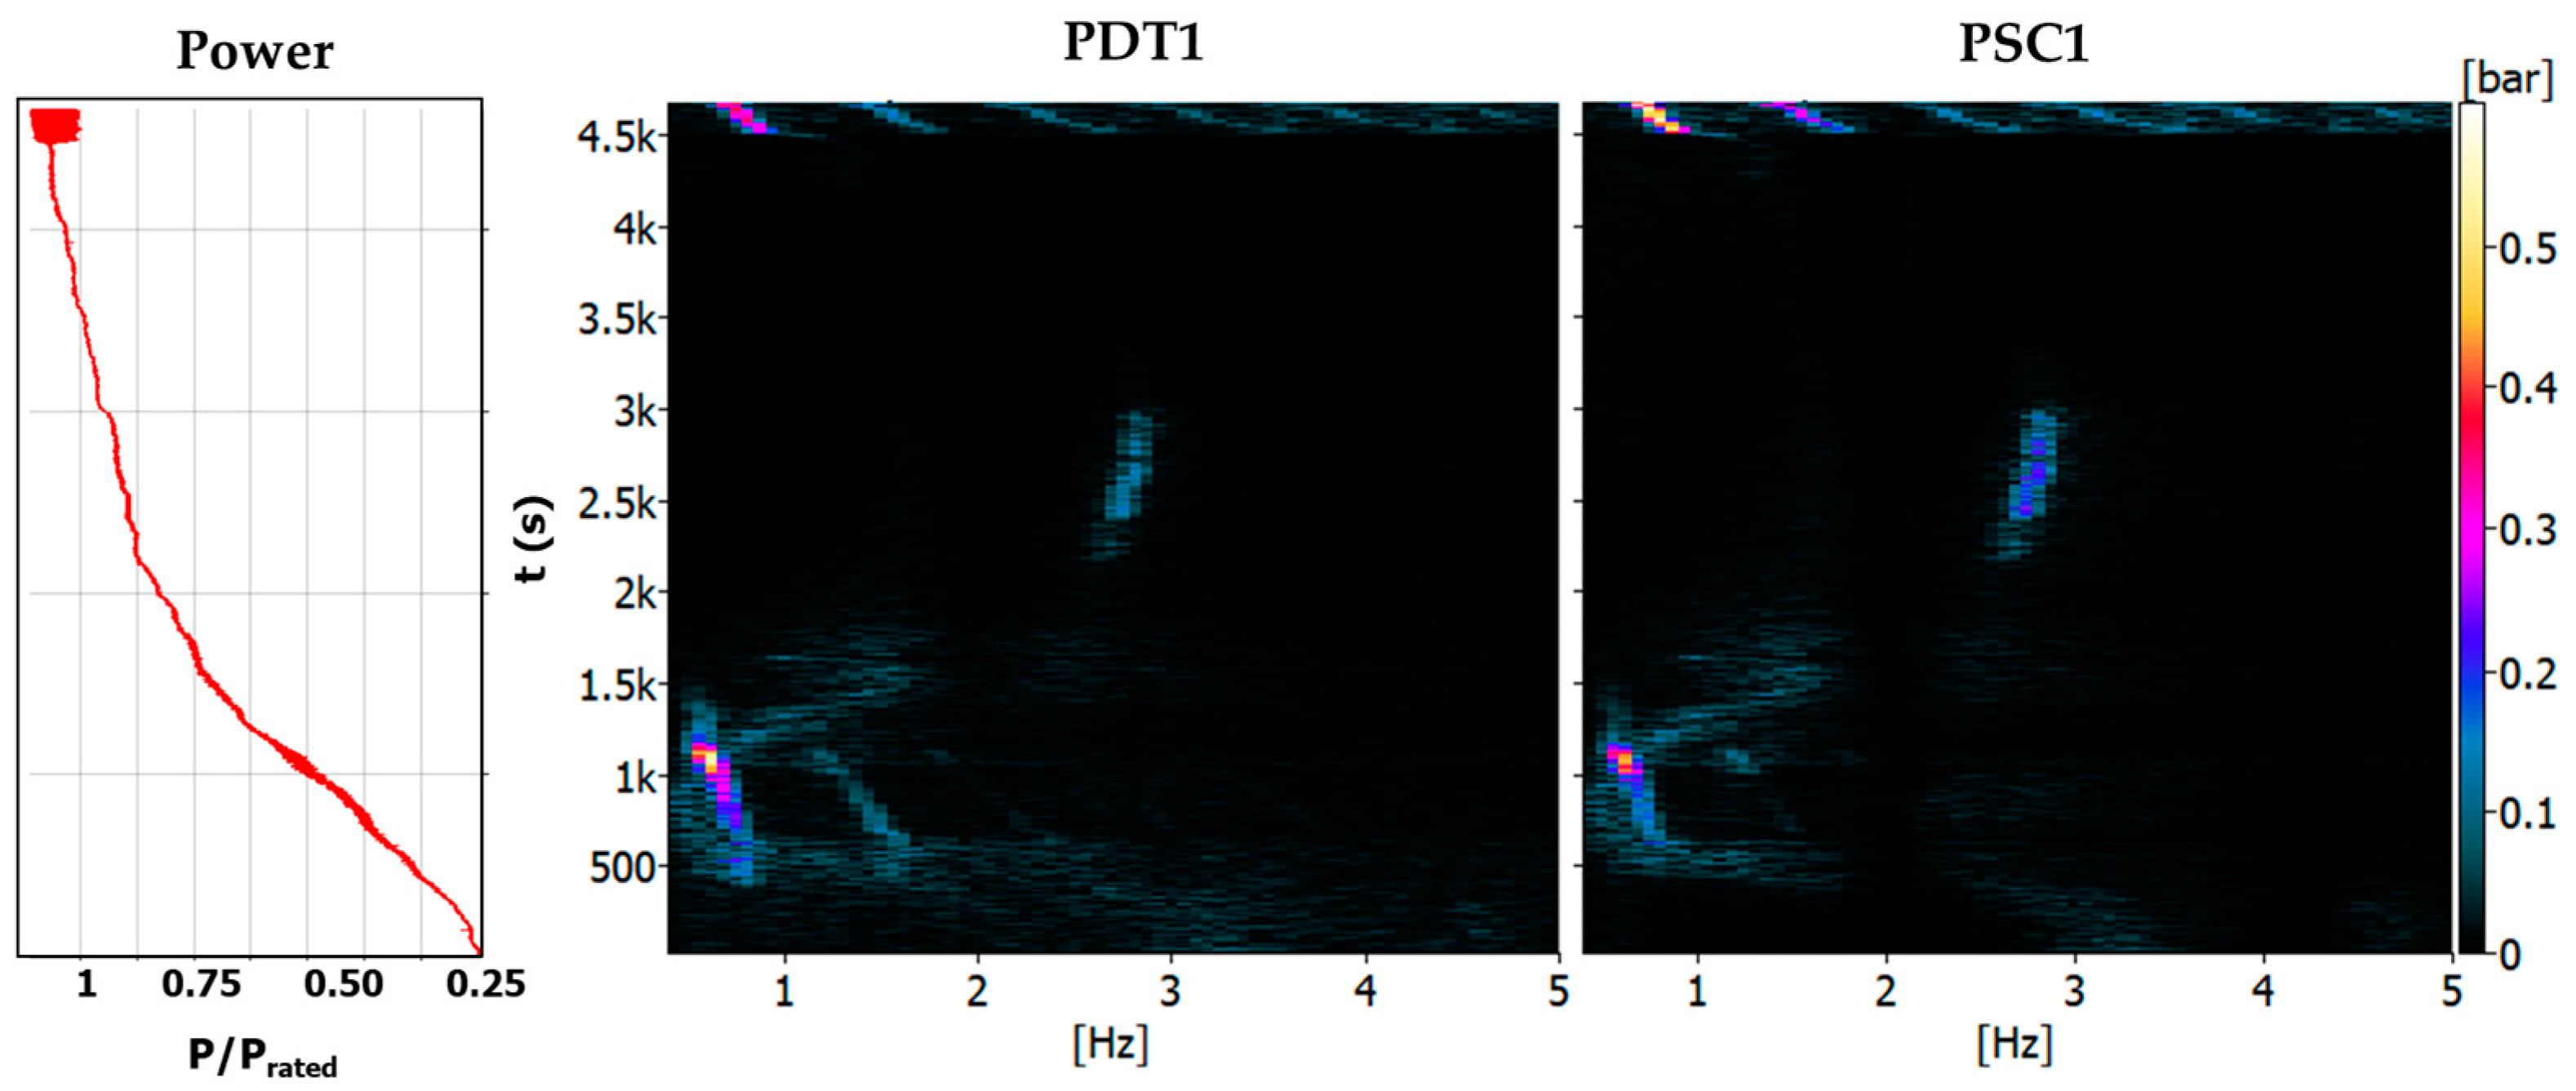
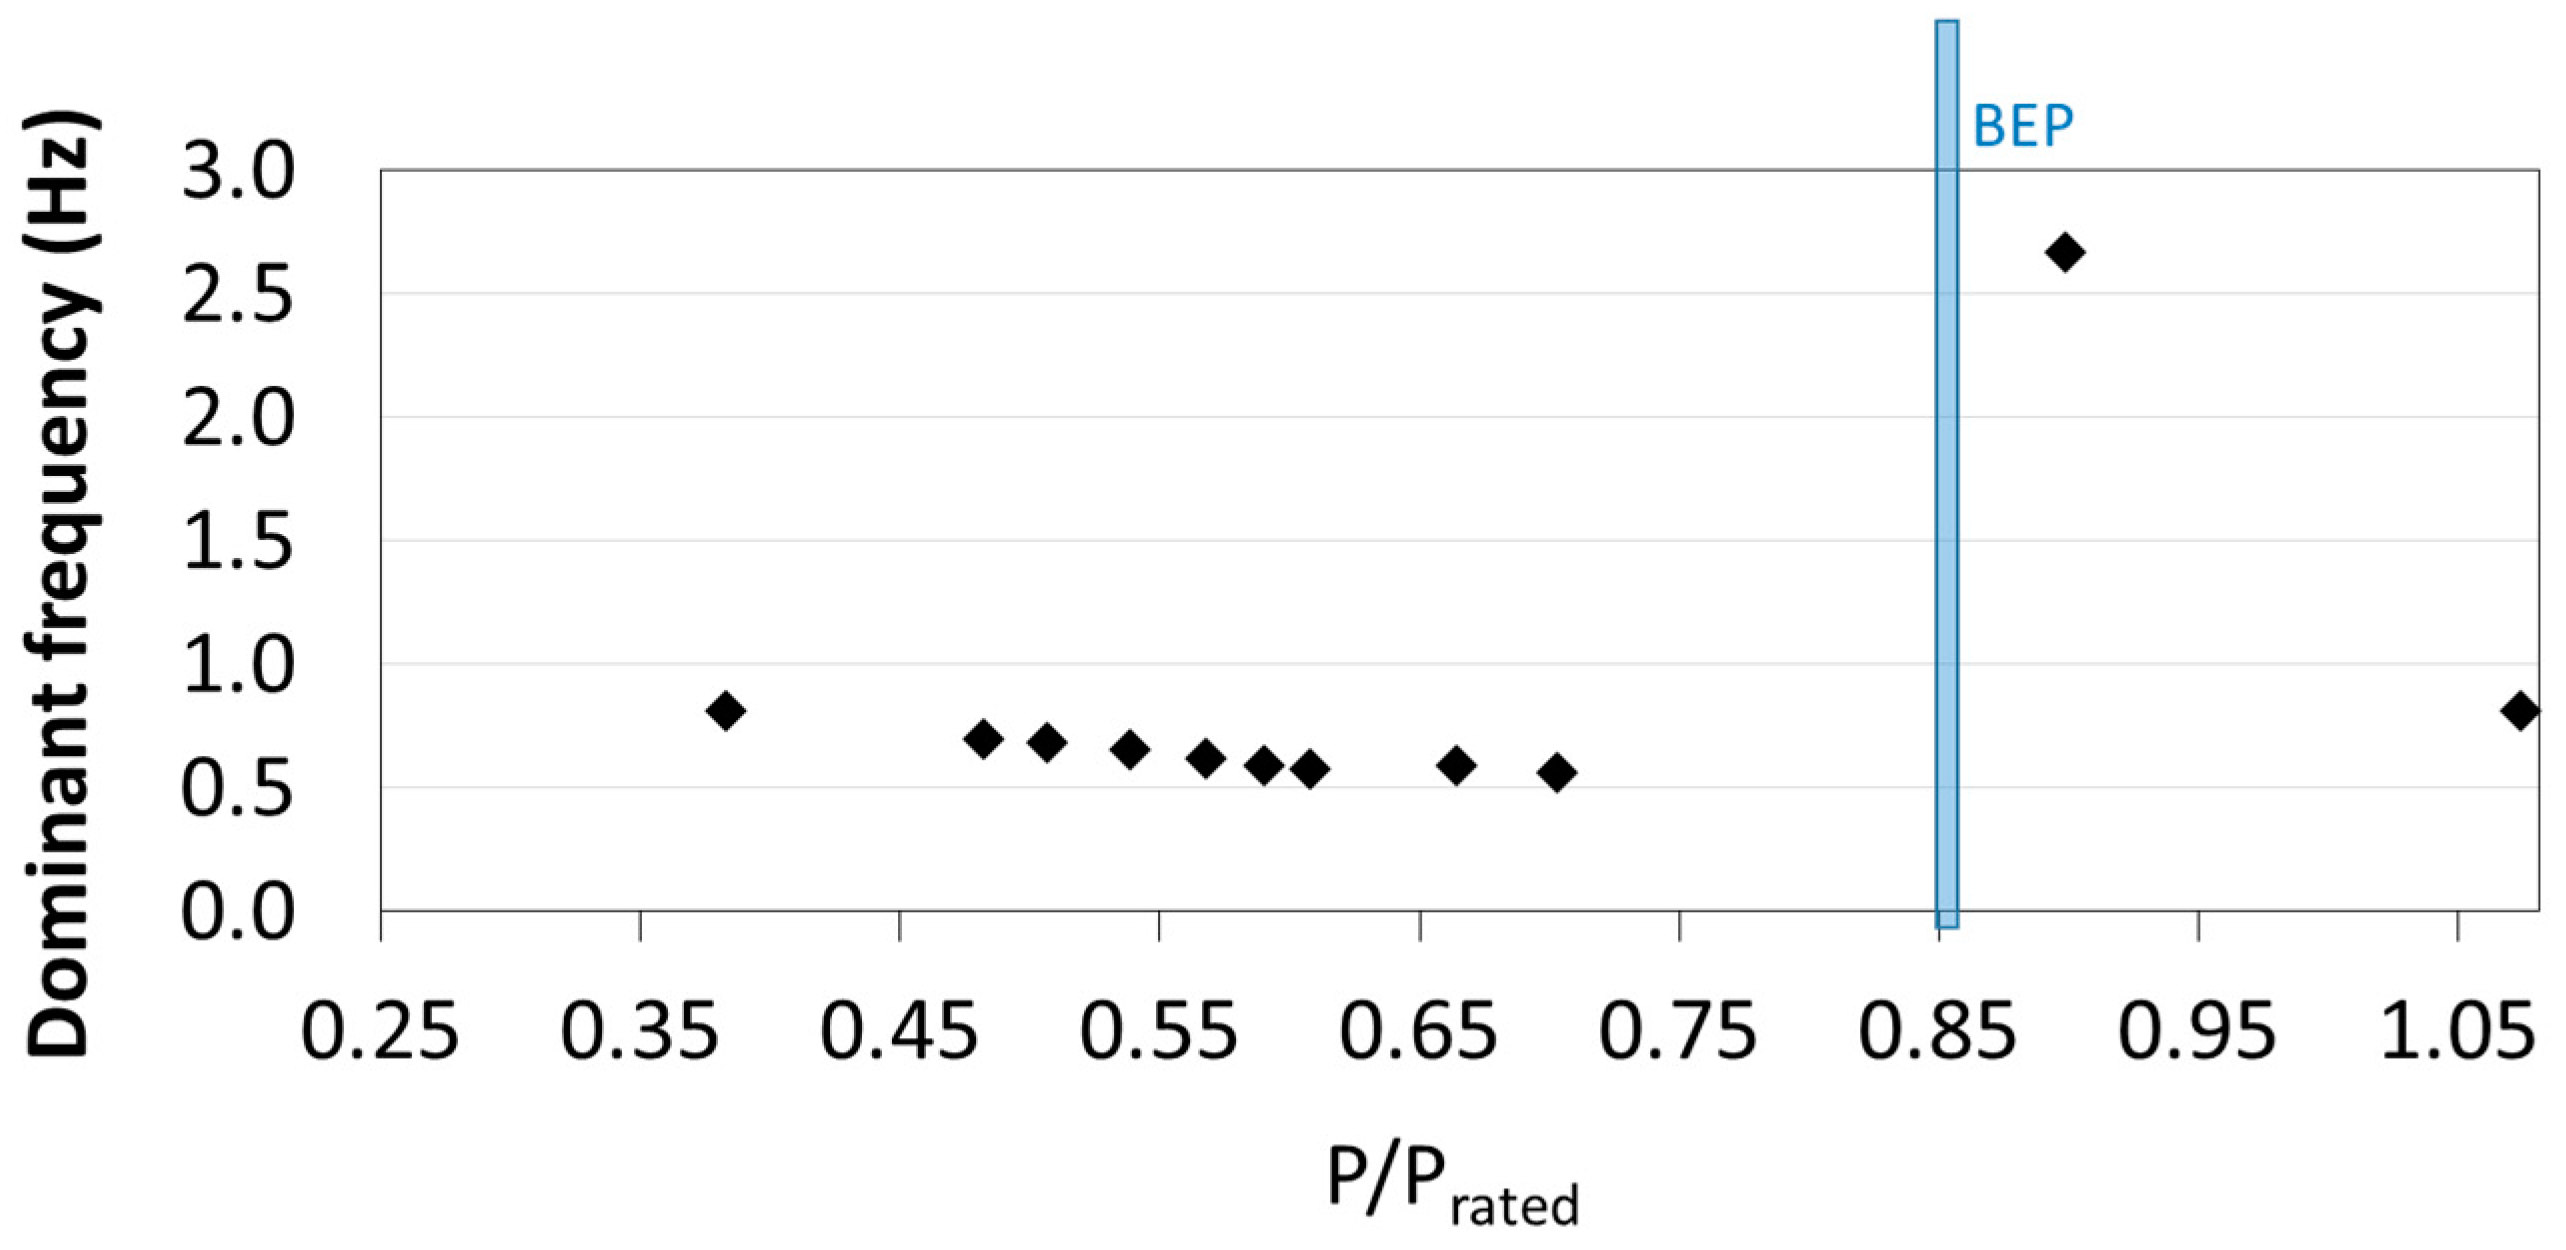
To better understand these results, a time-frequency analysis of the pressure in the draft tube (PDT1) and spiral casing (PSC1) has been carried out during a slow ramp-up (power from minimum to maximum) of 1 h and 20 min of duration approximately. Figure 7 shows the results that were obtained for this analysis. In comparison with Figure 6, here the dominant frequency of every zone is obtained. While the part load resonance and overload instability is mainly a very low frequency phenomena (0.625 Hz to 1 Hz), the dominant frequency of the high load resonance is 2.813 Hz. This dominant frequency has been plotted for the whole range of operation in Figure 8.
The part load and high load operation as well as the overload instability are analyzed and commented in detail in the following sections.
4.1.3. Part Load
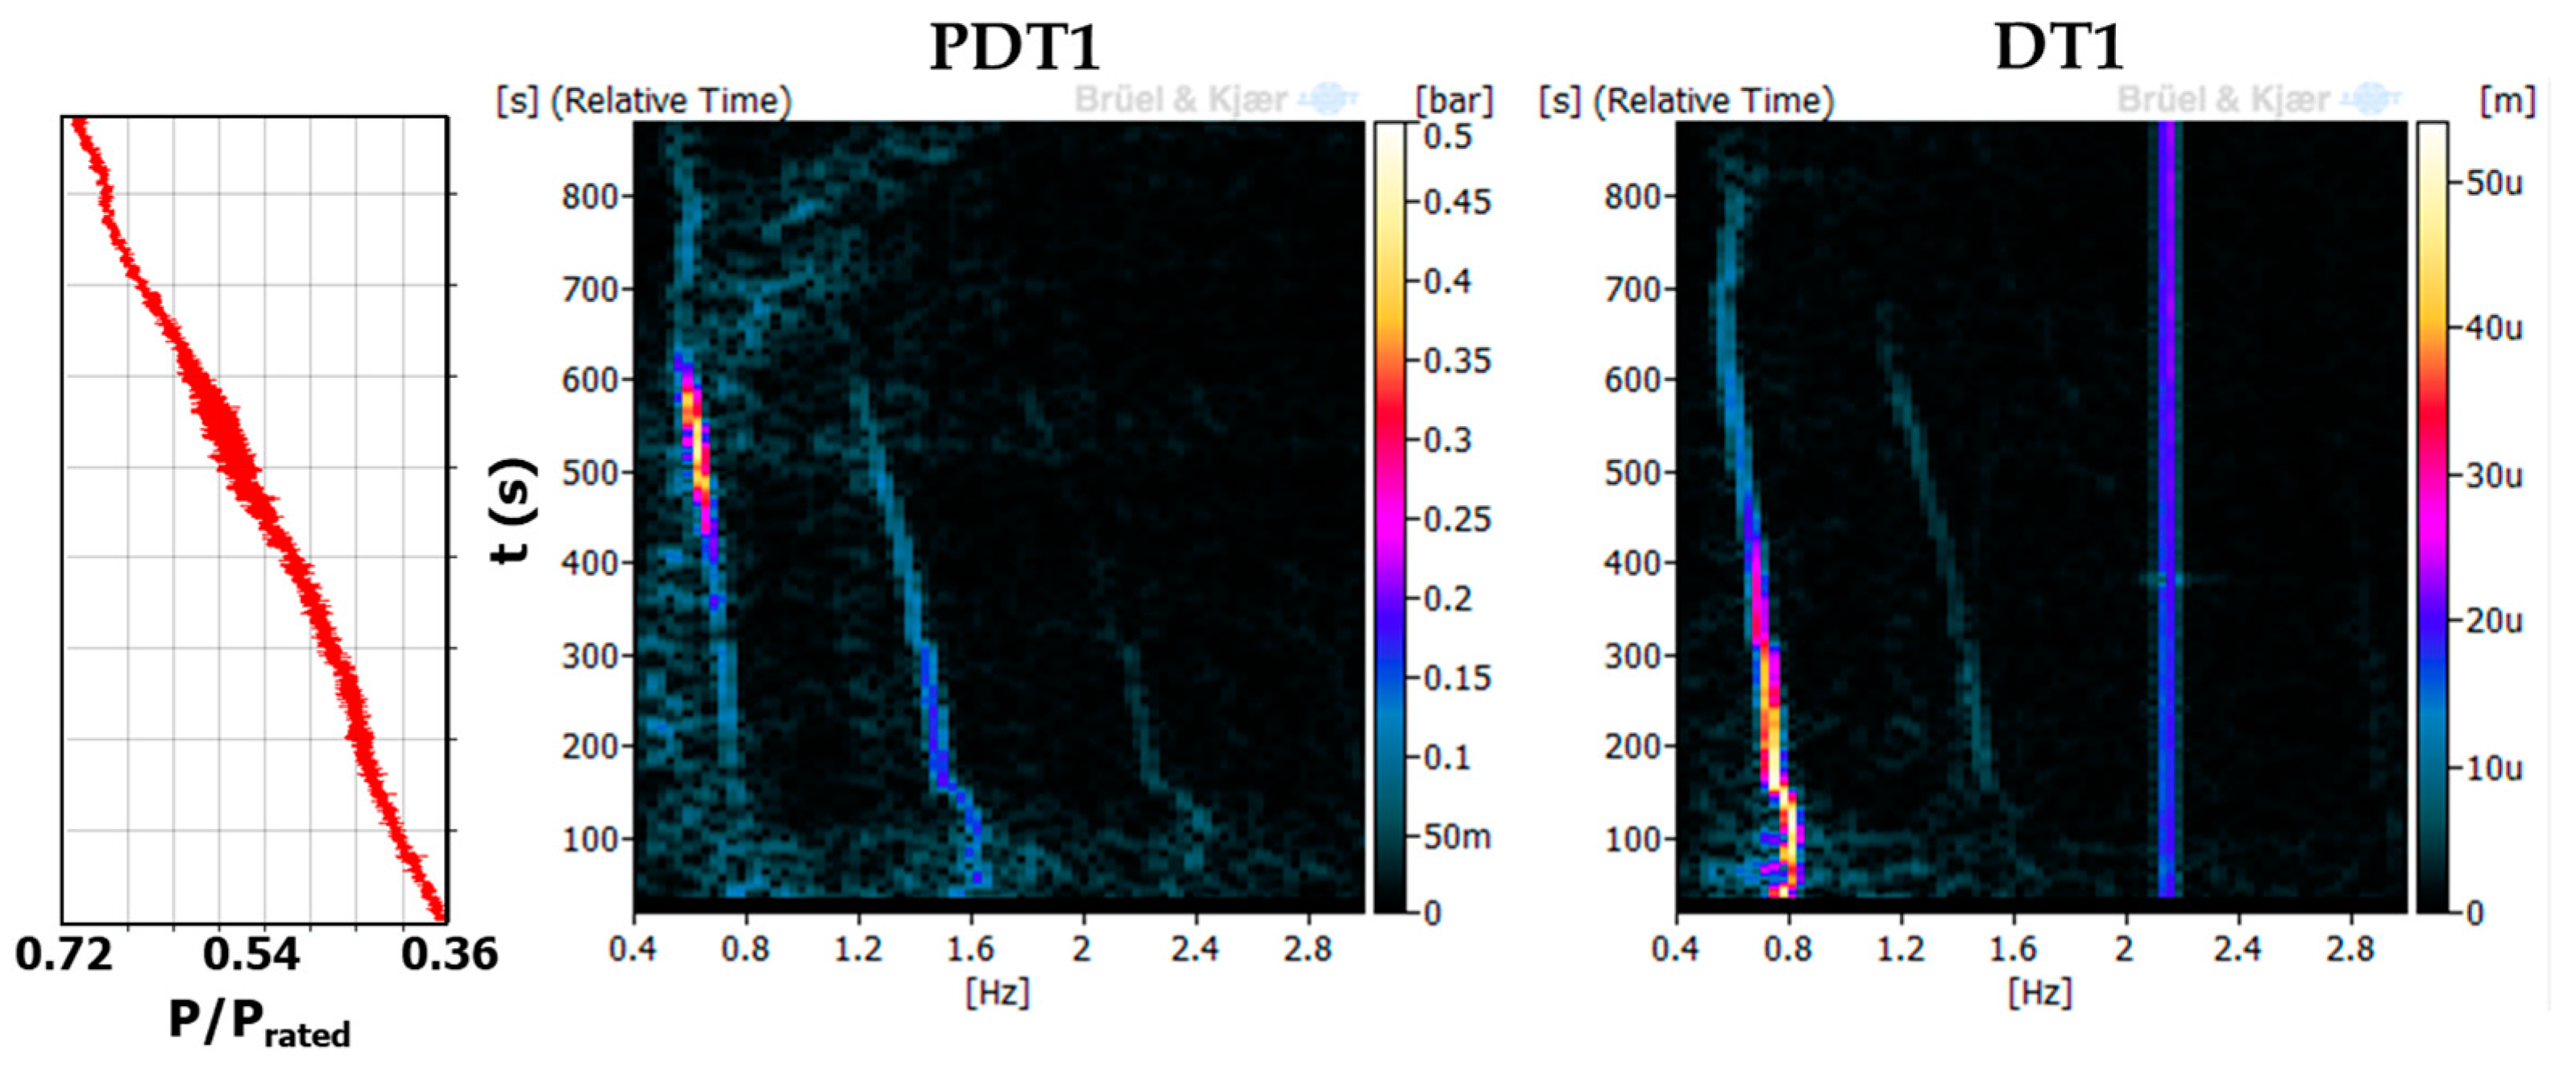
The part load operation goes from P/Prated = 0.38 to P/Prated = 0.70. During this range of operation, the vortex rope in the draft tube is present and its frequency is decreasing when increasing the flow rate and power (see Figure 8). Figure 9 shows a comparison of a time-frequency plot between a pressure sensor in the draft tube and a displacement probe in the shaft during the part load operation. It is observed that the maximum pressure in the draft tube occurs at P/Prated = 0.57, whereas the maximum displacement in the shaft is given at P/Prated = 0.40. This means that the vortex rope has an important asynchronous or radial component from P/Prated = 0.38 to 0.5, which can displace radially the whole runner, and therefore, also the shaft.
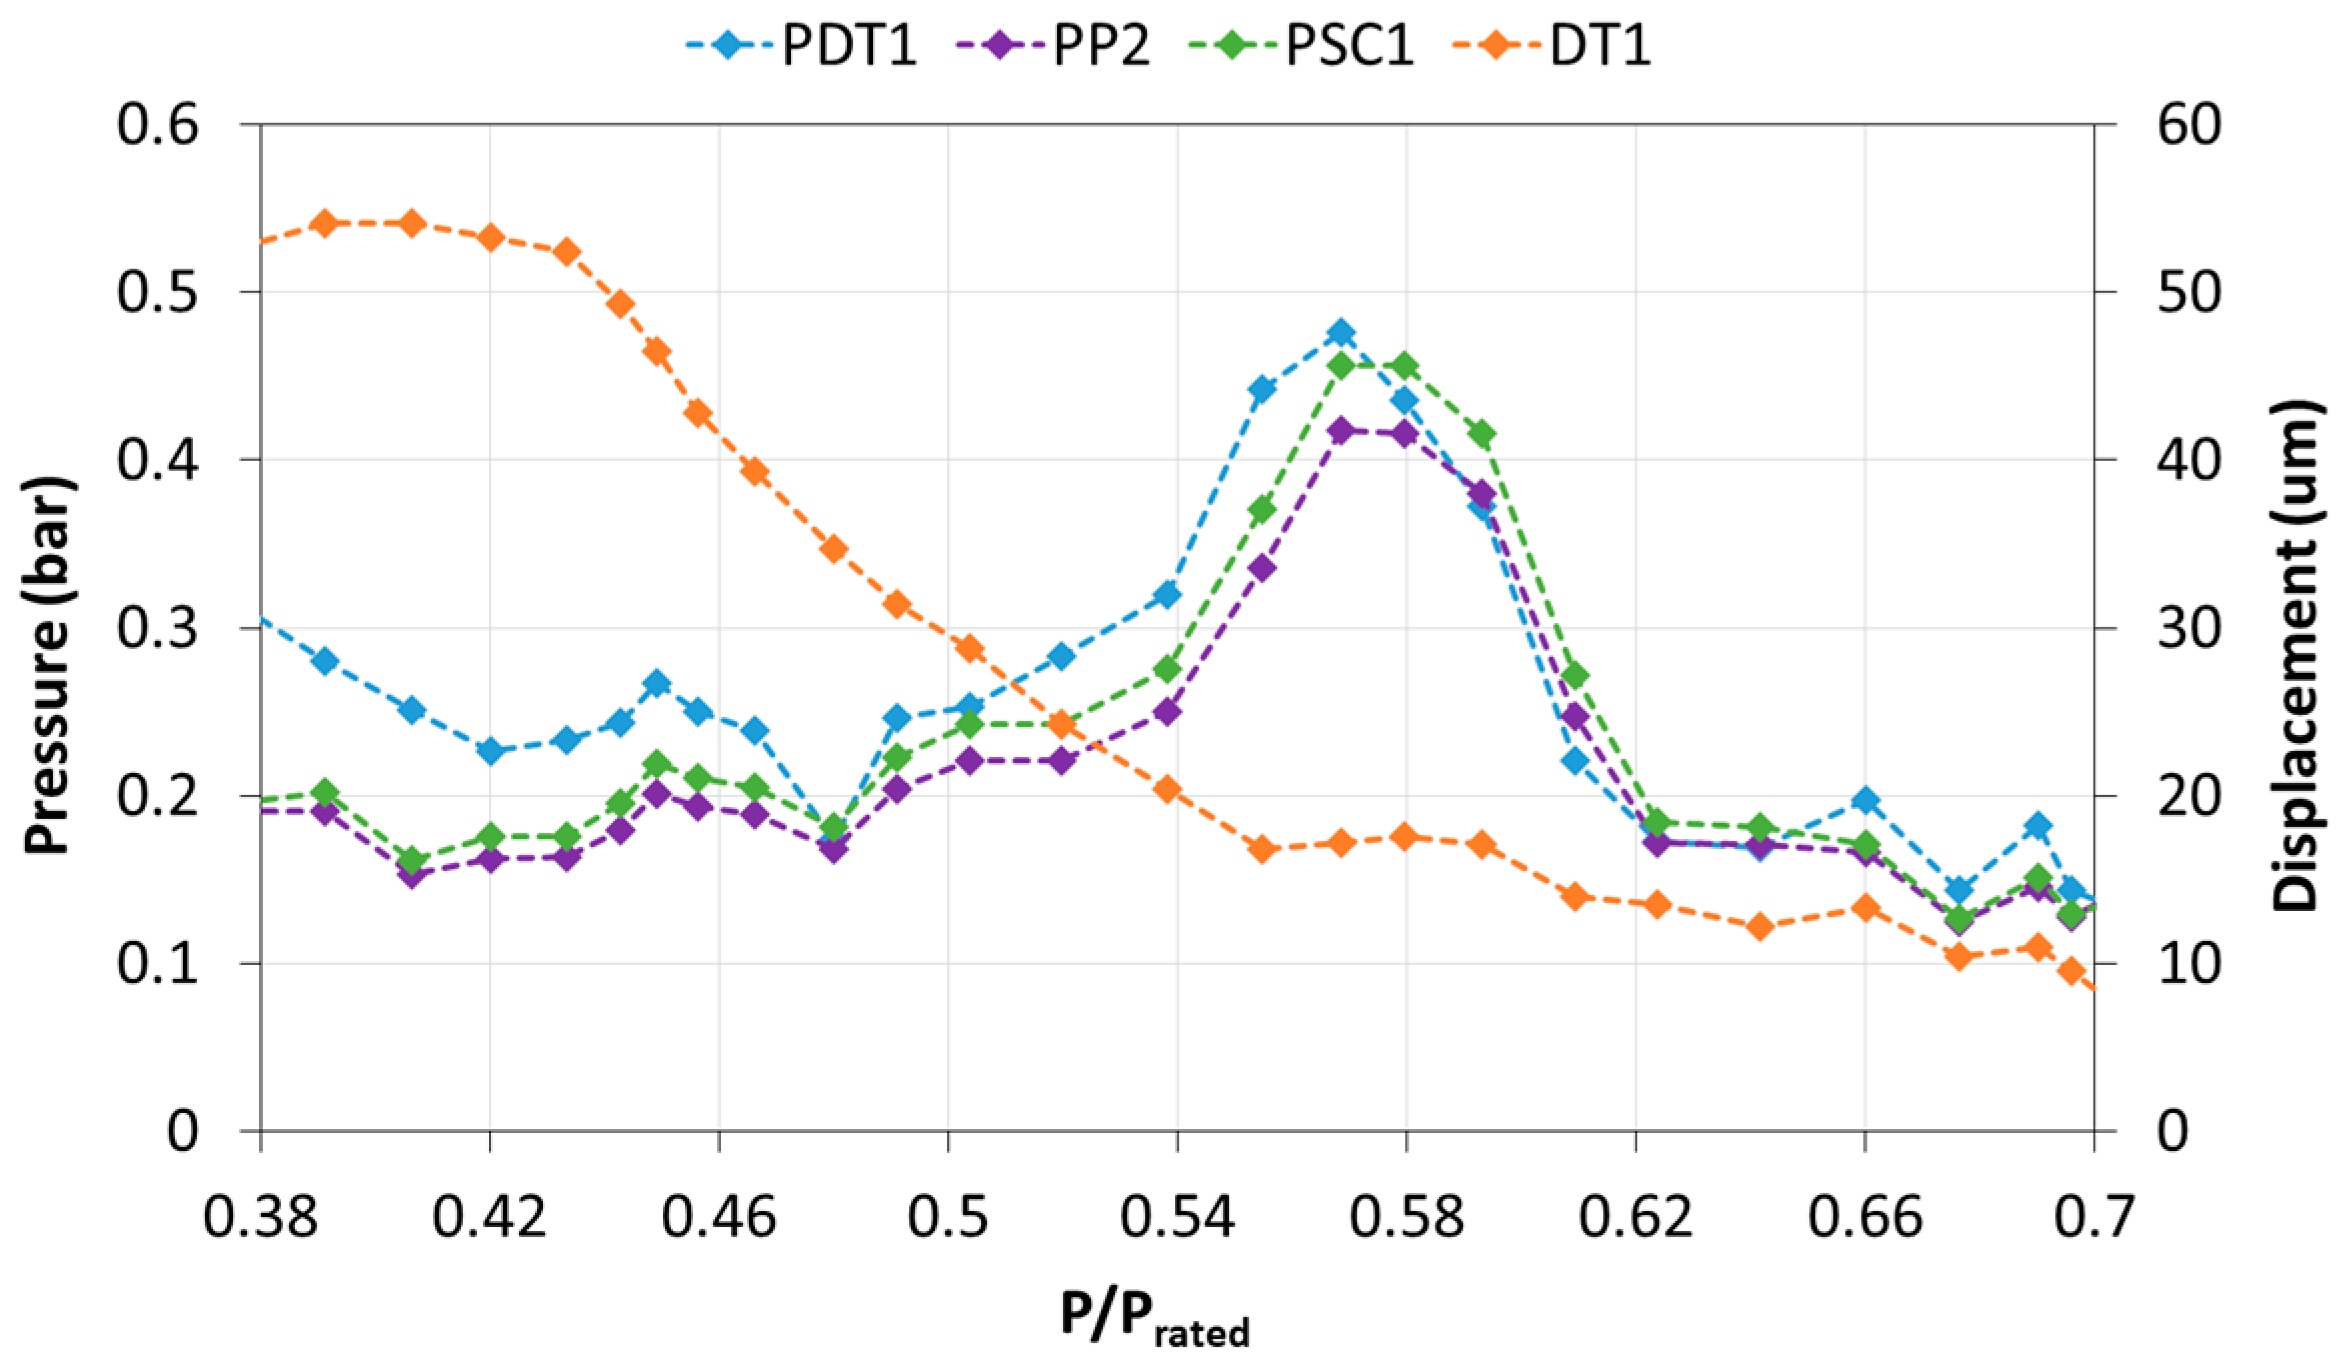
The point where the pressure fluctuation in the draft tube is maximum (P/Prated = 0.57) corresponds to the part load instability. At this point, the frequency of the vortex rope coincides with a hydro-acoustic natural frequency of the system, and it amplifies the pressure pulsation. However, at this point, the radial displacement of the shaft is small, therefore this means that the force exerted by the vortex rope over the runner is mainly in the axial direction (synchronous component). Figure 10 shows the amplitude values of the vortex rope frequency detected in the different pressure sensors and in the shaft displacement. This plot gives an idea of the asynchronous component (the one detected in the displacement probe) and of the synchronous component of the vortex rope (the one that is propagated though the whole hydraulic system and it is detected in all of the pressure sensors). When comparing Figure 6 with Figure 10, it is seen that only the synchronous component makes the torque fluctuate, and therefore the electrical power. Similar behavior was obtained by Favrel et al. in a laboratory test model [6,8].
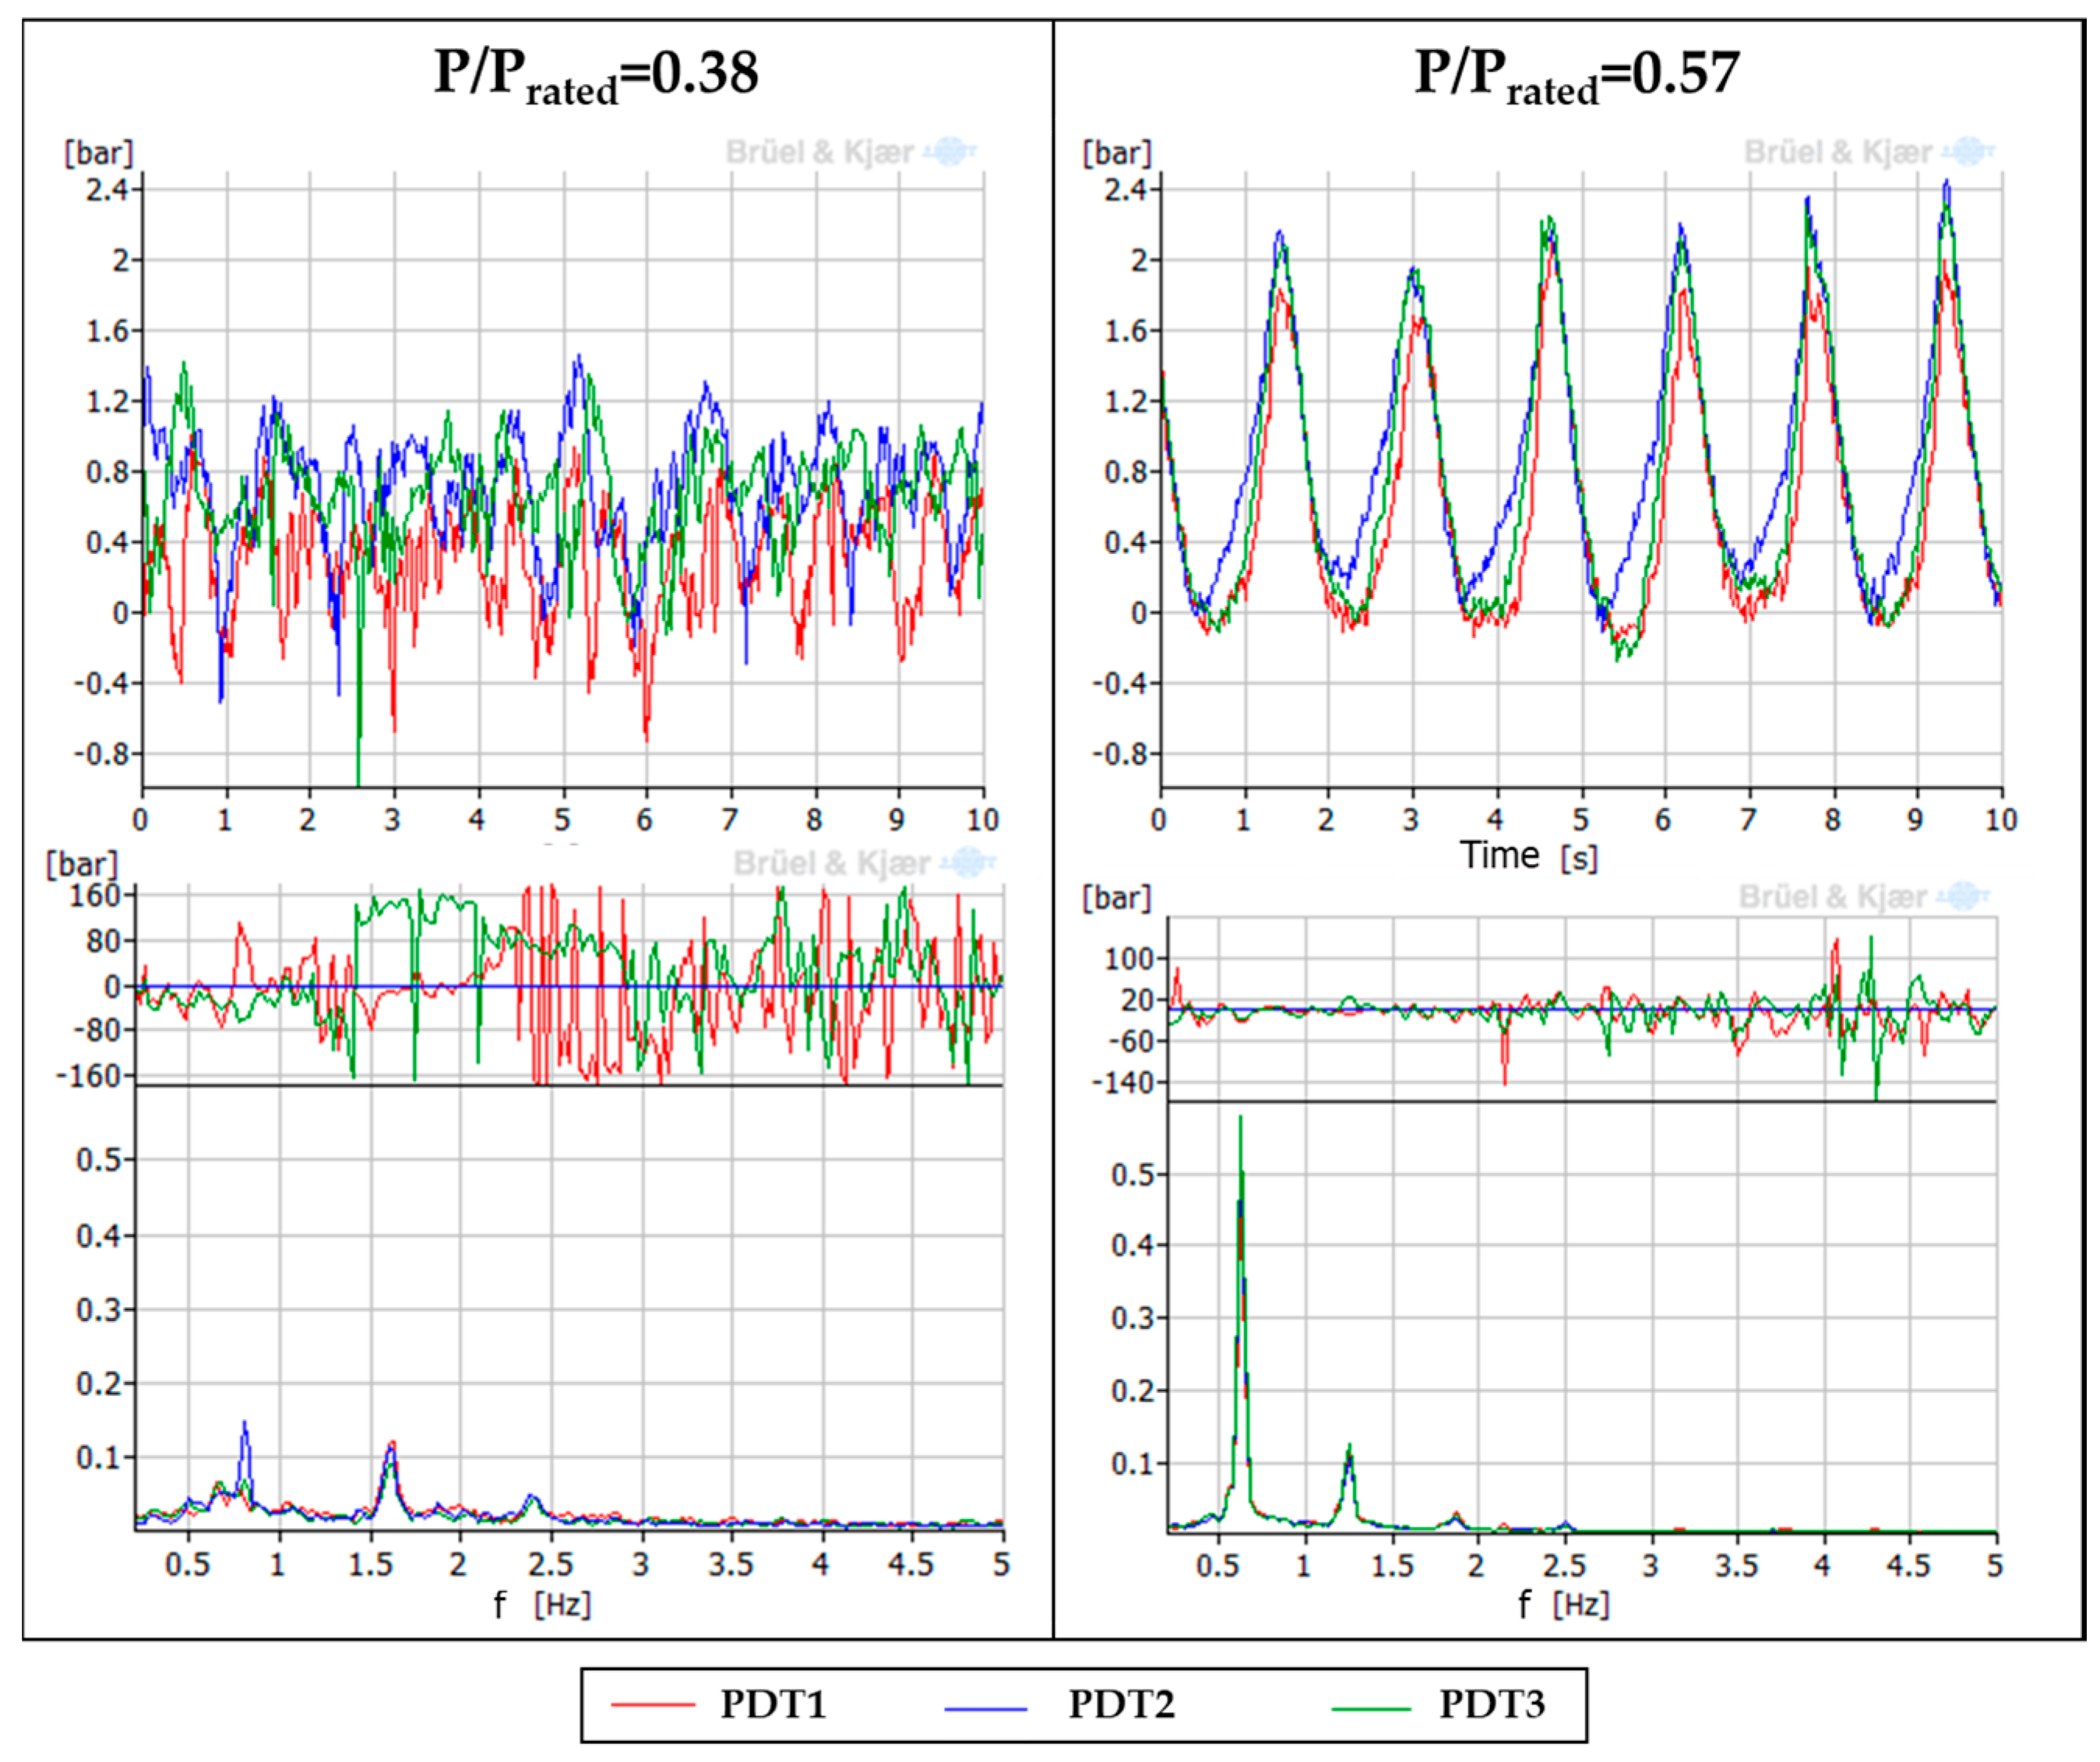
To confirm the asynchronous and synchronous behavior of the vortex rope for different operating points in the part load operation, the results obtained by the different pressure sensors installed in the same cross-section of the draft tube have been analyzed. This method was introduced previously by Manderla et al. [18] and Bouloc et al. [19]. Figure 11 shows the time signals and phase-assigned spectra of the three pressure sensors that are located in the draft tube (PDT1-2-3) for two different operating points. For P/Prated = 0.38, the pressure is different for every pressure sensor in the draft tube at every moment as it can be seen in the time signal (Figure 11, top-left). Moreover, the phase-assigned spectra of these time signals with the PDT2 as reference show that there is a different phase and amplitude between the sensors at the vortex rope frequency (0.813 Hz), which means that the pressure pattern is rotating and uniform along the radial component. Therefore, at this point, the pressure pattern is confirmed to have basically an asynchronous component.
For P/Prated = 0.57, the time signals of the three pressure sensors in the draft tube present an in-phase behavior with the same amplitude (Figure 11, top-right). The phase-assigned spectra also give the same information for the vortex rope frequency (0.625 Hz). According to references [18,19], this fact indicates that the pressure pattern has mainly a synchronous component.
4.1.4. High Load
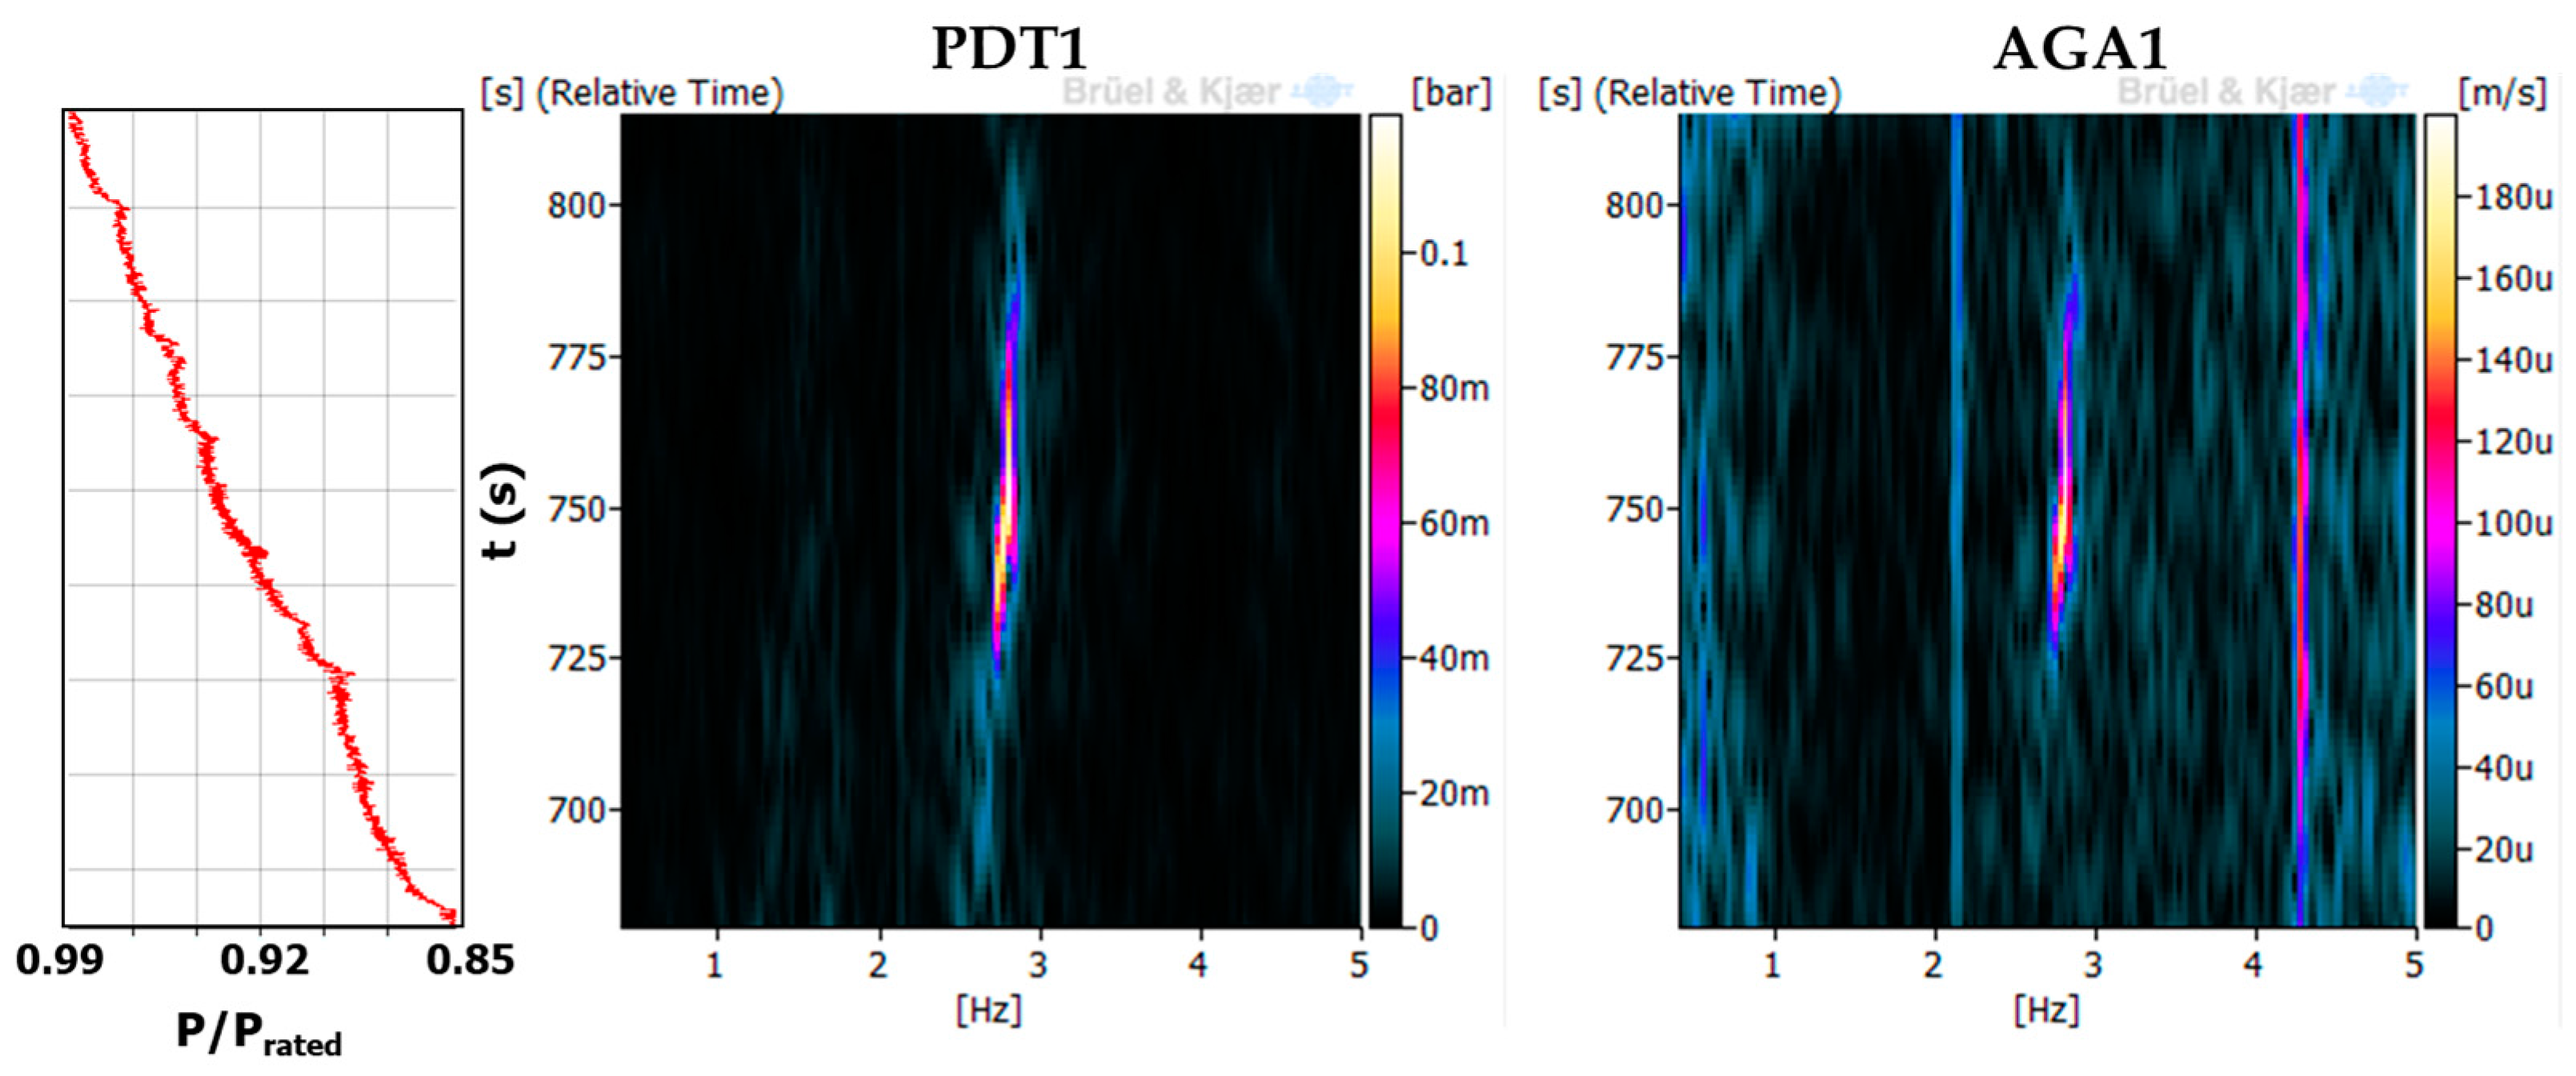
The zone called “high load” here goes from P/Prated = 0.85 to P/Prated = 0.99. During this range, a resonance in the hydraulic circuit occurs at 2.813 Hz. This resonance is clearly seen in all of the pressure sensors that are installed. Moreover, it is also detected in the axial vibration sensors located in the thrust bearing (AGA1 and AGA2) (see Figure 12). Furthermore, this hydraulic phenomenon does not have a radial motion because it is not detected in the shaft displacement as it was the part load vortex rope. Figure 13 shows the amplitude of this resonance in the different pressure sensors that are installed in the machine. This resonance occurs at P/Prated = 0.935, and the maximums of the pressure are given especially by the pressure sensors installed in the connection between spiral casing and penstock. This resonance could be a coincidence between a natural frequency of the hydraulic circuit and the frequency of an incipient overload vortex rope. The mechanical power fluctuates at this point about 4 MW RMS (11 MW peak to peak) (see Figure 6). Therefore, as in the case of the part load resonance, a synchronous pressure propagation from the draft tube to the penstock is making fluctuate the mechanical torque and so the electrical power.
4.1.5. Overload Instability
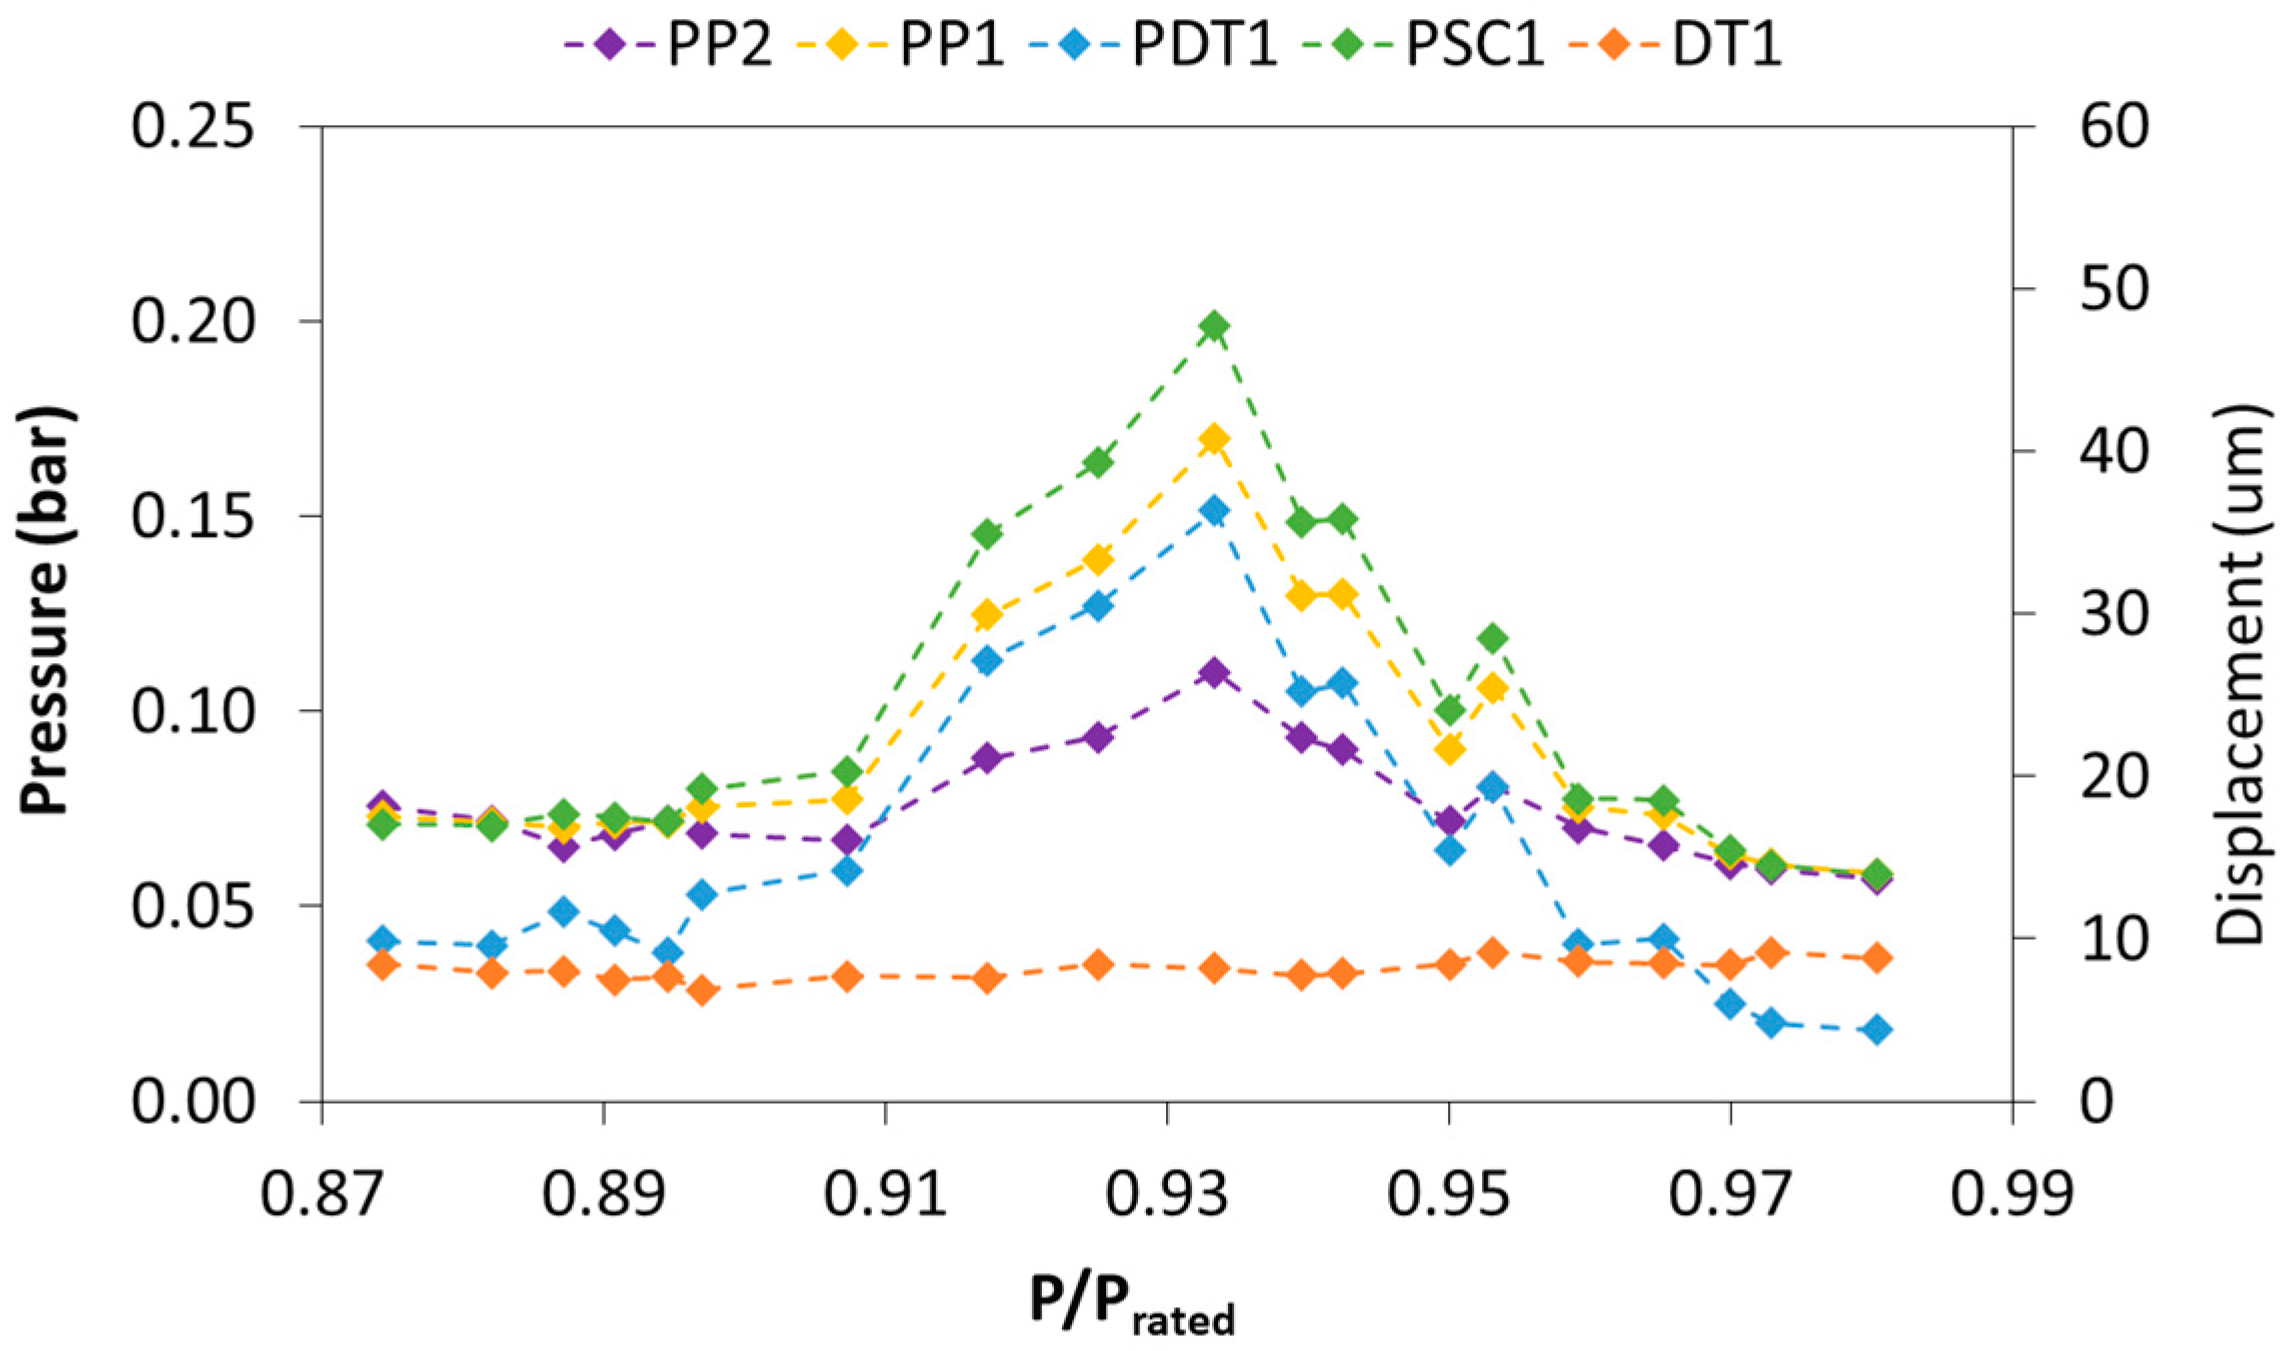
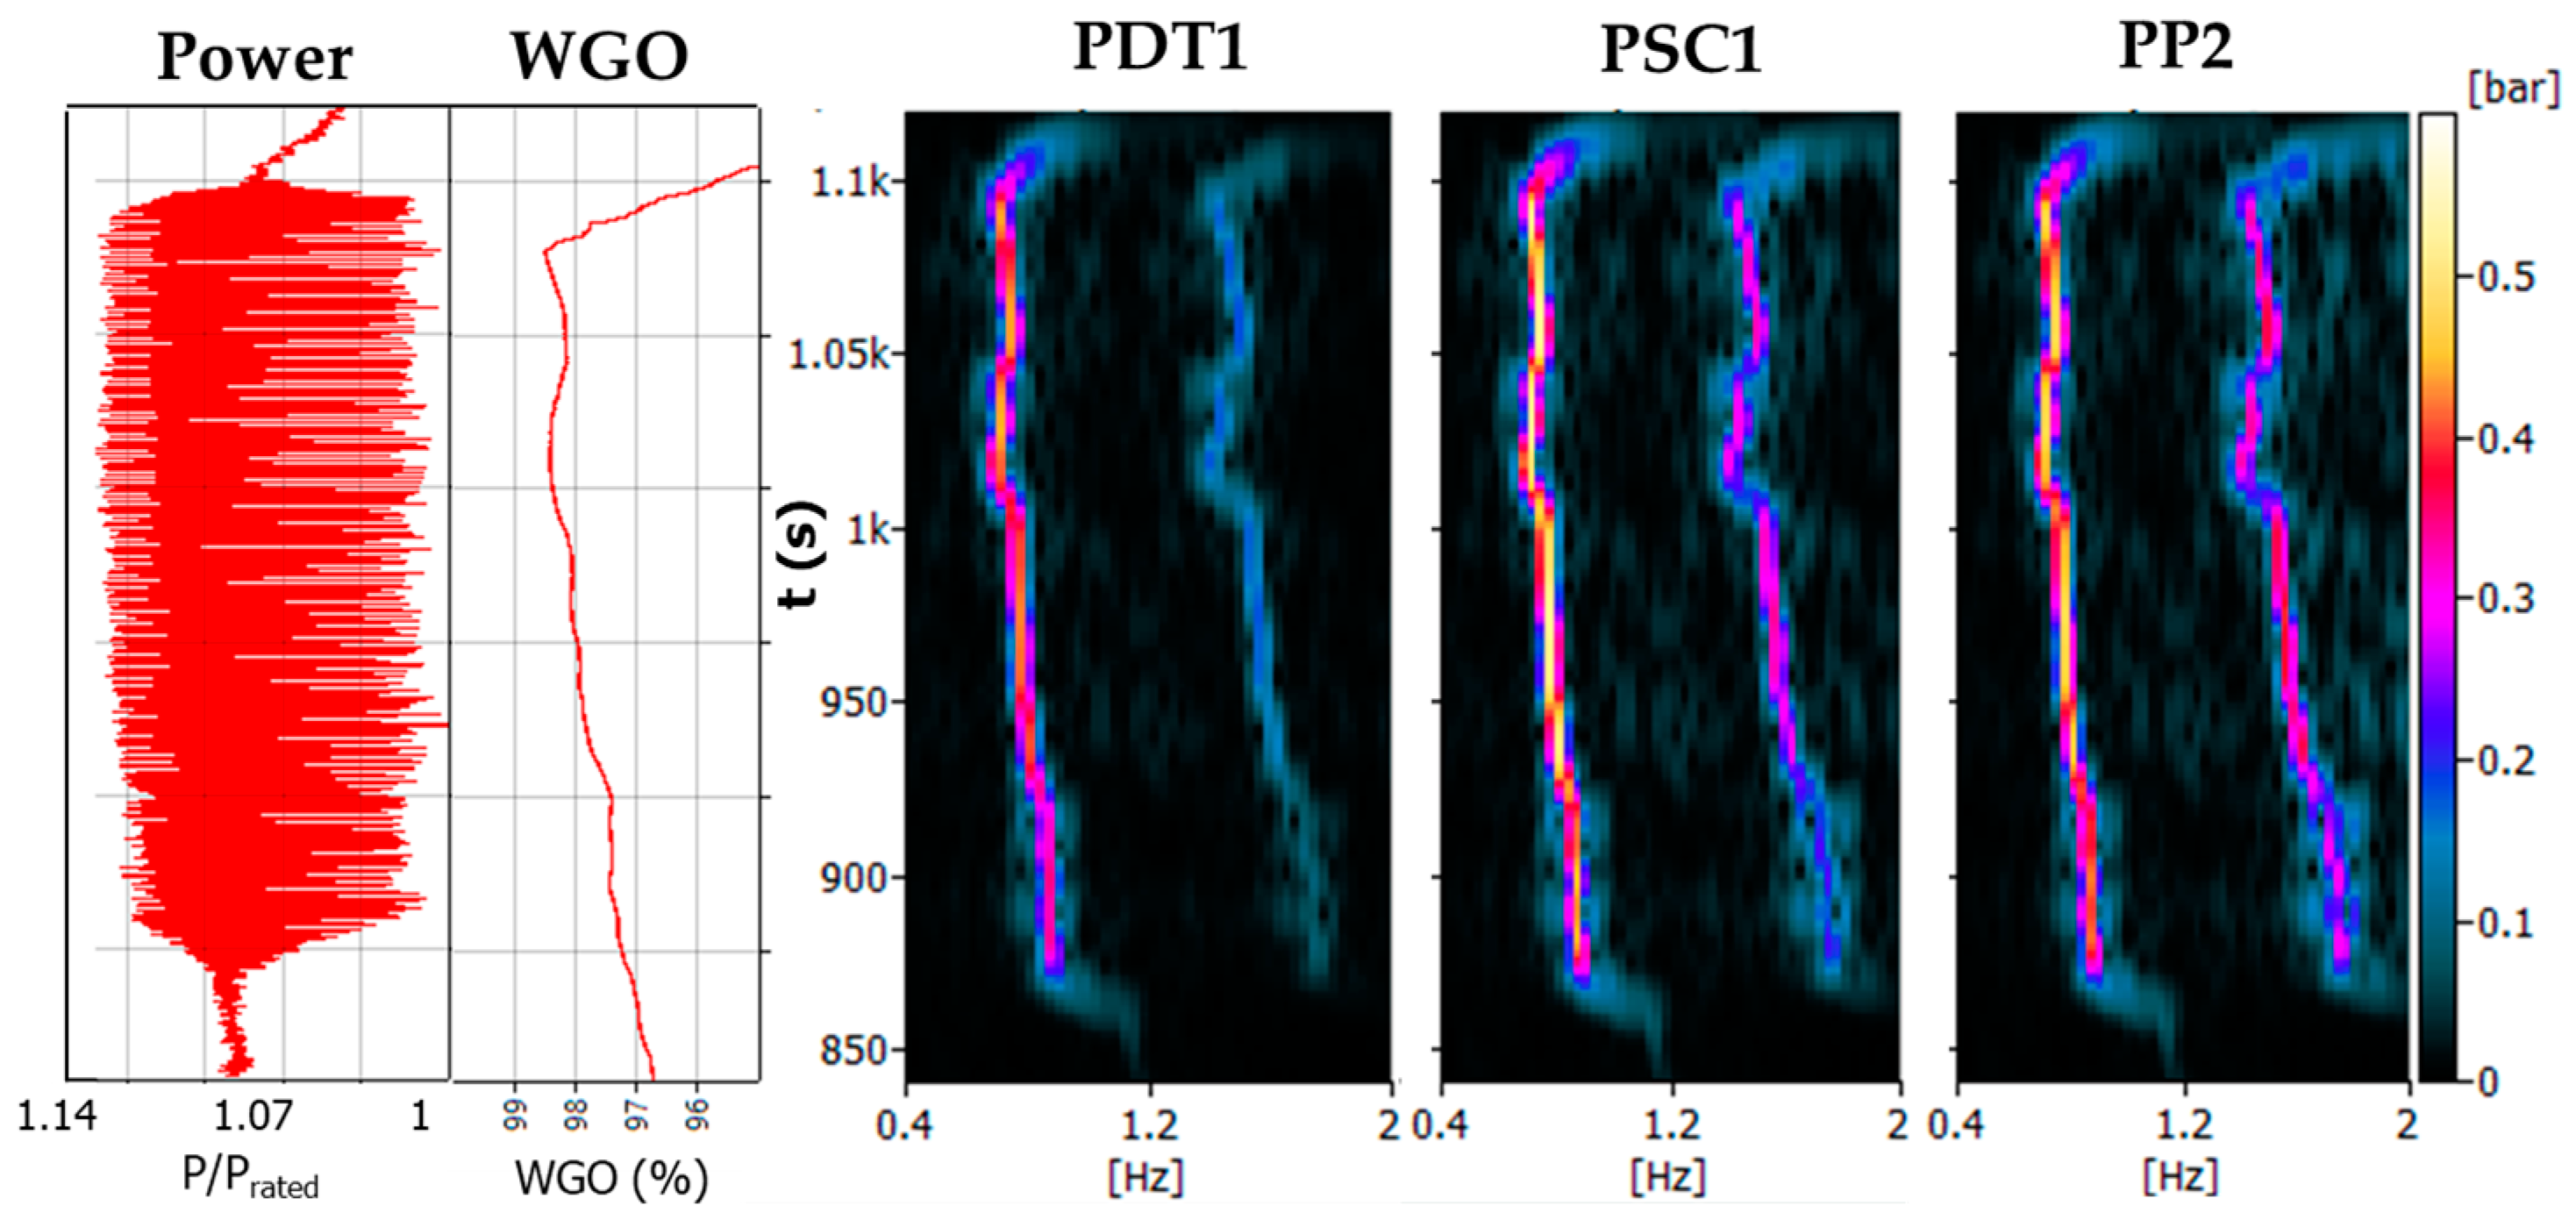
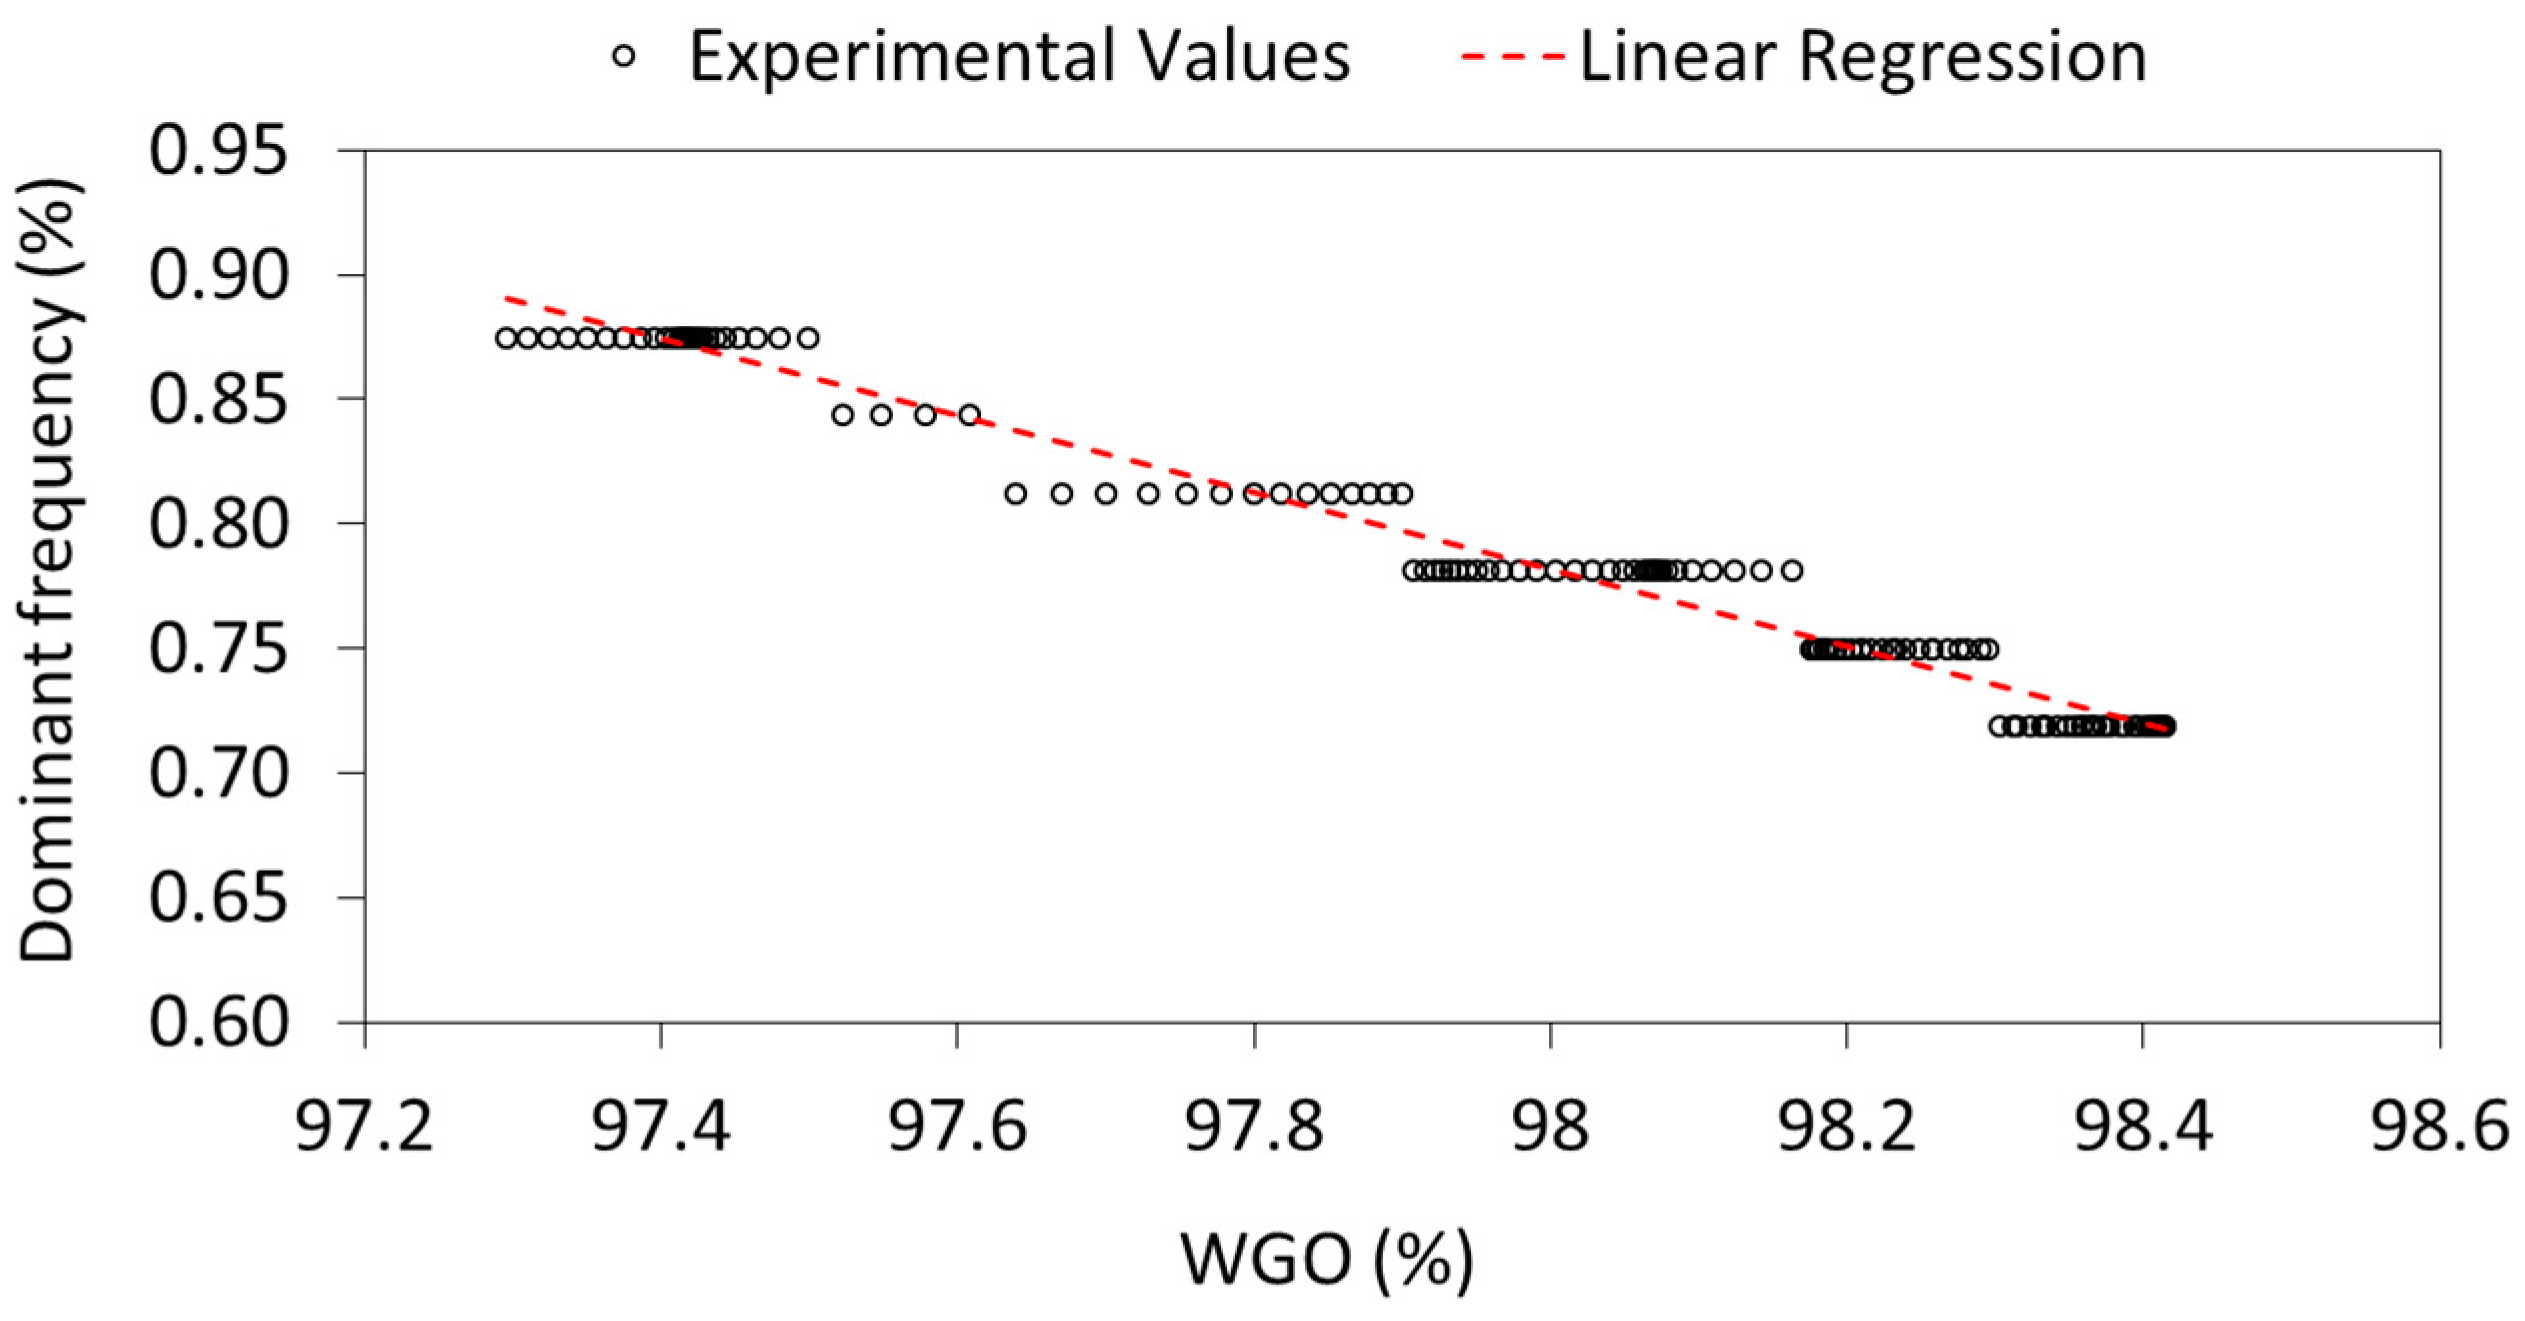
The overload instability was reached for P/Prated = 1.07 for the conditions of the experimental tests (reservoir levels and net head). Figure 14 shows the time-frequency plots of the different pressure sensors before, during, and after the overload instability. It is seen that this instability started for a certain flow rate or wicket gate opening corresponding to 97.2%. The machine was completely unstable at the moment of the overload instability, so it was not possible to remain constant the wicket gate opening, and, as seen in Figure 14, it was slightly changing along the time. The frequency of the phenomenon is also slightly changing at the same time than the wicket gate opening (see Figure 14), fact that demonstrates the direct relationship between the overload vortex rope frequency and the flow rate or the wicket gate opening. To better see this relationship, the vortex rope frequency has been plotted against the wicket gate opening in Figure 15. The frequency resolution of the time-frequency analysis was 0.032 Hz, so the vortex rope could only be detected with this resolution. It seems that the overload vortex rope frequency is inversely proportional to the wicket gate opening: the higher is the wicket gate opening, the smaller is the vortex rope frequency. The overload vortex rope frequency ranges from 0.70 to 0.90 Hz and its second harmonic (2 times this frequency) is also rather important in terms of pressure (see Figure 13).
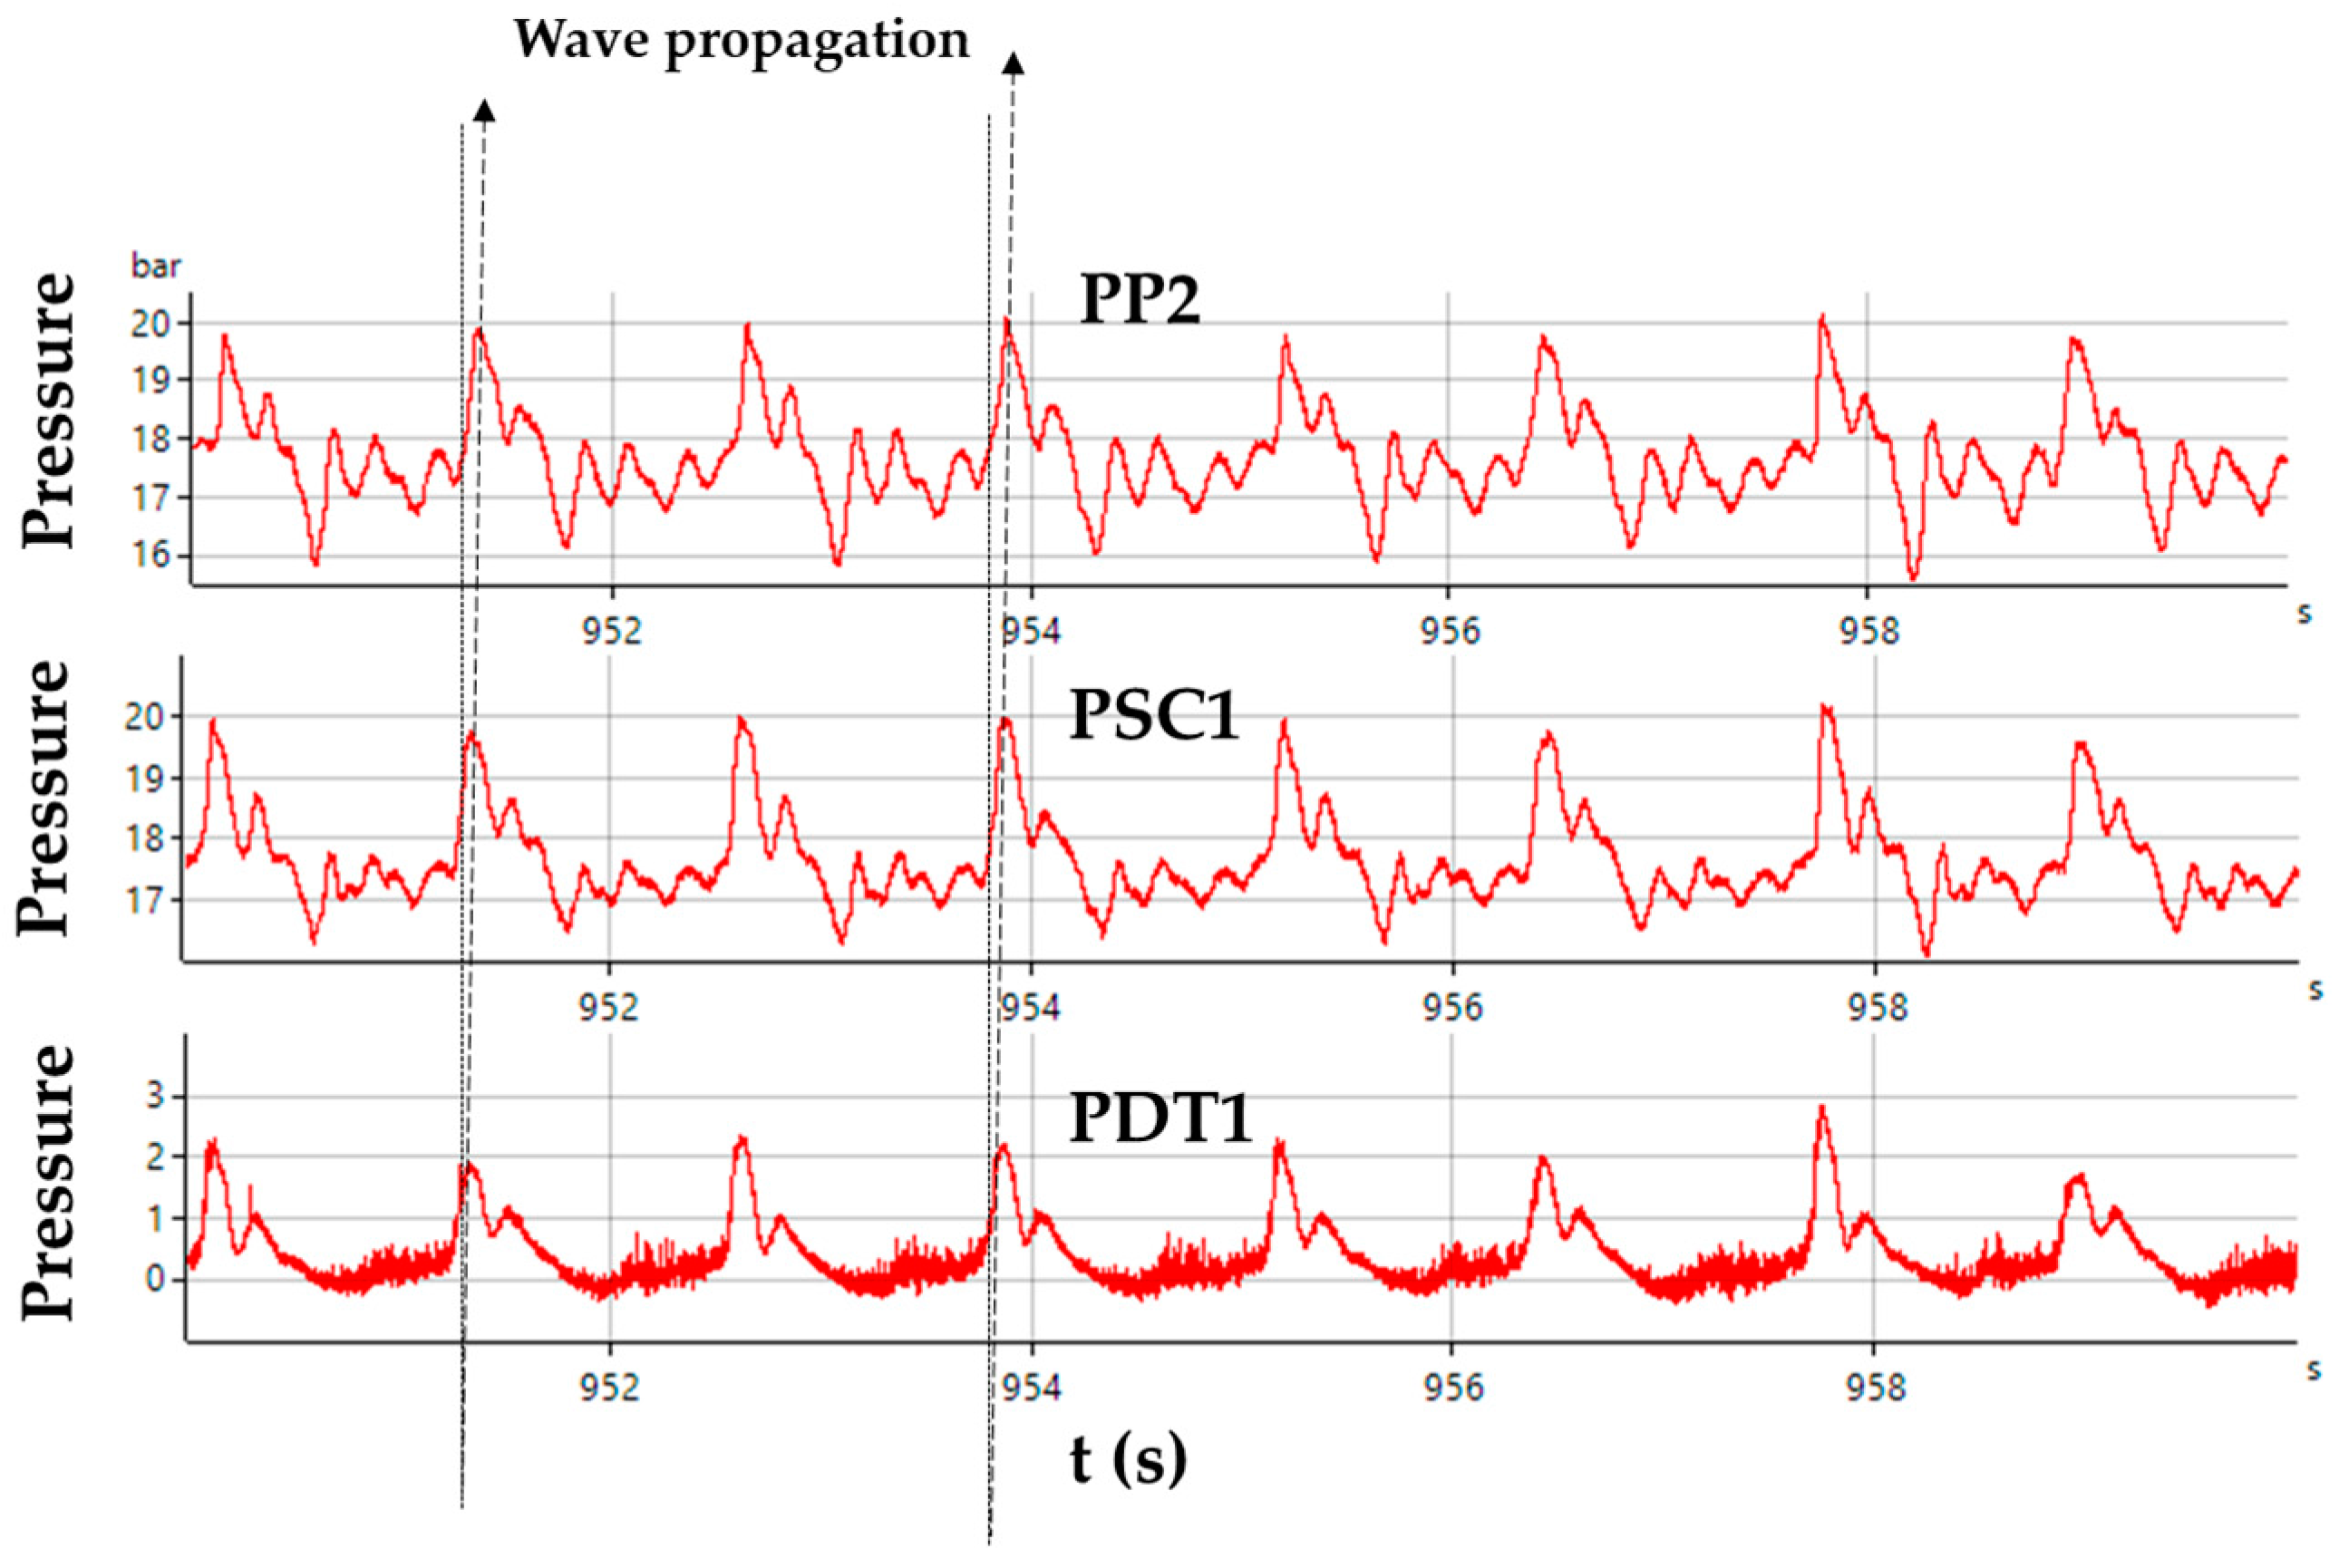
Figure 16 shows that the pressure amplitude is almost the same for the pressure sensors in the draft tube, spiral casing, and penstock. Moreover, the wave propagation from the draft tube to the spiral casing and penstock can also be observed in this figure. An arrow has been plotted in the figure showing the propagation wave. It can be appreciated that peaks of different pressure sensors do not appear simultaneously, but they have a small delay that is related to the propagation speed. So again, as in the case of the part load and high load, synchronous pressure propagation from the draft tube to the penstock is producing a torque and power fluctuation (see Figure 6), which in this case is of a very important magnitude. Similar behavior was also reported in laboratory test models by Müller et al. [5] in previous studies. This phenomenon is better explained with the help of the numerical simulations presented in the following section.
4.2. Simulation Results
A planar wave has been applied in the numerical model at the draft tube in order to simulate the pressure propagation in resonance or instability conditions. The value of the pressure imposed in the draft tube, as well as the frequency of the phenomenon has been taken from the experimental results (the ones shown in Figure 6). In that way, the forced response of the whole structure due to this kind of excitation can be analyzed in detail.
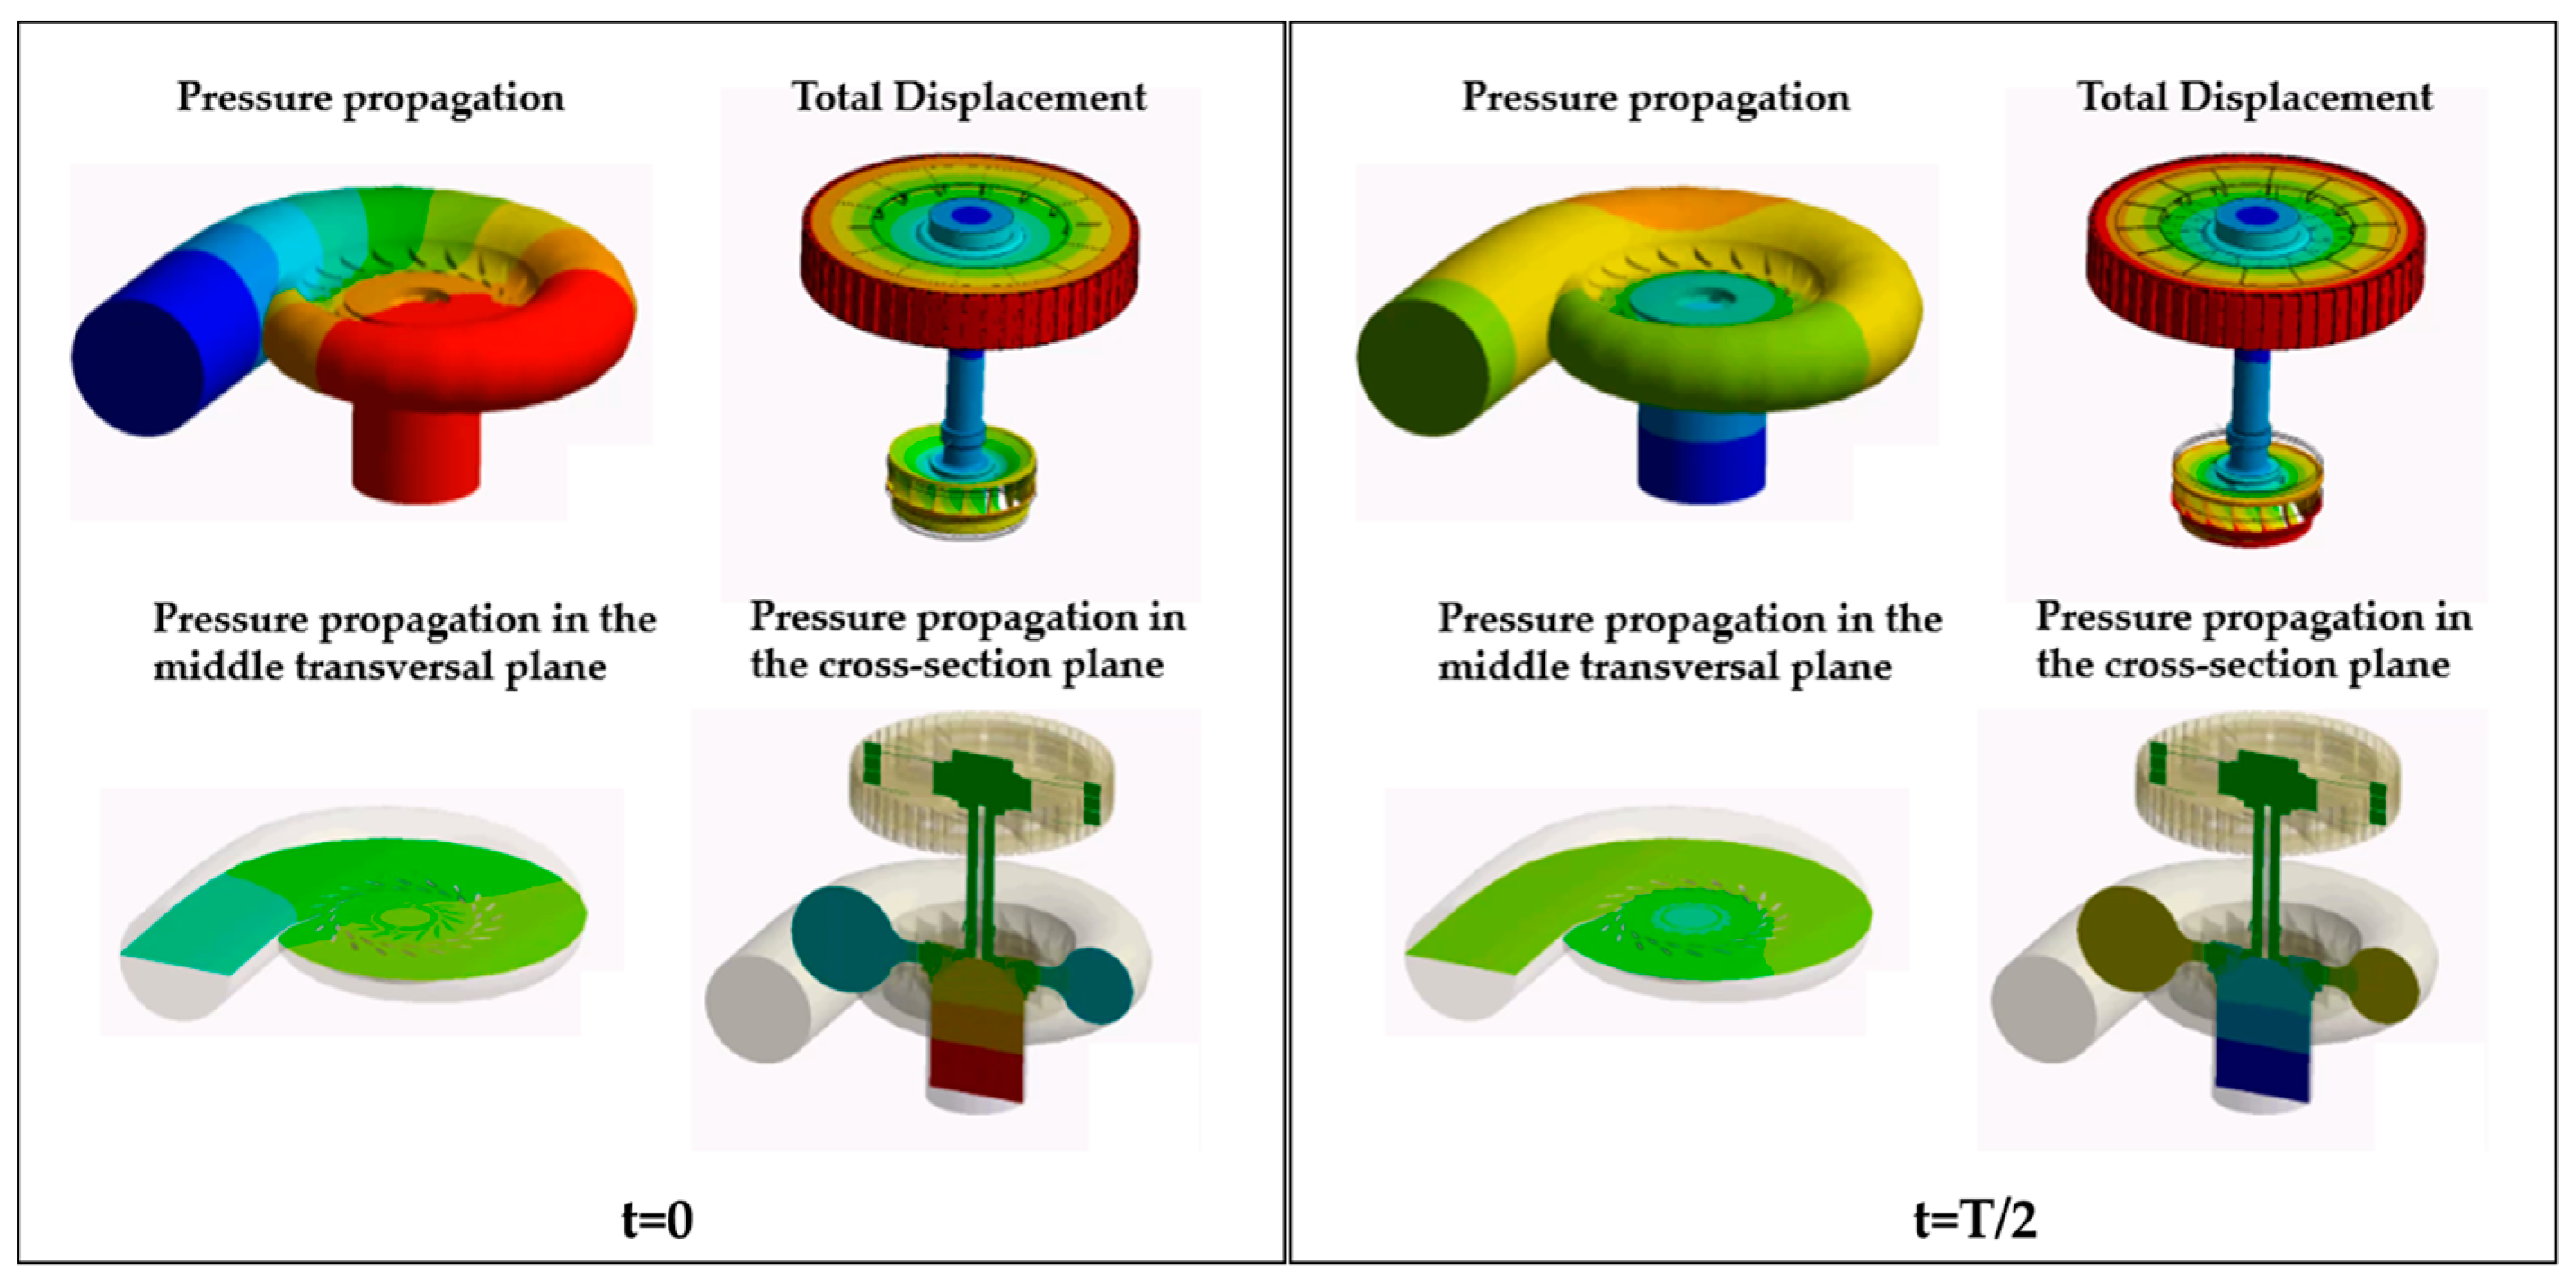
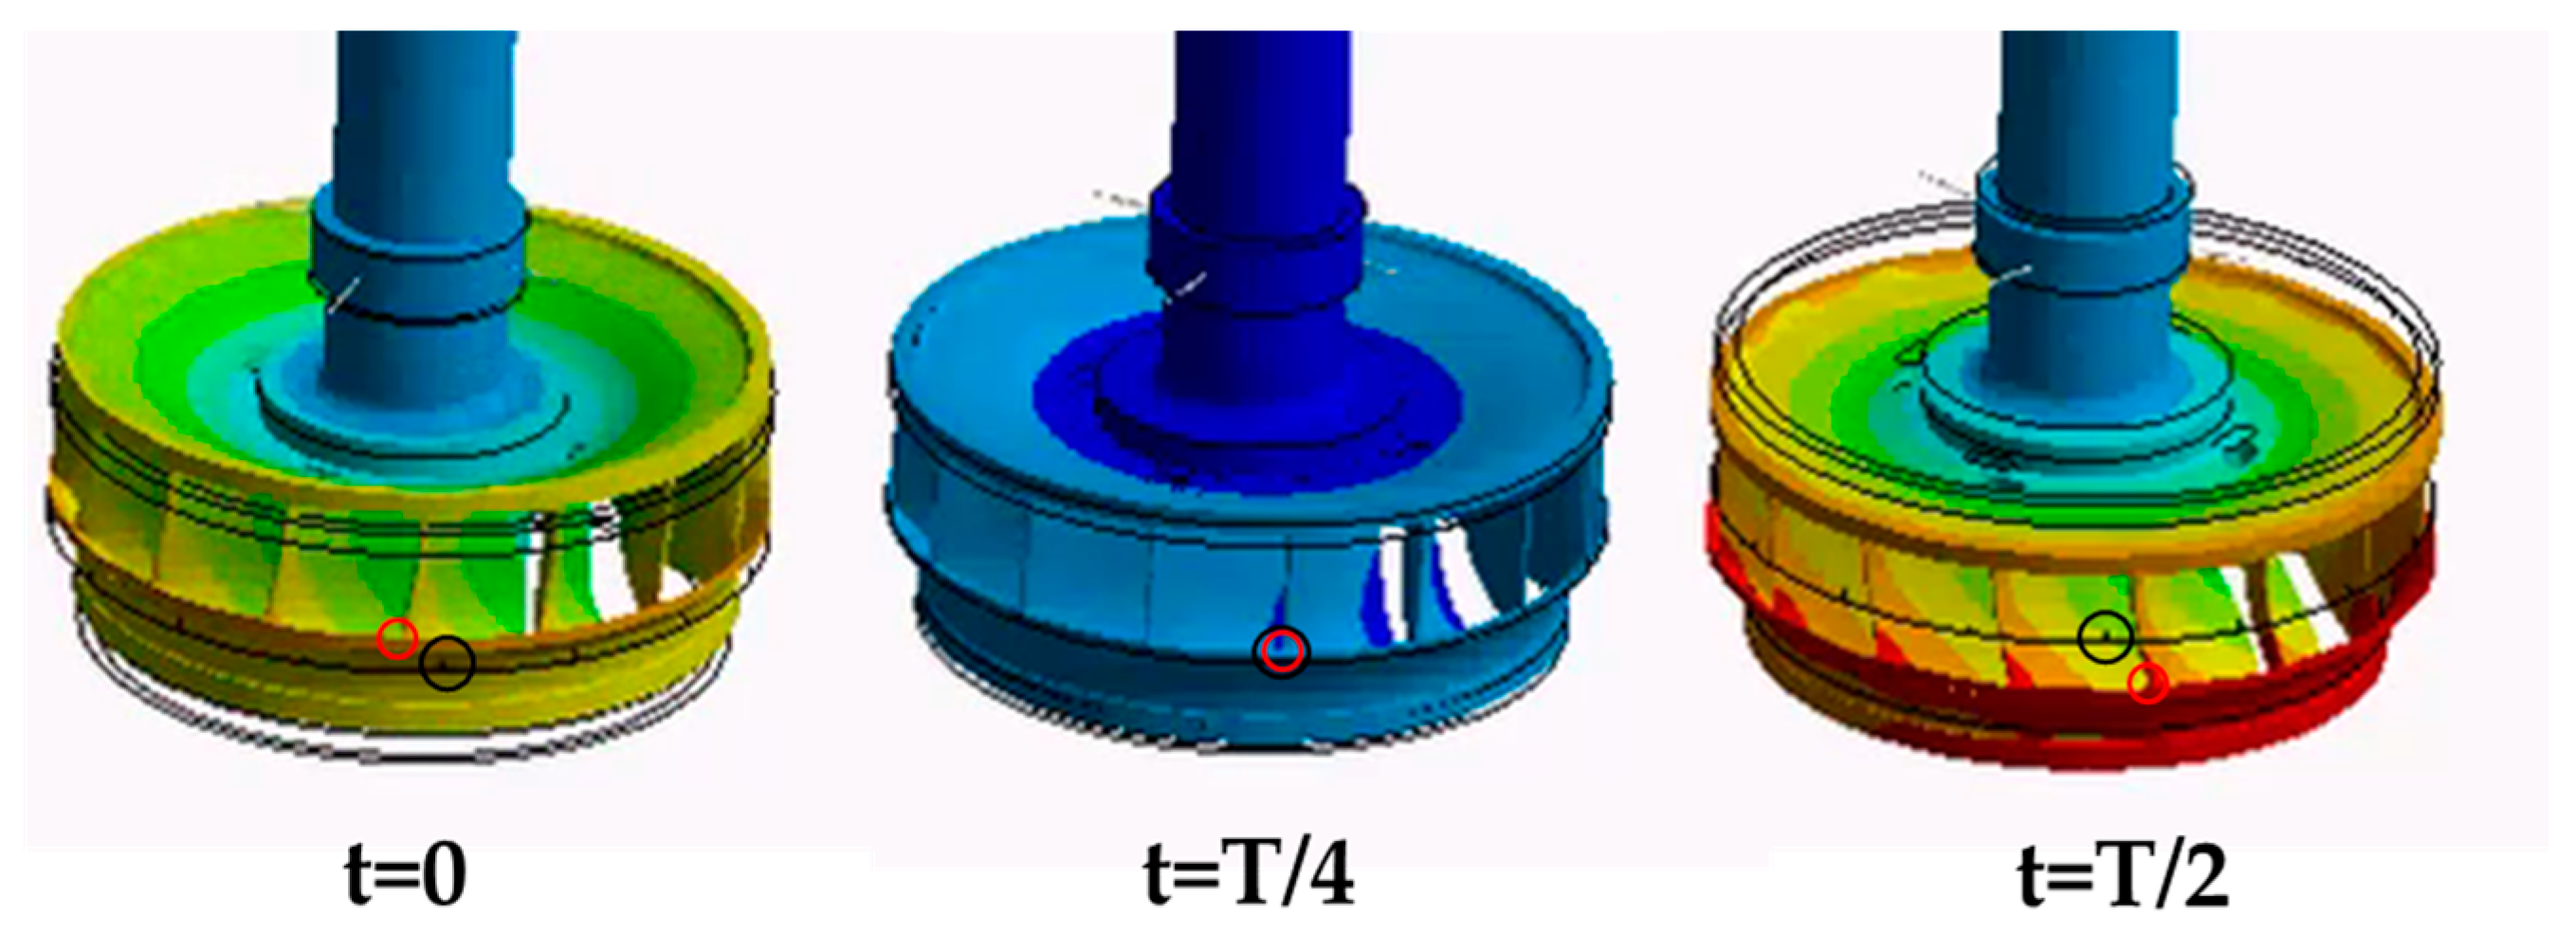
Figure 17 shows the results obtained for one of the simulations performed. It is seen how a planar wave is propagated through the entire hydraulic domain from the beginning of the cycle (t = 0) to the half of it (t = T/2). The displacement of the runner due to this wave propagation is also seen in that figure and more in detail in Figure 18. It can be observed than the runner has an axial motion as well as a torsional displacement caused by the pressure wave passing through it. This is a very interesting conclusion because it is the same that is detected in the experimental tests when the machine was under resonance conditions or overload instability.
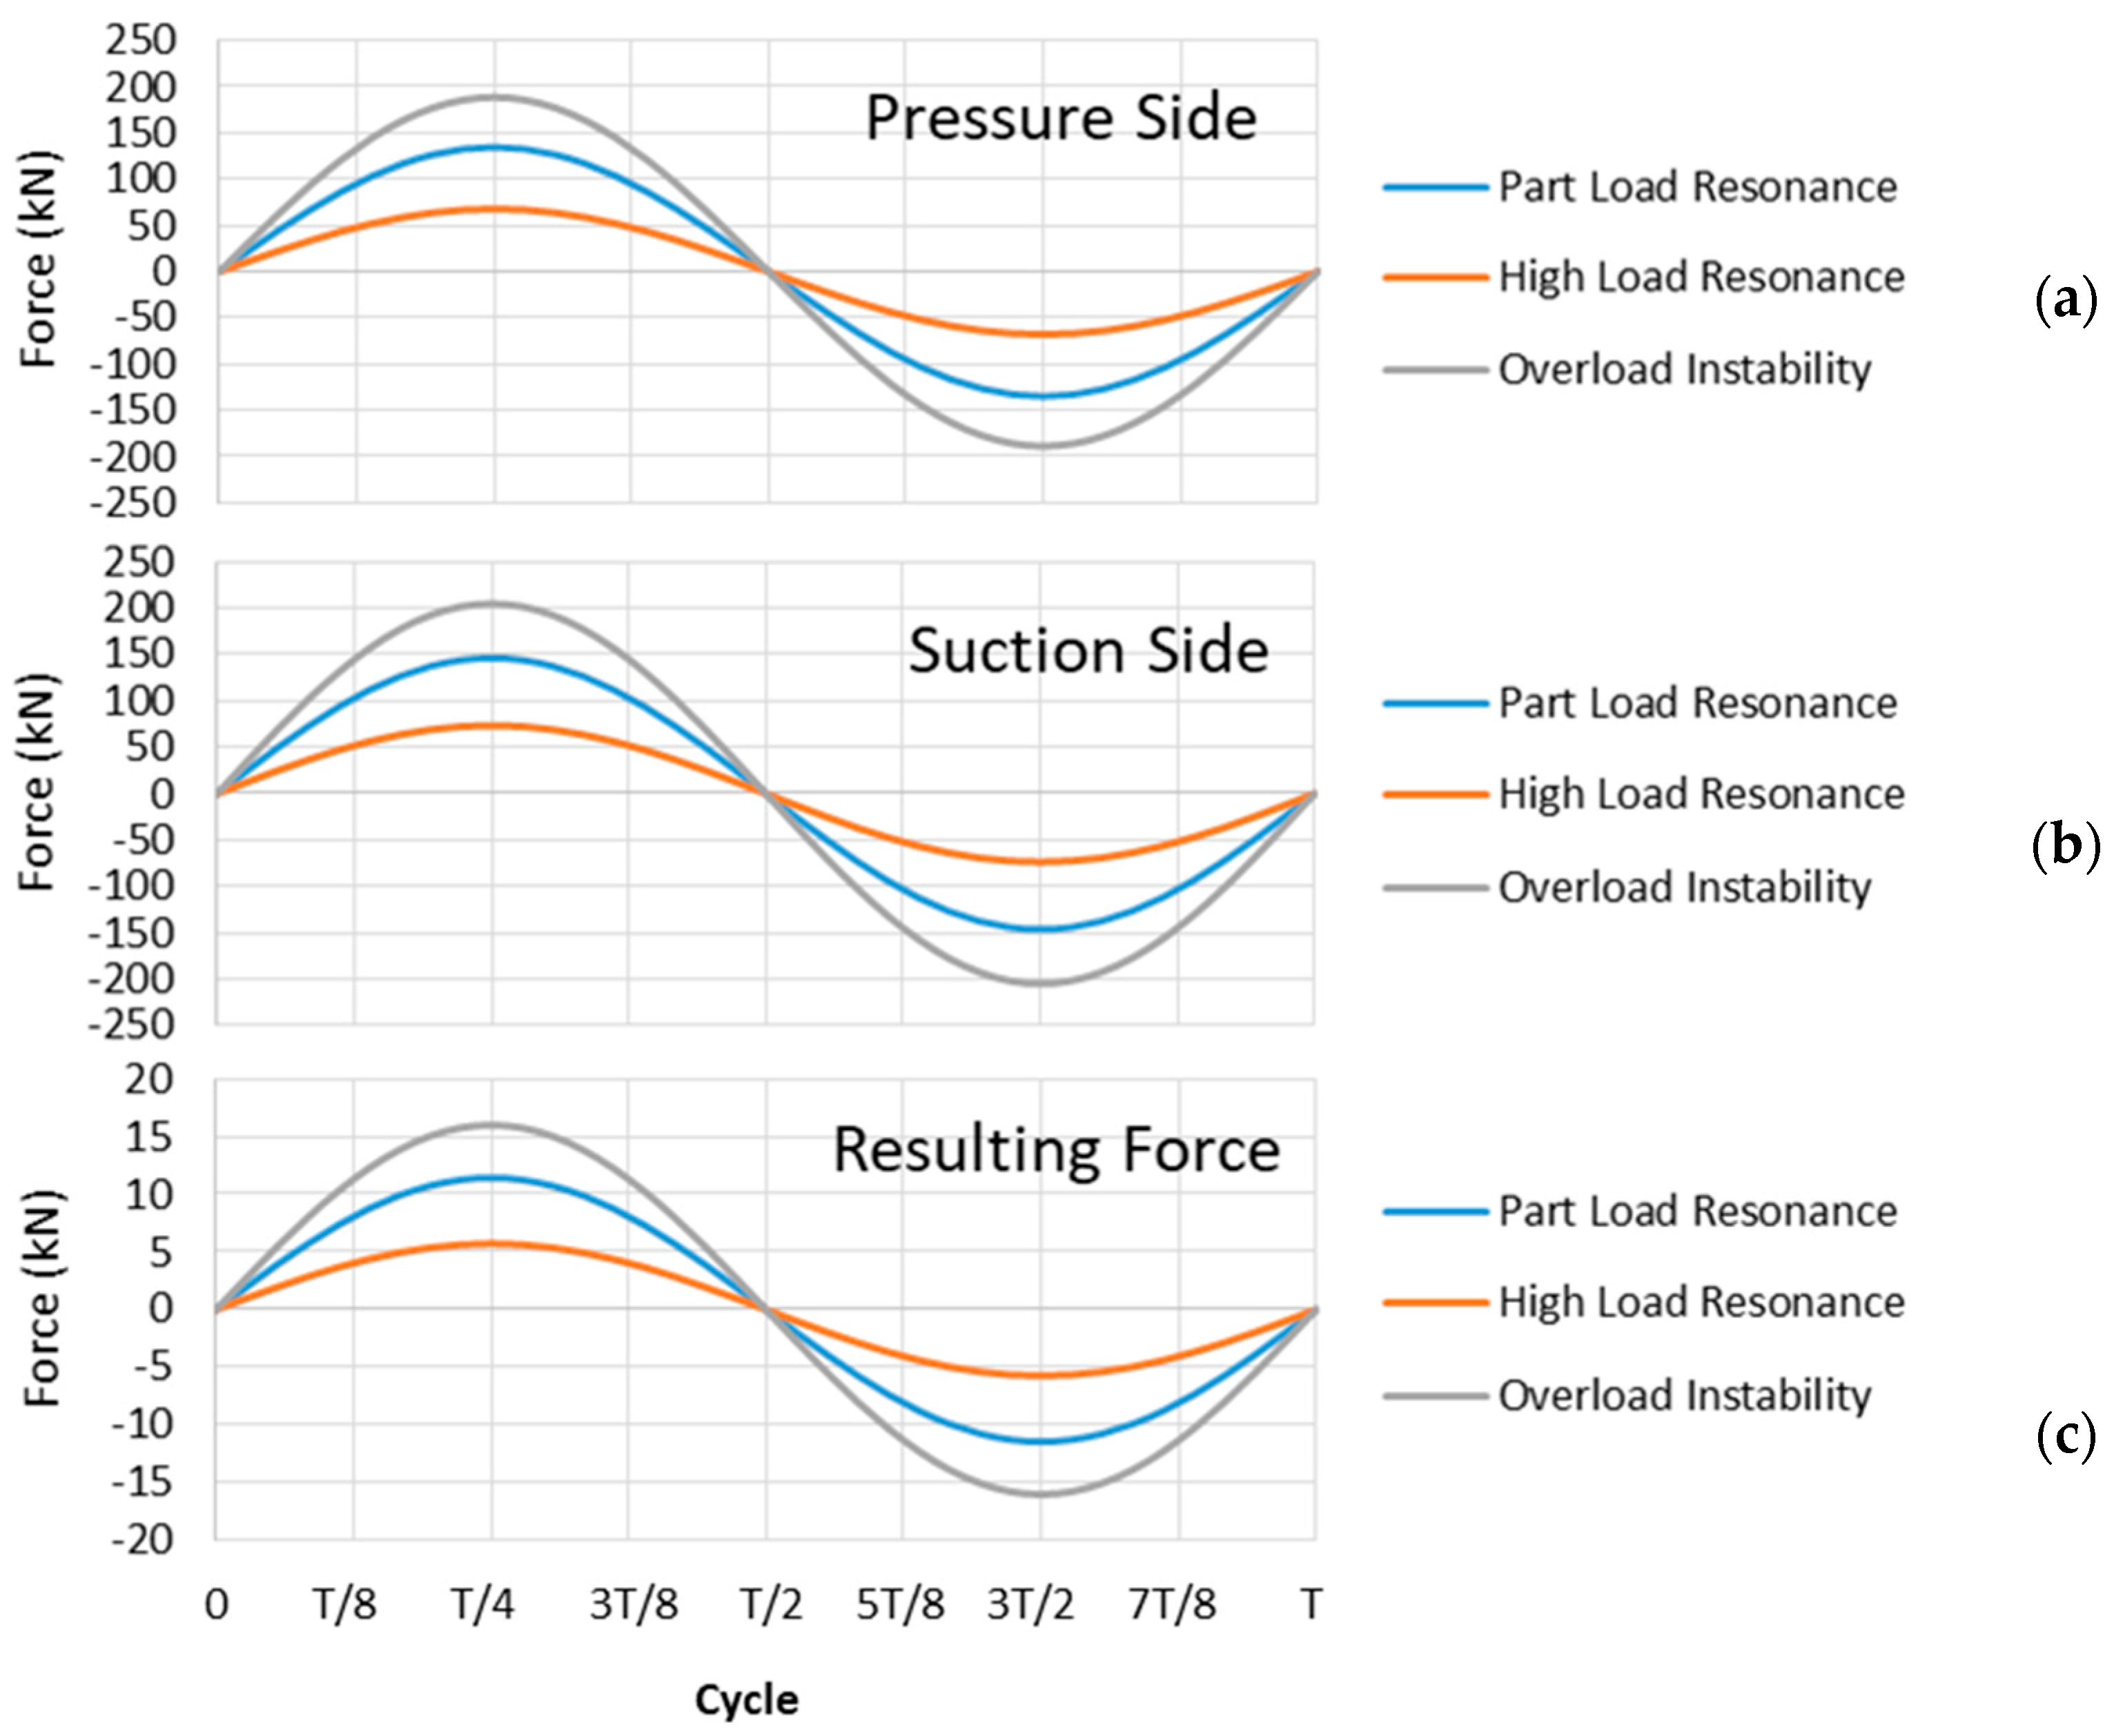
When the planar wave passes inside the runner channels, it causes an axial force in it, which displaces the runner and the whole machine in that direction. However, the explanation of why the runner is torsionally deformed due to a planar wave is not that obvious. To explain so, the pressure in the pressure and in the suction side of one blade has been integrated around the blade area. Results for this integral over one cycle are found in Figure 19. It is seen that the resulting force over the suction side of the blade is higher than in the pressure side, fact that creates a tangential resulting force in every blade. This resulting force (shown in Figure 19 (down)) creates a momentum that applies torsion to the runner, as seen in Figure 18. With this simulation, it is demonstrated that a planar wave going from the draft tube to the penstock or vice versa is able to deform the runner axially and torsionally, making fluctuate the mechanical torque of the runner itself, and hence the torque in the shaft and generator, producing important power swings.
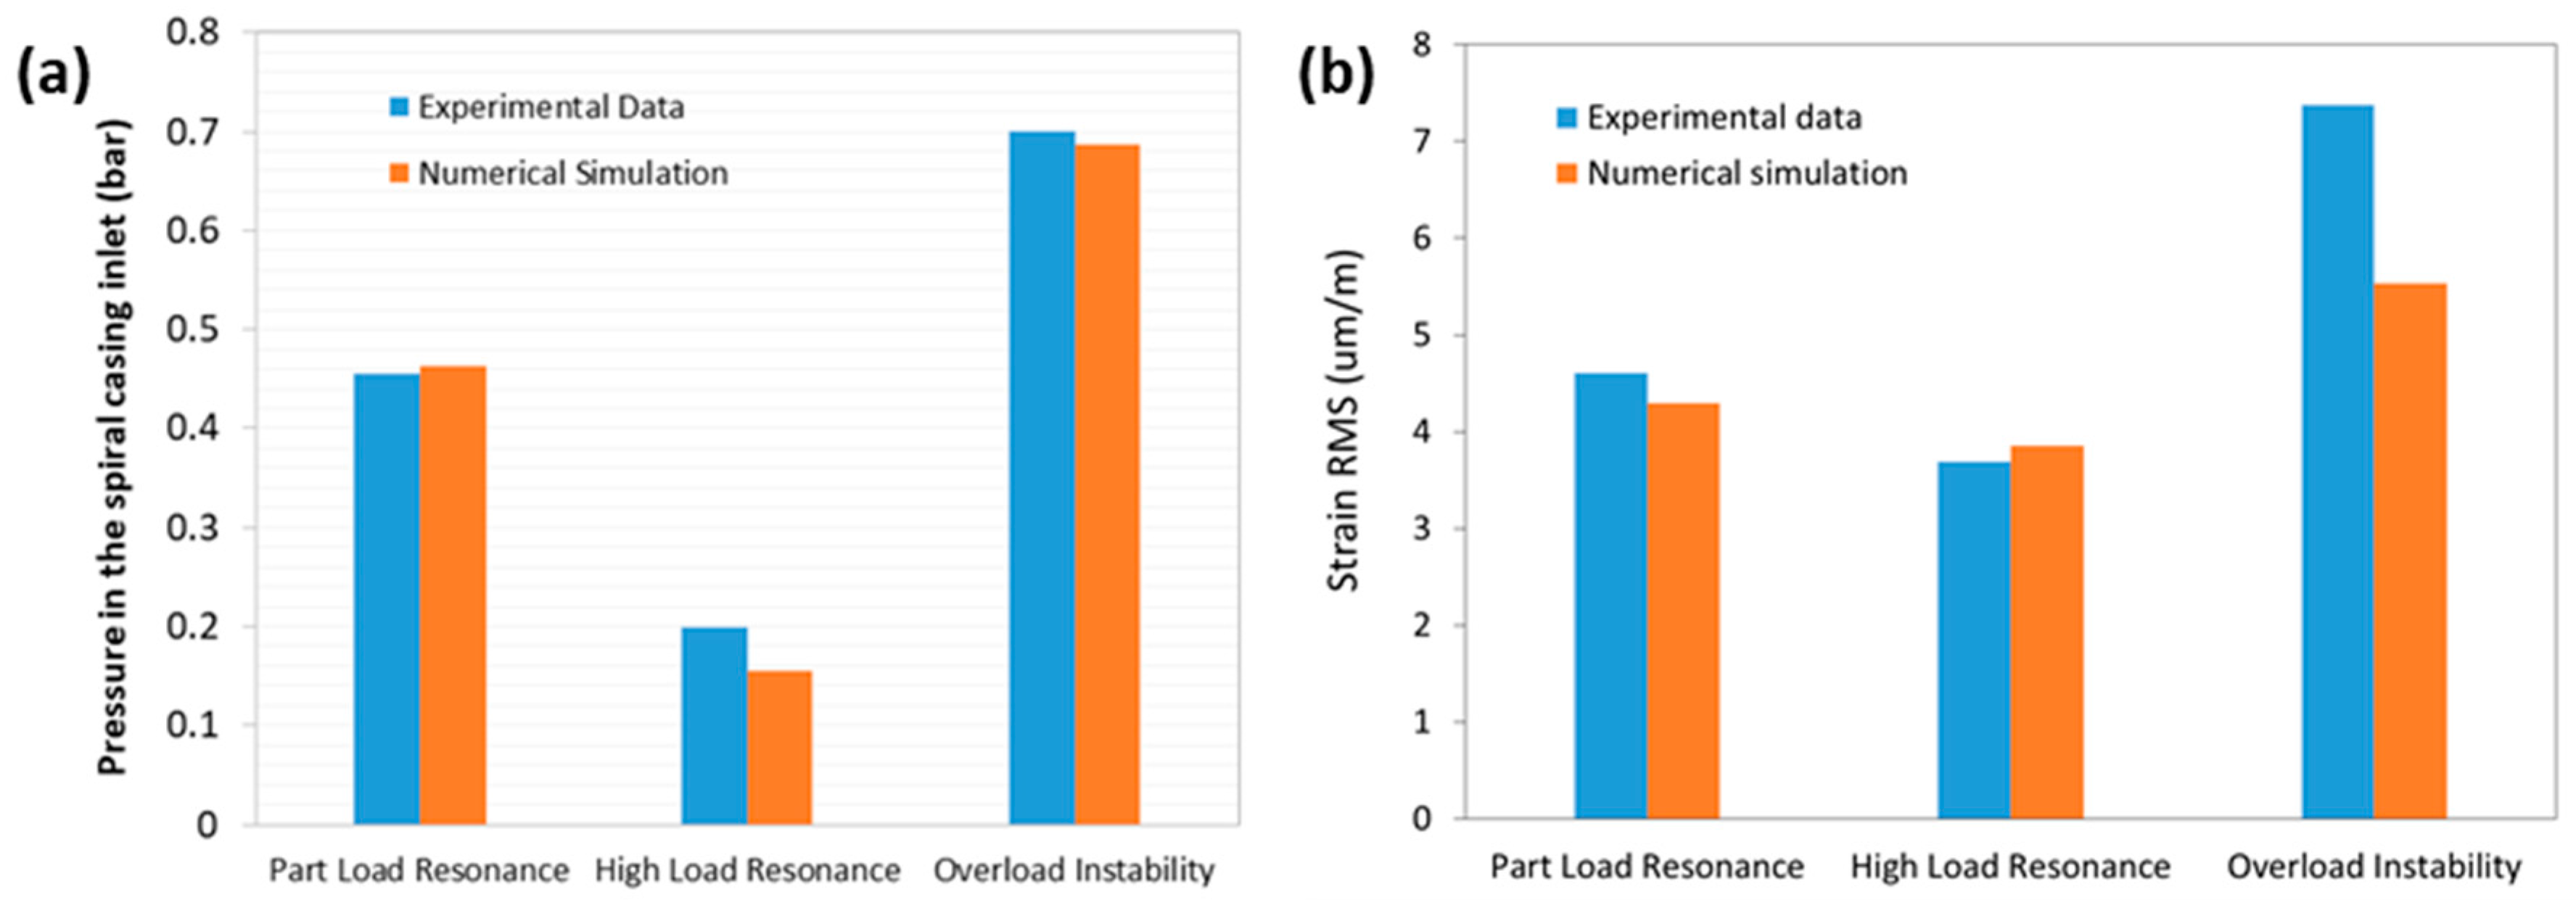
To check the accuracy of the simulation, the pressure in the spiral casing that was obtained by simulation has been compared with the one obtained experimentally for the different operating points (see Figure 20a). Results show that the pressure in the spiral casing was well predicted in the numerical model.
The strain values representing the torque fluctuation in the shaft obtained by means of numerical simulations are similar to those that are obtained in the experimental tests. Figure 20b shows these values for the three operating conditions that were tested. In this figure, only the maximum amplitude of the dominant frequencies for every operating condition is plotted, since the simulation is only performed at those frequencies. The torque at part load and high load resonance conditions is very well reproduced by the simulations, whereas the overload instability present lower torque fluctuation in the simulation than in the experimental case. Muller et al. [5] observed in their experimental tests in laboratory that there was a random amount of cavitation in every blade of the runner once the overload vortex rope collapsed in the runner cone. They concluded that due to this fact, the torque of the runner fluctuated since the resulting force of the pressure in every runner channel was different due to this cavitation phenomenon. In the simulations that are presented in this paper, this phenomenon is not taken into account, so this could be the reason of the difference between simulation and experimental data for the overload instability condition.
5. Conclusions
The whole range of operation of a large prototype Francis turbine has been analyzed experimentally in this paper focusing on the power swing due to hydraulic resonances or instabilities. Several sensors were installed in the prototype in order to measure the main parameters of the hydraulic, mechanic, and electrical parts of the machine. A total of 63 signals were acquired simultaneously during the tests, including pressure sensors, vibration sensors, displacement sensors, strain gauges and the output power, voltage, and intensity. Moreover, a numerical model of the machine has been built up to correlate the hydraulic phenomena with the power swing.
Three different zones where the shaft torque and output power fluctuate have been identified. The first zone corresponds to the part load operation. In this zone, a vortex rope in the draft tube is present. For low powers or flow rates, this vortex rope has mainly a radial or asynchronous component, and it is not affecting so much the power output. However, there is a point called Part Load Resonance, where the frequency of this vortex rope coincides with a natural frequency of the hydraulic system, probably of the draft tube, provoking large pressure fluctuations that travel from the draft tube to the penstock as a planar wave. At this moment, the shaft torque and the output power fluctuate considerably at the same frequency than the hydraulic phenomena. This is an unstable point, which has to be avoided.
The second zone corresponds to an operation over the BEP. A hydraulic resonance over the rotating frequency is detected. At this point, called High Load Resonance, the shaft torque and the power output also fluctuate considerably. It is demonstrated that, at this condition, there is also a planar wave propagated from the draft tube to the penstock and vice versa as it was the case of the Part Load Resonance. This point has to be also avoided to ensure the stability of the machine and the electrical grid.
The last zone identified where the power fluctuate was at the maximum generating power at the moment of the tests. This point has been called Overload Instability. In this case, also a vortex rope in the draft tube is present, but, unlike the part load vortex rope, it has mainly an axial or synchronous component. This hydraulic phenomenon becomes unstable for certain conditions, causing large pressure bursts propagating to the entire hydraulic system. At this moment, the shaft torque and the output power fluctuate so much and the machine becomes completely unstable. Again, this point has to be avoided.
The numerical simulation presented in this paper demonstrates that the shaft torque and the output power fluctuate due to the propagation of planar pressure waves from the draft tube to the penstock and vice versa. These planar pressure waves are able to displace the runner axially, but also torsionally. The torsion in the runner is happening because the force that is produced by the planar wave over the pressure and suction side of every blade are different, and therefore a tangential resulting force appear over every blade. The pressure in the draft tube obtained for the three zones analyzed experimentally in this paper was introduced in the simulation, obtaining pressure fluctuations at the spiral casing and torque fluctuations that are very similar to those obtained on-site in the prototype.
Therefore, in this paper, the explanation of why hydraulic resonances or planar pressure wave propagations can produce power swings is given comparing numerical and experimental results. The results obtained in this study permit to optimize the operation of the machine in order to avoid these situations. Using the results that are obtained for the different sensors, an active control system in real-time could be implemented in the hydraulic power plant control system in order improve the operation of the turbine.
Acknowledgments
The authors would like to acknowledge HYPERBOLE (HYdropower plants PERformance and flexiBle Operation towards Lean integration of new renewable Energies) research project, granted by the European Commission (ERC/FP7- ENERGY-2013-1-Grant 608532). The authors would like to thank BC Hydro® for making possible the experimental tests in the prototype and all the partners involved in the experimental tests: Special mention for Voith® Hydro Team (Johannes Loefflad, Efstathios Sidiropoulos and Philipp Conrad), GE® Renewable Energy Team (Florian Duparchy and Bruno Guilhot) and EPFL Team (Arthur Favrel, Loïc Andolfatto, Joao Gomes and Professor François Avellan).
Author Contributions
David Valentín, Alex Presas, and Eduard Egusquiza performed the experiments. Matias Bossio and Mònica Egusquiza performed the signal analysis and Eduard Egusquiza and Carme Valero designed the experiments and reviewed the manuscript. The paper was written by David Valentín.
Conflicts of Interest
The authors declare no conflict of interest.
Nomenclature
| BEP | Best Efficiency Point |
| CFD | Computational Fluid Dynamics |
| FEM | Finite Element Method |
| RMS | Root Mean Square |
References
- Bélanger, C.; Gagnon, L. Adding wind energy to hydropower. Energy Policy 2002, 30, 1279–1284. [Google Scholar] [CrossRef]
- Gaudard, L.; Romerio, F. The future of hydropower in Europe: Interconnecting climate, markets and policies. Environ. Sci. Policy 2014, 37, 172–181. [Google Scholar] [CrossRef]
- Escaler, X.; Egusquiza, E.; Farhat, M.; Avellan, F.; Coussirat, M. Detection of cavitation in hydraulic turbines. Mech. Syst. Signal Process. 2006, 20, 983–1007. [Google Scholar] [CrossRef]
- Kumar, P.; Saini, R.P. Study of cavitation in hydro turbines—A review. Renew. Sustain. Energy Rev. 2010, 14, 374–383. [Google Scholar] [CrossRef]
- Müller, A.; Favrel, A.; Landry, C.; Avellan, F. Fluid-structure interaction mechanisms leading to dangerous power swings in Francis turbines at full load. J. Fluids Struct. 2017, 69, 56–71. [Google Scholar] [CrossRef]
- Favrel, A.; Müller, A.; Landry, C.; Yamamoto, K.; Avellan, F. Study of the vortex-induced pressure excitation source in a Francis turbine draft tube by particle image velocimetry. Exp. Fluids 2015, 56, 215. [Google Scholar] [CrossRef]
- Duparchy, F.; Favrel, A.; Lowys, P.; Landry, C.; Müller, A.; Yamamoto, K.; Avellan, F. Analysis of the part load helical vortex rope of a Francis turbine using on-board sensors. J. Phys. Conf. Ser. 2015. [Google Scholar] [CrossRef]
- Favrel, A.; Müller, A.; Landry, C.; Gomes, J.; Yamamoto, K.; Avellan, F. Dynamics of the precessing vortex rope and its interaction with the system at Francis turbines part load operating conditions. J. Phys. Conf. Ser. 2017. [Google Scholar] [CrossRef]
- Presas, A.; Valentin, D.; Egusquiza, E.; Valero, C. Detection and analysis of part load and full load instabilities in a real Francis turbine prototype. J. Phys. Conf. Ser. 2017. [Google Scholar] [CrossRef]
- Rheingans, W. Power swings in hydroelectric power plants. Trans. ASME 1940, 62, 171–184. [Google Scholar]
- Dörfler, P. System Oscillations Excited by the Francis Turbine’s Part Load Vortex Core: Mathematical Modeling and Experimental Verification. Ph.D. Thesis, University of Vienna, Vienna, Austria, 1982. [Google Scholar]
- Trivedi, C.; Cervantes, M.J. Fluid-structure interactions in Francis turbines: A perspective review. Renew. Sustain. Energy Rev. 2017, 68, 87–101. [Google Scholar] [CrossRef]
- HYdropower Plants PERformance and Flexible Operation towards Lean Integration of New Renewable Energies. Available online: https://hyperbole.epfl.ch (accessed on 15 September 2017).
- ANSYS, Inc. Ansys User's Manual 13.0; ANSYS(R): Canonsburg, PA, USA, 2010. [Google Scholar]
- Hübner, B.; Seidel, U.; Roth, S. Application of fluid-structure coupling to predict the dynamic behavior of turbine components. In IOP Conference Series: Earth and Environmental Science; IOP Publishing: Bristol, UK, 2010; Volume 12. [Google Scholar]
- Valentín, D.; Presas, A.; Egusquiza, E.; Valero, C. On the Capability of Structural-Acoustical Fluid-Structure Interaction Simulations to Predict Natural Frequencies of Rotating Disklike Structures Submerged in a Heavy Fluid. J. Vib. Acoust. 2016, 138, 034502. [Google Scholar] [CrossRef]
- Bossio, M.; Valentín, D.; Presas, A.; Martin, D.R.; Egusquiza, E.; Valero, C.; Egusquiza, M. Numerical study on the influence of acoustic natural frequencies on the dynamic behaviour of submerged and confined disk-like structures. J. Fluids Struct. 2017, 73, 53–69. [Google Scholar] [CrossRef]
- Manderla, M.; Weber, W.; Koutnik, J. Model measurement based identification of Francis turbine vortex rope parameters for prototype part load pressure and power pulsation prediction. In IOP Conference Series: Earth and Environmental Science; IOP Publishing: Bristol, UK, 2016; Volume 49. [Google Scholar]
- Bouloc, F.; Guillozet, J.; Duparchy, F.; Lowys, P.; Duparchy, A. Mechanical risks prediction on Francis runner by Spatial Harmonic Decomposition. In IOP Conference Series: Earth and Environmental Science; IOP Publishing: Bristol, UK, 2016. [Google Scholar]
Figure 1.
Sketch and pictures of the pressure sensors installed in the prototype.

Figure 2.
Sketch of the sensors installed in the mechanical system.

Figure 3.
Testing procedure. Power of the machine (blue line) and Wicket Gate Opening (orange line) during the tests duration.
Figure 3.
Testing procedure. Power of the machine (blue line) and Wicket Gate Opening (orange line) during the tests duration.

Figure 4.
Finite Element Method (FEM) Model. (a) Isometric view; (b) Cross-section detail; (c) Runner mesh detail.
Figure 4.
Finite Element Method (FEM) Model. (a) Isometric view; (b) Cross-section detail; (c) Runner mesh detail.

Figure 5.
Time-signals for different sensors and different operating conditions. Every time division corresponds to 20 s of signal.
Figure 5.
Time-signals for different sensors and different operating conditions. Every time division corresponds to 20 s of signal.

Figure 6.
Root Mean Square (RMS) values of the pressure in the draft tube (PDT1) and spiral casing (PSC1) as well as the mechanical torque and power for the whole operating range of the turbine.
Figure 6.
Root Mean Square (RMS) values of the pressure in the draft tube (PDT1) and spiral casing (PSC1) as well as the mechanical torque and power for the whole operating range of the turbine.

Figure 7.
Time-frequency plot of the pressure at the draft tube (PDT1) and at the spiral casing (PSC1) for the whole range of operation of the machine.
Figure 7.
Time-frequency plot of the pressure at the draft tube (PDT1) and at the spiral casing (PSC1) for the whole range of operation of the machine.

Figure 8.
Dominant frequency for the whole range of operating conditions of the machine.

Figure 9.
Time-frequency of the pressure in the draft tube (PDT1) and the displacement probe in the shaft (DT1) for the part load operation.
Figure 9.
Time-frequency of the pressure in the draft tube (PDT1) and the displacement probe in the shaft (DT1) for the part load operation.

Figure 10.
RMS values (0.4 to 2 Hz) of pressure in the draft tube (PDT1), in the spiral casing (PSC1) and in the penstock (PP2) and displacement of the shaft (DT1) for the part load operation.
Figure 10.
RMS values (0.4 to 2 Hz) of pressure in the draft tube (PDT1), in the spiral casing (PSC1) and in the penstock (PP2) and displacement of the shaft (DT1) for the part load operation.

Figure 11.
Time signal and phase-assigned spectrum of three pressure sensors located in the draft tube (PDT1-2-3) for two different operating points.
Figure 11.
Time signal and phase-assigned spectrum of three pressure sensors located in the draft tube (PDT1-2-3) for two different operating points.

Figure 12.
Time-frequency of the pressure in the draft tube (PDT1) and axial vibration in the thrust bearing (AGA1) for the high load operation.
Figure 12.
Time-frequency of the pressure in the draft tube (PDT1) and axial vibration in the thrust bearing (AGA1) for the high load operation.

Figure 13.
RMS values (2.2 to 4 Hz) of pressure in the draft tube (PDT1), in the spiral casing (PSC1) and in the penstock (PP1 and PP2) and displacement of the shaft (DT1) for the high load operation.
Figure 13.
RMS values (2.2 to 4 Hz) of pressure in the draft tube (PDT1), in the spiral casing (PSC1) and in the penstock (PP1 and PP2) and displacement of the shaft (DT1) for the high load operation.

Figure 14.
Time-frequency of the pressure in the draft tube (PDT1), in the spiral casing (PSC1) and in the penstock (PP2), as well as the time plot of the power and wicket gate opening (WGO) for the overload instability.
Figure 14.
Time-frequency of the pressure in the draft tube (PDT1), in the spiral casing (PSC1) and in the penstock (PP2), as well as the time plot of the power and wicket gate opening (WGO) for the overload instability.

Figure 15.
Overload vortex rope frequency for different openings of the wicket gates.

Figure 16.
Time signal of the pressure in the draft tube (PDT1), in the spiral casing (PSC1) and in the penstock (PP2) during the overload instability.
Figure 16.
Time signal of the pressure in the draft tube (PDT1), in the spiral casing (PSC1) and in the penstock (PP2) during the overload instability.

Figure 17.
Pressure propagation through the entire hydraulic circuit and the forced response of the structure in a cycle. Red color maximum and blue color minimum.
Figure 17.
Pressure propagation through the entire hydraulic circuit and the forced response of the structure in a cycle. Red color maximum and blue color minimum.

Figure 18.
Total displacement of the runner during the cycle. Red color maximum displacement and blue color minimum displacement. The black line represent the non-deformed runner. The black and red circles are used to see the relative displacement of one blade, being the black circle always in the same point and the red circle moving with the blade displacement.

Figure 19.
Force integrated over the pressure side (a) and over the suction side (b) of one blade. Resulting tangential force over one blade (c).
Figure 19.
Force integrated over the pressure side (a) and over the suction side (b) of one blade. Resulting tangential force over one blade (c).

Figure 20.
Comparison between experimental and simulation data for the pressure in the spiral casing inlet (a) and the torque fluctuation (b) for the three operating conditions tested.
Figure 20.
Comparison between experimental and simulation data for the pressure in the spiral casing inlet (a) and the torque fluctuation (b) for the three operating conditions tested.


Table 1.
Mean Value and Peak to Peak (PkPk) values for different sensors and different operating conditions.
Table 1.
Mean Value and Peak to Peak (PkPk) values for different sensors and different operating conditions.
| Sensor | P/Prated = 0.59 | P/Prated = 0.90 | P/Prated = 1.07 | |||
|---|---|---|---|---|---|---|
| Mean Value | PkPk | Mean Value | PkPk | Mean Value | PkPk | |
| Power (MW) | 252 | 20 | 400 | 0.1 | 476 | 35 |
| Voltage (V) | 9261 | 27.03 | 9301 | 2.51 | 9325 | 48 |
| PDT1 (bar) | 0.572 | 1.98 | 0.39 | 0.23 | 0.40 | 2.10 |
| PP2 (bar) | 18.34 | 1.51 | 18.01 | 0.17 | 17.68 | 3.98 |
| DT1 (um) | 1162 | 64.60 | 1162 | 11.57 | 1162 | 91.07 |
| AGA1 (m/s2) | 0 | 1.64 | 0 | 1.38 | 0 | 3.21 |
| SG1 (um/m) | 45.02 | 44.63 | 203.26 | 41.94 | 317.20 | 61.22 |
| Torque (um/m) | 350.65 | 22.14 | 542.12 | 15.24 | 642.45 | 85.16 |
© 2017 by the authors. Licensee MDPI, Basel, Switzerland. This article is an open access article distributed under the terms and conditions of the Creative Commons Attribution (CC BY) license (http://creativecommons.org/licenses/by/4.0/).
Share and Cite
MDPI and ACS Style
Valentín, D.; Presas, A.; Egusquiza, E.; Valero, C.; Egusquiza, M.; Bossio, M. Power Swing Generated in Francis Turbines by Part Load and Overload Instabilities. Energies 2017, 10, 2124. https://doi.org/10.3390/en10122124
AMA Style
Valentín D, Presas A, Egusquiza E, Valero C, Egusquiza M, Bossio M. Power Swing Generated in Francis Turbines by Part Load and Overload Instabilities. Energies. 2017; 10(12):2124. https://doi.org/10.3390/en10122124
Chicago/Turabian StyleValentín, David, Alexandre Presas, Eduard Egusquiza, Carme Valero, Mònica Egusquiza, and Matias Bossio. 2017. "Power Swing Generated in Francis Turbines by Part Load and Overload Instabilities" Energies 10, no. 12: 2124. https://doi.org/10.3390/en10122124
Note that from the first issue of 2016, this journal uses article numbers instead of page numbers. See further details here.