A System Dynamics Analysis of Investment, Technology and Policy that Affect Natural Gas Exploration and Exploitation in China
Abstract
:1. Introduction
- The developing natural gas market has been in the process of transforming, consisting of improving investment efficiency and service quality through privatization. The desirability of expanding natural gas also calls for the strengthening of domestic and international exploration and exploitation. China has implemented various measures to better cope with supply–demand gap and significantly mitigate their effects, which means that the country seeks supplies from all possible sources, not only imports of liquefied natural gas (LNG) and pipeline gas but also from domestic gas production. The national oil companies (NOCs) have also increased their investment in exploration and development of upstream sector in order to meet increasing natural gas demands.
- Gas pricing is to be changed from a “production cost” regime to a “market net return” regime. Since domestic cost-plus regulated pricing for produced gas is low compared to alternative sources, there is less incentive for upstream producers to engage in exploration and production activity. Therefore, a transforming step toward launching a market-driven pricing regime will provide encouragement to upstream companies.
- Previously, the large corporations in the natural gas industry relied on command and control approaches. Since the mid-2000s, the Chinese government has hoped that NOCs will eventually rival the operation of major Western oil companies in the scope of their worldwide activities, which could promote the market evolution, leading to greater investment from private entrants. Thus, NOCs would become more profitable and market-oriented, thereby better able to increase their capital investment efficiency.
- Before 2010, the accounting method mainly applied in NOCs was full cost. In that approach, firms capitalized all operating expenses generated in prospecting for oil and gas reserves as well as in acquiring, exploring and proving oil and gas properties, regardless of the uncertainty and risk. Then, companies switched to the total successful efforts approach, in which only those acquisition, exploration and development costs related to the discovery of commercially viable reserves need to be capitalized. Compared with Western companies, Chinese firms are less familiar with these accounting methods.
2. State of Literature
3. SD Model of Upstream Natural Gas Investment
3.1. Establishment of the System Flow Diagrams
3.2. Decomposition Analysis of SD Model
3.2.1. Investment Subsystem
3.2.2. Exploration Subsystem
- Exploration investment → + Two-dimensional seismic investment and Three-dimensional seismic investment → + Annual incremental proved reserve → + Annual incremental recoverable reserve → − Remaining recoverable reserve → + Annuity volume of production → + Total investment → + Exploration investment
- Exploration investment → + Annuity incremental successful exploration well investment → + Annual incremental proved reserve → + Accumulative workable reserve → + Annuity volume of production → + Total investment → + Exploration investment
3.2.3. Production Subsystem
4. Simulation Results and Analysis
4.1. Model Testing
4.2. Scenario Modeling
4.2.1. Scenarios
4.2.2. Simulation Results
5. Conclusions
Acknowledgments
Author Contributions
Conflicts of Interest
References
- Zhang, Q.; Crooks, R. Toward an Environmentally Sustainable Future: Country Environmental Analysis of the People’s Republic of China; Asian Development Bank: Metro Manila, Philippines, 2012. [Google Scholar]
- Peters, G.P.; Weber, C.L.; Guan, D.; Hubacek, K. China’s growing CO2 emissions a race between increasing consumption and efficiency gains. Environ. Sci. Technol. 2007, 41, 5939–5944. [Google Scholar] [CrossRef] [PubMed]
- Andoura, S.; d’Oultremont, C. Energy Transition by 2050: A Multifaceted Challenge for Europe. Available online: http://www.egmontinstitute.be/wp-content/uploads/2013/10/EPB8-EU-energy-Roadmap.pdf (accessed on 19 December 2016).
- Budzianowski, W.M.; Budzianowska, D.A. Economic analysis of biomethane and bioelectricity generation from biogas using different support schemes and plant configurations. Energy 2015, 88, 658–666. [Google Scholar] [CrossRef]
- Wu, Y.; Chen, K.; Yang, Y.; Feng, T. A system dynamics analysis of technology, cost and policy that affect the market competition of shale gas in China. Renew. Sustain. Energy Rev. 2015, 45, 235–243. [Google Scholar]
- Dai, J.; Wu, W.; Fang, C.; Liu, D. Exploration and development of large gas fields in China since 2000. Nat. Gas Ind. B 2015, 2, 1–8. [Google Scholar] [CrossRef]
- Li, J.; Dong, X.; Shangguan, J.; Hook, M. Forecasting the growth of China’s natural gas consumption. Energy 2011, 36, 1380–1385. [Google Scholar] [CrossRef]
- Lin, B.Q.; Wang, T. Forecasting natural gas supply in China: Production peak and import trends. Energy Policy 2012, 49, 225–233. [Google Scholar] [CrossRef]
- Wang, J.; Feng, L.; Zhao, L. Simon Snowden. China’s natural gas: Resources, production and its impacts. Energy Policy. 2013, 55, 690–698. [Google Scholar] [CrossRef]
- Aslani, A.; Petri, H.; Marja, N. Role of renewable energy policies in energy dependency in Finland: System dynamics approach. Appl. Energy 2014, 113, 758–765. [Google Scholar] [CrossRef]
- Freeman, R.; Yearworth, M.; Cherruault, J.V. Review of Literature on Systems Thinking and System Dynamics for Policy Making; Department for Environment, Food and Rural Affairs: Manchester, UK, 2014.
- Naill, R.F. The Discovery Life Cycle of a Finite Resource: A Case Study of U.S. Natural Gas; Massachusetts Institute of Technology Press: Cambridge, MA, USA, 1972. [Google Scholar]
- Forrester, J.W. Industrial dynamics: A major breakthrough for decision makers. Harv. Bus. Rev. 1958, 36, 37–66. [Google Scholar]
- Naill, R.F. Managing the Energy Transition: A System Dynamics Search for Alternatives to Oil And Gas; Ballinger Publishing Company: Pensacola, FL, USA, 1977. [Google Scholar]
- Naill, R.F. A system dynamics model for national energy policy planning. Syst. Dyn. Rev. 1992, 8, 1–19. [Google Scholar] [CrossRef]
- Sterman, J.D. Economic vulnerability and the energy transition. Energy Syst. Policy 1983, 7, 259–301. [Google Scholar]
- Sterman, J.D.; Richardson, G.P. An experiment to evaluate methods for estimating fossil fuel resources. J. Forecast 1985, 4, 197–226. [Google Scholar] [CrossRef]
- Davidsen, P.I.; Sterman, J.D.; Richardson, G.P. A petroleum life cycle model for the United States with endogenous technology, exploration, recovery, and demand. Syst. Dyn. Rev. 1990, 6, 66–93. [Google Scholar] [CrossRef]
- Rego, J. Schedule Delays and New Financing for the Argentine Electricity Sector Growth; Springer: Berlin, Germany, 1989. [Google Scholar]
- Bodger, P.S.; May, D.G. A system dynamics energy model of New Zealand. Technol. Forecast. Soc. Chang. 1992, 41, 97–106. [Google Scholar] [CrossRef]
- Chia, E.S.; Chee, K.L.; Adam, N.; Nguyen, N.H.L. The System Dynamics of Nuclear Energy in Singapore. Int. J. Green Energy 2015, 12, 73–86. [Google Scholar] [CrossRef]
- Chi, K.C.; Nuttall, W.J.; Reiner, D.M. Dynamics of the UK natural gas industry: System dynamics modelling and long-term energy policy analysis. Technol. Forecast. Soc. Chang. 2009, 76, 339–357. [Google Scholar]
- Chowdhurg, S.; Sahu, K.C. A system dynamics model for Indian oil and gas exploration/exploitation industry. Technol. Forecast. Soc. Chang. 1992, 42, 63–84. [Google Scholar] [CrossRef]
- Kiani, B.; Hosseini, S.H.; Amiri, R.H. Examining the Hubbert peak of Iran’s crude oil: A system dynamics approach. Eur. J. Sci. Res. 2009, 25, 437–447. [Google Scholar]
- Fan, Y.; Yang, R.G.; Wei, Y.M. A system dynamics based model for coal investment. Energy 2007, 32, 898–905. [Google Scholar] [CrossRef]
- Feng, Y.Y.; Chen, S.Q.; Zhang, L.X. System dynamics modeling for urban energy consumption and CO2 emissions: A case study of Beijing, China. Ecol. Model. 2013, 252, 44–52. [Google Scholar] [CrossRef]
- Xu, J.; Dong, R.; Wu, D. On simulation and optimization of one natural gas industry system under the rough environment. Expert Syst. Appl. 2010, 37, 1854–1862. [Google Scholar] [CrossRef]
- Zhang, B.; Wang, Q. Analysis and forecasts of investment scale and structure in upstream sector for oil companies based on system dynamics. Pet. Sci. 2011, 8, 120–126. [Google Scholar] [CrossRef]
- Gas Pricing and Regulation: China’s Challenges and IEA Experience. Available online: http://www.iea.org/publications/freepublications/publication/ChinaGasReport_Final_WEB.pdf (accessed on 15 December 2012).
- Zhang, Q.; Li, Z.; Wanga, G.; Li, H. Study on the impacts of natural gas supply cost on gas flow and infrastructure deployment in China. Appl. Energy 2016, 162, 1385–1398. [Google Scholar] [CrossRef]
- National Development and Reform Commission. The Methods and Parameters of Economic Evaluation on Construction Projects, 3rd ed.Chinese Planning Press: Beijing, China, 2006.

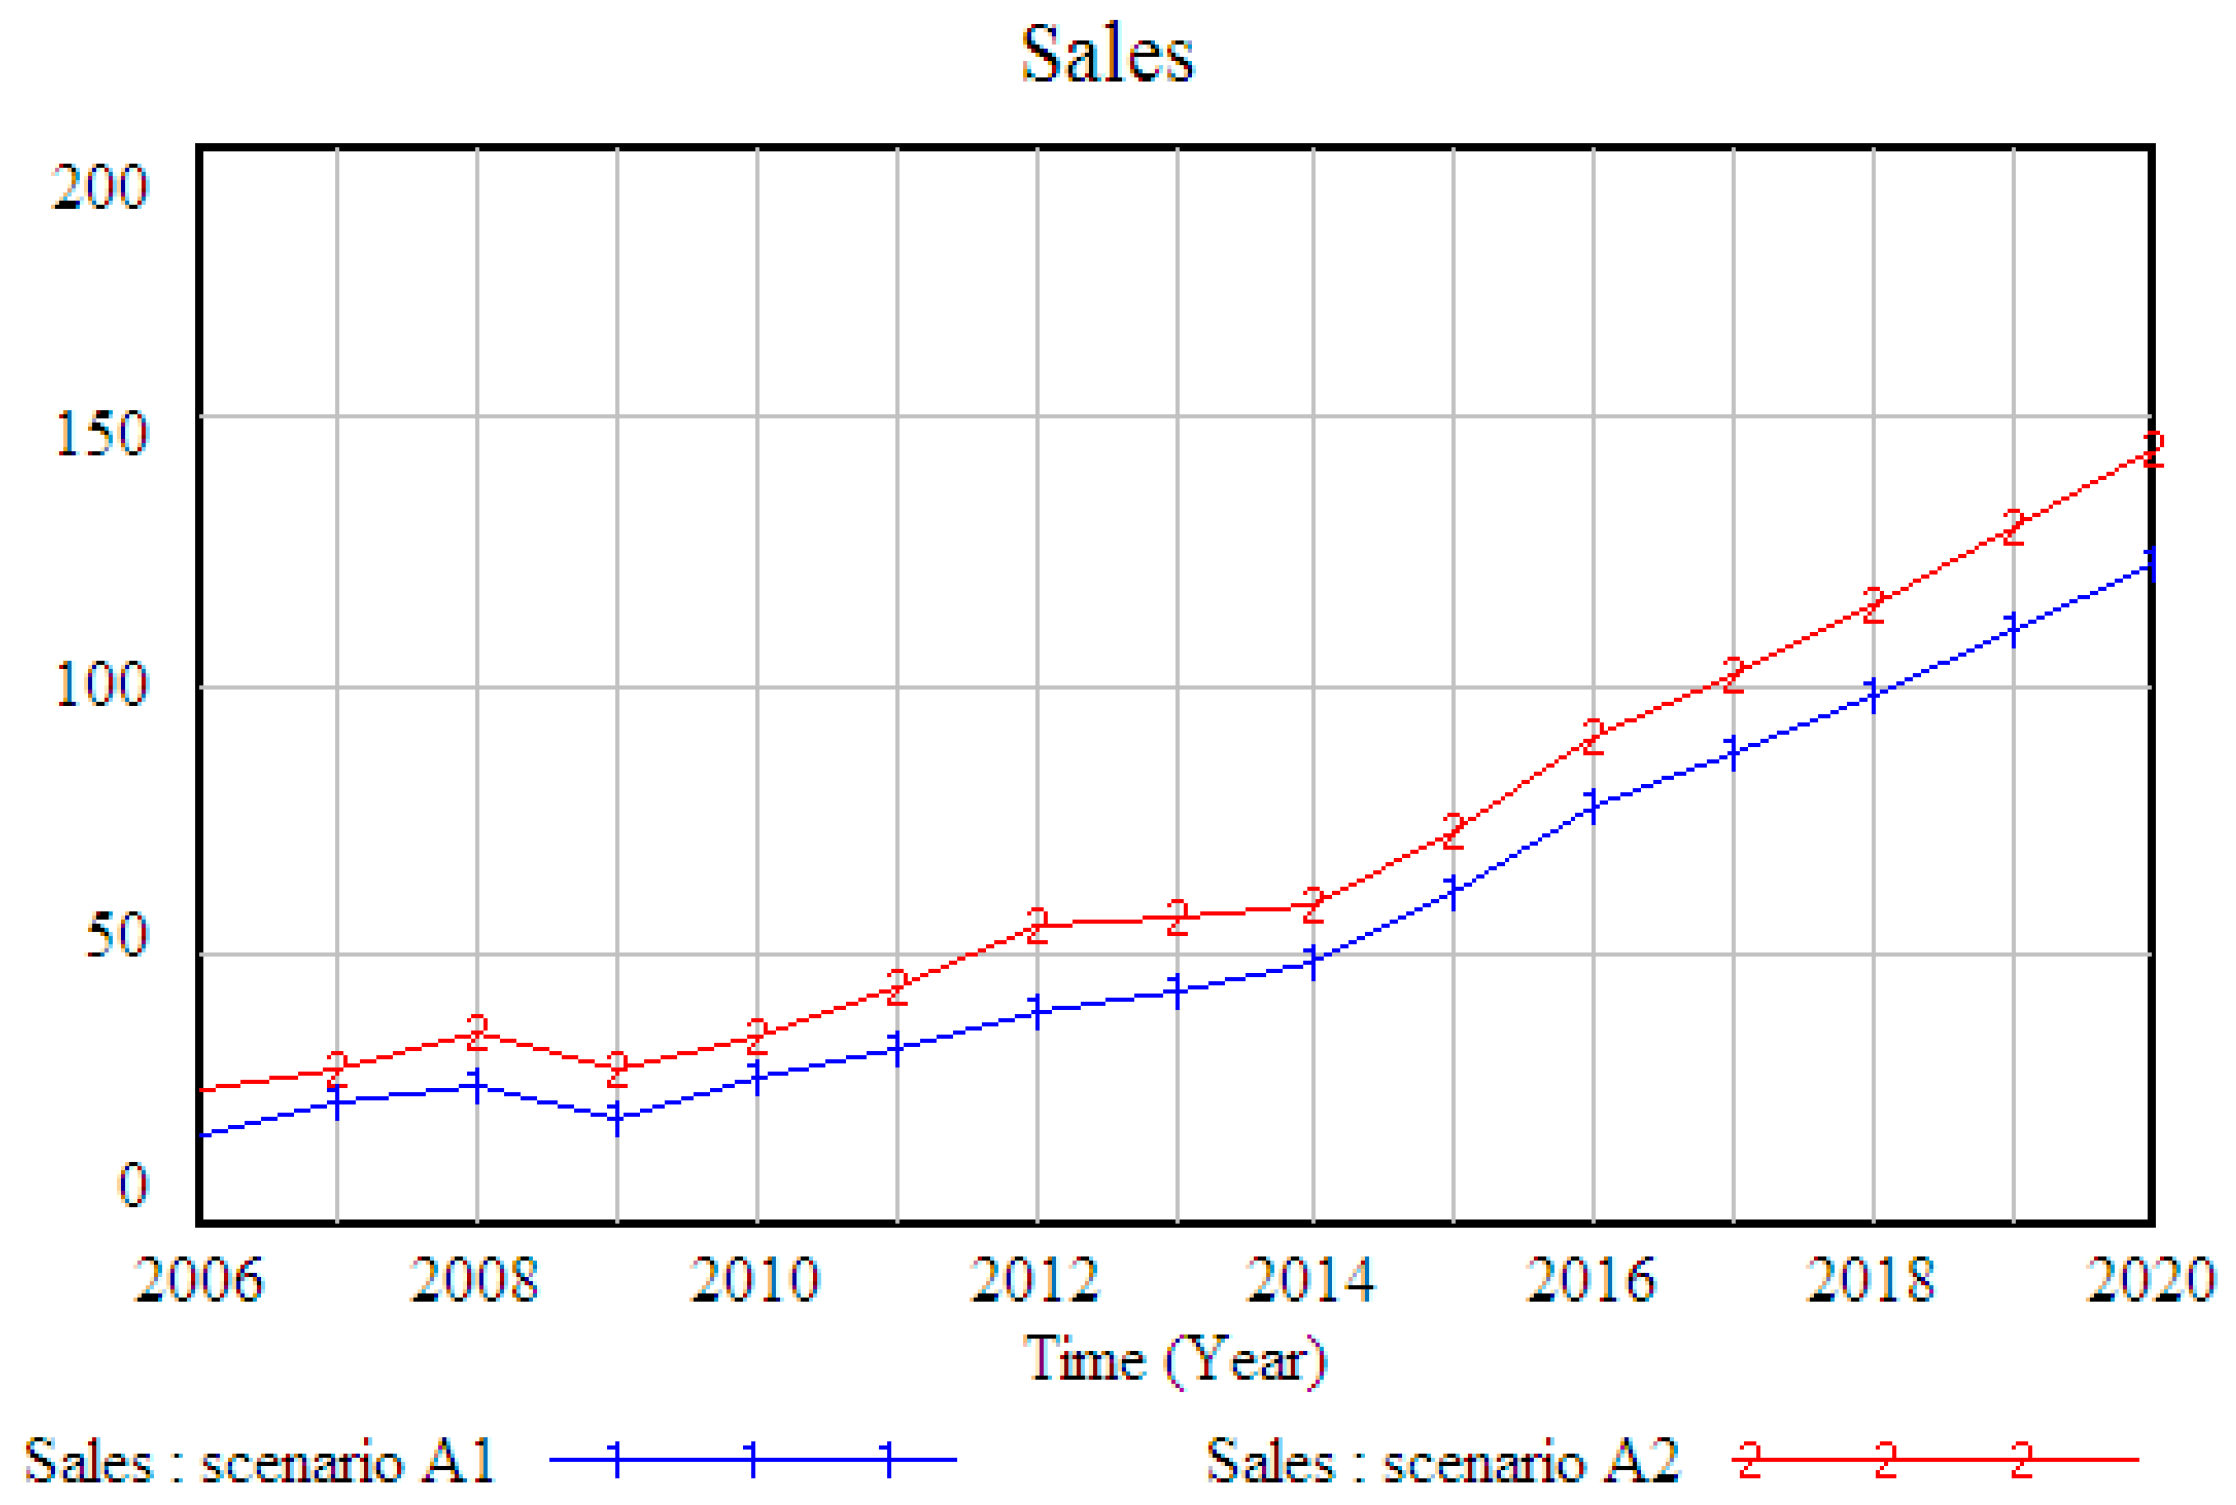
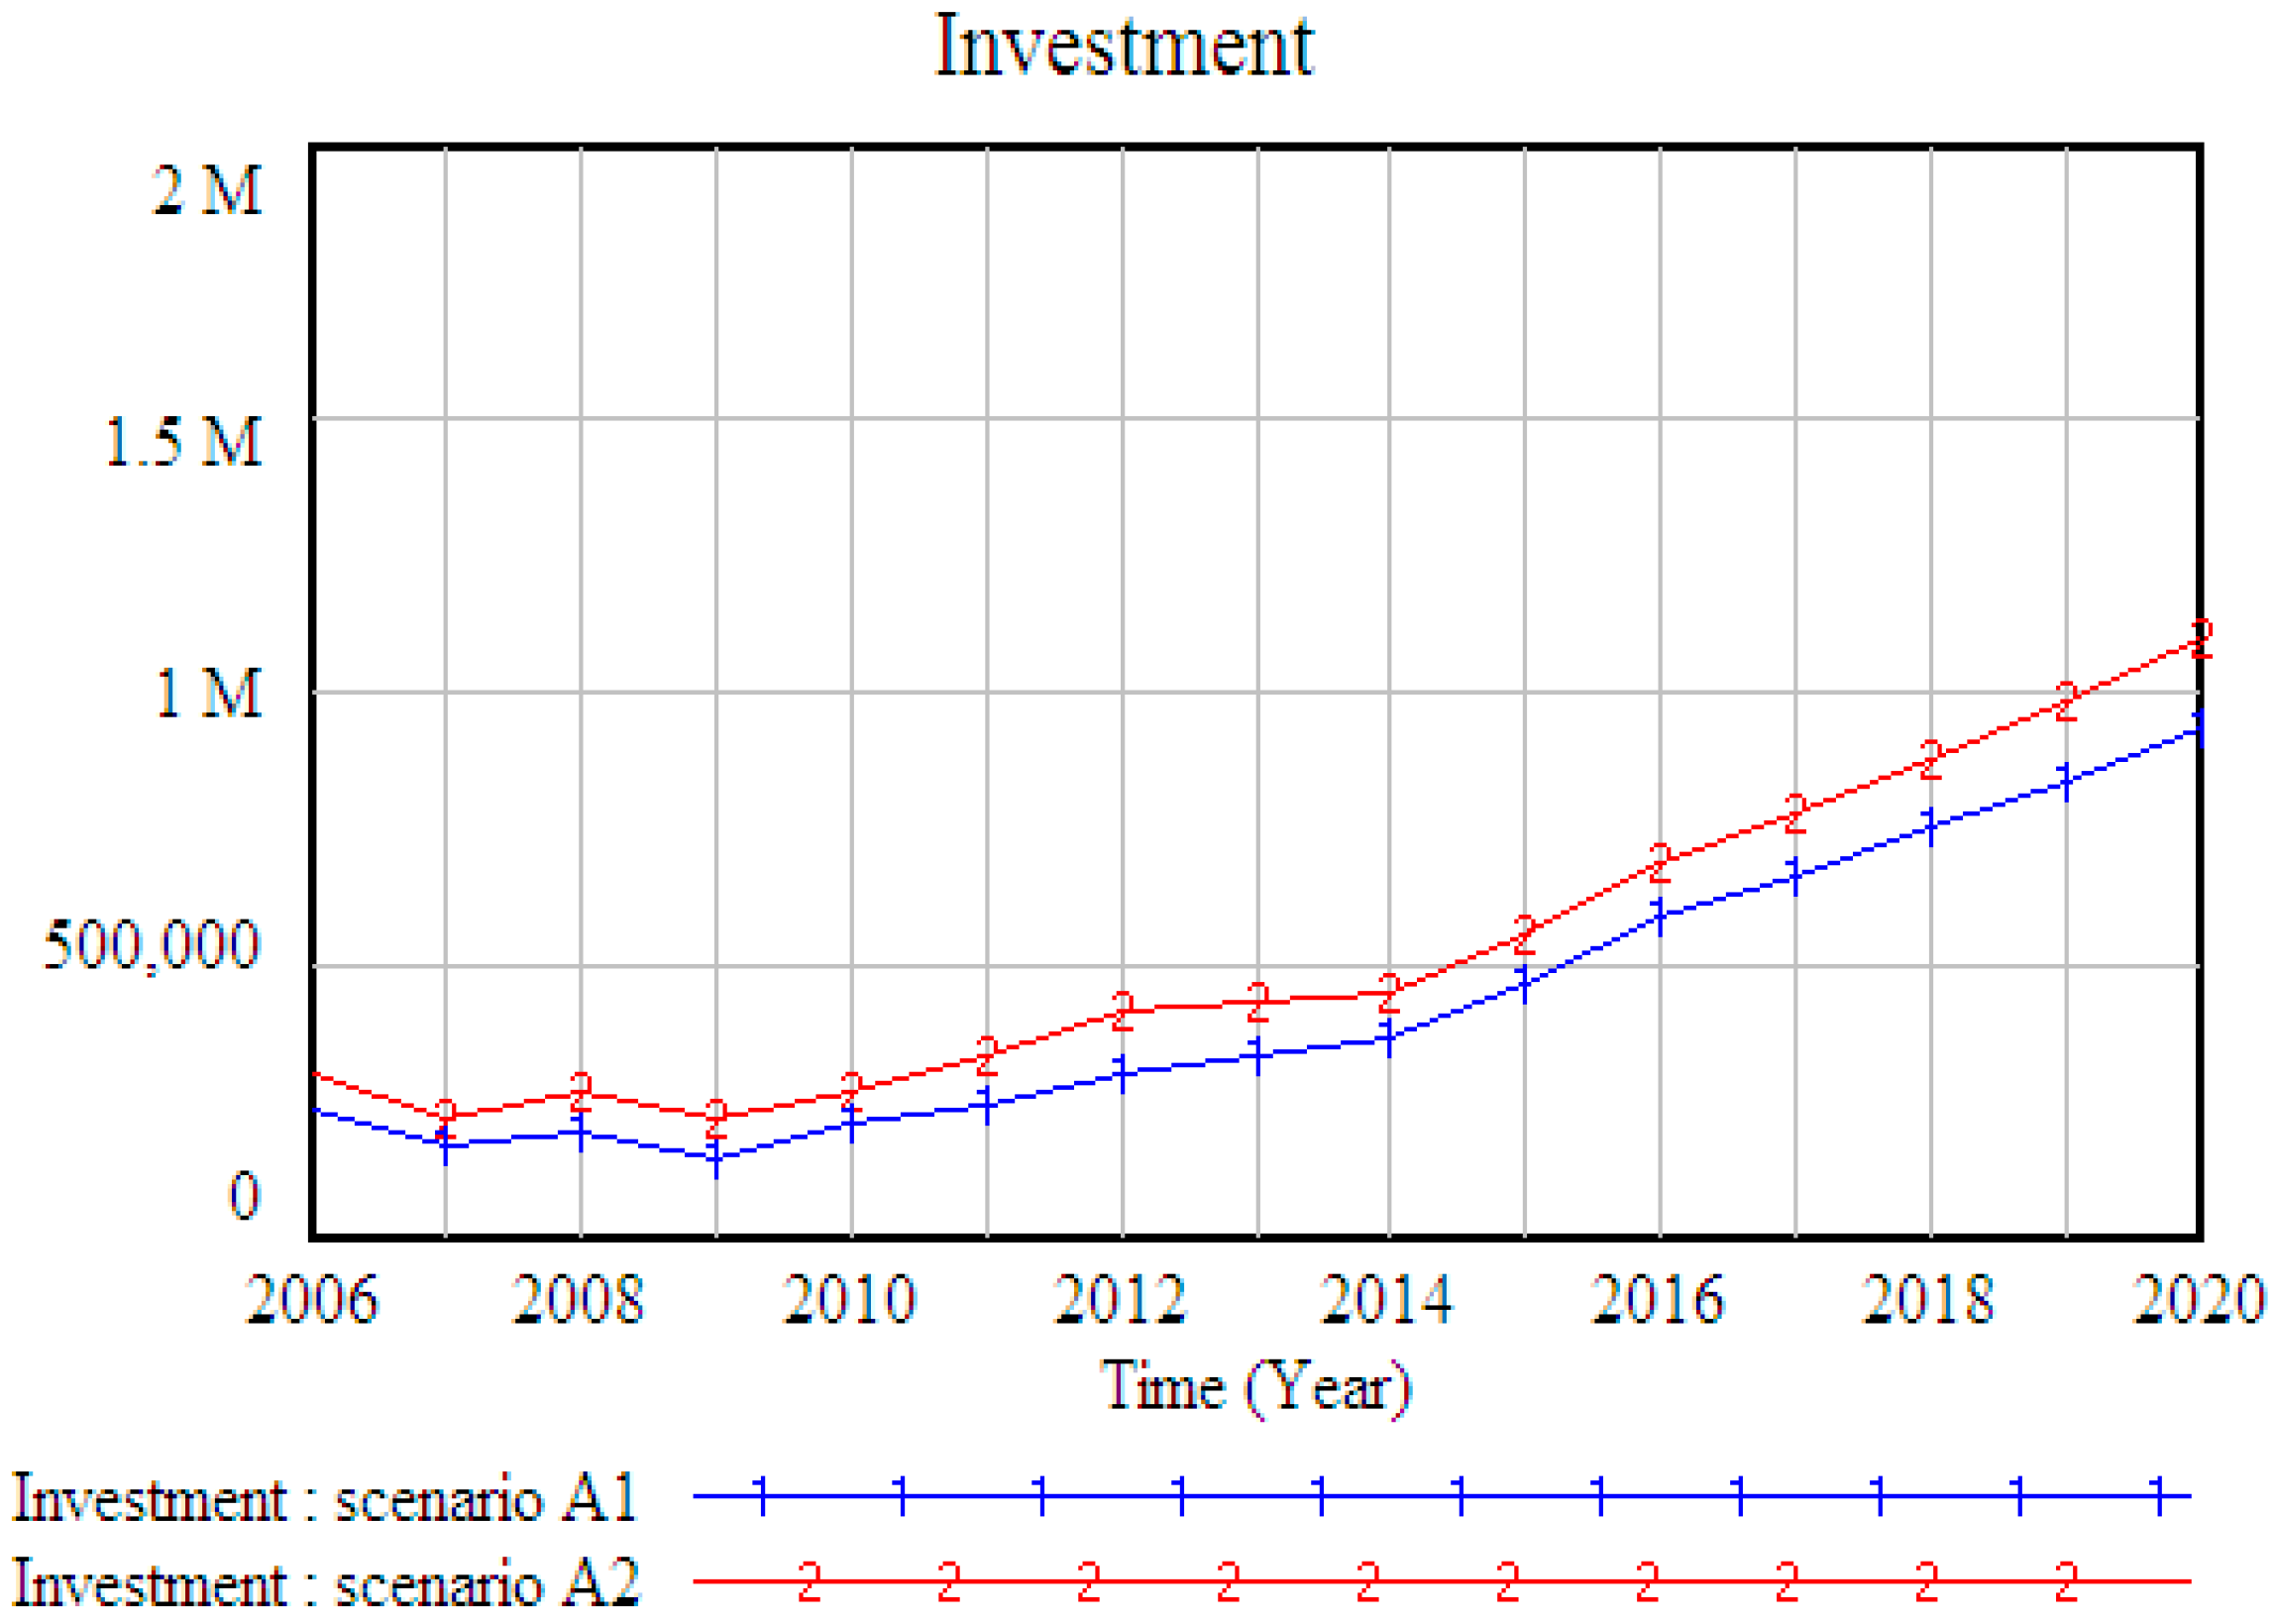
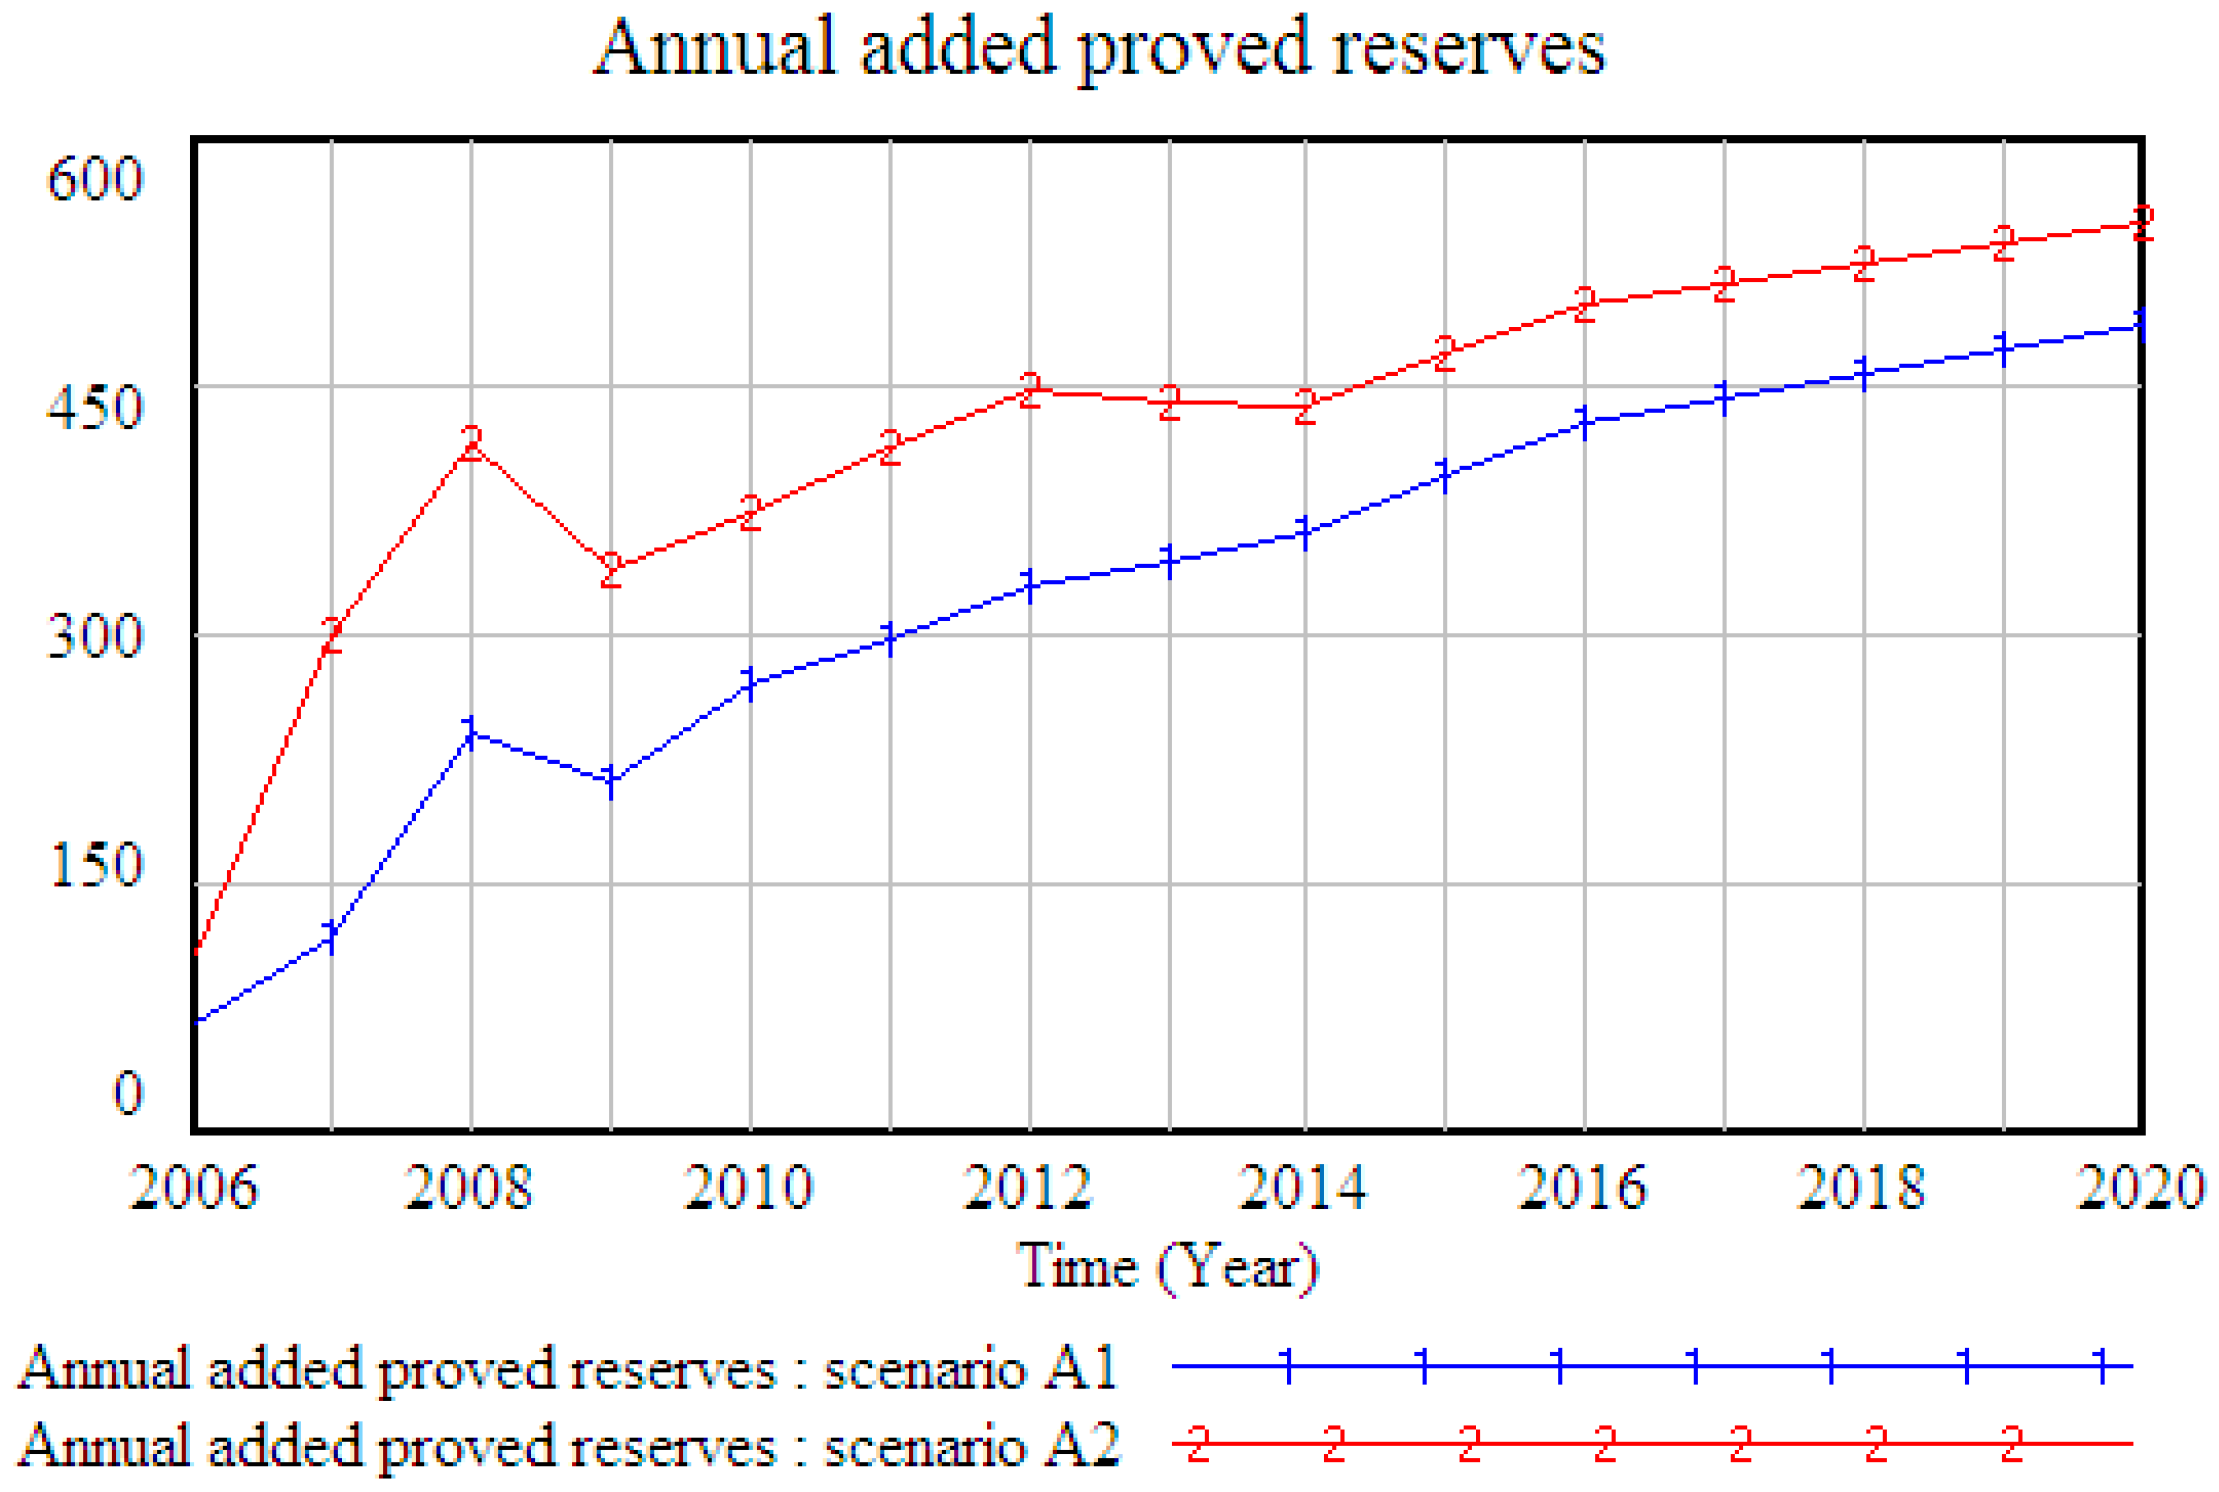
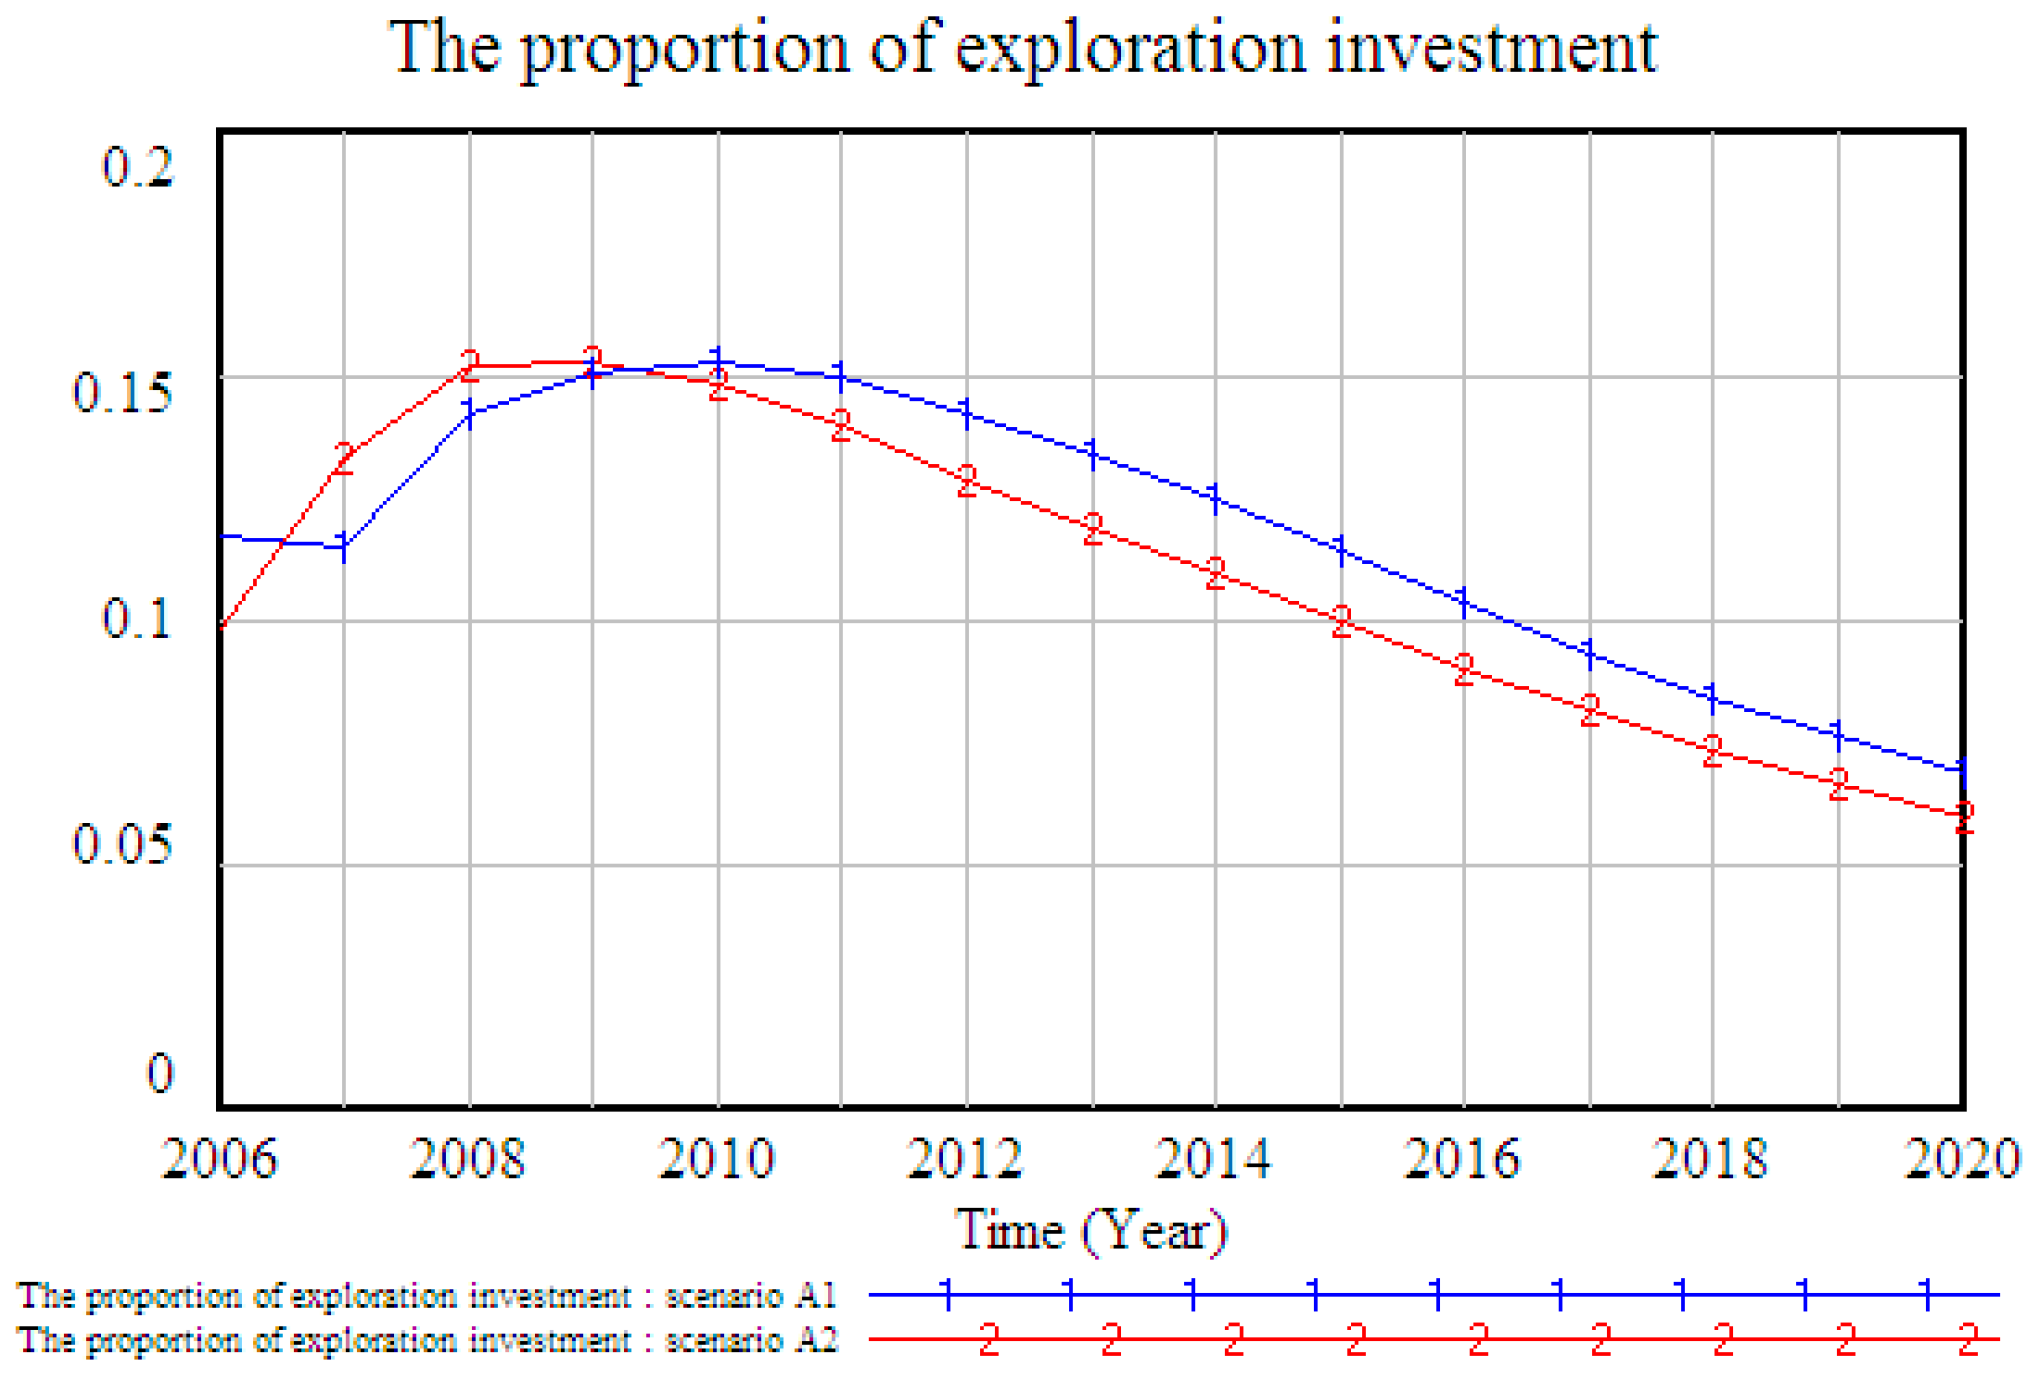

| Variable Name | Description | Unit |
|---|---|---|
| TIN | Total investment | 10 thousand Yuan (RMB) |
| EPSIN | Exploration investment | 10 thousand Yuan (RMB) |
| EPRIN | Exploitation investment | 10 thousand Yuan (RMB) |
| CPCR | Capital cost ratio | Percentage % |
| AEPWIN | Annual newly-increased exploration well investment | 10 thousand Yuan (RMB) |
| ACEWIN | Accumulative exploration well investment | 10 thousand Yuan (RMB) |
| EPWINCPR | Ratio of exploration well investment capitalization | Percentage % |
| AEPWCPIN | Annual exploration capitalization investment | 10 thousand Yuan (RMB) |
| EPWSR | Success ratio of exploration well | Percentage % |
| ACCPEPWIN | Accumulative capitalization exploration well investment | 10 thousand Yuan (RMB) |
| EPSDRIN | Exploration directly investment | 10 thousand Yuan (RMB) |
| 2DSIN | Two-dimensional seismic investment | 10 thousand Yuan (RMB) |
| 3DSIN | Three-dimensional seismic investment | 10 thousand Yuan (RMB) |
| EPSMIN | Matched investment for Exploration | 10 thousand Yuan (RMB) |
| EPSOIN | Other investment for Exploration | 10 thousand Yuan (RMB) |
| AADPRCPIN | Annual newly-increased proved resource capitalization investment | 10 thousand Yuan (RMB) |
| AEPRIN | Annual exploitation investment | 10 thousand Yuan (RMB) |
| ACEPRIN | Accumulated exploitation investment | 10 thousand Yuan (RMB) |
| EPRINCPR | Ratio of exploitation investment capitalization | Percentage % |
| ANEPRCPIN | Annual newly-increased exploitation capitalization investment | 10 thousand Yuan (RMB) |
| AEPRCPIN | Annual exploitation capitalization investment | 10 thousand Yuan (RMB) |
| ACCPEPRIN | Accumulated capitalization exploitation investment | 10 thousand Yuan (RMB) |
| EPRWIN | Exploration well investment | 10 thousand Yuan (RMB) |
| HWIN | Horizontal well investment | 10 thousand Yuan (RMB) |
| VWIN | Vertical well investment | 10 thousand Yuan (RMB) |
| EPRMIN | Matched investment for exploration | 10 thousand Yuan (RMB) |
| SLR | Sale revenue | billion cubic meters (bcm) |
| ASLR | Accumulated sale revenue | billion cubic meters (bcm) |
| AADVOP | Annual newly-increased volume of production | billion cubic meters (bcm) |
| ACADVOP | Accumulated newly-increased volume of production | billion cubic meters (bcm) |
| ADVOP | Annual diminished volume of production | billion cubic meters (bcm) |
| ACCP | Accumulated capacity | billion cubic meters (bcm) |
| 2DMLL | 2-D measure line length | meter |
| 3DEPRA | 3-D exploration area | kilometer |
| A2DMLL | Annual 2-D measure line length | meter |
| A3DEPRA | Annual 3-D exploration area | kilometer |
| AVWDP | Average well depth | meter |
| ADCP | Annual diminished capacity | billion cubic meters (bcm) |
| ACCP | Accumulated production capacity | billion cubic meters (bcm) |
| AACCP | Annual newly-increased capacity | billion cubic meters (bcm) |
| ACACCP | Accumulated newly-increased capacity | billion cubic meters(bcm) |
| AEPA | Annual exploration production reserve | billion cubic meters (bcm) |
| RRCR | Remaining recoverable reserve | billion cubic meters(bcm) |
| AARCR | Annual newly-increased recoverable reserve | billion cubic meters (bcm) |
| AAWR | Annual newly-increased workable reserve | billion cubic meters (bcm) |
| AWR | Accumulated workable reserve | billion cubic meters (bcm) |
| UWR | Unworkable reserve | billion cubic meters (bcm) |
| AADPR | Annual newly-increased proved resource | billion cubic meters(bcm) |
| ACPR | Accumulated proved resource | billion cubic meters (bcm) |
| ACPRCPI | Accumulated proved resource capitalization investment | 10 thousand Yuan (RMB) |
| TR | Total reserves | billion cubic meters (bcm) |
| AVOP | Annual volume of production | billion cubic meters (bcm) |
| ACAVOP | Accumulated Annual volume of production | billion cubic meters (bcm) |
| CAPLDF | Capacity load factor | Percentage % |
| RPR | Reserve/production ratio | Percentage % |
| NADR | Nature diminished ratio | Percentage % |
| CODR | Composite diminished ratio | Percentage % |
| HWFTN | Horizontal well footage number | meter |
| HWN | Horizontal well number | No. |
| VWFTN | Vertical well footage number | No. |
| VWN | Vertical well number | No. |
| ED | Exploitation degree | Percentage % |
| EOR | Exploitation oil recovery | Percentage % |
| EDT | Exploitation degree table | meter |
| DEP | Degree of exploration proved | Percentage % |
| WN | Well number | No. |
| EPWFT | Exploration well footage | meter |
| EPWN | Exploration well number | No. |
| Year | Historical Value | Simulated Value | Errors (%) |
|---|---|---|---|
| 2006 | 214,446 | 213,218 | 0.57% |
| 2007 | 442,000 | 464,219 | −5.03% |
| 2008 | 564,769 | 581,278 | −2.92% |
| 2009 | 680,162 | 680,809 | −0.10% |
| 2010 | 855,112 | 883,749 | −3.35% |
| 2011 | 1,068,800 | 1,094,572 | −2.41% |
| 2012 | 1,324,860 | 1,405,523 | −6.09% |
| 2013 | 1,627,530 | 1,563,358 | 3.94% |
| Year | Historical Value | Simulated Value | Errors (%) |
|---|---|---|---|
| 2006 | 123 | 112.71 | 8.37% |
| 2007 | 349 | 330.63 | 5.26% |
| 2008 | 579 | 540.48 | 6.65% |
| 2009 | 802 | 768.51 | 4.18% |
| 2010 | 1071 | 1066.31 | 0.44% |
| 2011 | 1439.01 | 1507.21 | −4.74% |
| 2012 | 1886.39 | 1835.25 | 2.71% |
| 2013 | 2428.33 | 2520.1 | −3.78% |
| Year | Historical Value | Simulated Value | Errors (%) |
|---|---|---|---|
| 2006 | 10.5 | 10.81 | −3.00% |
| 2007 | 14.5 | 14.13 | 2.56% |
| 2008 | 18.4 | 16.78 | 8.78% |
| 2009 | 19.6 | 18.79 | 4.13% |
| 2010 | 22.2 | 23.01 | −3.64% |
| 2011 | 26.5 | 27.02 | −1.96% |
| 2012 | 36.8 | 38.4 | −4.35% |
| 2013 | 45.1 | 47.2 | −4.66% |
© 2017 by the authors. Licensee MDPI, Basel, Switzerland. This article is an open access article distributed under the terms and conditions of the Creative Commons Attribution (CC BY) license ( http://creativecommons.org/licenses/by/4.0/).
Share and Cite
Xiao, J.; Cheng, J.; Shen, J.; Wang, X. A System Dynamics Analysis of Investment, Technology and Policy that Affect Natural Gas Exploration and Exploitation in China. Energies 2017, 10, 154. https://doi.org/10.3390/en10020154
Xiao J, Cheng J, Shen J, Wang X. A System Dynamics Analysis of Investment, Technology and Policy that Affect Natural Gas Exploration and Exploitation in China. Energies. 2017; 10(2):154. https://doi.org/10.3390/en10020154
Chicago/Turabian StyleXiao, Jianzhong, Jinhua Cheng, Jun Shen, and Xiaolin Wang. 2017. "A System Dynamics Analysis of Investment, Technology and Policy that Affect Natural Gas Exploration and Exploitation in China" Energies 10, no. 2: 154. https://doi.org/10.3390/en10020154
APA StyleXiao, J., Cheng, J., Shen, J., & Wang, X. (2017). A System Dynamics Analysis of Investment, Technology and Policy that Affect Natural Gas Exploration and Exploitation in China. Energies, 10(2), 154. https://doi.org/10.3390/en10020154


