Article

Environmental Assessment of Possible Future Waste Management Scenarios

by
Yevgeniya Arushanyan
1,
Anna Björklund
1,
Ola Eriksson
2,
Göran Finnveden
1,*,
Maria Ljunggren Söderman
3,
Jan-Olov Sundqvist
4 and
Åsa Stenmarck
4
1
Division of Environmental Strategies Research, Department of Sustainable development, Environmental Science and Engineering, School of Architecture and Built Environment, KTH Royal Institute of Technology, SE-100 44 Stockholm, Sweden
2
Department of Building, Energy and Environmental Engineering, Faculty of Engineering and Sustainable Development, University of Gävle, SE-801 76 Gävle, Sweden
3
Division of Environmental Systems Analysis, Department of Energy and Environment, Chalmers University of Technology, SE-412 96 Göteborg, Sweden
4
IVL Swedish Environmental Research Institute, PO Box 210 60, SE-100 31 Stockholm, Sweden
*
Author to whom correspondence should be addressed.
Energies 2017, 10(2), 247; https://doi.org/10.3390/en10020247
Submission received: 14 December 2016 / Revised: 5 February 2017 / Accepted: 7 February 2017 / Published: 19 February 2017
(This article belongs to the Special Issue Energy and Waste Management)

Abstract

:
Waste management has developed in many countries and will continue to do so. Changes towards increased recovery of resources in order to meet climate targets and for society to transition to a circular economy are important driving forces. Scenarios are important tools for planning and assessing possible future developments and policies. This paper presents a comprehensive life cycle assessment (LCA) model for environmental assessments of scenarios and waste management policy instruments. It is unique by including almost all waste flows in a country and also allow for including waste prevention. The results show that the environmental impacts from future waste management scenarios in Sweden can differ a lot. Waste management will continue to contribute with environmental benefits, but less so in the more sustainable future scenarios, since the surrounding energy and transportation systems will be less polluting and also because less waste will be produced. Valuation results indicate that climate change, human toxicity and resource depletion are the most important environmental impact categories for the Swedish waste management system. Emissions of fossil CO2 from waste incineration will continue to be a major source of environmental impacts in these scenarios. The model is used for analyzing environmental impacts of several policy instruments including weight based collection fee, incineration tax, a resource tax and inclusion of waste in a green electricity certification system. The effect of the studied policy instruments in isolation are in most cases limited, suggesting that stronger policy instruments as well as combinations are necessary to reach policy goals as set out in for example the EU action plan on circular economy.

1. Introduction

Waste management has in many countries gone through significant changes during the last decades. In Sweden, material recycling and energy recovery have increased and landfill disposal of for example municipal solid waste has decreased [1]. This is largely in line with the waste hierarchy (ibid.), which promotes reuse, recycling, and energy recovery as the guiding principle for waste policies in the European Union and many other countries.
Still, waste management needs to continue the transition towards increased recovery of resources in order to meet climate targets and for society to transition to a circular economy [2]. Therefore, research for developing waste management policy instruments is important. Recently, there has been growing interest in this field. A number of policy instruments and policy mixes for a more sustainable waste management have been suggested (e.g., [3,4,5]).
In order to avoid sub-optimization and problem-shifting, changes in waste policy should be supported by assessments of both economic, social and environmental consequences, and considering both a systems perspective and forecasted future waste amounts. Depending on the development of society as a whole, future waste amounts may vary considerably and forecasting must take into account aspects such as economic development, technological development, consumer behavior and national and international policy. A systems perspective in economic and environmental assessment of waste management requires that not only waste and its treatment are considered, but also the consequences when recovery of resources from waste affect the provision of energy and materials from other sources. Although such a comprehensive view on waste management is expressed in for instance the European Union action plan for the circular economy [2], few frameworks for such assessment exist.
Future waste management will depend on future waste amounts but also a number of factors internal and external to the waste management system, including for example energy and transportation systems and consumer behavior [6]. In order to include relevant aspects in a comprehensive assessment, future scenarios are necessary. There are different types of future scenarios which answer different types of questions [7]. Explorative scenarios which aims at answering the question “What can happen…?” are particularly useful when long-term considerations are made and the uncertainties about future developments are larger (ibid.).
One type of explorative scenario is the external scenario which focuses on factors that are external to the decision-maker, factors that the decision-maker has no, or only limited control over [7]. External scenarios may be useful for decision-makers in cases of strategic policy scenarios, where possible policies are evaluated in possible external scenarios (ibid.). Several criteria may be employed in explorative scenarios (cf. [7]). They would have to be plausible; if considered completely unrealistic they are irrelevant. At the same time they should be challenging. They should be clearly different so that users of the scenarios get an indication of the possible outcomes. Finally, the scenarios should be internally consistent. Different types of scenarios may be combined with different types of tools for systems analysis (e.g., [8]).
Life cycle Assessment (LCA) provides a systems perspective in environmental assessment [9]. LCA as a tool to assess the environmental impacts of waste management has gained in acceptance since it first appeared in the 1990’s, and is today well established [10,11]. Several dedicated waste LCA models have been developed [12] but general LCA tools can also be used. Several reviews have been published (e.g., [13,14,15,16,17,18]) describing a number of different applications. There has been a dominant focus on municipal solid waste (MSW) although this type of waste only accounts for a relatively minor share of the total waste in most countries [16]. There is thus a need for developing LCA models that also includes different types of industrial and commercial waste streams.
In a recent Swedish project Towards Sustainable Waste Management (TOSUWAMA), existing tools for future scenarios, economic modelling and LCA were combined and expanded for assessing future waste management [19]. Five external scenarios of societal development in Sweden until the year 2030 were developed [6,20,21]:
0: Reference scenario, assuming developments in accordance with official forecasts made in 2008 (business as usual).
1: Global sustainability, assuming globalization and strong political control over the environment and natural resources.
2: Global markets, assuming globalization and weak political control over the environment and natural resources.
3: Regional markets, assuming regionalization and weak political control over the environment and natural resources.
4: European sustainability, assuming regionalization and strong political control over the environment and natural resources.
Based on these five qualitatively described scenarios, waste scenarios describing future waste amounts and their cost-effective management [21] were quantified using a Computable General Equilibrium (CGE) model of the Swedish economy (Environmental Medium Term Economic Model, EMEC) [22,23], which was soft-linked with a systems engineering model of the Swedish system for management of non-hazardous waste (National Waste Management model, NatWaste) [24,25]. The potential environmental impact for the different waste scenarios was calculated using an LCA model (Swedish Waste management Environmental Assessment, SWEA) developed for this specific purpose. This set of soft-linked models is described in [19]. Different policy instruments were applied to the different future scenarios and assessed from an economic and environmental perspective in order to explore the potential environmental impacts and benefits of introducing various policy instruments.
The aim of this paper is threefold:
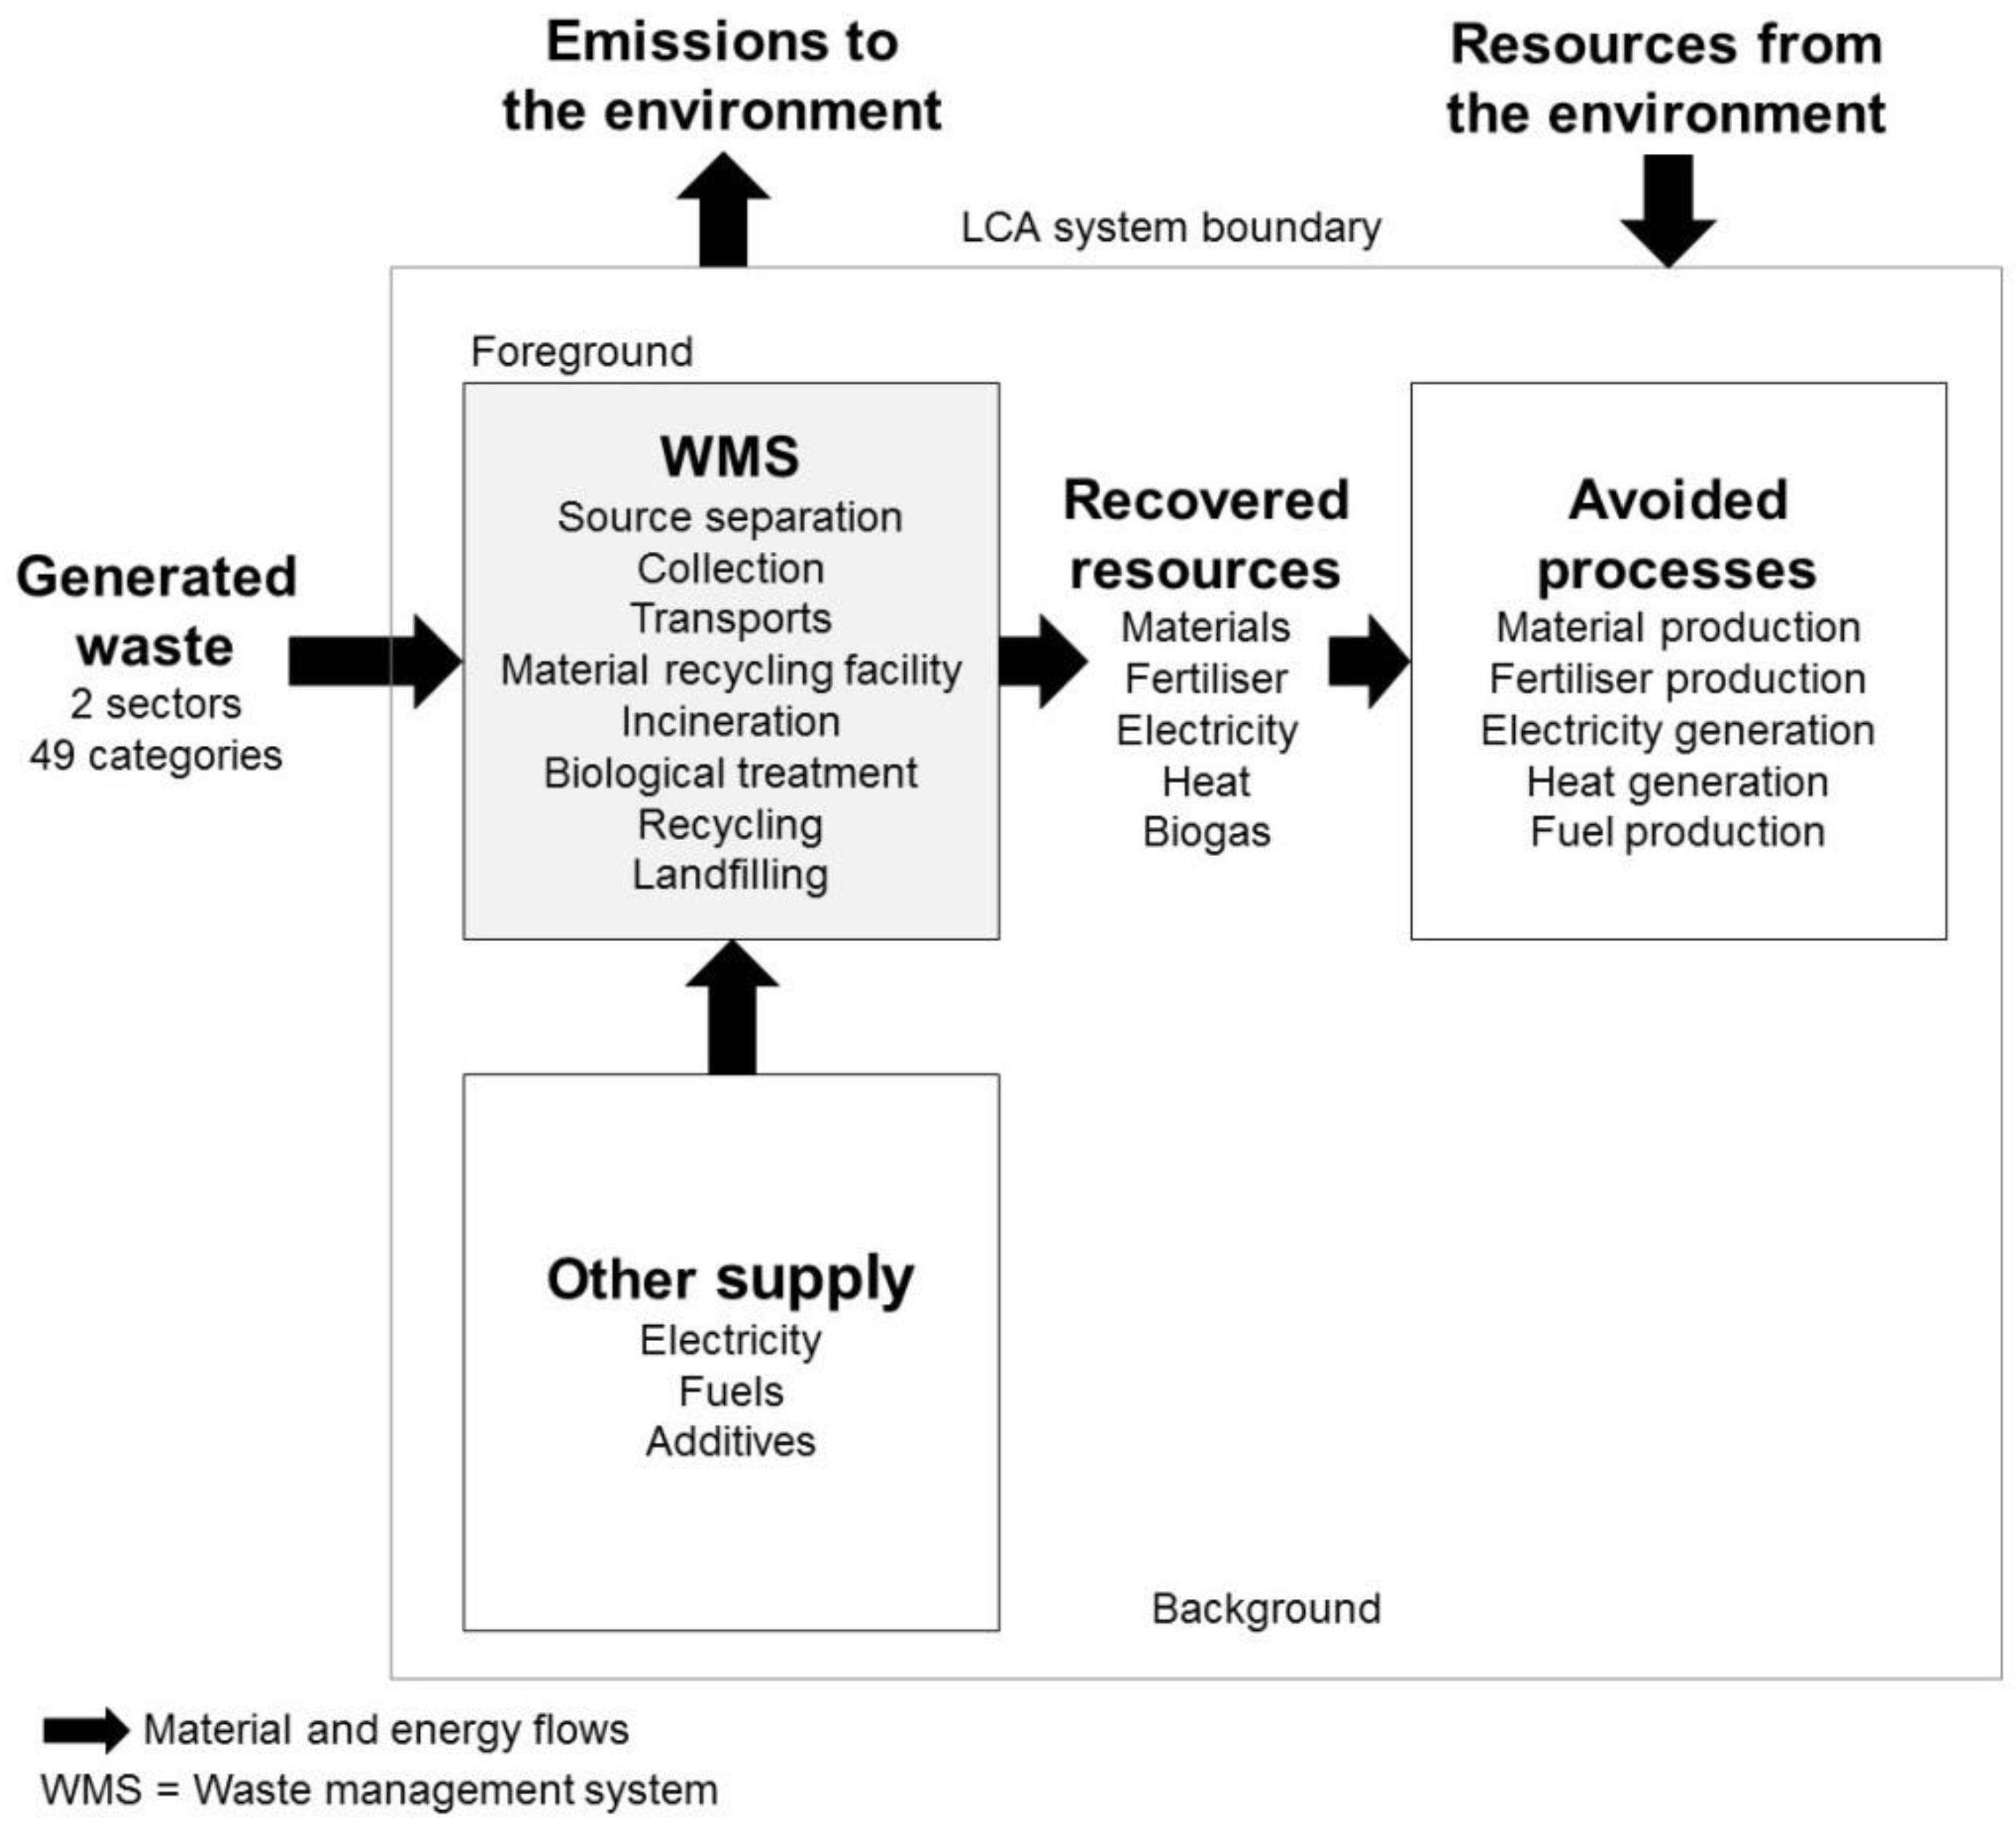
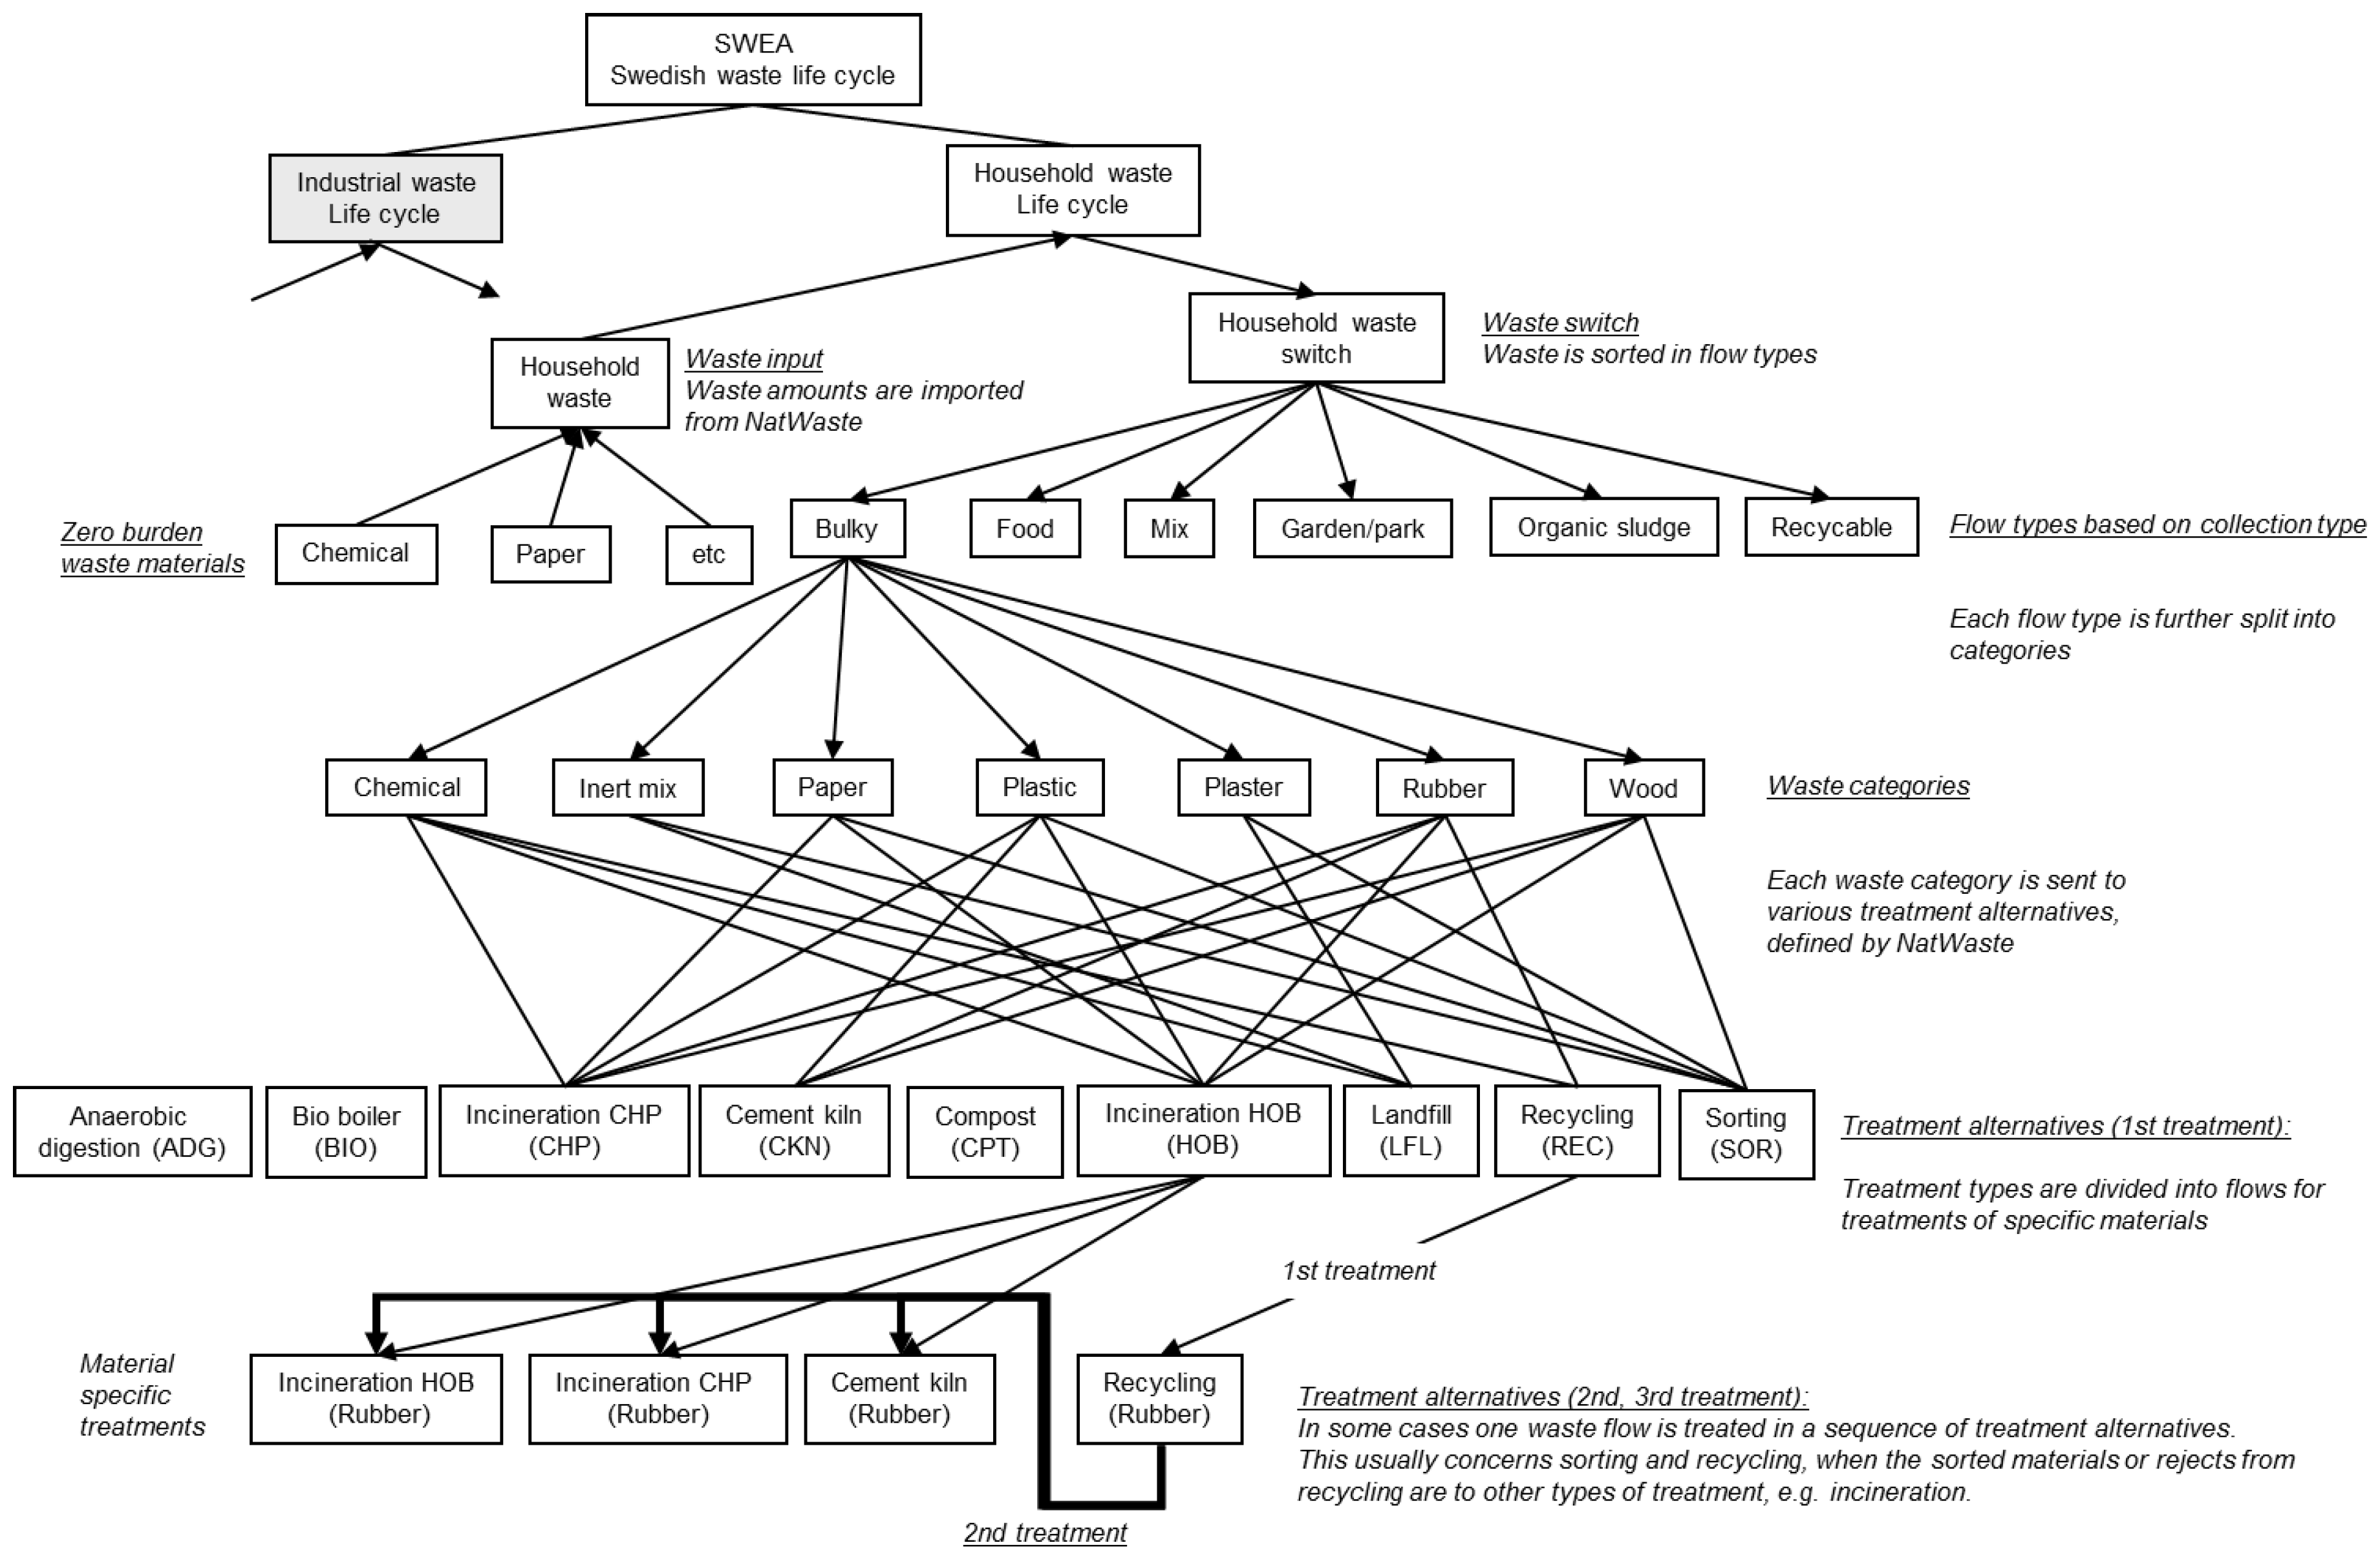
  • To present the comprehensive LCA-model SWEA (Swedish Waste management Environmental Assessment). The model is unique in including most waste streams in Sweden except mining waste and hazardous waste.
  • To present potential environmental impacts, as calculated with SWEA, of the different scenarios of Swedish waste management systems for the year 2030. These results can be a basis for a discussion on which are the most important environmental impacts in the Swedish waste management system and the most important processes from an environmental perspective.
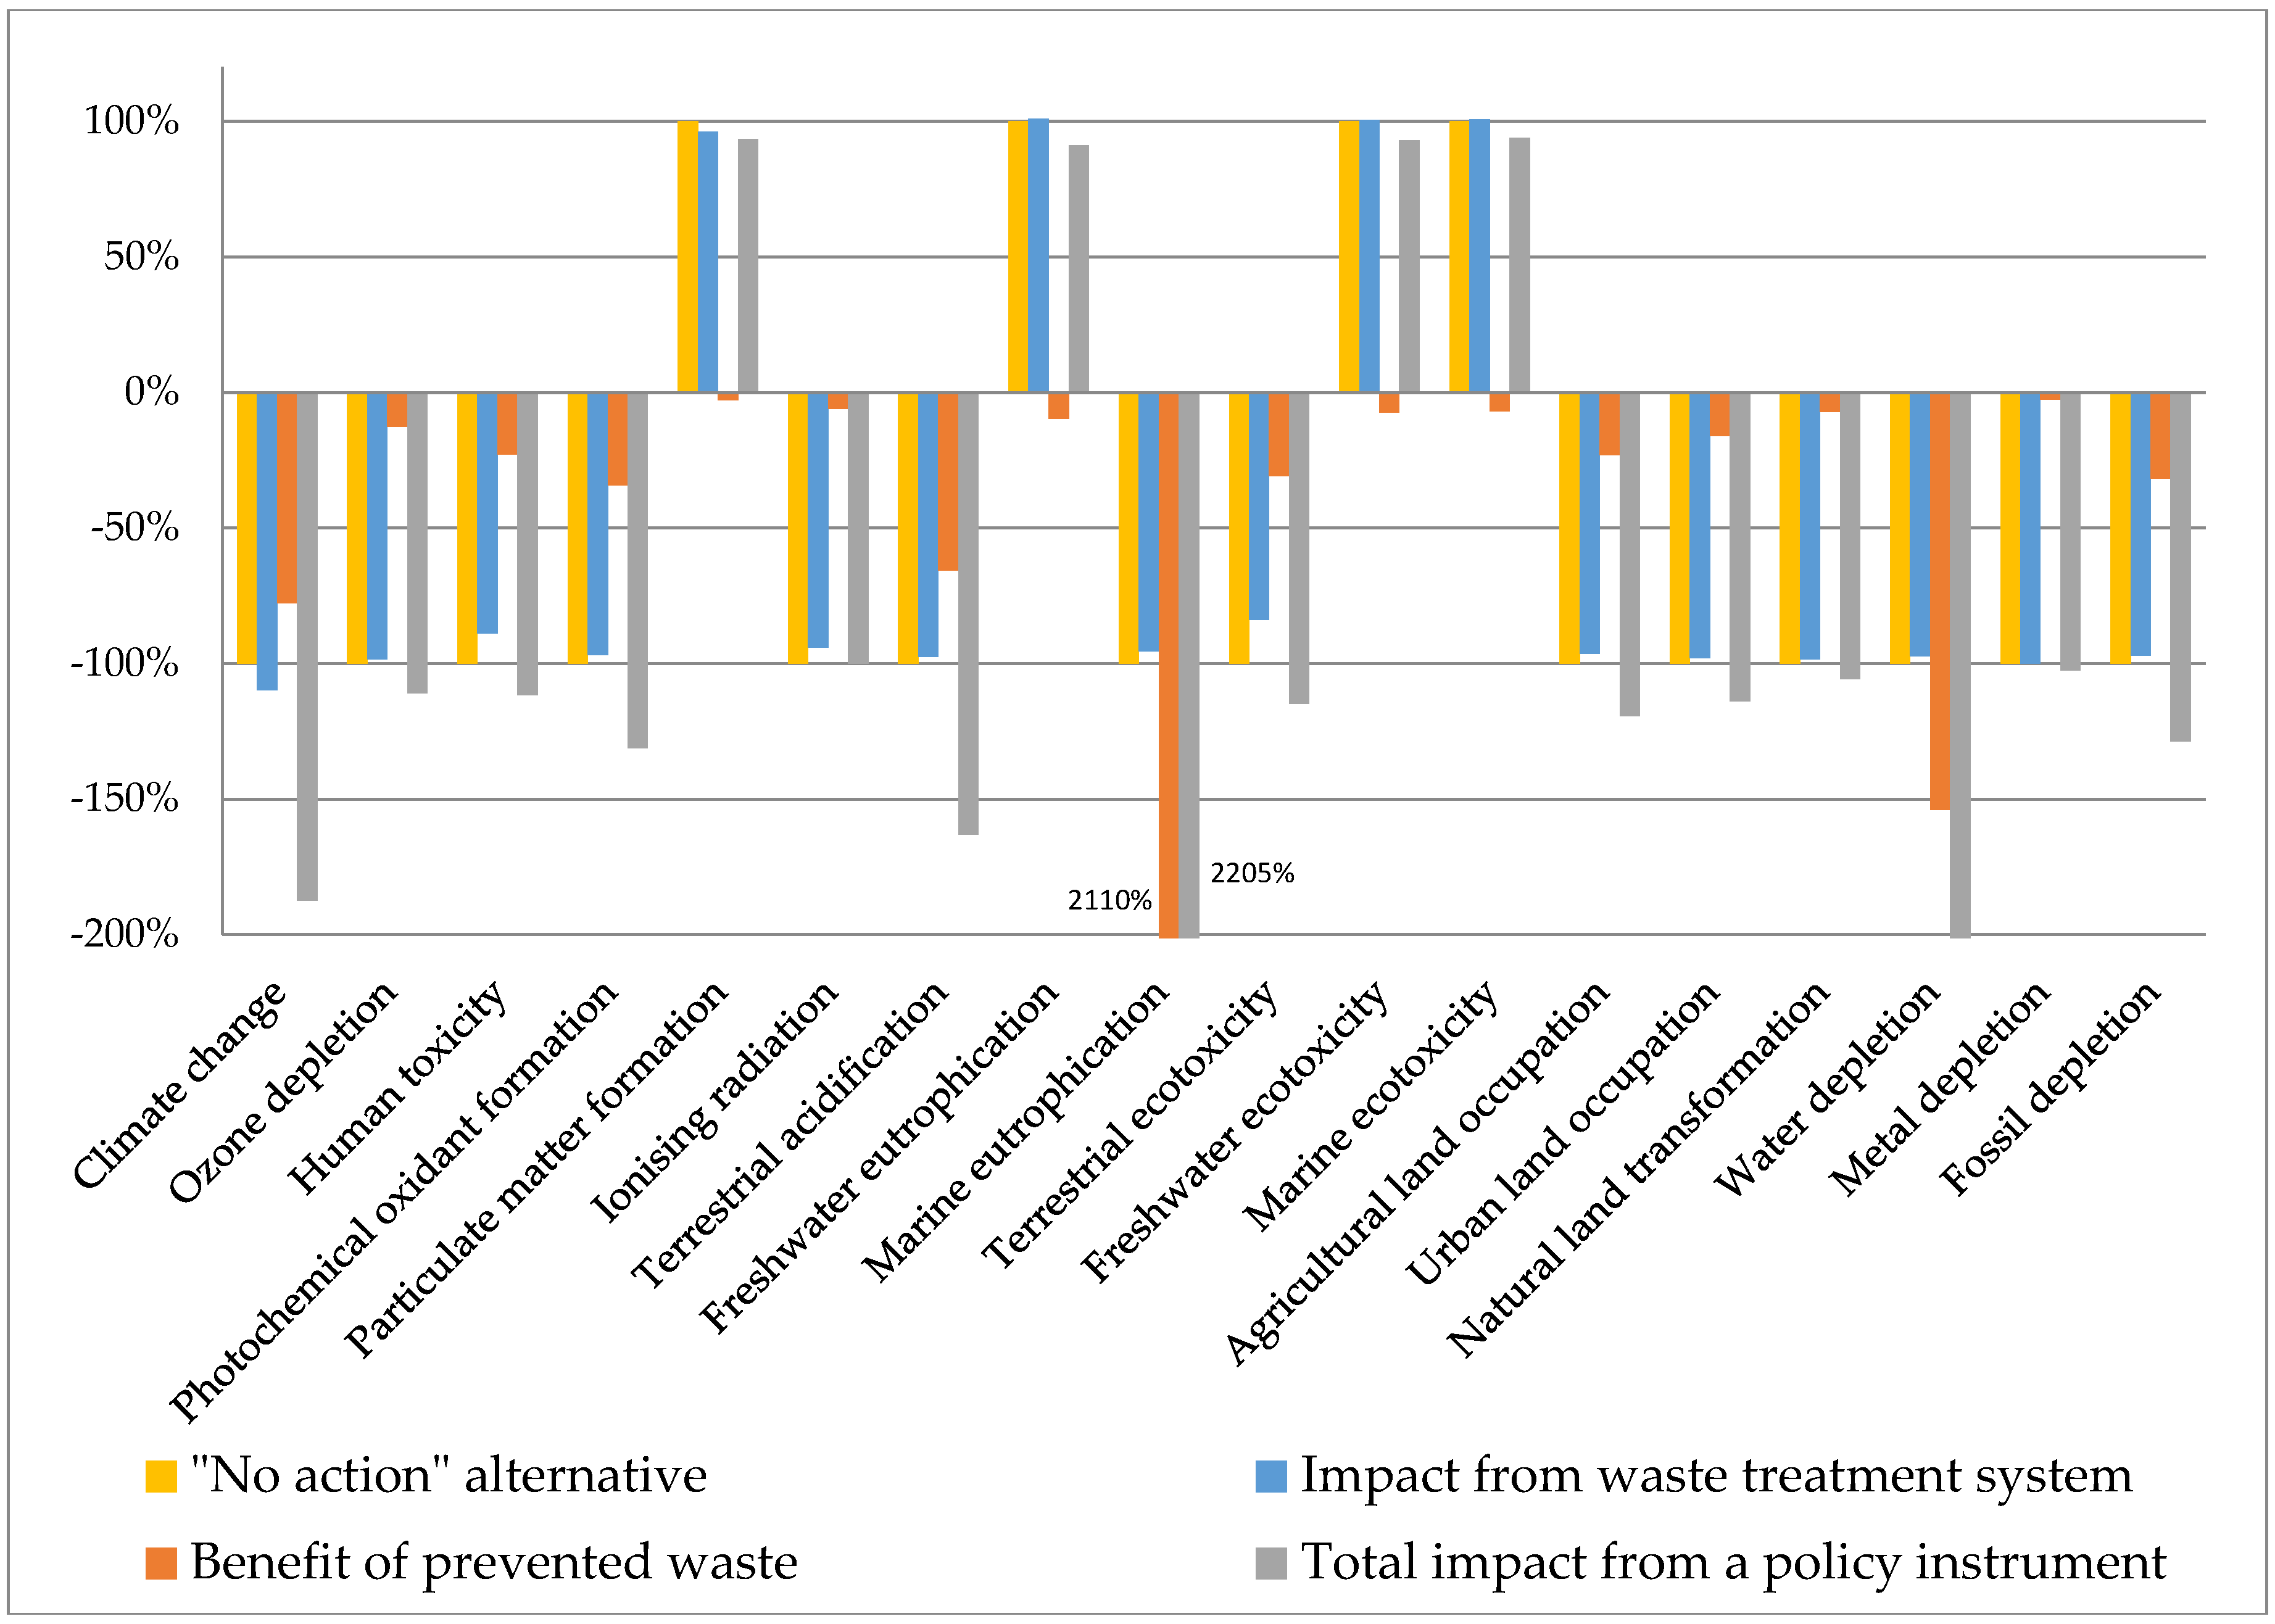
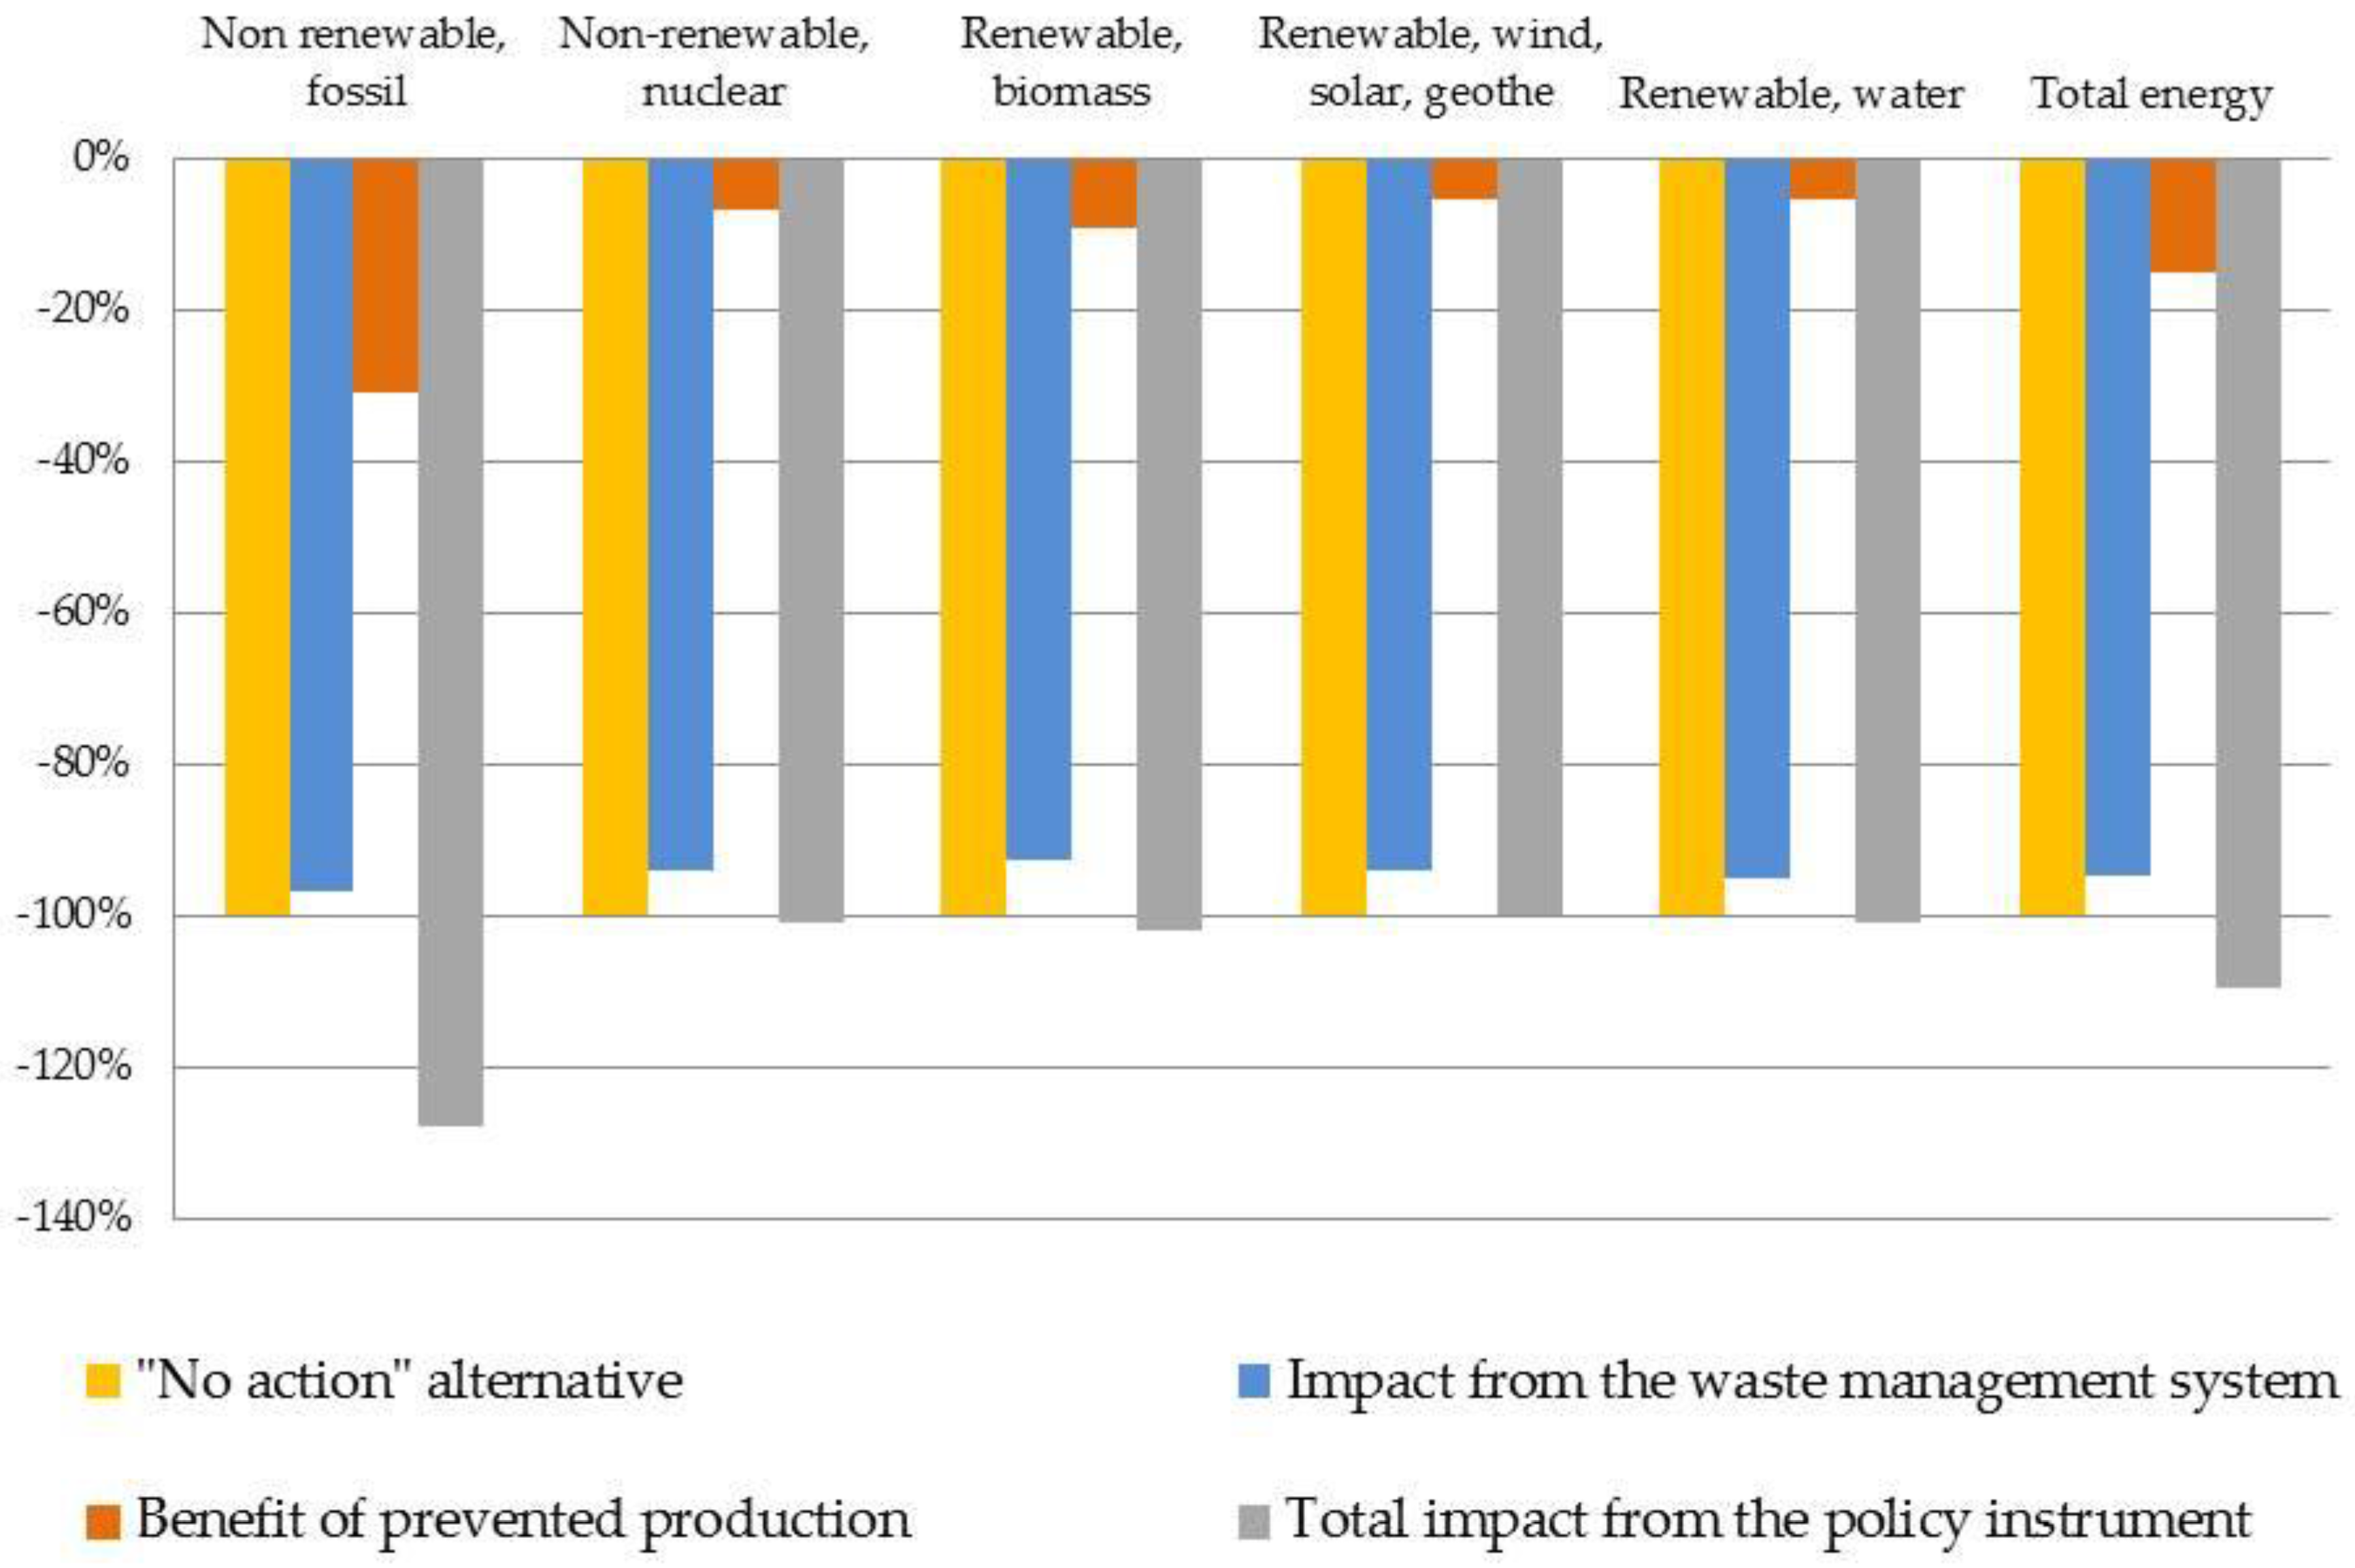
  • To present quantitative results on potential environmental impacts of policy instruments which were suggested to contribute to a more sustainable waste management [26].

2. Method

2.1. SWEA Model—Scope and General Outline

SWEA (Swedish Waste management Environmental Assessment) is an LCA tool. SWEA is developed for performing assessments concerning how the life cycle environmental impacts of Swedish national waste management are affected by various policy instruments in different future scenarios. Therefore, the main functional unit of an assessment using SWEA is collection and treatment of all (with a few exceptions) non-hazardous waste generated during one year in Sweden.
The overview of the model’s structure is presented in Figure 1 and a segment of the model is further described in Appendix A. The basic principle of the model is as follows: All the waste is split into two categories—industrial and household. The input data for waste amounts (from NatWaste) is sorted in waste flows (which determine calculation of waste collection and transport). Waste flows are split into waste categories (and sometimes further into material fractions) which are “sent” to different waste treatment alternatives. While the model set-up is the same for all scenarios, the amount and composition of waste in each scenario (Table 1) is determined by the EMEC and the selection of treatment alternatives in each scenario (Appendix B) is determined by the optimization in NatWaste.
The system includes collection, transportation, separation and treatment of the different waste fractions. The waste categories included are based on European statistics and are further described in Ljunggren Söderman et al. [19]. The composition of most waste fractions is modeled using ORWARE model [27] (for more detail see Supplementary Materials S1). The collection systems and possible treatment technologies for each waste fraction are described in Appendix B. SWEA’s scope in terms of waste categories and treatment options was harmonized with the setup in NatWaste. The integration of the two models is described in Ljunggren Söderman et al. [19]. The amounts of waste in each category and the amounts directed to a respective treatment are calculated in NatWaste for each scenario and policy instrument and further transferred to SWEA. The process data for various treatment processes is either modeled in ORWARE or based on existing data from databases or literature (described in Appendix C).
Compared to previous LCA models of waste management, SWEA is unique in its scope as outlined in Figure 1. It includes waste from two sectors (industry, including the public sector, and households) distributed in 49 different waste categories. Each category is split into fractions and can have a number of different waste treatment options including incineration with energy recovery, recycling and landfill disposal.
Credit is given to useful products, materials and energy carriers recovered in the waste-management system that can replace products made from virgin raw materials, in line with established LCA methodology for waste management (e.g., [28,29]). The choice of credits is further described below. In addition, SWEA includes the reductions in material production that follows from waste-prevention efforts. This allows the model to account for the environmental benefits of waste prevention.
SWEA was implemented in the SimaPro software [30]. The results presented in this paper use the ReCiPe methodology [31] together with cumulative energy demand [32] for impact assessment, but in principle any Life Cycle Impact Assessment method can be used together with SWEA. The ReCiPe method was chosen as one of the commonly used and well established methods which gives a comprehensive set of environmental issues. All 18 impact categories presented in this method were considered. This scope is consistent with the aims of the study which includes the assessment of potential environmental impacts, thus a comprehensive set is relevant. In order to identify the potentially most important impact categories, the valuation method Ecovalue12 [33] was used. It is a monetary method based on damage costs, originally developed by Ahlroth and Finnveden [34]. It includes weighting factors for many but not all mid-point impact categories in the ReCiPe methods. The cumulative energy demand was also calculated since it is considered as a useful indicator for many stakeholders, both as an indicator of its own right and as a proxy indicator.

2.2. Data Inventory

The system can be divided into two parts—foreground and background. The foreground system includes the core waste management system, including collection, transportation, separation and treatment of waste. The background system consists of up-stream and down-stream processes representing production of fuels, electricity and materials used by the foreground system and the avoided processes for alternative production of resources recovered from waste (energy, material and nutrients) in the foreground system. Input data to the model is data on waste flows (amounts and treatment) as determined for each future scenario by EMEC and NatWaste.

2.2.1. Waste Flows

The amounts of waste generated in each scenario are presented in Table 1. The key assumptions varying in different scenarios and affecting the resulting waste amounts and treatment flows are Gross Domestic Product (GDP), world trade, primary product prices, oil prices, employment, carbon permit price, waste intensities and energy system performance [19]. The amounts of waste generated in each scenario are presented per waste fraction and waste flow type and the chemical composition including data on some specific metals are presented in the Supplementary Materials S2.

2.2.2. Foreground

Data for the foreground processes were mainly taken from Swedish sources. These include data developed in earlier projects involving the project team (e.g., [35,36,37,38]), including updates [39] and completions using various sources, such as characterization of waste fractions previously not inventoried and documented. The ambition has been to collect process data corresponding to Best Available Technology (BAT) with the rationale that current BAT can be a reasonable assumption for average data in 2030. The process data inventory is presented in CPM database [40,41,42,43,44,45]. Description of datasets including references is provided in Appendix C.
Biogenic and fossil carbon flows are traced separately. Methane is accounted for regardless of origin. Sequestration of fossil carbon in products or landfills is accounted for implicitly as less carbon is emitted in such scenarios. Biogenic CO2 is counted as carbon-neutral, regardless when it is emitted. Carbon sequestration of biogenic carbon is accounted for as an offset in landfill disposal and for digestate and compost from anaerobic digestion and composting.
For landfill a long-term perspective has been used (both surveyable and remaining time included). Percentages of unfit materials (i.e., those not recycled in recycling processes) are specified in the LCI datasets applied for the modelling of recycling, as specified in datasets in the CPM database (refs. [40,41,42,43,44,45]). Data for the composition of waste fractions is presented in Appendix D and Supplementary Materials S1. For each fraction or flow the type of collection (comingled, bag, bin, recycling station, recycling center Recycling station is for collecting packaging waste and newspapers; Recycling center is for collecting bulky, gardening, electronic, hazardous and other waste.) and the type of treatment is specified. If the flow undergoes several types of treatment, the sequence is noted as well. The collection and transportation of the waste are modelled as fuel consumption per ton of collected waste, using rough estimates of average national collection modes and distances for different waste types based on [46]. The distances for transportation to treatment after collection are rough mean estimates based on high and low values for different types of housing and area (urban or rural). For the waste collected at recycling station the personal transportation is also considered, assuming the use of car and biking/walking (50%/50%) for a distance of 1 km (both ways) with the load of 10 kg per trip. The fuel for trucks and for personal cars varies in different scenarios according to assumptions presented in Appendix E.

2.2.3. Background

For background processes, data were in most cases taken from the Ecoinvent database [47] as implemented in SimaPro 7.3. This is further described in the detailed process data in Appendix C.
In order to decide on which energy and transportation background data to use, the scenarios had to be analyzed further. The features of the scenarios described in Dreborg and Tyskeng [20], such as changes in the society behavior (e.g., increased use of the secondary materials, local production, general environmental policy direction, etc.) as well as changes on the energy market (fuel prices, government policies or incentives) were taken into account. The model includes data sets for average and marginal electricity, heat, and fuels. Depending on the goal of a specific study, either or both of these may be relevant (e.g., [28,48]).
Average energy mixes (electricity, heat and transport) for the five scenarios are presented in Appendix E. The average electricity mix for the reference scenario is based on [49]. For the four scenarios the average electricity mixes were created in accordance with the scenarios descriptions [20] and using average electricity mixes for similar scenarios in Björklund [50]. Electricity generated from waste was excluded in these background data mixes since it is a part of the foreground system.
The average heat mix for the reference scenario is based on the forecast made by Swedish District Heating Association [51]. The average heat mixes for the remaining scenarios were created in accordance with the scenarios descriptions [20] and double checked for consistency with the electricity scenarios.
The average mixes for fuels used in trucks, buses and cars, were generated based on the scenario descriptions [20], average fuel mixes for the scenarios from Björklund [50] consistent with the scenarios in the current project and taking into account the forecast by Swedish Energy Agency [49].
When selecting the avoided material this was done using average data. For materials, the assumed avoided production was the same in all scenarios, using datasets from Ecoinvent. Datasets were selected to mirror as closely as possible the output from each recycling processes as described in the original datasets of recycling. The datasets are further described in Appendix C.

3. Results

3.1. Assessment of Scenarios

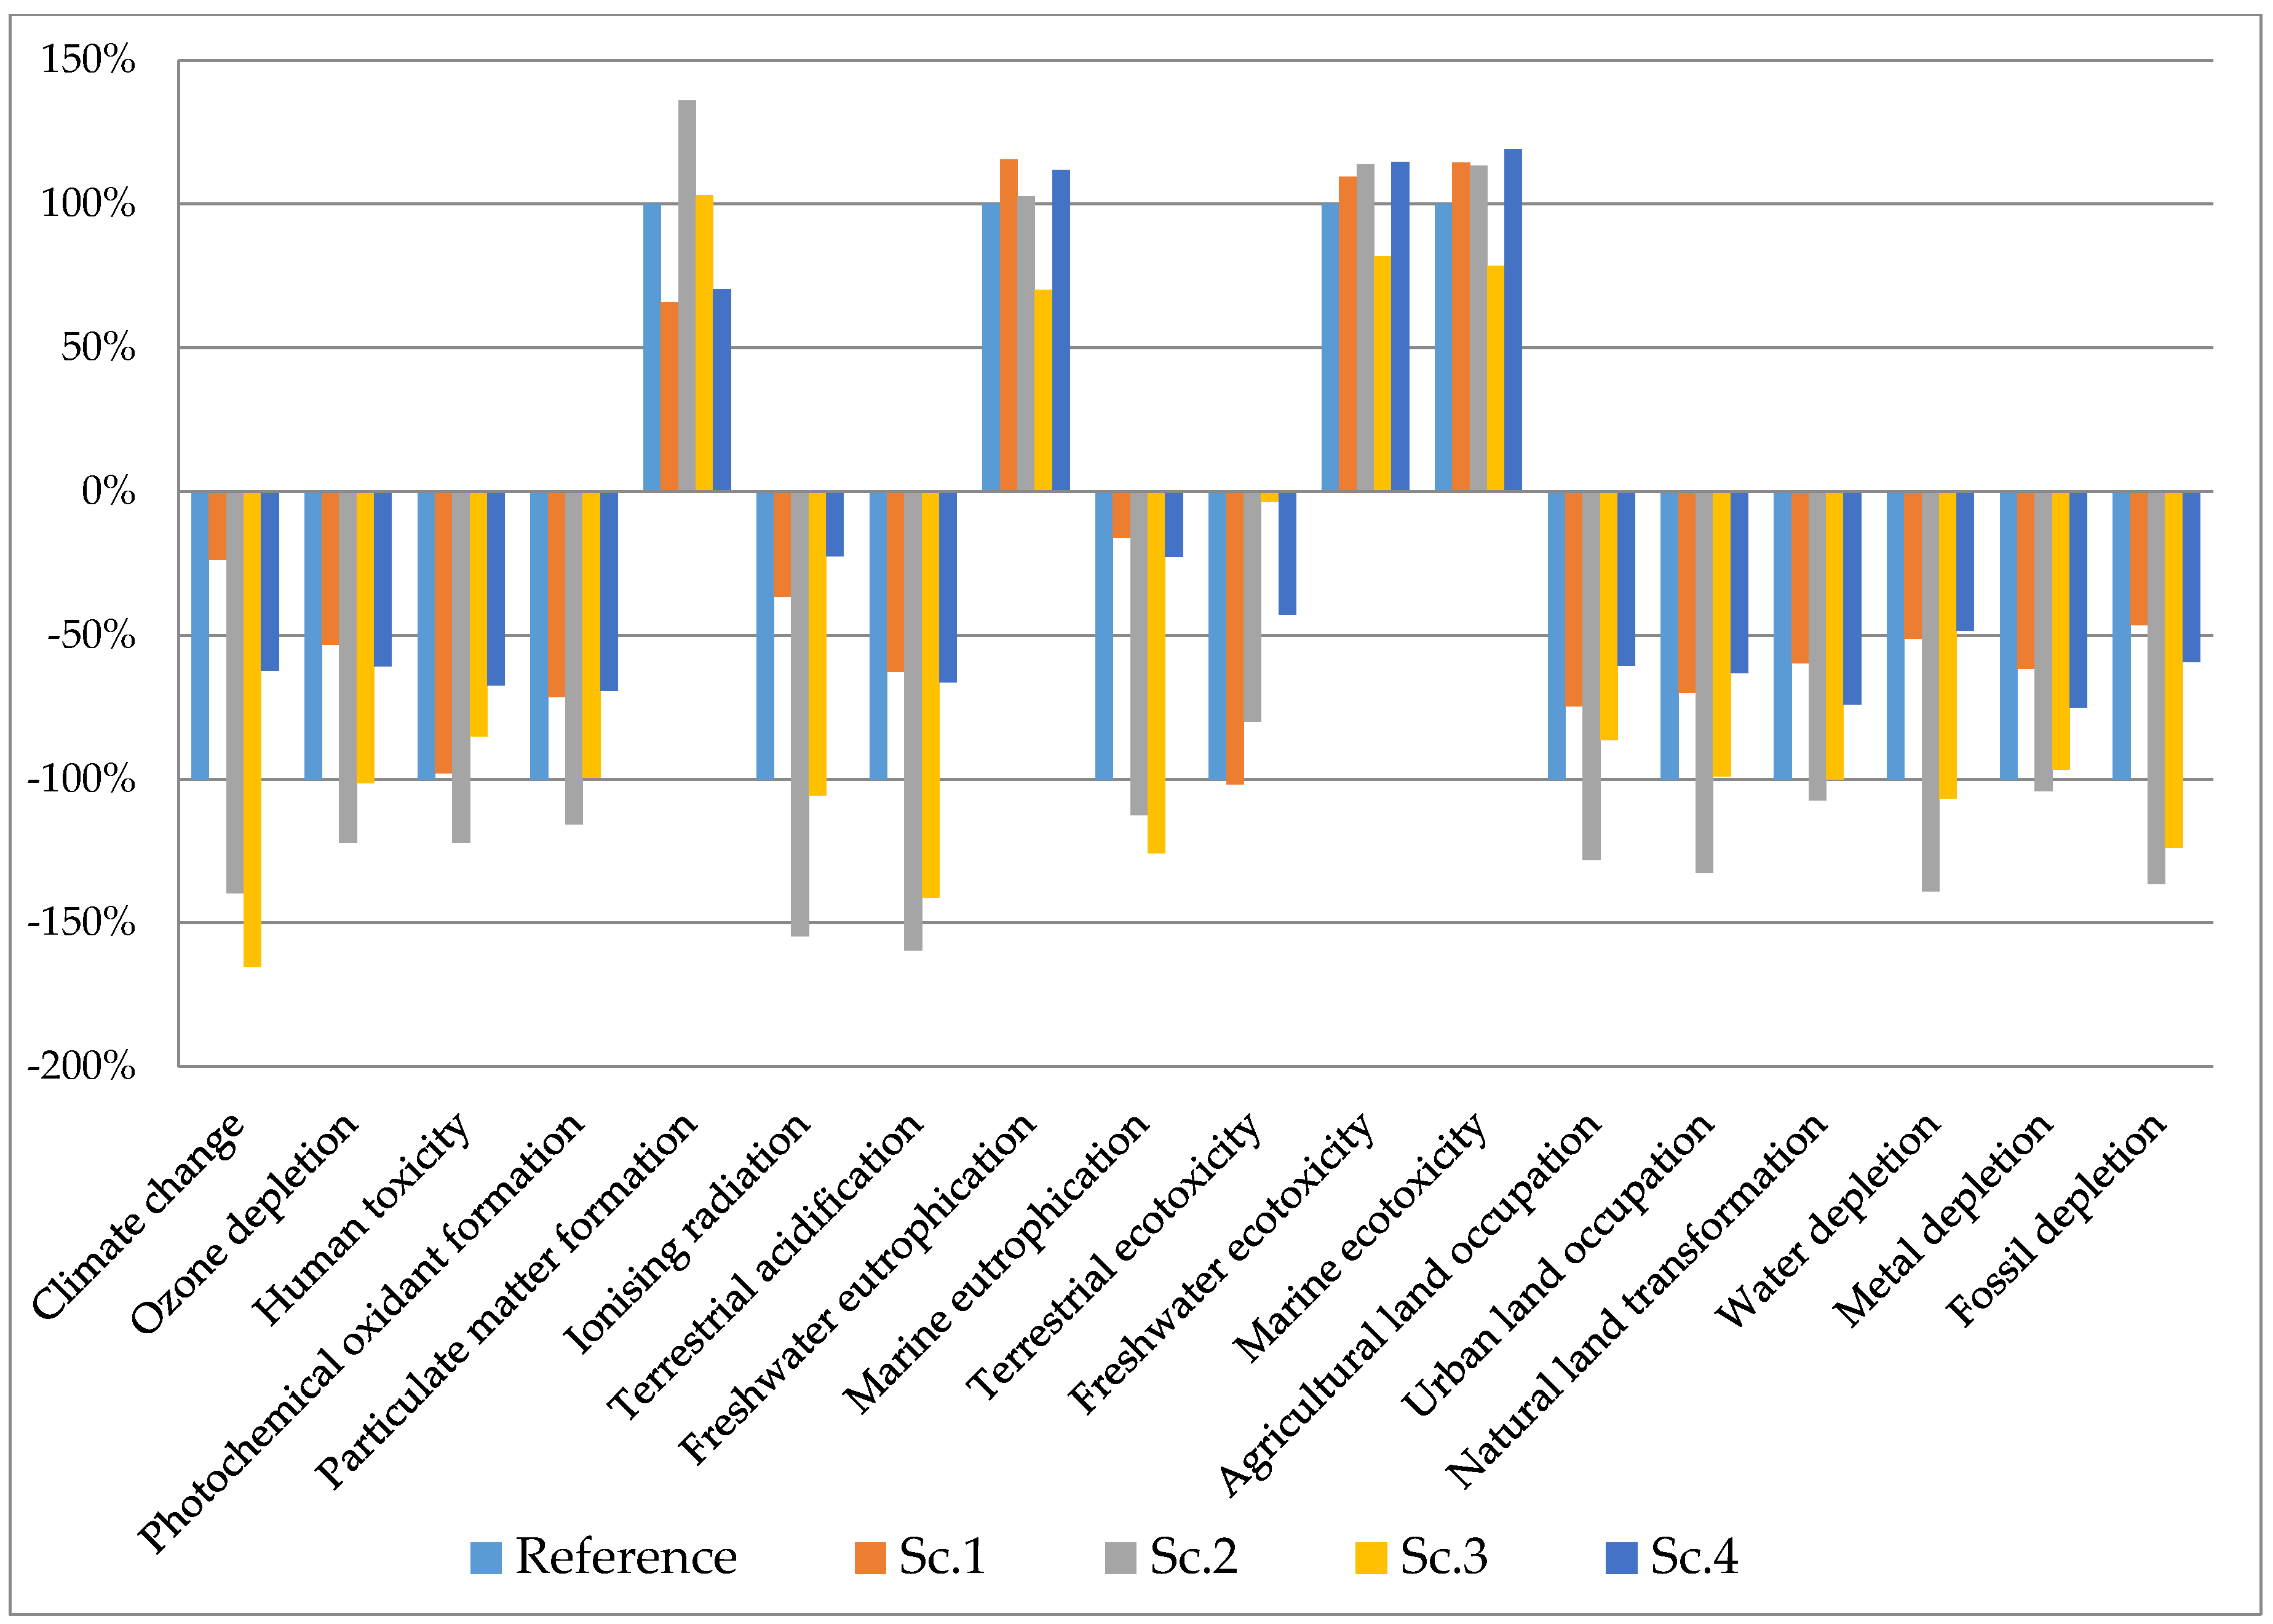
3.1.1. Potential Environmental Impacts

The potential environmental impacts from the Swedish waste management system in 2030 are presented in Figure 2 and Figure 3, and Appendix F, using average data for electricity and heat generation.
The environmental impact from the whole waste management system was analyzed in 18 impact categories using the ReCiPe Midpoint (H) method. The overall picture is that the waste treatment system has mainly net positive environmental impact (represented as negative bars in Figure 2). This means that impacts from waste treatment processes and waste transportation are often compensated by the benefits of the recovered electricity, heat, fuels, and recycled materials. Since the amounts of waste are different in the different scenarios, the benefits from the waste management vary. For example Scenario 2 has the largest amounts of waste, and therefore also large benefits from the waste management. This should however not be seen as an argument for increasing the amount of waste, since an increase of waste would be accompanied by increased environmental impacts from the production and consumption phases of the life cycle.
It is interesting to note that the difference between the scenarios can be quite large. For example, there is almost a factor 10 between Scenarios 1 and 3 for the potential climate change impact. This indicates that the variation in environmental impact for the future waste management can be quite large. For other impact categories, e.g., freshwater ecotoxicity, the difference between the different scenarios is lower. When analyzing the results it is important to remember that there can be significant uncertainties in the data and also data gaps. Uncertainty in LCA models derives from various sources, e.g., [28]. The large and inherent uncertainty of the future is in this study handled by analysing alternative scenarios. The results in Figure 2 can therefore be seen as results of a sensitivity analysis illustrating this uncertainty. Care was taken in the interpretation step to identify influence of uncertain model parameters and checking results for consistency. In general, data for climate change impact are the most robust since inventory data are fairly complete and there is a general agreement on the characterization method [52]. For abiotic resources, there are often fairly complete inventory data, but no consensus on the characterization method (e.g., [53,54,55]). Data for human and ecotoxicological impacts are more uncertain due to lack of knowledge about the use, emissions and impacts of the large amounts of chemical compounds used by society [52].
The main contributors to the climate change potential in the reference scenario are emissions of CO2 from the incineration of waste, mainly from combustion of various types of plastics. Another source for greenhouse gas (GHG) emissions is waste transportation from the point of collection to the treatment facilities. These impacts are however compensated by the benefits of recycling, mainly of steel, aluminum and newsprint.
In case of human toxicity the benefits of the waste treatment come from the recycling of steel, copper and aluminum, which means that the virgin production and toxic emissions resulting from extraction of those metals is avoided. Waste incineration in CHP and HOB (heat only boiler) in turn substitutes electricity produced from nuclear sources and heat produced from wood respectively, which contributes positively to the Human toxicity impacts. On the other hand steel recycling processes gives rise to some human toxic emissions.
A major contribution to photochemical oxidant formation comes from diesel combustion in the trucks used for waste collection. On the other hand the positive impact from the waste treatment is the avoidance of steel and polyethylene production due to recycling and avoidance of electricity and heat production due to incineration.
Particulate matter formation is one of the few categories in which the waste treatment system has negative environmental impacts. The reasons for this are the emissions from the incineration of food, plastic and electronic waste in CHP in combination with no or minor benefits of avoided burden.
The positive impacts from the system in terms of ionizing radiation formation come from the avoided electricity generation from nuclear sources.
For the terrestrial acidification the avoided production of steel, polyethylene and heat gives the main contribution to the positive effect.
For the freshwater eutrophication—another impact category negatively affected by the waste treatment system—the leachate from landfill disposal of incineration residues and non-recyclable slag appears to be the major problem (long-term emissions).
For the marine eutrophication the benefits of recycling of cardboard, corrugated board and steel together with avoided electricity and heat generation give the positive effect. Although there are some negative impacts from the landfill leachate and use of RME fuel in the collection trucks (due to rape seed cultivation).
For the terrestrial ecotoxicity the main benefit comes from incineration and the resulting avoided heat production from wood-based fuels. Although the use of RME and ethanol fuel in the collection trucks gives a negative impact in this category due to impacts from rape seed production.
Freshwater and marine ecotoxicity are affected negatively by landfill disposal of non-recyclable slag (due to leachate) as well as use of ethanol in the collection trucks (due to emissions associated with electricity used for ethanol production). On the other hand there are positive impacts from the avoided steel and corrugated board production due to recycling, from avoided electricity and heat production due to incineration.
Steel recycling makes the major contribution to the avoidance of metal depletion. Also the avoided electricity and heat production have a positive effect in this impact category due to avoided production of electricity from nuclear sources as well as avoided infrastructure.
Fossil depletion is positively affected by the recycling (mainly of steel and plastic), which gives a possibility to avoid the energy consuming manufacture of the virgin materials. Avoided heat generation due to incineration also gives a positive impact although using diesel in the collection trucks contributes to the fossil depletion.
As noted above, the amounts of waste in the different scenarios are different. The economically optimal waste treatment for a specific waste fraction is, however, the same in all scenarios regardless of the amount. The difference in the results for the environmental impacts is therefore caused by the difference in waste amounts, electricity, heat and fuel mixes in the corresponding scenario.
The amount of waste in Scenario 1 is 28% lower than in reference scenario (Table 1), therefore the benefits in absolute terms of the waste treatment such as energy recovery from the incineration or avoidance of primary material production due to recycling is lower than in the reference scenario. Moreover, the higher use of fossil-free electricity and heat mixes in this scenario leads to the smaller benefit of waste incineration, since only the renewable and nuclear energy sources are substituted by the electricity and heat produced. This is in line with the general result that waste should be used to generate products that can substitute as environmentally polluting products as possible. In the more sustainable scenarios, the benefits from the waste management are decreased further.
In Scenario 2 on the other hand the amount of waste is higher compared to the reference scenario and the energy mixes are more polluting with the presence of coal and oil. The combination of these two factors leads to the increase of the benefits from the waste treatment, such as incineration and recycling, and makes Scenario 2 look as the scenario with the lowest environmental impacts.
Scenario 3 is similar to Scenario 2, but the waste amounts stay at the same level as in reference scenario and therefore the benefits of the waste treatment are generally somewhat lower than for scenario 2. An exception is the climate change potential, where Scenario 3 gives more benefits than Scenario 2. The reason for that is that electricity and especially heat mixes in Scenario 3 contain more fossil fuels than those in Scenario 2, thus the benefit of the energy generation in the result of incineration is higher in this case.
Scenario 4 is similar to Scenario 1, but with slightly higher waste amounts and small differences in the energy mix.

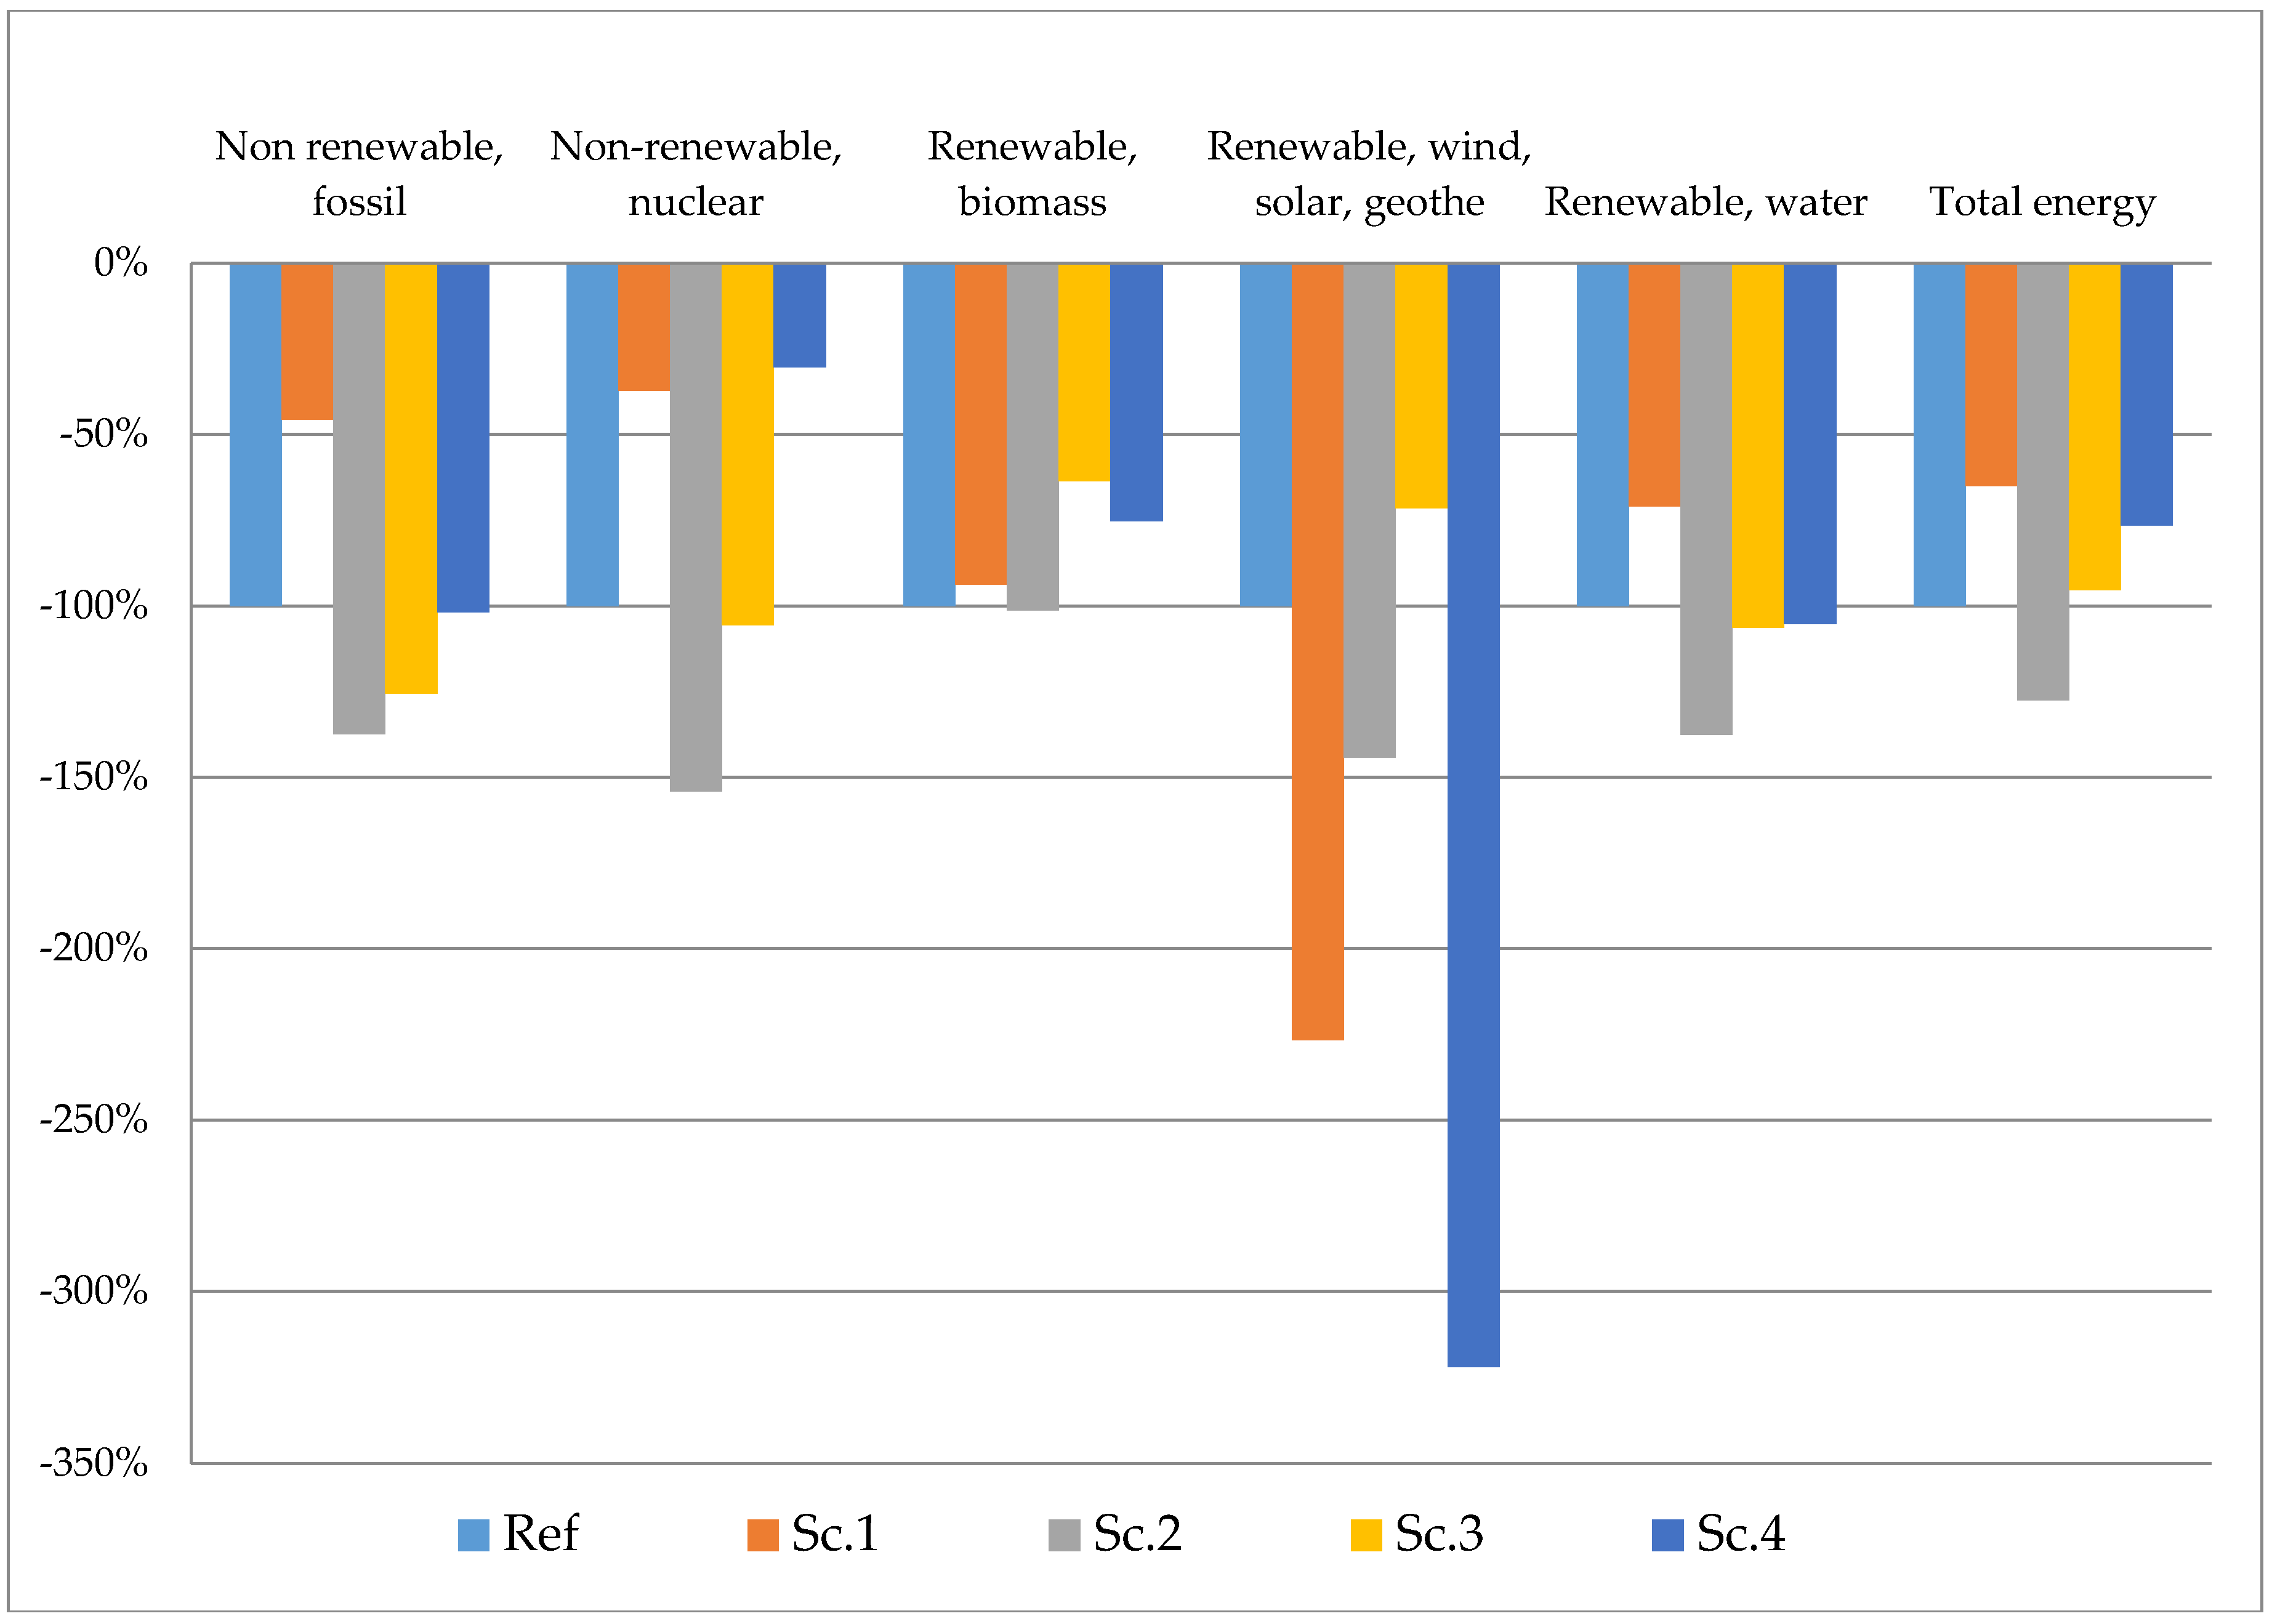
3.1.2. Cumulative Energy Demand

In addition to ReCiPe method Cumulative Energy Demand method was used to explore the effect on the energy use. Figure 3 presents results for Cumulative Energy Demand method including also total energy demand. The results in Figure 3 are negative, which means that the waste management system saves energy by producing products (energy, materials etc.) that can replace other products saving energy.
The amount of waste is the lowest in Scenario 1 (closely followed by Scenario 4); therefore the benefits of avoided production are for most energy types lower in Scenario 1 than in other scenarios. On the other hand the amount of electricity produced from the nuclear sources is the lowest in Scenario 4 (closely followed by Scenario 1); therefore the benefit of avoiding that is also the lowest.

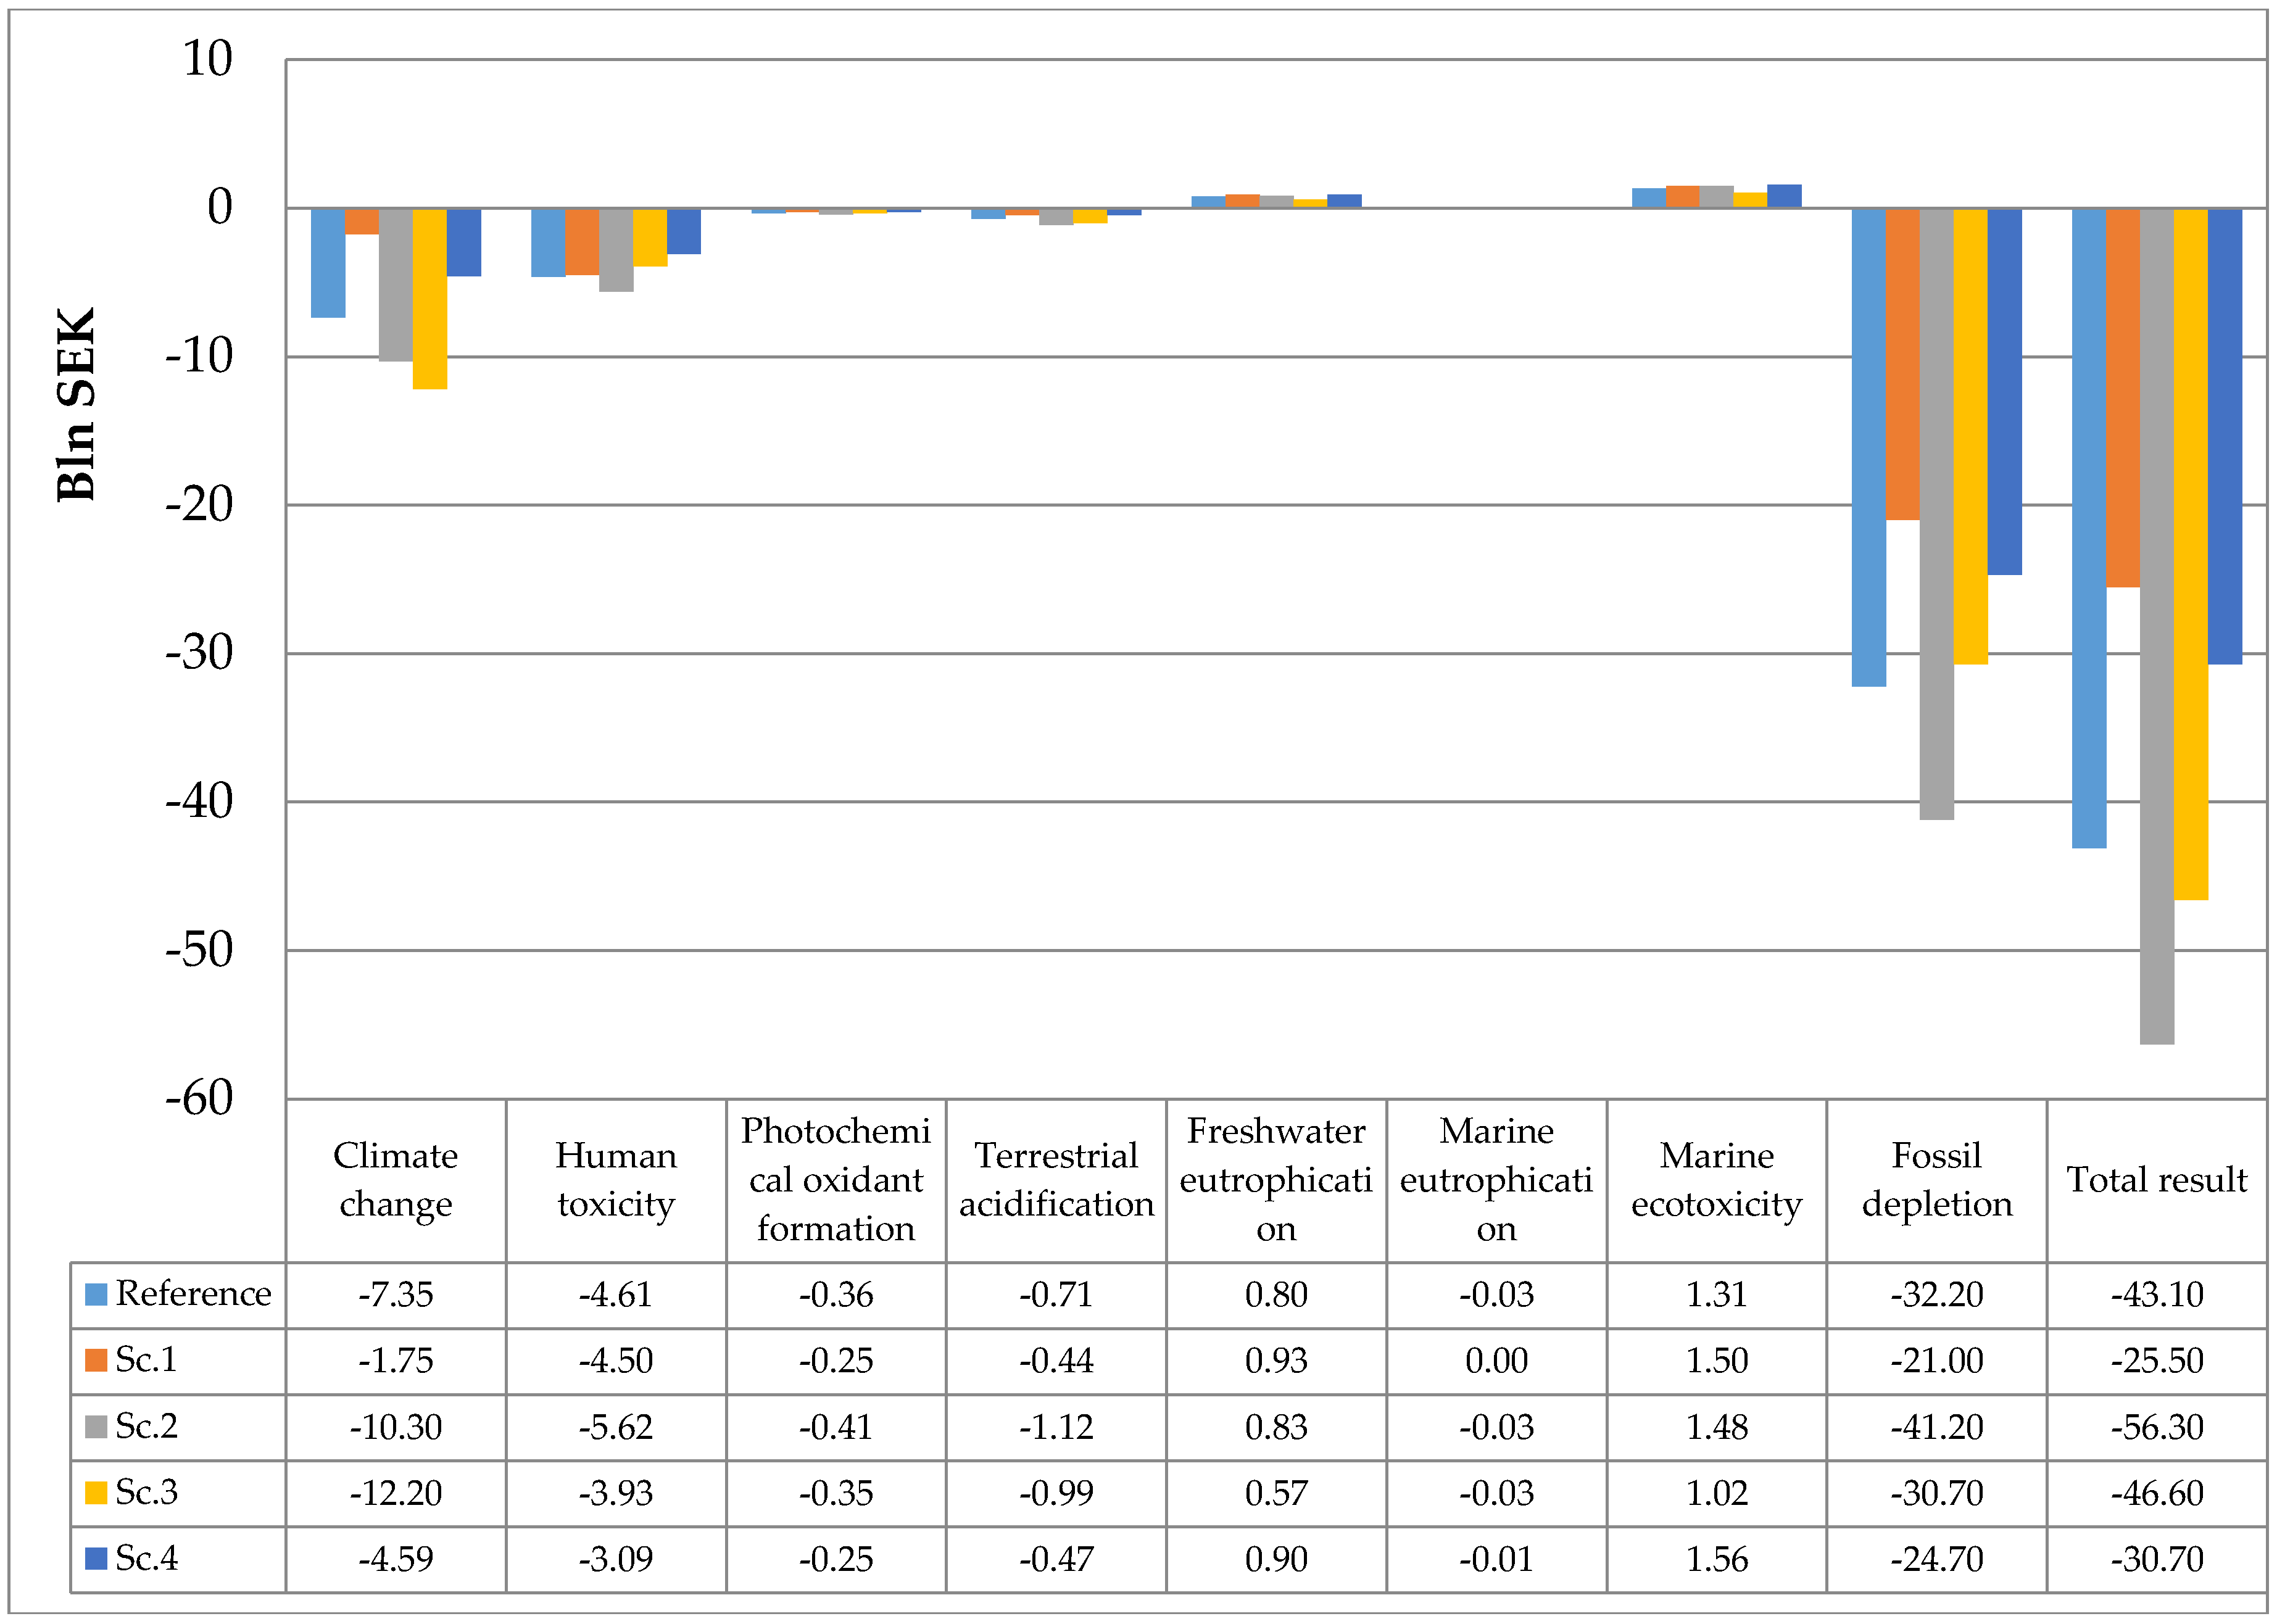
3.1.3. Monetary Assessment

In order to identify the potentially most important impact categories, the Ecovalue weighting method [33,34] was used. The results are presented in Figure 4 indicating that the most important impact categories for the waste management system are climate change, human toxicity and resource use. It should however be noted that the weighting method does not include all impact categories, so some of the omitted ones could also be potentially important.

3.2. Assessment of Policy Instruments

The assessment of waste policy instruments was done by modelling their consequences in the context of each scenario. Hence, each scenario without introducing a policy instrument represents its so-called “no-action” alternative. The potential consequences of policy instruments are then compared to the no-action alternatives, to determine if they would lead to overall improvement or not in the different scenarios.
In the project, in total 13 waste policy instruments were evaluated [26]. Eight of them could be evaluated in a quantitative analysis; the others could only be evaluated qualitatively because of lack of information or unsuitable assessment tools. Results for four of them are presented in this paper (Weight based waste fee, including waste in the system of green certificates, Climate waste incineration tax, and Resource tax). The others have been presented elsewhere (A differentiated VAT in [19]) or were assessed with other tools (Compulsory recycling of recyclable materials, Weight-based incineration tax and Advertisements on request only [26]). Results for the policy instrument “Weight based waste fee (alt. 1)”, in which it is assumed that the introduction of the policy instrument would lead to the prevention of waste generation, is presented in more detail below. This is because it is an interesting example including also waste prevention. Results for the other policy instruments are commented on below and presented in the Supplementary material S3.
Based on literature data (e.g., [56]) it was estimated that a weight based waste fee could lead to prevention of 900 ktonnes of waste in the reference scenario [26]. Not only environmental impacts from the waste treatment system, but also the benefits of avoided production due to waste prevention are taken into account. The relative results in comparison to “no-action” alternative in the reference scenario are shown in Figure 5.
In Figure 5, the total impact from the policy instrument is presented as well as the separate results for benefits from prevention of waste and the impacts from the waste treatment system including the credits from products, materials, and energy carriers produced in the waste treatment. Generally, the environmental benefits from the waste treatment decrease due to the decreased waste amounts. The exception is climate change potential, where the benefits come from the avoided production of steel, aluminum and corrugated board, which do not change much in comparison with the “no action” alternative, but the negative impacts, such as those from transportation, decrease due to the general decrease of the waste amounts.
When considering the benefits of the avoided production the significance of the waste prevented becomes visible. The impact is quite visible in most of the impact categories, but especially for climate change potential, Terrestrial acidification, Marine eutrophication and Water depletion. It is food and textile that contribute the most.
The relative results of the Cumulative energy demand assessment for the Weight based waste fee (alt. 1) in comparison to the “no action” alternative are presented in the Figure 6. Both impacts from the waste treatment system and benefits of the avoided production are taken into account.
The same pattern as for other environmental impacts is observed—the benefits of the waste treatment are slightly decreased due to the decreased waste amount, but the total impact of the policy instrument introduction gives a rise to the environmental benefit due to the avoided production.
The results for the other scenarios were fairly similar and are presented in the Supplementary Materials S3.
Assessments using SWEA was made also for the case where the weight based waste fee is not assumed to lead to prevention of waste but instead increased source separation, home composting and material recycling. Also in this case the weight based waste fee would lead to environmental benefits. The results are presented in the Supplementary Materials S3. These results suggest that an introduction of a weight based waste fee could lead to environmental benefits especially if it is implemented together with information campaigns and developed collections systems [26]. This is also supported by published case studies [57].
Other policy instruments were also evaluated using SWEA. A differentiated VAT where the tax was decreased on some services is expected to lead to changed consumer behavior. Results from SWEA were presented in Ljunggren Söderman et al. [19]. Including waste in the existing system of green certificates for electricity production and a version of a climate incineration tax was also assessed and results are presented in the Supplementary Materials S3. These versions of the policy instruments had limited effects mainly because they were not strong enough to affect the cost-effective mix of treatment methods. This is also the case for the resource tax that was analyzed (see Supplementary Materials S3 for results). Other version of a resource tax can however have larger effects (e.g., [3]). Also the way the tax revenues are used can have an effect on the overall results (e.g., [58]). Besides the environmental assessment, other aspects were also included on a comprehensive evaluation summarized in Finnveden et al. [26].
The impact of the studied policy instruments were in most cases limited. This is partly due to the suggested design of the instruments where for example tax levels were not large enough to change cost-efficient waste treatment. In order to reach more transformational changes, larger economic incentives may be needed [3], alternatively, regulations that change waste management systems. An example could be compulsory recycling of recyclable materials [26]. In the choice of policy instruments public acceptability must however also be considered [59]. A way forward may sometimes be to introduce a tax on a fairly low level in order to reach public acceptability and then later have the opportunity of increasing it.
In this paper, policy instruments are studied one by one. In practice combinations of policy instruments are often useful and necessary. For example, information on its own is rarely effective, but it may be necessary for supporting other policy instrument [26]. Also, since different policy instruments focus on different parts of the waste hierarchy, combinations may be necessary. It can also be noted that many policy instruments focus on the waste treatment part of the system. In order to move towards a more circular economy in line with policy initiatives (e.g., [2]) changes are necessary in the design and use of products and services. In order to develop a more sustainable waste management system, there is therefore also a need to develop and implement policy instruments upstream in relation to the waste management system. This concern for example the design of products and also the materials and chemical products used in the products.
The study looked at the Swedish waste management system and changes in waste trade were not considered. The trade of waste may change with time and also as a result of policy instruments. European waste policy is likely to make waste management and treatment process more similar in Europe. Since Swedish waste trade is mainly within Europe (at least for bulky waste and fractions containing organic material) the environmental impacts of changed waste trade in the future may be limited. The amounts and types of waste in Sweden are different in the different scenarios, because of changes in production and consumption patterns. This has a large impact on the potential environmental impacts of the future Swedish waste management system. The potential environmental impacts of the policy instruments are however similar in all scenarios, suggesting the results for the policy instruments are robust in relation to future developments.

4. Conclusions

One of the aims of this study was to develop a comprehensive LCA-model that is unique in including most waste streams in a country and also allow for including waste prevention measures. We have here shown that it is possible to build such a model. The model is useful when evaluating future waste scenarios and impacts of policy instruments that influence several sectors of society and several types of waste. The model is large and complex and there are uncertainties due to, e.g., data on environmental performances of processes and data gaps but the model as a whole captures important aspects and potential consequences of different policy instruments.
For all scenarios, the Swedish waste management system will continue to contribute to the production of materials, energy carriers and other products replacing virgin production through its recycling and recovery of materials and energy. This leads to environmental benefits that are smaller in the more sustainable scenarios, where the surrounding energy and transportation systems are less environmentally harmful and less waste is produced. The potentially most important impact categories are climate change, human toxicity and resource use. For climate change the process contributing most to environmental impacts is incineration of plastics. This indicates that in order to reach a climate neutral society, a significant decrease of emissions from incineration of plastics would be useful, a conclusion also supported in, e.g., [60]. The contribution to climate change is however reduced by several processes including recycling of aluminum, steel and newsprint. In the case of human toxicity, recycling of steel, copper and aluminum also leads to reduced impacts by replacing virgin production, even if the steel recycling process has some impact itself. The saving of energy comes from both recycling of materials, which leads to avoided material production, and incineration which leads to avoided electricity and heat production.
The effect of the studied policy instruments are in most cases limited, suggesting that stronger policy instruments as well as combinations are necessary to reach policy goals as set out in for example the EU action plan for the circular economy [2].

Supplementary Materials

The following are available online at www.mdpi.com/1996-1073/10/2/247/s1, Excel Table S1: waste composition, Excel Table S2: waste amounts is different scenarios per waste flow and per waste fraction; PDF Document S3: results of environmental assessment.

Acknowledgments

This paper reports results from the project TOSUWAMA (Towards Sustainable Waste Management) which was funded by the Swedish Environmental Agency. Thanks also to Tomas Ekvall and other participants in the project.

Author Contributions

The study was conceived and designed by the team led by A.B., O.E. and M.L.S. developed the SWEA model structure. All authors provided data, Y.A. and A.B. performed calculations. Y.A. analyzed the data together with all authors. Y.A. and G.F. drafted the paper and all authors contributed with text and comments.

Conflicts of Interest

The authors declare no conflict of interest.

Appendix A. Overview of a Segment of the SWEA Model Structure

Figure A1. Hierarchical scheme of the SWEA model structure.
Energies 10 00247 g007

Appendix B. Overview of Material Fractions and Processes

The table presents the material flows of different waste categories. “X” marks a specific collection alternative for a waste category; 1, 2, 3—indicate the order in which these treatment options are connected in the model. The types of treatment, their order and the amount of waste sent to each are defined by NatWaste optimization model.
Example: Mixed waste (12.3) contains a fraction “mixed plastic”. Mixed plastic is collected at premises (mixed waste at P), source separated in bags at premises (SS at P, bag) and source separated at recycling center (industrial) (SS at RC (I)). When the mixed plastic is collected part of it is sent to sorting facility and part-directly to incineration facilities (HOB and CHP) (indicated by “1”). After sorting, different flows are sent to incineration facilities (HOB, CHP and CKN) or to recycling (REC) (indicated by “2”). The rejects from recycling are sent to incineration (CHP and HOB) (indicated by “3”).
Table A1. Overview of material fractions and processes.
Waste Categories and Material FractionsCollection SystemTreatment Technologies
Mixed Waste at P (H, I)SS at P, Bags (H, I)SS at P, Container (H, I)SS Nearby P (H)SS Nearby P (I)SS at RS (H)SS at RC (H)SS at RC (I)Sorting FacilityHOBCHPBIOCKNRECWCPRCPADGLFL
1. Other chemical wastes and residues x x 11 1 1
1.1. Industrial sludge
chemical sludge and bio sludge x 11 111 2
other industrial effluent sludge x 11 1 1
1.2. Public sewage sludge x 11 1,21 2
2. Metallic waste (mixed)
Aluminum xxx 1
Ferrous metal xxx 1
Stainless steel xxx 1
Other metal xxx 1
3. Glass waste
glass container, clear xxx 1 1,2
glass container, colored xxx 1 1,2
4. Paper and cardboard waste
4.1. Mixed paper 1,21,2
paper and cardboard containers xxx 1
corrugated cardboard xxx 1
Newsprint, journals, and catalogues xxx 1
office paper xxx 1
4.2. Fibre reject x 111 1
5. Rubber waste xx 1,21,2 1,21
6. Plastic waste
6.1. Mixed plastic 1,21,2 1,2
PE xxx 1
PP xxx 1
PET xxx 1
PS xxx 1
PVC xxx 1
PUR xxx 1
PC xxx 1
6.2. Agricultural plastic
agricultural film x 1,21,2 1,21
cans (PE) x 1,21,2 1,21
other agricultural plastic x 11 1
7. Wood waste x 22221
8. Textile waste x 11
9. Discarded equipment x 1
10. Animal and vegetal waste
manure x 1 1
Animal waste from food preparation, non-hygienized x 11 11
Animal waste of food preparation, hygienized x 11 11
vegetal waste of food processing x 11 11
park and yard waste x (Hh)x (Hh) x xx 11 1
food waste x (Hh)x (Hh) x 11 11
11. Household and similar waste
11.1. Collected in bags and bins
food wastexxx 11,21,2 22
park and yard wastexxx 11,21,2 22
newsprintxxx 11,21,2
corrugated cardboardxxx 11,21,2
paper and cardboard containersxxx 11,21,2
PExxx 11,21,2
PSxxx 11,21,2
clear glassxxx 11,21,2
colored glassxxx 11,21,2
mixed metalxxx 11,21,2
landfill residuexxx 11,21,2
hazardous wastexxx 11,21,2
WEEExxx 11,21,2
wood wastexxx 11,21,2
textilesxxx 11,21,2
other combustible wastexxx 11,21,2
11.2. Bulky
11.2.1. Combustible
paper and cardboard containersx xx12,32,3 2,32
mixed plasticx xx12,32,3 2,32
woodx xx12,32,332,32
11.2.2. Landfill residue
Plasterx xx1 2 2,3
concrete, stone, bricksx xx1 2 2,3
12. Mixed and undifferentiated materials
12.1. Combustible
paper and cardboard containersx x11,2,31,2,3 1, 22
mixed plasticx x11,2,31,2,3 1, 22
woodx x11,2,31,2,331, 2,32
12.2.Landfill residue
Plasterx x1 2 1,2,3
concrete, stone, bricksx x1 2 1,2,3
12.3. Mixed waste
paper and cardboard containersxxx x11,2,31,2,3 22
mixed plasticxx x11,2,31,2,3 22
woodxx x11,2,31,2,332,32
mixed metalxx x111 2
plasterxx x111 2 2,3
concrete, stone, bricksxx x111 2 2,3
13. Sorting residues
fiber recycling reject x 111 1
sorting ashes x 1
14. Mineral wastes
plaster x 1 1,2
concrete, stone, bricks x 1 1,2
asphalt x 1 1,2
15. Combustion wastes and wastes from thermal processes
steel slag, recyclable x 1 1
steel slag, non-recyclable x 1 1
wood fly ashes x 1 1
other ashes x 1
bottom ash, MWC x 1 1
List of abbreviations:
  • H—household
  • I—industrial
  • P—premises (residential houses, offices, industrial facilities)
  • SS—source separated
  • RS—recycling station (packaging and newspapers)
  • RC—recycling center (bulky, garden, electronic, hazardous waste)
  • HOB—incineration at heat-only-boiler plant
  • CHP—incineration at combined heat and power plant
  • BIO—incineration in bio boiler
  • CKN—incineration in cement kiln
  • REC—recycling
  • WCP—windrow composting
  • RCP—reactor composting
  • ADG—anaerobic digestion
  • LFL—landfill

Appendix C. Process Data

Process data for the waste treatment processes of incineration, composting, anaerobic digestion and landfilling were generated using ORWARE model [27]. Some of the data used were default data for ORWARE model [61]. Other data or adjustments to default data are described below. The complete datasets are presented in CPM database [40,41,42,43,44,45].
Process data for recycling was created through modification of processes from other databases. The details are presented below.

Appendix C.1. Process Data for Incineration

Different models/data have been applied depending on type of waste being treated. There are three data sets for incineration:
  • Incineration in a large scale plant for municipal solid waste—combined heat and power plant (CHP), and heat only boiler plant (HOB)
  • Incineration in cement kiln (CKN)
  • Incineration of sludge in a fluidized bed

Appendix C.1.1. Incineration, CHP and HOB

Most data are default data for the ORWARE model [60]. However, some key parameters have been changed in order to reflect best available technology (BAT). These data have been taken from the incineration plant in Gothenburg, Sweden [39].
There are no differences in emissions data for CHP compared to HOB. The only difference is the overall efficiency and the relation between electricity and heat. The degree of efficiencies and the relation between heat and electricity for the different incineration models have been defined based on Avfall Sverige [62].

Appendix C.1.2. Incineration, CKN

Most data are default data for the ORWARE model [60]. However, some key parameters have been changed in order to reflect a cement kiln. These data have been taken from Cementas plant in Visby, Sweden [63].

Appendix C.1.3. Incineration of Sludge

Most data are default data for the ORWARE model [61]. However, some key parameters have been changed in order to reflect sludge combustion. These data have been taken from a research plant at Chalmers in Gothenburg, Sweden [27].

Appendix C.2. Process Data for Landfilling

Most data are default data for the ORWARE model [61]. However, some key parameters have been changed in order to reflect a landfill with low organic content. The adjustments are:
  • For methane and VOC, which is not collected and combusted, 25% is oxidized (default 15%). Less methane generation, and better cover of landfills makes the oxidation in the cover more effective.
  • The mobility of several metals is higher since the anaerobic phase is less developed. Leaching of heavy metals has increased with a factor 10.
  • For landfill of digested sewage sludge, the sludge landfill sub model has been used.

Appendix C.3. Process Data for Composting

Most data are default data for the ORWARE model [61,64].
The compost model consists of following sub-models:
  • Reactor (CPR)
  • Open windrow (CPW)
Data for CPR are taken from Carlström [65] and adjusted to Renovas composting facility Marieholm in Gothenburg [39].
Some data for the open windrow compost have been adjusted to Ragn Sells composting facility Rödjan in Gothenburg [39].
For use of compost, most data are default data for the ORWARE model [64]. However, the data file used comes from Baky and Eriksson [66].

Appendix C.4. Process Data for Anaerobic Digestion

Basic data on degradation rates are default data for the ORWARE model [67]. However some parameters have been adjusted to the planned digestion plant in Gothenburg [39].
Most data for spreading the digestate are default data for the ORWARE model [64]. However, the data file used comes from Baky and Eriksson [66].

Appendix C.5. Process Data for Recycling

Process data for recycling were either collected from literature and personal communication with industry representatives or were modified data from other databases. The avoided burdens were assumed based on the data from modified processes or similar processes existing in the databases representing production of secondary material from scrap.
Table A2. Process data for recycling.
Material RecycledName of the Process in Original DatasetReferencesComment on Modifications Made
AluminumAluminum, secondary, from old scrap, at plant/kg/RER U[32]Added avoided virgin production (97% substitution), but removed aluminum scrap input. Direct use of electricity has been replaced by the Swedish electricity used in different scenarios.
CardboardCorrugated board, recycling fiber, single wall, at plant/RER U[68]Added avoided virgin production (90% substitution), but removed paper waste input in Wellenstoff and Testliner production. Direct use of electricity has been replaced by the Swedish electricity used in different scenarios.
Corrugated boardCorrugated board, recycling fiber, single wall, at plant/RER U[68]Added avoided virgin production (90% substitution), but removed paper waste input in Wellenstoff and Testliner production. Direct use of electricity has been replaced by the Swedish electricity used in different scenarios.
Ferrous metalsSteel, electric, un- and low-alloyed, at plant/RER U[32]Added avoided virgin production (90% substitution), removed steel scrap input. Direct use of electricity has been replaced by the Swedish electricity used in different scenarios.
Glass (clear and color) [69,70]Dataset created based on collected data. Avoided virgin production 100%.
Inert material mix [71]Due to the lack of data it was decided to approximate it to the landfilling process. The process is a copy of a LFL (InMix) but with adding avoided gravel (100% substitution).
MetalMix of Aluminum, Ferrous metals, Stainless metals, and Other metals[72]Dataset created based on collected data
NewsprintPaper, recycling, with deinking/RER U[68]Added avoided production (85% substitution), but removed waste paper input. Direct use of electricity has been replaced by the Swedish electricity used in different scenarios.
Office paperPaper, recycling, with deinking/RER U[68]Added avoided production (85% substitution), but removed waste paper input. Direct use of electricity has been replaced by the Swedish electricity used in different scenarios.
Other metalCopper, secondary, at refinery/RER U[32]Added avoided virgin production (76% substitution), but removed metal scrap input. Direct use of electricity has been replaced by the Swedish electricity used in different scenarios.
PC, PE, PET, PP, PS, PUR, PVC, PlasticsRigid plastics to fine sorting and recycling[73]Avoided virgin production with 77% substitution.
Plaster [74]Dataset created based on collected data. Avoided virgin production with 93% substitution.
Rubber [75]Dataset created based on collected data. Tires cutting and granulation (whole tires). Avoided virgin production with 100% substitution.
Stainless metalSteel, electric, chromium steel 18/8, at plant/RER U[32]Added avoided primary steel production (52% substitution), but removed metal scrap input. Direct use of electricity has been replaced by the Swedish electricity used in different scenarios.

Appendix D. Waste Composition

The composition of the waste fractions was modeled in ORWARE model [63].
The list of waste fractions modeled with comments and additional references are presented in the table below. The names of the waste fractions are presented as in the model. Complete data on waste fractions is presented in Supplementary Materials S1.
Table A3. Waste fractions.
Waste FractionComment on AssumptionsReferences
OtherAshes [76]
PESoft plastic packaging (6%)[36]
PSStyrofoam[36]
Metal mixedExcluding by-product (metal waste from metal industry)
Vegetal [77]
Food waste, household [36]
Park, low HHVFrom households[77]
AnimalNo difference between hygienized and non hygienized animal waste[77]
WoodExcluding by-products from sawmills and secondary wood waste from recycling[77]
NewsprintCollected separately from start[36,77]
GlassClearExcluding returnable bottles[77]
GlassColorExcluding returnable bottles.[77]
Textiles [77]
CorrBoardCollected as a separate fractions from start[36]
SewSludgeDrained sewage sludge, wet weight. Excluding sludge from drinking water purification and from households.[78]
Plaster [79]
SlagRecycDifferent types of waste from steel industry that can be recycled. Assumed to mainly consist of blast furnace slag.[76,80]
SlagNRecycDifferent types of waste from steel industry that can be recycled, other than blast furnace slag.[76,80]
Equip_h [79]
CardboardCollected separately from the start. Assumption: 100% fiber reject from pulp production.[36]
HA ChemicalModeled as green liquor slam[76]
IndSlOrgDrained sludge, wet weight, 50% chemical sludge, 50% bio sludge[76]
IndSlNOrgDrained sludge, wet weight.[76]
FibreRejCollected separately from start. Only from pulp and paper industry, TS 50%.[76,81]
PC [76]
Haz_hHazardous waste found in waste bags[76]
RecFibRejReturnable fiber reject[76]
WoodFlyAsh [76]

Appendix E. Energy Mixes Assumed for Scenarios

Table A4. Average electricity mixes for the reference scenario and four base scenarios (% from total) for the year 2030.
Electricity SourceReference ScenarioScenario 1Scenario 2Scenario 3Scenario 4
Nuclear power42.1%18.9%44.7%41.5%8.4%
Hydropower39.5%44.1%39.1%40.5%58.4%
Wind power3.9%6.9%2.9%2.0%10.0%
Solar power0.0%6.9%1.0%0.5%10.0%
CHP *, oil0.0%0.0%1.0%2.0%0.0%
CHP, natural gas3.8%0.0%2.1%2.2%0.0%
CHP, coal0.4%0.0%4.1%8.1%0.0%
CHP, biofuel4.6%23.3%5.1%3.0%13.0%
CHP, peat0.1%0.0%0.0%0.0%0.0%
CHP, blast furnace gas0.9%0.0%0.0%0.0%0.0%
Oil back pressure0.2%0.0%0.0%0.0%0.0%
Blast furnace back pressure0.4%0.0%0.0%0.0%0.0%
Biofuel back pressure3.6%0.0%0.0%0.0%0.0%
Gas back pressure0.5%0.0%0.0%0.0%0.0%
Total100.0%100.0%100.0%100.0%100.0%
*: CHP—Combined Heat and Power.
Table A5. Average heat mixes for the reference scenario and four base scenarios for the year 2030.
Fuel SupplyReference ScenarioScenario 1Scenario 2Scenario 3Scenario 4
Coal3.3%0.0%14.3%19.7%0.0%
Biofuels65.7%82.4%35.7%30.3%80.0%
Heavy fuel oils (Eo2-5)1.5%0.0%8.6%10.5%0.0%
Petroleum gas0.4%0.0%0.0%0.0%0.0%
Natural gas15.8%0.0%7.1%6.6%4.7%
Blast furnace gas2.7%2.4%5.7%3.9%2.4%
Electricity to electric boiler0.0%0.0%1.4%0.0%0.0%
Electricity to heat pump0.0%0.0%15.7%5.3%0.0%
Steam/hot water to heat pump10.6%9.4%0.0%10.5%7.1%
Excess heat0.0%5.9%11.4%13.2%5.9%
Total100.0%100.0%100.0%100.0%100.0%
Table A6. Average fuels mix for trucks for the different scenarios.
FuelReference Scenario, Scenarios 2 and 3Scenarios 1 and 4
Diesel90%79%
FAME *7%15%
Ethanol3%6%
*: Fatty Acids Methyl Esters.
Table A7. Average fuel mix for buses for the different scenarios.
FuelReference Scenario, Scenario 2 and 3Scenario 1 and 4
Diesel50%17%
Ethanol50%17%
Biodiesel0%66%
Table A8. Average fuel mix for cars for the different scenarios.
FuelReference Scenario, Scenario 2 and 3Scenario 1 and 4
Petrol60%10%
Ethanol10%30%
Electricity20%30%
Diesel10%30%
Marginal data for the different scenarios are presented in the Supplementary Materials S3.

Appendix F. Environmental Impact Assessment Results

Table A9. Environmental impact for the different scenarios.
Impact CategoryUnitReference ScenarioScenario 1Scenario 2Scenario 3Scenario 4
Climate changekg CO2 eq−2.58 × 10⁹−6.13 × 10⁸−3.60 × 10⁹−4.27 × 10⁹−1.61 × 10⁹
Ozone depletionkg CFC-11 eq−1.25 × 10³−6.62 × 10²−1.52 × 10³−1.26 × 10³−7.57 × 10²
Human toxicitykg 1.4-DB eq−1.64 × 10⁹−1.60 × 10⁹−2.00 × 10⁹−1.40 × 10⁹−1.10 × 10⁹
Photochemical oxidant formationkg NMVOC−2.22 × 10⁷−1.58 × 10⁷−2.57 × 10⁷−2.21 × 10⁷−1.54 × 10⁷
Particulate matter formationkg PM10 eq1.45 × 1089.57 × 1071.97 × 1081.49 × 1081.02 × 108
Ionizing radiationkg U235 eq−5.89 × 10⁹−2.16 × 10⁹−9.11 × 10⁹−6.22 × 10⁹−1.32 × 10⁹
Terrestrial acidificationkg SO2 eq−2.35 × 10⁷−1.47 × 10⁷−3.74 × 10⁷−3.31 × 10⁷−1.55 × 10⁷
Freshwater eutrophicationkg P eq3.74 × 1064.32 × 1063.84 × 1062.63 × 1064.18 × 106
Marine eutrophicationkg N eq−4.10 × 10⁵−6.61 × 10⁴−4.61 × 10⁵−5.15 × 10⁵−9.28 × 10⁴
Terrestrial ecotoxicitykg 1.4-DB eq−5.90 × 10⁶−6.01 × 10⁶−4.72 × 10⁶−2.01 × 10⁵−2.52 × 10⁶
Freshwater ecotoxicitykg 1.4-DB eq1.42 × 1081.56 × 1081.62 × 1081.16 × 1081.63 × 108
Marine ecotoxicitykg 1.4-DB eq1.09 × 1081.25 × 1081.23 × 1088.54 × 1071.30 × 108
Agricultural land occupationm2a−9.54 × 10⁹−7.12 × 10⁹−1.22 × 10¹⁰−8.25 × 10⁹−5.77 × 10⁹
Urban land occupationm2a−1.84 × 10⁸−1.29 × 10⁸−2.45 × 10⁸−1.82 × 10⁸−1.16 × 10⁸
Natural land transformationm2−3.60 × 10⁶−2.15 × 10⁶−3.87 × 10⁶−3.61 × 10⁶−2.66 × 10⁶
Water depletionm3−8.52 × 10⁷−4.35 × 10⁷−1.18 × 10⁸−9.09 × 10⁷−4.13 × 10⁷
Metal depletionkg Fe eq−7.64 × 10⁹−4.70 × 10⁹−7.9 × 10⁹−7.39 × 10⁹−5.74 × 10⁹
Fossil depletionkg oil eq−1.89 × 10⁹−8.74 × 10⁸−2.57 × 10⁹−2.34 × 10⁹−1.12 × 10⁹
Table A10. Energy use in the different scenarios.
Impact CategoryUnitReference ScenarioScenario 1Scenario 2Scenario 3Scenario 4
Nonrenewable: fossilMJ eq.−8.13 × 10¹⁰−3.71 × 10¹⁰−1.12 × 10¹¹−1.02 × 10¹¹−8.28 × 10¹⁰
Non-renewable: nuclearMJ eq.−6.25 × 10¹⁰−2.33 × 10¹⁰−9.63 × 10¹⁰−6.60 × 10¹⁰−1.90 × 10¹⁰
Renewable: biomassMJ eq.−1.02 × 10¹¹−9.61 × 10¹⁰−1.04 × 10¹¹−6.51 × 10¹⁰−7.71 × 10¹⁰
Renewable: wind, solar, geothermalMJ eq.−1.51 × 10⁹−3.42 × 10⁹−2.17 × 10⁹−1.08 × 10⁹−4.86 × 10⁹
Renewable: waterMJ eq.−2.07 × 10¹⁰−1.47 × 10¹⁰−2.85 × 10¹⁰−2.20× 10¹⁰−2.18 × 10¹⁰
Total energyMJ eq−2.68 × 10¹¹−1.75 × 10¹¹−3.43 × 10¹¹−2.56 × 10¹¹−2.06 × 10¹¹

References

  1. State Environment Policy Act (SEPA). Från Avfallshantering till Resurshushållning. Sveriges Avfallsplan 2012–2017; Naturvårdsverket: Stockholm, Sweden, 2012. (In Svenska)
  2. European Commission (EC). Closing the Loop—An EU Action Plan for the Circular Economy; Com/2015/0614 Final; European Commission: Brussels, Belgium, 2015. [Google Scholar]
  3. Ekvall, T.; Hirschnitz-Garbers, M.; Eboli, F.; Śniegocki, A. A systemic and systematic approach to the development of a policy mix for material resource efficiency. Sustainability 2016, 8, 373. [Google Scholar] [CrossRef]
  4. Finnveden, G.; Bisaillon, M.; Noring, M.; Stenmarck, Å.; Sundberg, J.; Sundqvist, J.-O.; Tyskeng, S. Developing and evaluating new policy instruments for sustainable waste management. Int. J. Environ. Sustain. Dev. 2012, 11, 19–31. [Google Scholar] [CrossRef]
  5. Watkins, E.; ten Brink, P.; Schweitzer, J.-P.; Rogissart, L.; Nesbit, M. Policy mixes to achieve absolute decoupling: An ex ante assessment. Sustainability 2016, 8, 528. [Google Scholar] [CrossRef]
  6. Münster, M.; Finnveden, G.; Wenzel, H. Future waste treatment and energy systems-examples of joint scenarios. Waste Manag. 2013, 33, 2457–2464. [Google Scholar] [CrossRef] [PubMed]
  7. Börjeson, L.; Höjer, M.; Dreborg, K.-H.; Ekvall, T.; Finnveden, G. Scenario types and techniques: Towards a user’s guide. Futures 2006, 38, 723–739. [Google Scholar] [CrossRef]
  8. Höjer, M.; Ahlroth, S.; Dreborg, K.-H.; Ekvall, T.; Finnveden, G.; Hjelm, O.; Hochschorner, E.; Nilsson, M.; Palm, V. Scenarios in selected tools for environmental systems analysis. J. Clean. Prod. 2008, 16, 1958–1970. [Google Scholar] [CrossRef]
  9. International Organisation for Standardization (ISO). ISO 14040 international standard. In Environmental Management—Life Cycle Assessment—Principles and Framework; International Organisation for Standardization: Geneva, Switzerland, 2006; Volume SFS-EN ISO 14040. [Google Scholar]
  10. Björklund, A.; Finnveden, G.; Roth, L. Application of LCA to waste management. In Solid Waste Technology and Management; Christensen, T.H., Ed.; Wiley: Chichester, UK, 2011; Volume 1, pp. 137–160. [Google Scholar]
  11. Lazarevic, D.; Buclet, N.; Brandt, N. The application of life cycle thinking in the context of European waste policy. J. Clean. Prod. 2012, 29, 199–207. [Google Scholar] [CrossRef]
  12. Gentil, E.C.; Damgaard, A.; Hauschild, M.; Finnveden, G.; Eriksson, O.; Thorneloe, S.; Kaplan, P.O.; Barlaz, M.; Muller, O.; Matsui, Y. Models for waste life cycle assessment: Review of technical assumptions. Waste Manag. 2010, 30, 2636–2648. [Google Scholar] [CrossRef] [PubMed]
  13. Astrup, T.F.; Tonini, D.; Turconi, R.; Boldrin, A. Life cycle assessment of thermal waste-to-energy technologies: Review and recommendations. Waste Manag. 2015, 37, 104–115. [Google Scholar] [CrossRef] [PubMed] [Green Version]
  14. Schott, A.B.S.; Wenzel, H.; la Cour Jansen, J. Identification of decisive factors for greenhouse gas emissions in comparative life cycle assessments of food waste management—An analytical review. J. Clean. Prod. 2016, 119, 13–24. [Google Scholar] [CrossRef]
  15. Björklund, A.; Finnveden, G. Recycling revisited—Life cycle comparisons of global warming impact and total energy use of waste management strategies. Resour. Conserv. Recycl. 2005, 44, 309–317. [Google Scholar] [CrossRef]
  16. Laurent, A.; Bakas, I.; Clavreul, J.; Bernstad, A.; Niero, M.; Gentil, E.; Hauschild, M.Z.; Christensen, T.H. Review of lca studies of solid waste management systems–part i: Lessons learned and perspectives. Waste Manag. 2014, 34, 573–588. [Google Scholar] [CrossRef] [PubMed]
  17. Laurent, A.; Clavreul, J.; Bernstad, A.; Bakas, I.; Niero, M.; Gentil, E.; Christensen, T.H.; Hauschild, M.Z. Review of lca studies of solid waste management systems–part ii: Methodological guidance for a better practice. Waste Manag. 2014, 34, 589–606. [Google Scholar] [CrossRef] [PubMed]
  18. Tyskeng, S.; Finnveden, G. Comparing energy use and environmental impacts of recycling and waste incineration. J. Environ. Eng. 2010, 136, 744–748. [Google Scholar] [CrossRef]
  19. Ljunggren Söderman, M.; Eriksson, O.; Björklund, A.; Östblom, G.; Ekvall, T.; Finnveden, G.; Arushanyan, Y.; Sundqvist, J.-O. Integrated economic and environmental assessment of waste policy instruments. Sustainability 2016, 8, 411. [Google Scholar] [CrossRef]
  20. Dreborg, K.H.; Tyskeng, S. Framtida Förutsättningar för en Hållbar Avfallshantering: Övergripande Omvärldsscenarier Samt Referensscenario; Miljöstrategisk Analys-fms, Kungliga Tekniska Högskolan: Stockholm, Sweden, 2008. [Google Scholar]
  21. Östblom, G.; Söderman, M.L.; Sjöström, M. Analysing Future Solid Waste Generation-Soft Linking a Model of Waste Management with a CGE-Model for Sweden; National Institute of Economic Research: Stockholm, Sweden, 2010. [Google Scholar]
  22. Östblom, G.; Berg, C. The EMEC Model: Version 2.0; National Institute of Economic Research: Stockholm, Sweden, 2006. [Google Scholar]
  23. Sjöström, M.; Östblom, G. Future Waste Scenarios for Sweden Based on a CGE-Model; National Institute of Economic Research: Stockholm, Sweden, 2009. [Google Scholar]
  24. Ljunggren, M. Modelling national solid waste management. Waste Manag. Res. 2000, 18, 525–537. [Google Scholar] [CrossRef]
  25. Ljunggren Söderman, M. Ekonomisk Analys av nya Styrmedel för Hanteringen av Svenskt Avfall; Report C229; IVL Swedish Environmental Research Institute: Göteborg, Sweden, 2017. [Google Scholar]
  26. Finnveden, G.; Ekvall, T.; Arushanyan, Y.; Bisaillon, M.; Henriksson, G.; Gunnarsson Östling, U.; Söderman, M.; Sahlin, J.; Stenmarck, Å.; Sundberg, J.; et al. Policy instruments towards a sustainable waste management. Sustainability 2013, 5, 841–881. [Google Scholar] [CrossRef]
  27. Eriksson, O.; Frostell, B.; Björklund, A.; Assefa, G.; Sundqvist, J.-O.; Granath, J.; Carlsson, M.; Baky, A.; Thyselius, L. Orware—A simulation tool for waste management. Resour. Conserv. Recycl. 2002, 36, 287–307. [Google Scholar] [CrossRef]
  28. Finnveden, G.; Hauschild, M.Z.; Ekvall, T.; Guinée, J.; Heijungs, R.; Hellweg, S.; Koehler, A.; Pennington, D.; Suh, S. Recent developments in life cycle assessment. J. Environ. Manag. 2009, 91, 1–21. [Google Scholar] [CrossRef] [PubMed]
  29. Clift, R.; Doig, A.; Finnveden, G. The application of life cycle assessment to integrated solid waste management: Part 1—methodology. Process Saf. Environ. Prot. 2000, 78, 279–287. [Google Scholar] [CrossRef]
  30. PRé. About Simapro. Available online: https://simapro.com/about/ (accessed on 11 February 2017).
  31. Goedkoop, M.; Heijungs, R.; Huijbregts, M.; De Schryver, A.; Struijs, J.; van Zelm, R. Recipe 2008. In A Life Cycle Impact Assessment Method Which Comprises Harmonised Category Indicators at the Midpoint and the Endpoint Level; Ruimte en Milieu: Amsterdam, The Netherlands, 2009. [Google Scholar]
  32. Althaus, H.-J.; Hischier, R.; Doka, G.; Bauer, C.; Dones, R.; Nemecek, T.; Hellweg, S.; Humbert, S.; Margni, M.; Koellner, T.; et al. Implementation of Life Cycle Impact Assessment Methods; Data v20 (2007), No 3 (INIS-CH--10091); EcoInvent Center: Dübendorf, Switzerland, 2007. [Google Scholar]
  33. Finnveden, G.; Håkansson, C.; Noring, M. A new set of valuation factors for LCA and LCC based on damage costs: Ecovalue 2012. In Proceedings of the 6th International Conference on Life Cycle Management in Gothenburg, Gothenburg, Sweden, 25–28 August 2013; pp. 197–200.
  34. Ahlroth, S.; Finnveden, G. Ecovalue08—A new valuation set for environmental systems analysis tools. J. Clean. Prod. 2011, 19, 1994–2003. [Google Scholar] [CrossRef]
  35. Björklund, A.E.; Finnveden, G. Life cycle assessment of a national policy proposal—The case of a Swedish waste incineration tax. Waste Manag. 2007, 27, 1046–1058. [Google Scholar] [CrossRef] [PubMed]
  36. Finnveden, G.; Johansson, J.; Lind, P.; Moberg, Å. Life cycle assessment of energy from solid waste—Part 1: General methodology and results. J. Clean. Prod. 2005, 13, 213–229. [Google Scholar] [CrossRef]
  37. Eriksson, O.; Bisaillon, M.; Haraldsson, M.; Sundberg, J. Integrated waste management as a mean to promote renewable energy. Renew. Energy 2014, 61, 38–42. [Google Scholar] [CrossRef]
  38. Eriksson, O.; Reich, M.C.; Frostell, B.; Björklund, A.; Assefa, G.; Sundqvist, J.-O.; Granath, J.; Baky, A.; Thyselius, L. Municipal solid waste management from a systems perspective. J. Clean. Prod. 2005, 13, 241–252. [Google Scholar] [CrossRef]
  39. Bisaillon, M.; Sundberg, J.; Haraldsson, M.; Eriksson, O. Systemstudie Avfall i Göteborg; Technical Report, Project Report WR 21; SP Sveriges Tekniska Forskningsinstitut: Boras, Sweden, 2010. [Google Scholar]
  40. CPM LCA Database. LCI Dataset “Waste Treatment—Incineration in Heat Only Boiler Plant (SWEA HOB)”. Available online: http://cpmdatabase.cpm.chalmers.se/ (accessed on 11 February 2017).
  41. CPM LCA Database. LCI Dataset “Waste Treatment—Incineration for Heat in Cement Kiln (SWEA CKN)”. Available online: http://cpmdatabase.cpm.chalmers.se/ (accessed on 11 February 2017).
  42. CPM LCA Database. LCI Dataset “Waste Treatment—Incineration in Combined Heat and Power Plant (SWEA CHP)”. Available online: http://cpmdatabase.cpm.chalmers.se/ (accessed on 11 February 2017).
  43. CPM LCA Database. LCI Dataset “Waste Treatment—Landfill (SWEA LFL)”. Available online: http://cpmdatabase.cpm.chalmers.se/ (accessed on 11 February 2017).
  44. CPM LCA Database. LCI Dataset “Waste Treatment—Reactor Composting (SWEA CPR)”. Available online: http://cpmdatabase.cpm.chalmers.se/ (accessed on 11 February 2017).
  45. CPM LCA Database. LCI Dataset “Waste Treatment—Windrow Composting (SWEA CPW)”. Available online: http://cpmdatabase.cpm.chalmers.se/ (accessed on 11 February 2017).
  46. Larsen, A.W.; Vrogd, M.; Christensen, T. Diesel consumption in waste collection and transport and its environmental significance. Waste Manag. Res. 2009, 27, 738–745. [Google Scholar] [CrossRef] [PubMed]
  47. Frischknecht, R.; Jungbluth, N.; Althaus, H.-J.; Doka, G.; Dones, R.; Hischier, R.; Hellweg, S.; Nemecek, T.; Rebitzer, G.; Spielman, M. Overview and Methodology; Final Report Ecoinvent Data v 2.0, No. 1; Swiss Centre for Life Cycle Inventories: Dübendorf, Switzerland, 2007. [Google Scholar]
  48. Tillman, A.-M. Significance of decision-making for lca methodology. Environ. Impact Assess. Rev. 2000, 20, 113–123. [Google Scholar] [CrossRef]
  49. Swedish Energy Agency. Långsiktsprognos 2008; Swedish Energy Agency: Stockholm, Sweden, 2009. [Google Scholar]
  50. Björklund, A. Life cycle assessment as an analytical tool in strategic environmental assessment. Lessons learned from a case study on municipal energy planning in Sweden. Environ. Impact Assess. Rev. 2012, 32, 82–87. [Google Scholar] [CrossRef]
  51. Herngren, E.; Morales, C.L. Fjärrvärmen 2030 (Heating 2030); Svensk Fjärrvärme AB (Swedish Heating): Stockholm, Sweden, 2013. [Google Scholar]
  52. Finnveden, G. On the limitations of life cycle assessment and environmental systems analysis tools in general. Int. J. Life Cycle Assess. 2000, 5, 229–238. [Google Scholar] [CrossRef]
  53. Alvarenga, R.A.; Lins, I.d.O.; Almeida Neto, J.A.d. Evaluation of abiotic resource LCIA methods. Resources 2016, 5, 13. [Google Scholar] [CrossRef]
  54. Finnveden, G.; Arushanyan, Y.; Brandão, M. Exergy as a measure of resource use in life cycle assessment and other sustainability assessment tools. Resources 2016, 5, 23. [Google Scholar] [CrossRef]
  55. Klinglmair, M.; Sala, S.; Brandão, M. Assessing resource depletion in LCA: A review of methods and methodological issues. Int. J. Life Cycle Assess. 2014, 19, 580–592. [Google Scholar] [CrossRef]
  56. Dahlén, L.; Lagerkvist, A. Pay as you throw: Strengths and weaknesses of weight-based billing in household waste collection systems in sweden. Waste Manag. 2010, 30, 23–31. [Google Scholar] [CrossRef] [PubMed]
  57. Montevecchi, F. Policy mixes to achieve absolute decoupling: A case study of municipal waste management. Sustainability 2016, 8, 442. [Google Scholar] [CrossRef]
  58. Antosiewicz, M.; Lewandowski, P.; Witajewski-Baltvilks, J. Input vs. Output taxation—A DSGE approach to modelling resource decoupling. Sustainability 2016, 8, 352. [Google Scholar] [CrossRef]
  59. Bicket, M.; Vanner, R. Designing policy mixes for resource efficiency: The role of public acceptability. Sustainability 2016, 8, 366. [Google Scholar] [CrossRef]
  60. Eriksson, O.; Finnveden, G. Plastic waste as a fuel—CO2-neutral or not? Energy Environ. Sci. 2009, 2, 907–914. [Google Scholar] [CrossRef]
  61. Björklund, A. Environmental Systems Analysis Waste Management. Master’s Thesis, KTH, Stockholm, Sweden, 1998. [Google Scholar]
  62. AvfallSverige. Energy Report (Status 2006) Results of Specific Data for Energy, Efficiency Rates, Plant Efficiency Factors, ncv and Determination of the Main Energy Results of 20 Investigated Swedish w-t-e Plants; Report F2008:06; AvfallSverige (Waste Management Sweden): Malmö, Sweden, 2008. [Google Scholar]
  63. Rahmberg, M. Utvärdering och Modellering av Återvinningsprocesser i ORWARE. Master’s Thesis, Uppsala University, Uppsala, Sweden, 2001. [Google Scholar]
  64. Sundqvist, J.-O.; Baky, A.; Carlsson Reich, M.; Eriksson, O.; Granath, J. Hur Skall Hushållsavfallet tas om Hand? Utvärdering av Olika Behandlingsmetoder; Report B1462; IVL Swedish Environmental Research Institute: Stockholm, Sweden, 2002. [Google Scholar]
  65. Carlström, A. Kompostering av Organiskt Avfall Från Gästrikeregionen–Miljöpåverkan av Olika Behandlingsalternativ. Master’s Thesis, Uppsala University, Uppsala, Sweden, 2006. [Google Scholar]
  66. Baky, A.; Eriksson, O. Systems Analysis of Organic Waste Management in Denmark; Danish Ministry of the Environment, Danish Environmental Protection Agency: København, Denmark, 2003.
  67. Dalemo, M. Environmental Systems Analysis of Organic Waste Management: The Orware Model and the Sewage Plant and Anaerobic Digestion Submodels; Swedish University of Agricultural Sciences: Uppsala, Sweden, 1999. [Google Scholar]
  68. Hischier, R. Life Cycle Inventories of Packaging and Graphical Paper; Ecoinvent Report No 11; Swiss Centre for Life Cycle Inventories: Duebendorf, Switzerland, 2007. [Google Scholar]
  69. Tillman, A.-M.; Baumann, H.; Eriksson, E.; Rydberg, T. Life-Cycle Analyses of Selected Packaging Materials: Quantification of Environmental Loadings; Chalmers Industriteknik: Goteborg, Sweden, 1991. [Google Scholar]
  70. Nyström, E.; Svensk glasåtervinning AB, Hammar, Sweden. Personal communication, 2008.
  71. Finnveden, G.; KTH, Stockholm, Sweden. Personal communication, 2011.
  72. Forsgren, C.; Stenametall, Göteborg, Sweden. Personal communication, 2008.
  73. Pilz, H.; Schlager, R.; Ekvall, T.; Ljunggren Söderman, M.; Rydberg, T.; Roos, S. Strategies for Sensible Recovery of Domestic Plastic Packaging Waste in Sweden; GUA Gesellschaft für Umfassende Analysen GmbH and IVL Swedish Environmental Research Institute AB on Behalf of Plastkretsen AB: Stockholm, Sweden, 2006. [Google Scholar]
  74. Waste and Resources Action Programme (WRAP). Life Cycle Assessment of Plasterboard: Quantifying the Environmental Impacts Throughout the Product Life Cycle, Building the Evidence Base in Sustainable Construction; WRAP: Banbury, UK, 2007. [Google Scholar]
  75. Hallberg, L.; Strömberg, K.; Eriksson, E.; Rydberg, T. Comparative Life Cycle Assessment of the Utilization of Used Tires. On Behalf of Svensk Däckåtervinning; CIT Ekologik AB: Göteborg, Sweden, 2004. [Google Scholar]
  76. Sundqvist, J.-O.; IVL Swedish Environmental Research Institute, Stockholm, Sweden. Personal communication, 2008.
  77. Damgaard, A. Easewaste Database; DTU Environment: Kgs Lyngby, Denmark, 2008. [Google Scholar]
  78. Fredriksson, O.; Gryaab, Gothenburg, Sweden. Personal communication, 2008.
  79. Sundberg, J. SEA Database (sammansättning och egenskaper för avfall); Profu AB: Mölndal, Sweden, 2008. [Google Scholar]
  80. Jansson, Å. Riktlinjer för Slagganvändning. Available online: http://www.jernkontoret.se/sv/publicerat/forskning/oppna-rapporter-serie-d/d-781/ (accessed on 5 November 2014).
  81. Strömberg, B. Handbook of Fuels; Värmeforsk: Stockholm, Sweden, 2005. [Google Scholar]
Figure 1. General outline of SWEA model [19].
Energies 10 00247 g001
Figure 2. Relative environmental impacts of the waste treatment system (including avoided burdens) for the four base scenarios compared to the reference scenario set to 100% (average data).
Energies 10 00247 g002
Figure 3. Relative cumulative energy demand of the waste treatment system (including avoided burdens) for the four base scenarios compared to the reference scenario set to 100%.
Energies 10 00247 g003
Figure 4. Valuation results for the different scenarios using the Ecovalue method.
Energies 10 00247 g004
Figure 5. Relative environmental impacts from Weight based waste fee, alt.1 in comparison to the “no action” alternative. The “no action” alternative is set to 100%.
Energies 10 00247 g005
Figure 6. Relative results for the Cumulative energy demand for Weight based waste fee, alt.1 policy instrument compared to the “no action” alternative set to 100%
Energies 10 00247 g006
Table 1. Waste amounts per waste flow type in different scenarios without any policy instruments, Mtonne [25].
SectorWaste FractionReference ScenarioScenario 1Scenario 2Scenario 3Scenario 4
HouseholdRecyclable1.831.132.952.010.86
Bulky1.090.671.761.200.51
Food0.430.270.690.470.20
Garden/park0.530.330.850.580.25
Household mix3.842.386.234.231.82
Sewage sludge0.840.921.070.920.97
IndustryBulky0.210.170.320.220.16
Inert4.053.034.023.683.56
Animal waste (n.h.)0.020.010.010.020.01
Recyclable8.025.517.767.337.10
Combustible1.010.681.231.020.79
Non combustible0.250.170.310.250.20
Mix1.270.851.541.270.99
Non organic sludge0.130.130.190.140.13
Food0.600.380.520.550.48
Animal waste (h.)0.160.100.130.140.13
Park/garden0.020.010.020.020.01
Household mix0.710.611.170.770.56
Sewage sludge2.722.713.742.482.57
Total27.7420.0834.5227.3121.30
h.: hygienized; n.h.: non hygienized.

