Article

Effects of Biogas Substrate Recirculation on Methane Yield and Efficiency of a Liquid-Manure-Based Biogas Plant

by
Frauke P. C. Müller
*,
Gerd-Christian Maack
and
Wolfgang Buescher
Institute of Agricultural Engineering, Livestock Technology, Rheinische Friedrich-Wilhelms-Universität Bonn, Nussallee 5, 53115 Bonn, Germany
*
Author to whom correspondence should be addressed.
Energies 2017, 10(3), 325; https://doi.org/10.3390/en10030325
Submission received: 7 December 2016 / Revised: 25 February 2017 / Accepted: 3 March 2017 / Published: 8 March 2017
(This article belongs to the Special Issue Energy and Waste Management)

Abstract

:
Biogas plants are the most complex systems and are heavily studied in the field of renewable energy. A biogas system is mainly influenced by biological and technical parameters that strongly interact with each other. One recommended practice when operating a biogas plant is the recirculation of the substrate from the second fermenter into the first fermenter, which extends the recirculation amount (RA) and, in turn, the recirculation rate (RR). This technique should be applied to support and secure the biogas process. In this investigation, the RA was varied, starting with the recommended “best practice” of 10.0 m3/d (RR 40%). Every ten days, the RA was reduced in steps of 1.5 m3/d, with 5.5 m3/d (RR 27%) being the final value. The basic question to be addressed concerns to what extent the RR influences the methane yield and thereby influence the efficiency of a manure-based biogas plant in practice. Diverting the “best practice” to a RR of 27% stabilised the fermentation process and lead to significantly higher methane yields with smaller standard deviations. In addition, with a reduced RR, the standard optimal acid concentration within the biogas substrate was approximately reached.

1. Introduction

In today’s society and economy, there is high acceptance of biogas as a green energy resource because of increasingly energy-demanding lifestyles [1] and dwindling fossil resources. Therefore, the use of biogas as a renewable energy source based on energy crops and organic residual materials is of high importance [2], even in the agricultural sector. In addition, biogas technology has been refined through many studies over the last few years. Two main key levers of biogas research can be distinguished: the understanding of microbiological activity and function and the optimization of the engineering performance.
The type of supply and the fermentation temperature are two of the main technical aspects of concern in a biogas plant. Most biogas plants are mainly fed with energy crops and a small amount of manure.
Energy crops, in contrast to manure, have a higher biogas potential, and their production is not coupled with animal farms [1]. However, manure, as by-product of livestock farms, is a central element in the concept of cascaded utilization because crops are not only used as an energy source. Livestock manure also helps to control the stability of the fermentation process [3]. In a first step, they serve as animal feed. They then serve as a substrate for a biogas plant in the second energy level. Even in Germany, biogas plants that are fed with a high percentage of manure, namely, up to 80% and 100%, have become a focus of industry and practice because of special support produced by the German Renewably Energy Act of 2012 (EEG). The EEG facilitates the development of renewable energy to support electricity production from sustainable sources and guarantees a fixed feed-in remuneration for the producer.
Therefore, even livestock farms may be able to invest in the biogas sector. The production limit is 75 kW of electrical power. In Germany, the resulting type of biogas plant is called a “small biogas plant”. This categorization is special for Germany and was defined by the amendment of the Renewable Energies Act in 2012 (EEG).
In terms of fermentation temperature, only two variations are used in practice. Most biogas plants operate at the mesophilic level (30 to 40 °C) because the thermophilic range (50 to 55 °C), where the digestion rate is higher because of better substrate accessibility and the promotion of the decomposition of organic matter [4], has lower process stability compared to mesophilic fermentation [5]. In addition, thermophilic biogas plants have a less complex biologic community compared to mesophilic systems [6]. Thus the thermophilic fermentation is characterized by a higher efficiency in different organic loading rates (OLR’s) [7,8].
The synthesis of biogas relies on a four-step process: first hydrolysis, followed by acidogenesis, acetogenesis and methanogenesis. In the hydrolysis step, complex compounds such as carbohydrates, proteins and fats are split into simple organic compounds. The hydrolysis further has a directional effect on the efficiency of the anaerobic fermentation [9]. During the acidogenesis, the intermediates formed are converted into precursor substances of biogas. In the third step, i.e., the acetogenesis, the intermediate products are converted into biogas precursor substances by acetogenic bacteria. In the final step, i.e., the methanogenesis, methane-forming bacteria convert acetic acid, carbon dioxide and hydrogen into biogas. Every step strongly depends on various (biological as well as technical) parameters such as temperature, pH, dry matter (DM) and organic dry matter (oDM) content, organic loading rate (OLR), hydraulic retention time (HRT), and acid spectrum [2,10,11]. The recirculation rate (RR) can be defined as a technical parameter. This rate describes the removal of the substrate of fermented biogas to the beginning of the biogas process as a proportion of the input of fresh substrate. Various positive effects can be achieved by varying the RR. The liquefaction and inoculation of the fresh biogas substrate and the stabilisation of biogas synthesis are three of the main factors in the process. Previous studies have highlighted the fact that varying the recirculation amount (RA) can be used to optimize biogas production [12,13]. This was again confirmed in many scientific works in the last thirty years, where high OLR (affected by an increased RR) leads to increased methane output [14,15,16,17,18].
Various factors, such as the accumulation of organic and inorganic ingredients [19,20], the dilution of the biogas substrate leading to a stable pH value [21], as well as the stimulation of microorganisms [22], such as increased support of hydrogenothrophic methanogens [19], may be able to explain this effect.
By taking a holistic view of the biogas system, this investigation considers both biological as well as technical factors. The basic question concerns to what extent the RRs influence the methane yield and thus the efficiencies of a manure-based biogas plant. Moreover, there is the question of which biological parameters are affected by the RRs. Finally, can the RR be used as the controlling mechanism to provoke a different stabilizing effect on the process?

2. Material and Methods

The investigated biogas system is located at a dairy farm, with a current stocking of 140 dairy cows and 140 female breeding cows (LU 220) that produce on average 8000 kg of milk per cow per year, and belongs to the category of “small biogas plants”. The electrical power output is 75 kW. The fermenter is designed as a plug-flow digester with a capacity of 120 m3 (Figure 1).
Connected to this fermenter is a second fermenter designed as a classic round tank with a gas-tight cover and a 2000 m3 capacity. The space under the gas-tight cover serves as an integrated gas storage volume, from which the combined heat and power station (CHP) is supplied with biogas by pipelines. Within the storage volume, the biogas of the first and second fermenter is initiated. The system operates in the thermophilic range (50 to 55 °C) and was put into service in October 2012. The present investigation was performed in the summer of 2013. The biogas plant is fed daily with 15 m3 of fresh substrate consisting of 93% slurry and 7% energy crops (corn silage and grain debris). The resulting substrate mix has a dry matter content of 11.1% (oDM: 5.6%).

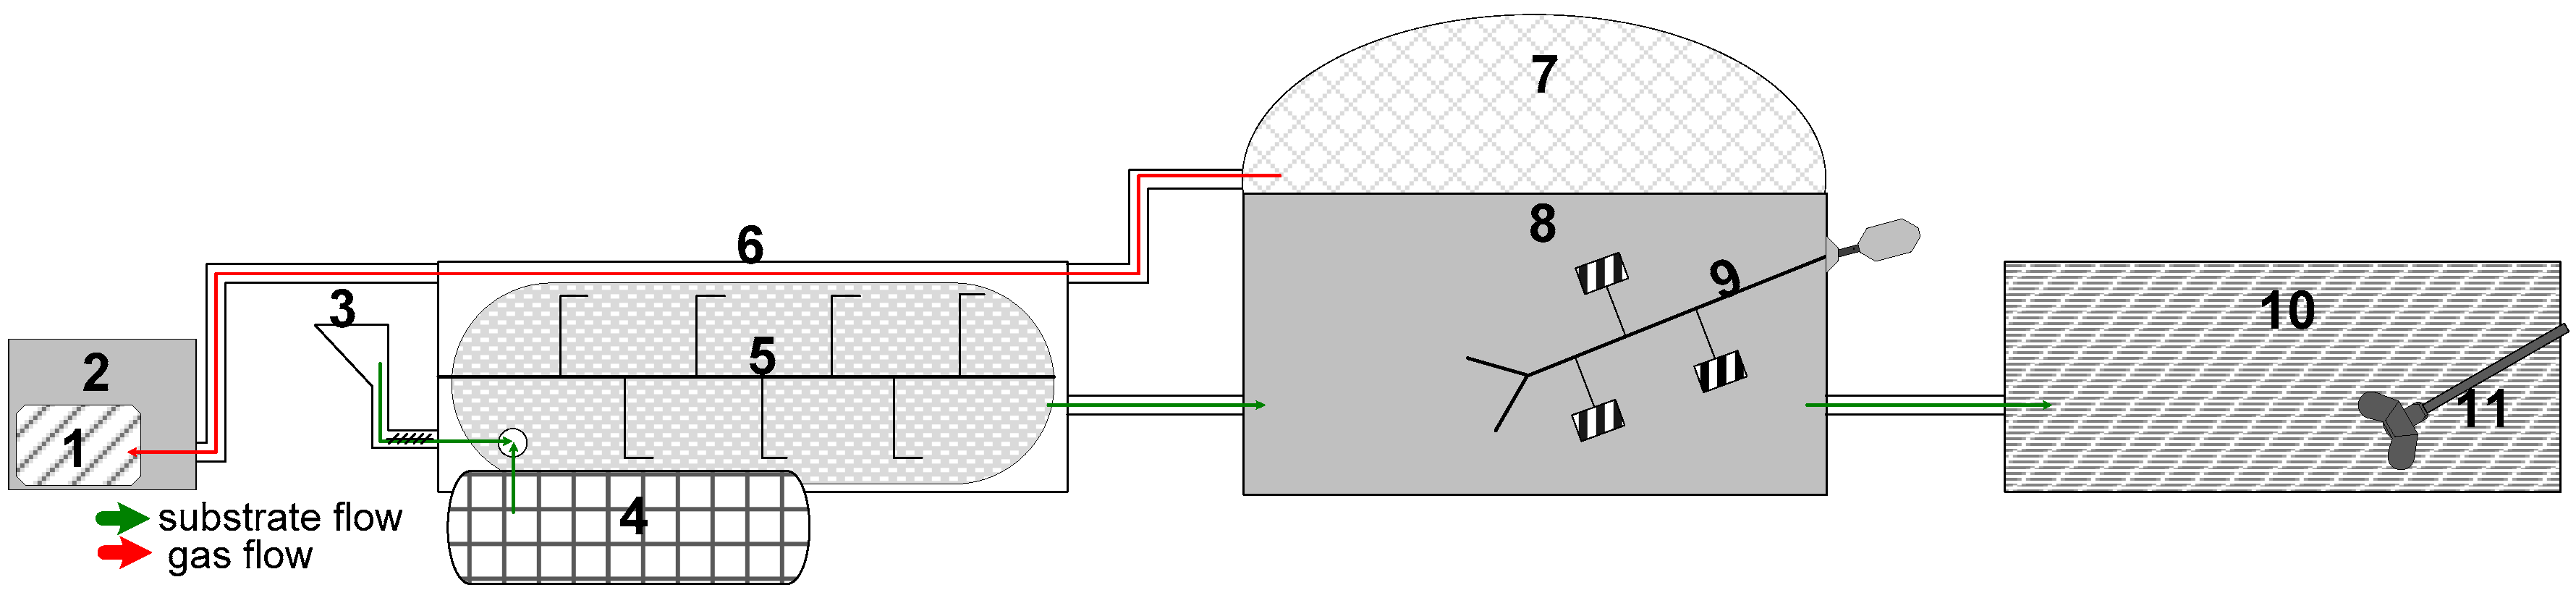
2.1. Recirculation of the Biogas Substrate

The substrate from the second fermenter can be recirculated into the first fermenter within the biogas plant. The retention time of the biogas substrate within the biogas system is approximately 150 days. For the first 10–12 days, the biogas substrate remains in the first fermenter. As a result, the recirculated substrate from the second fermenter is a mixture of fermented substrate that ranges from 10 to 150 days old and includes microorganisms from every step of biogas synthesis.
For this investigation, four different recirculation amounts (RAs) were examined. As the first step, the recommend “best practice” (RA: 10 m3/d; RR 40%) was applied. Over an experimental period of 40 days, the recirculation was reduced to a minimum of 5.5 m3/d in steps of 1.5 m3/d. Every rate was used for 10 days to allow the microorganisms in the biogas substrate sufficient time for an acclimatation phase and exhibit a visible reaction to the different RAs. After 10 days of one recirculation variation, samples of the biogas substrate were taken from the first fermenter. Every sample was sent to an external accredited laboratory for analysis. The acid contents were determined by an external laboratory using gas chromatography (in-house method). The pH value was analysed by EN 12176:1998 [23], DM by EN 12880:2000 [24] and oDM by EN 12879:2000 [25]. The methane content was documented every hour using the “BioBasic” analysis section by Fresenius Umwelttechnik GmbH (Herten, Germany). In Table 1, the experimental details are listed. Through a comparison of the theoretical total substrate input (ST) (standard value for daily feeding) and the actual feedstock (according to business book of the biogas plant, the calculated real fed quantities), it could be demonstrated that the experimental conditions were nearly 100 percent maintained.
The RA in proportion to the total substrate input (RR) is approximately 40% in the first RA step and decreased to 27% in the final step (RA: 5.5 m3/d) of the investigation. To better compare the various types of biogas plants, the RR was used as the parameter for the following analyses.

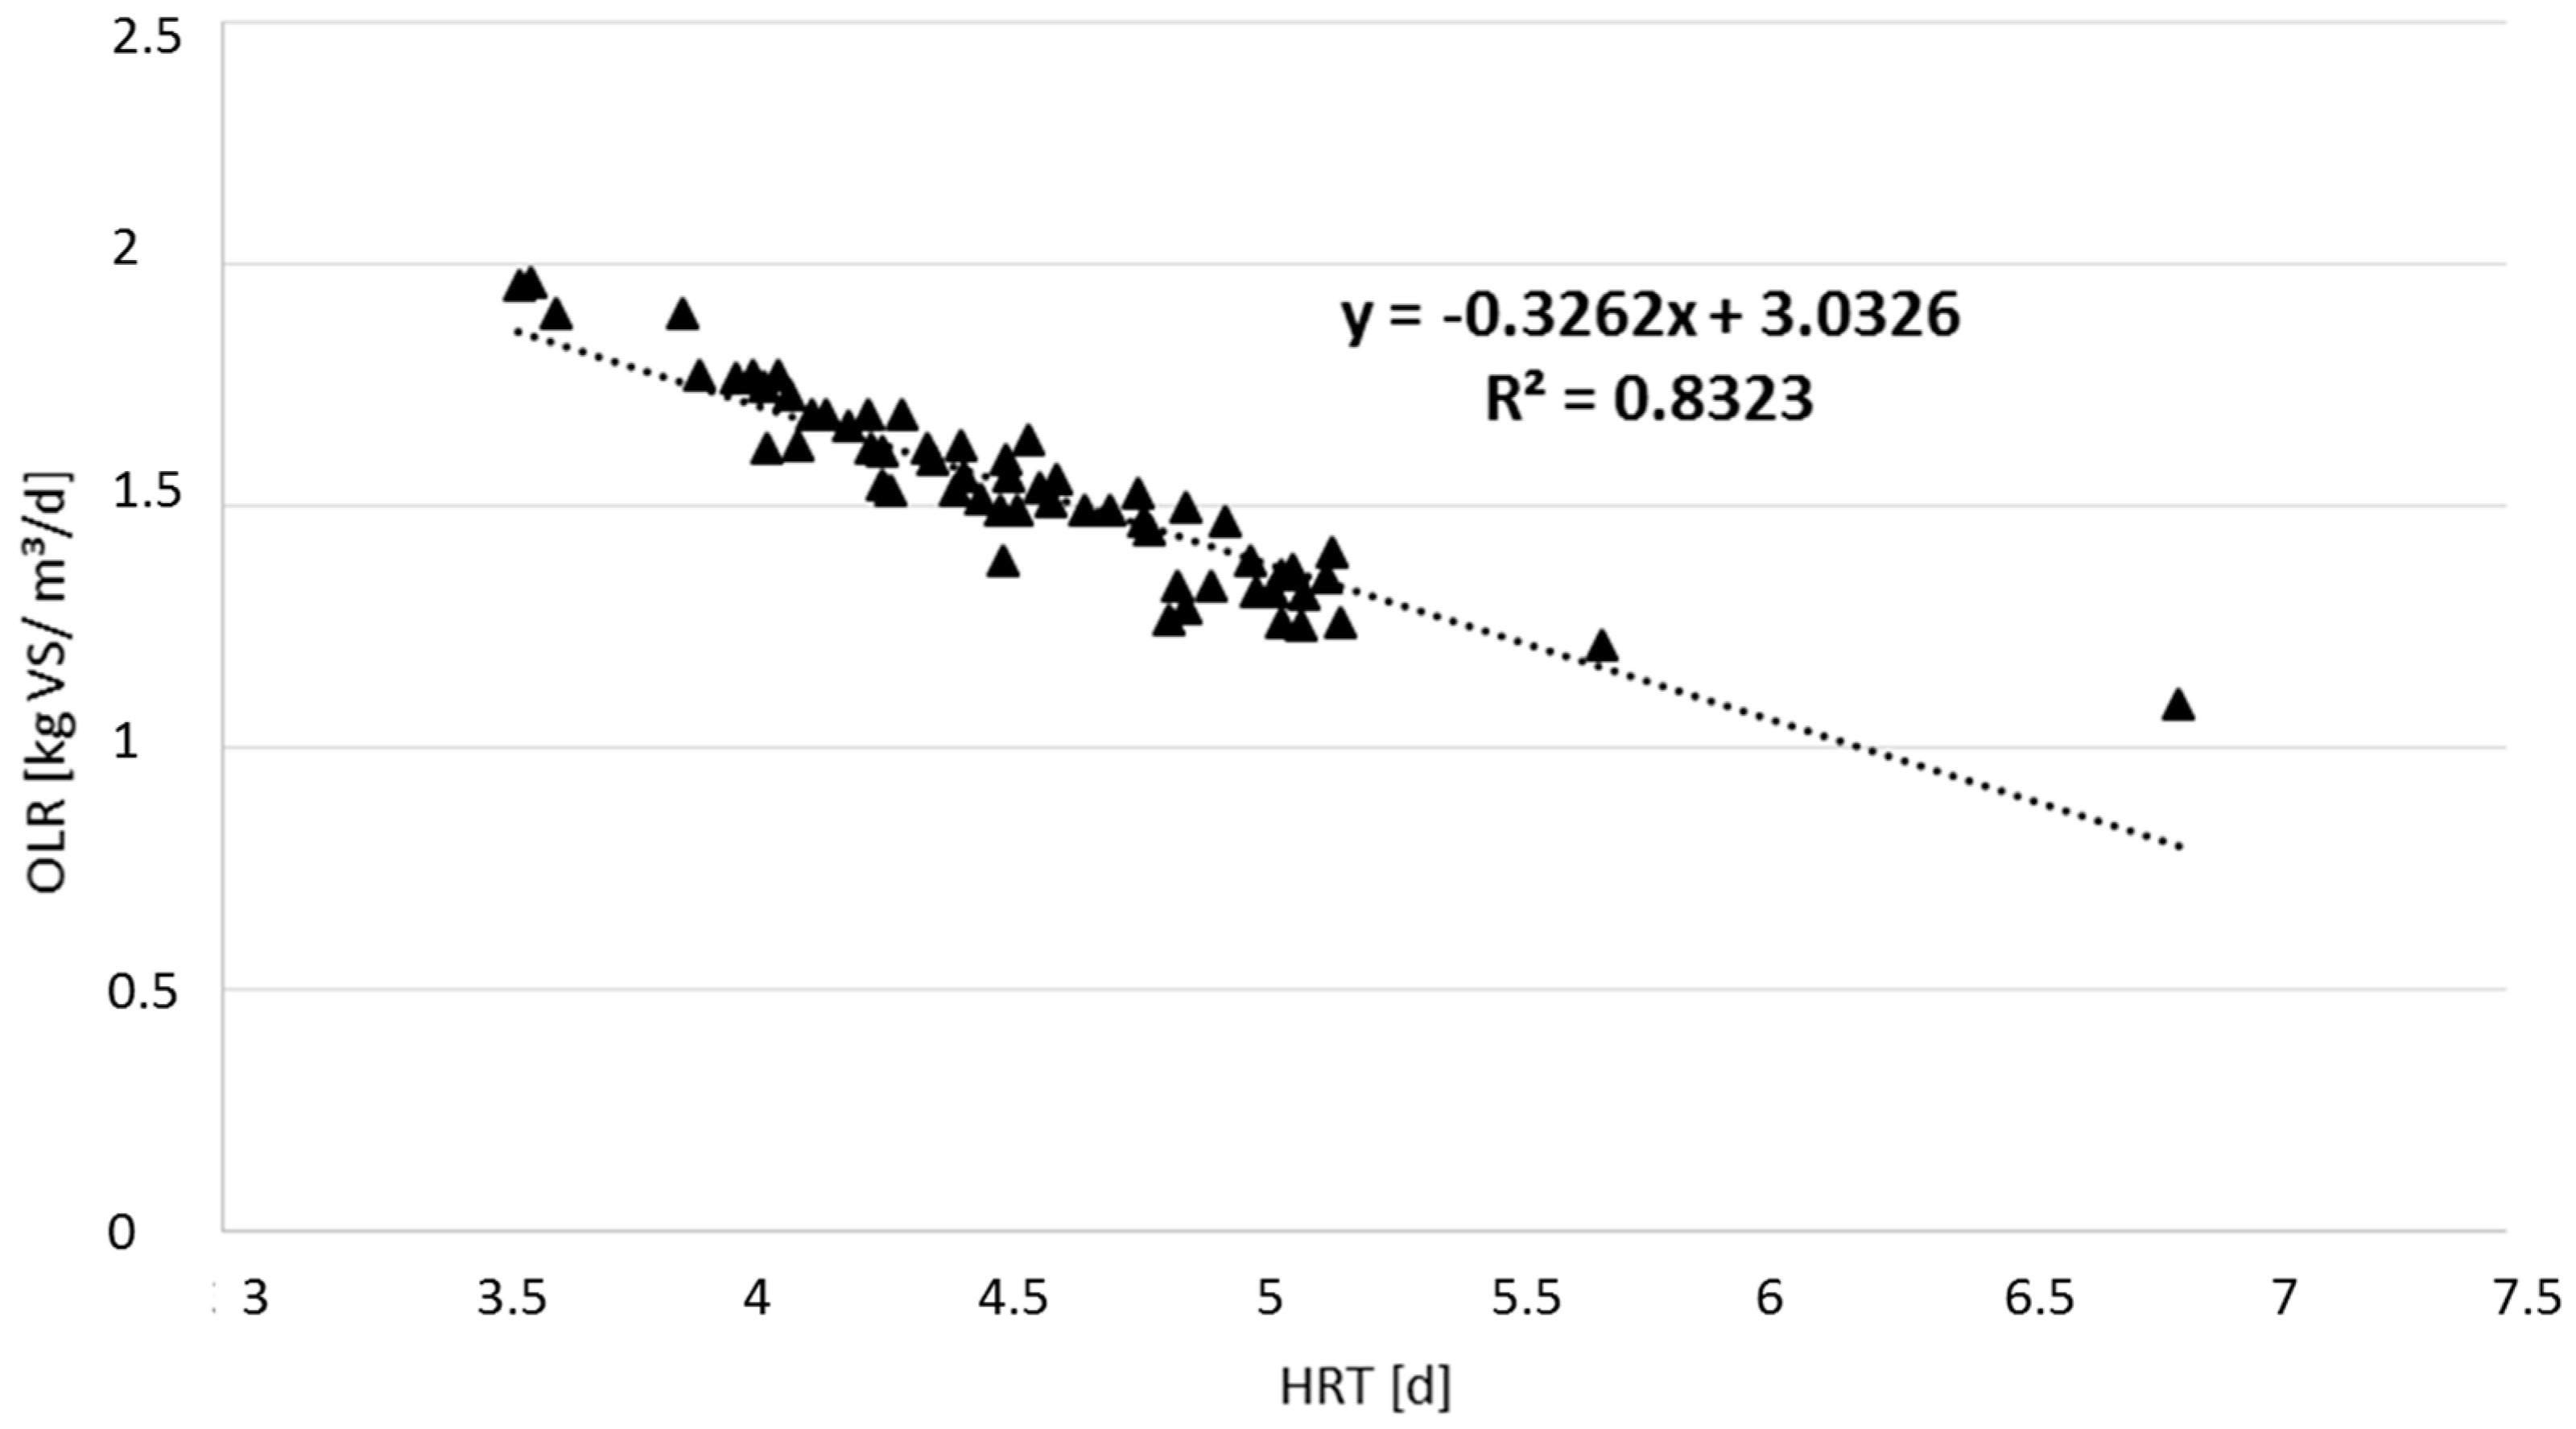
2.2. Calculation of Organic Loading Rate And Hydraulic Retention Time

The OLR describes the duration that the substrate remains in the fermenter until discharge and is expressed as [kg·VS·m3·d−1]. The calculation of the OLR was performed using the following equation (based on [26]):
O L R = m ˙   × c V R   × 100   [ kg · VS ·   m 3 · d 1 ]
In Equation (1) OLR is the organic loading rate, m ˙ the amount of substrate added per unit time (kg/d); c the concentration of organic matter, VS are the volatile solids (%VS) and VR is the reactor volume (m3).
The HRT is calculated in days and is the ratio of the reactor volume (VR) to the volume of fresh substrate added daily ( V ˙ ) [26]:
H R T =   V R V ˙   [ d ]
where HRT is the hydraulic retention time, VR the reactor volume (m3), and V ˙ is the volume of substrate added daily (m3).
The parameters OLR and HRT strongly interacted with each other. ST decreased with decreasing RA during the investigation. Thus, it can be assumed that a minimization of the OLR can be observed in parallel. Moreover, HRT should concurrently increase because the substrate can remain in the first fermenter for a longer duration.

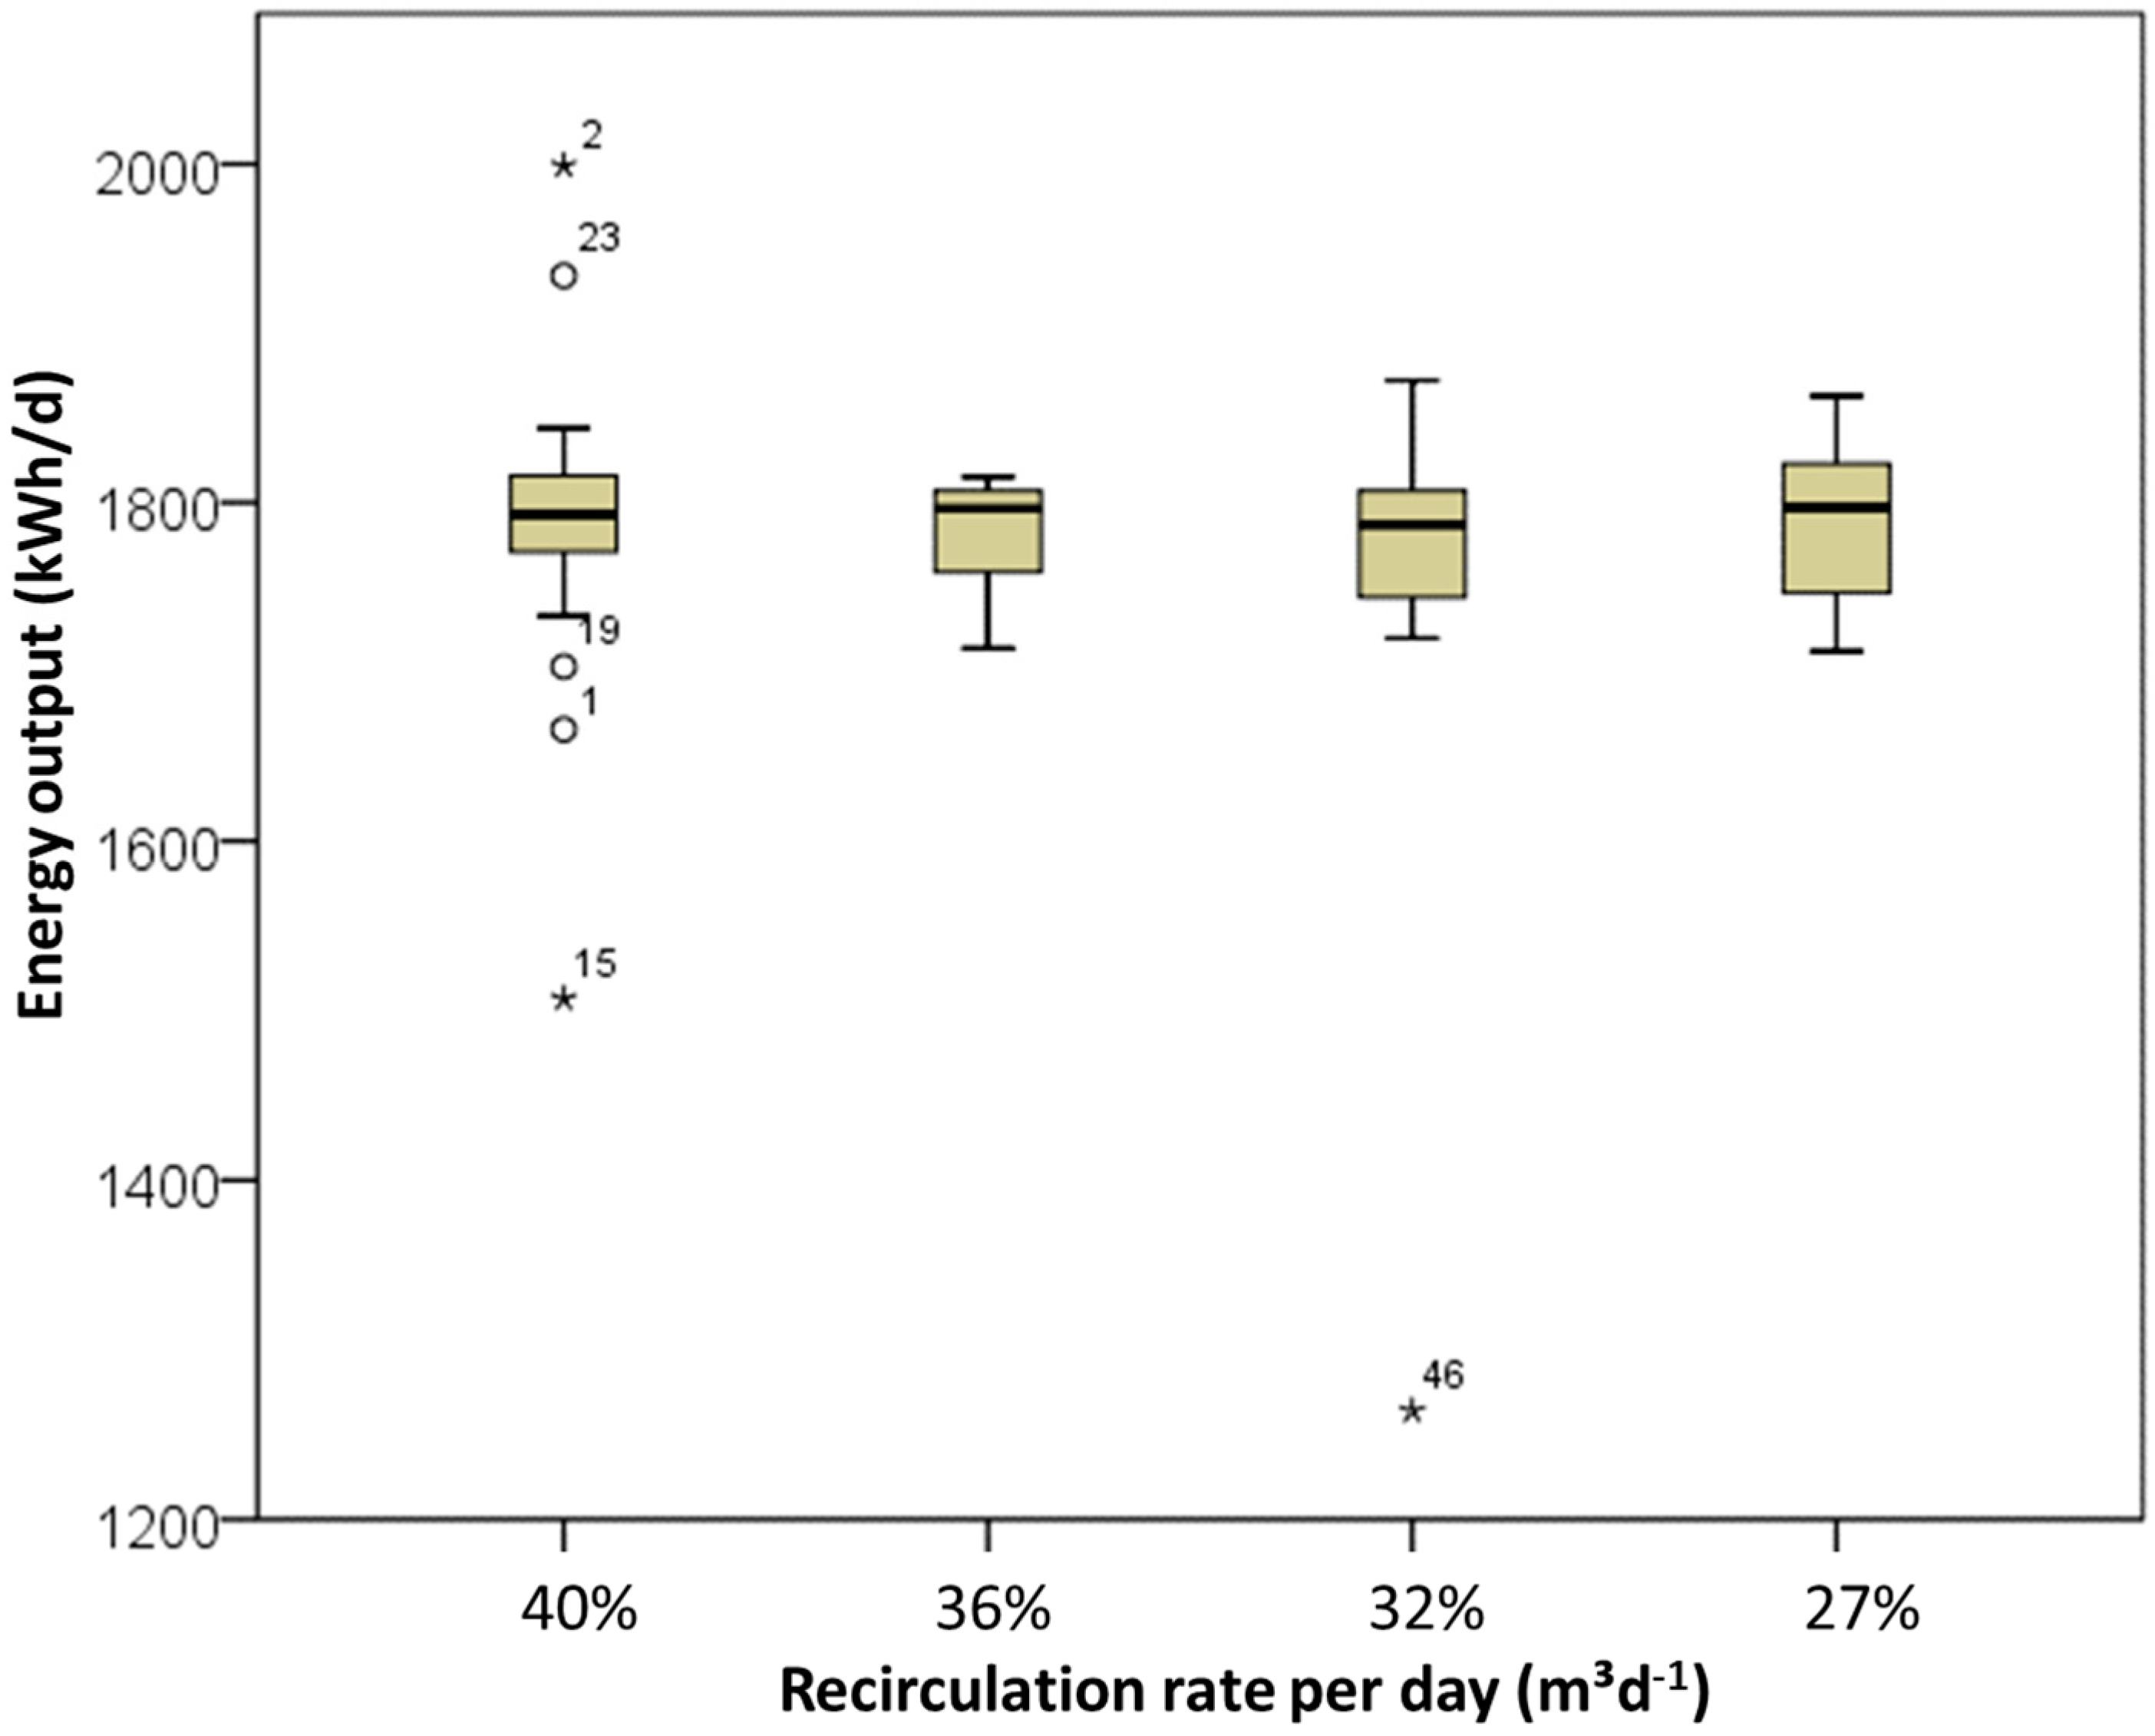
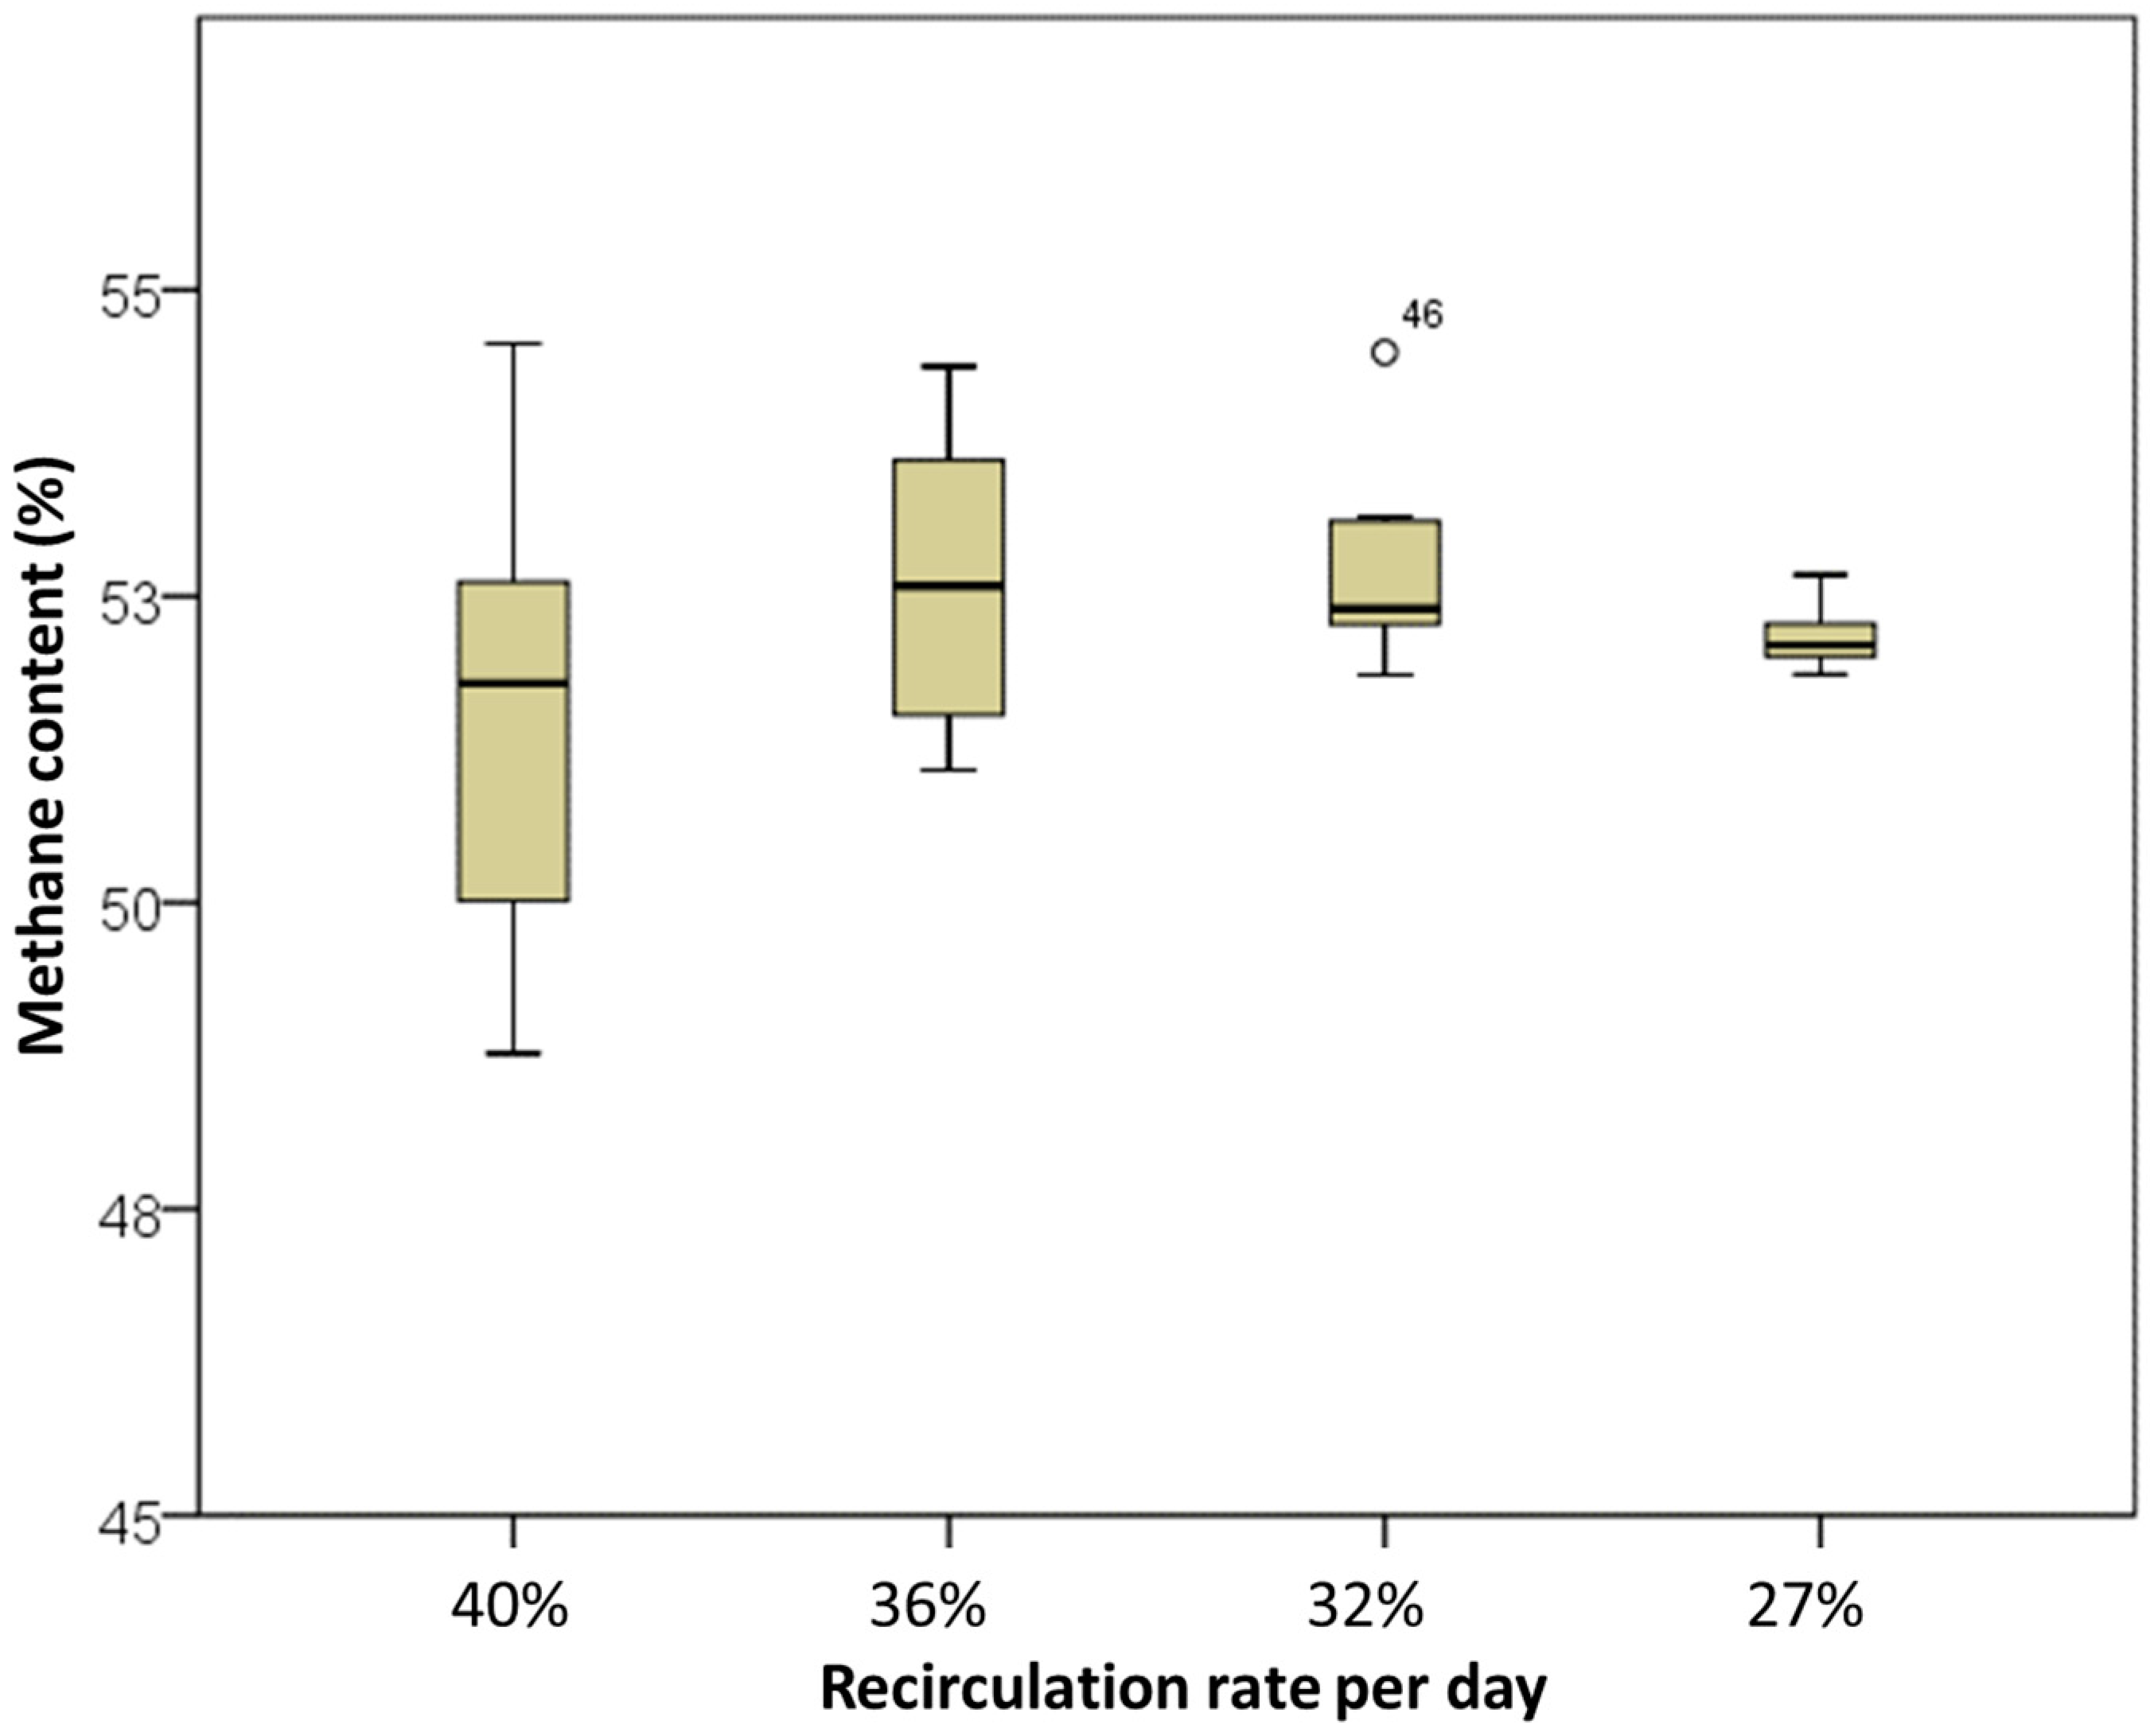
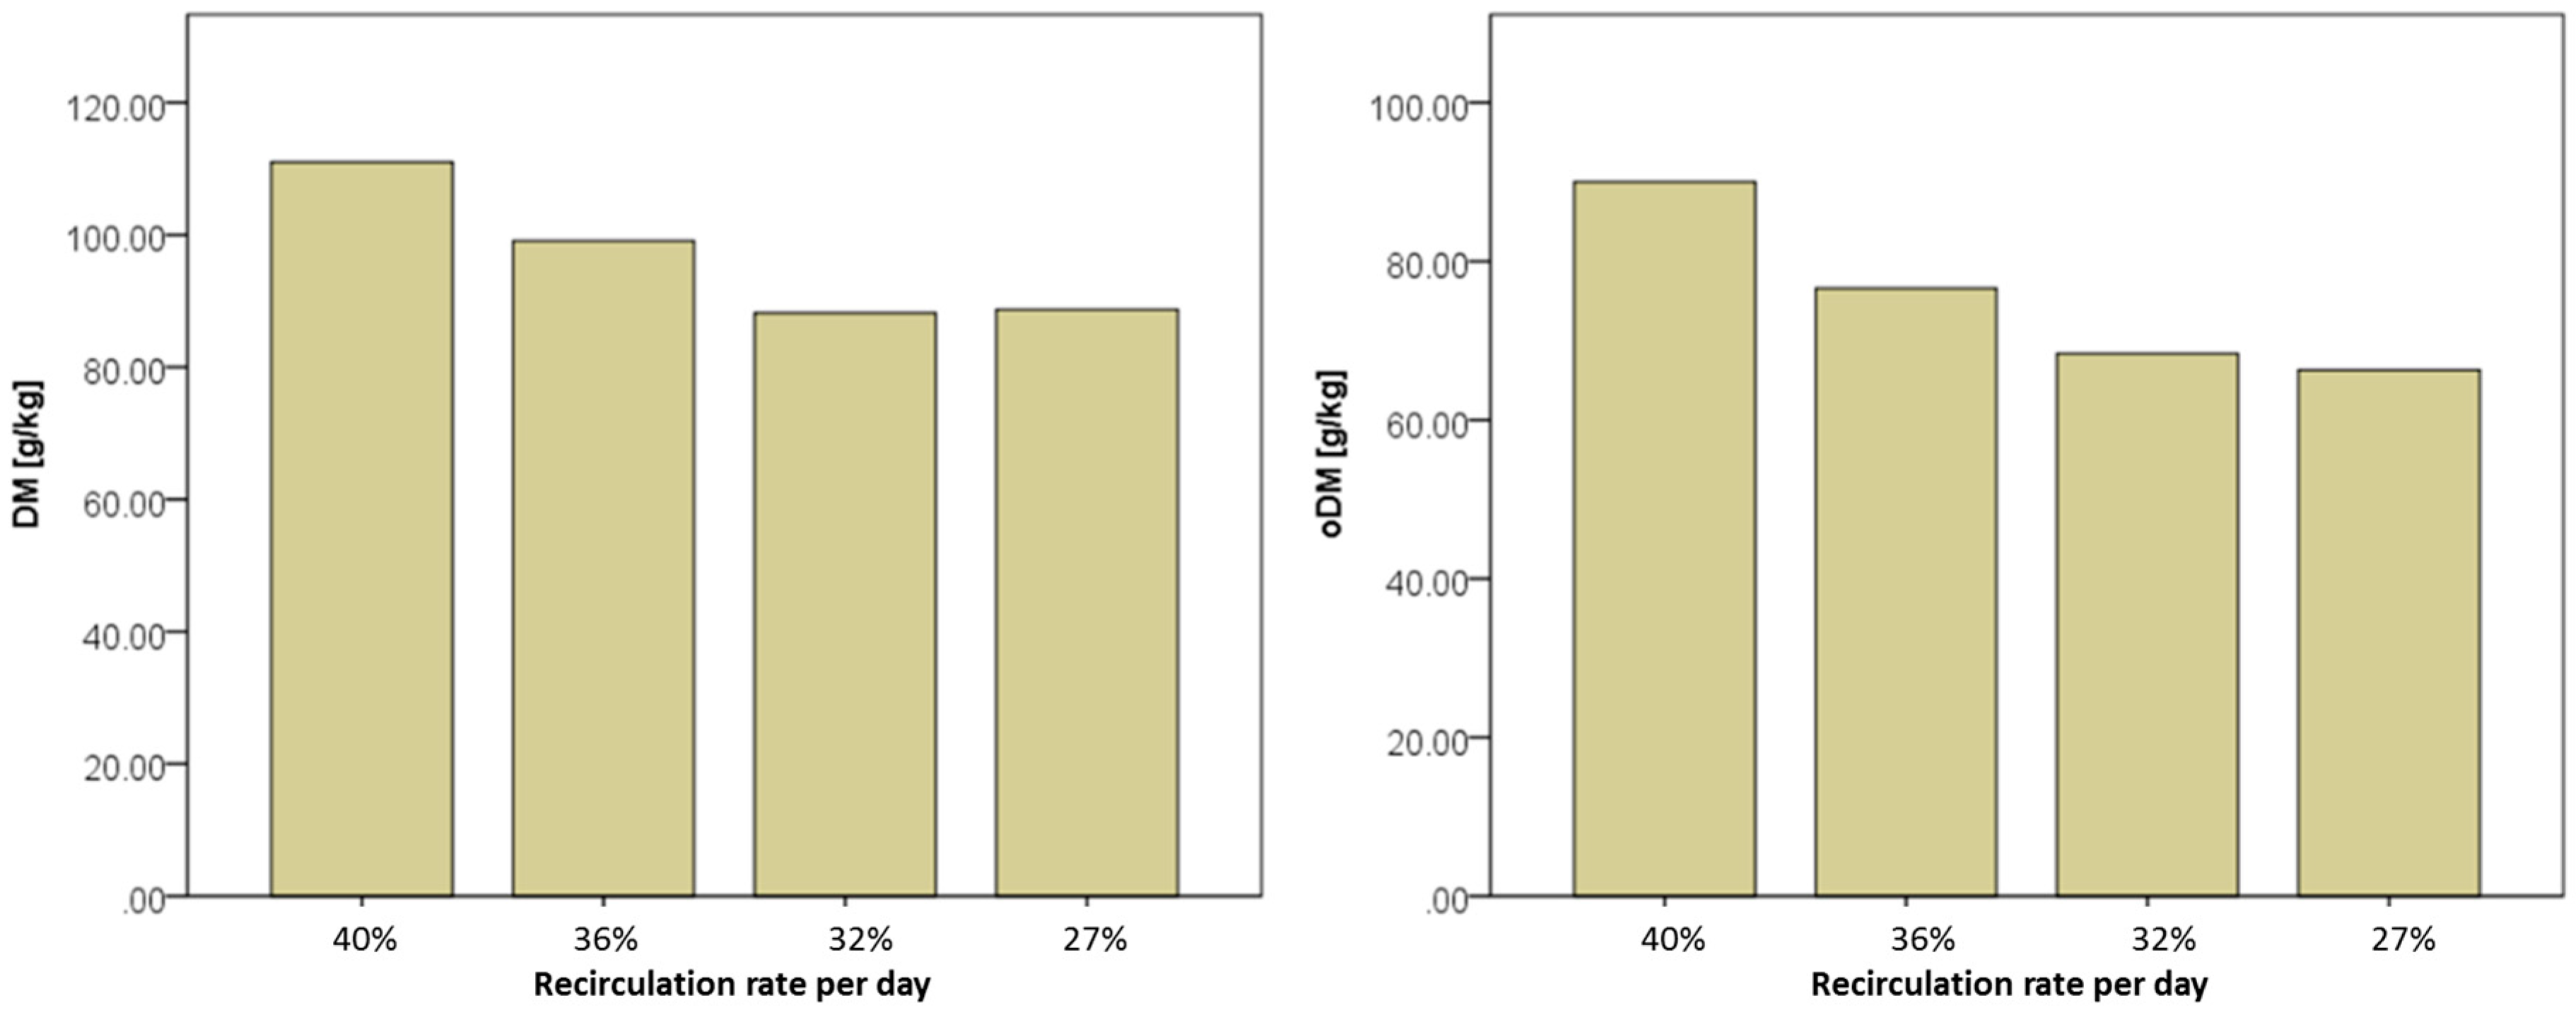
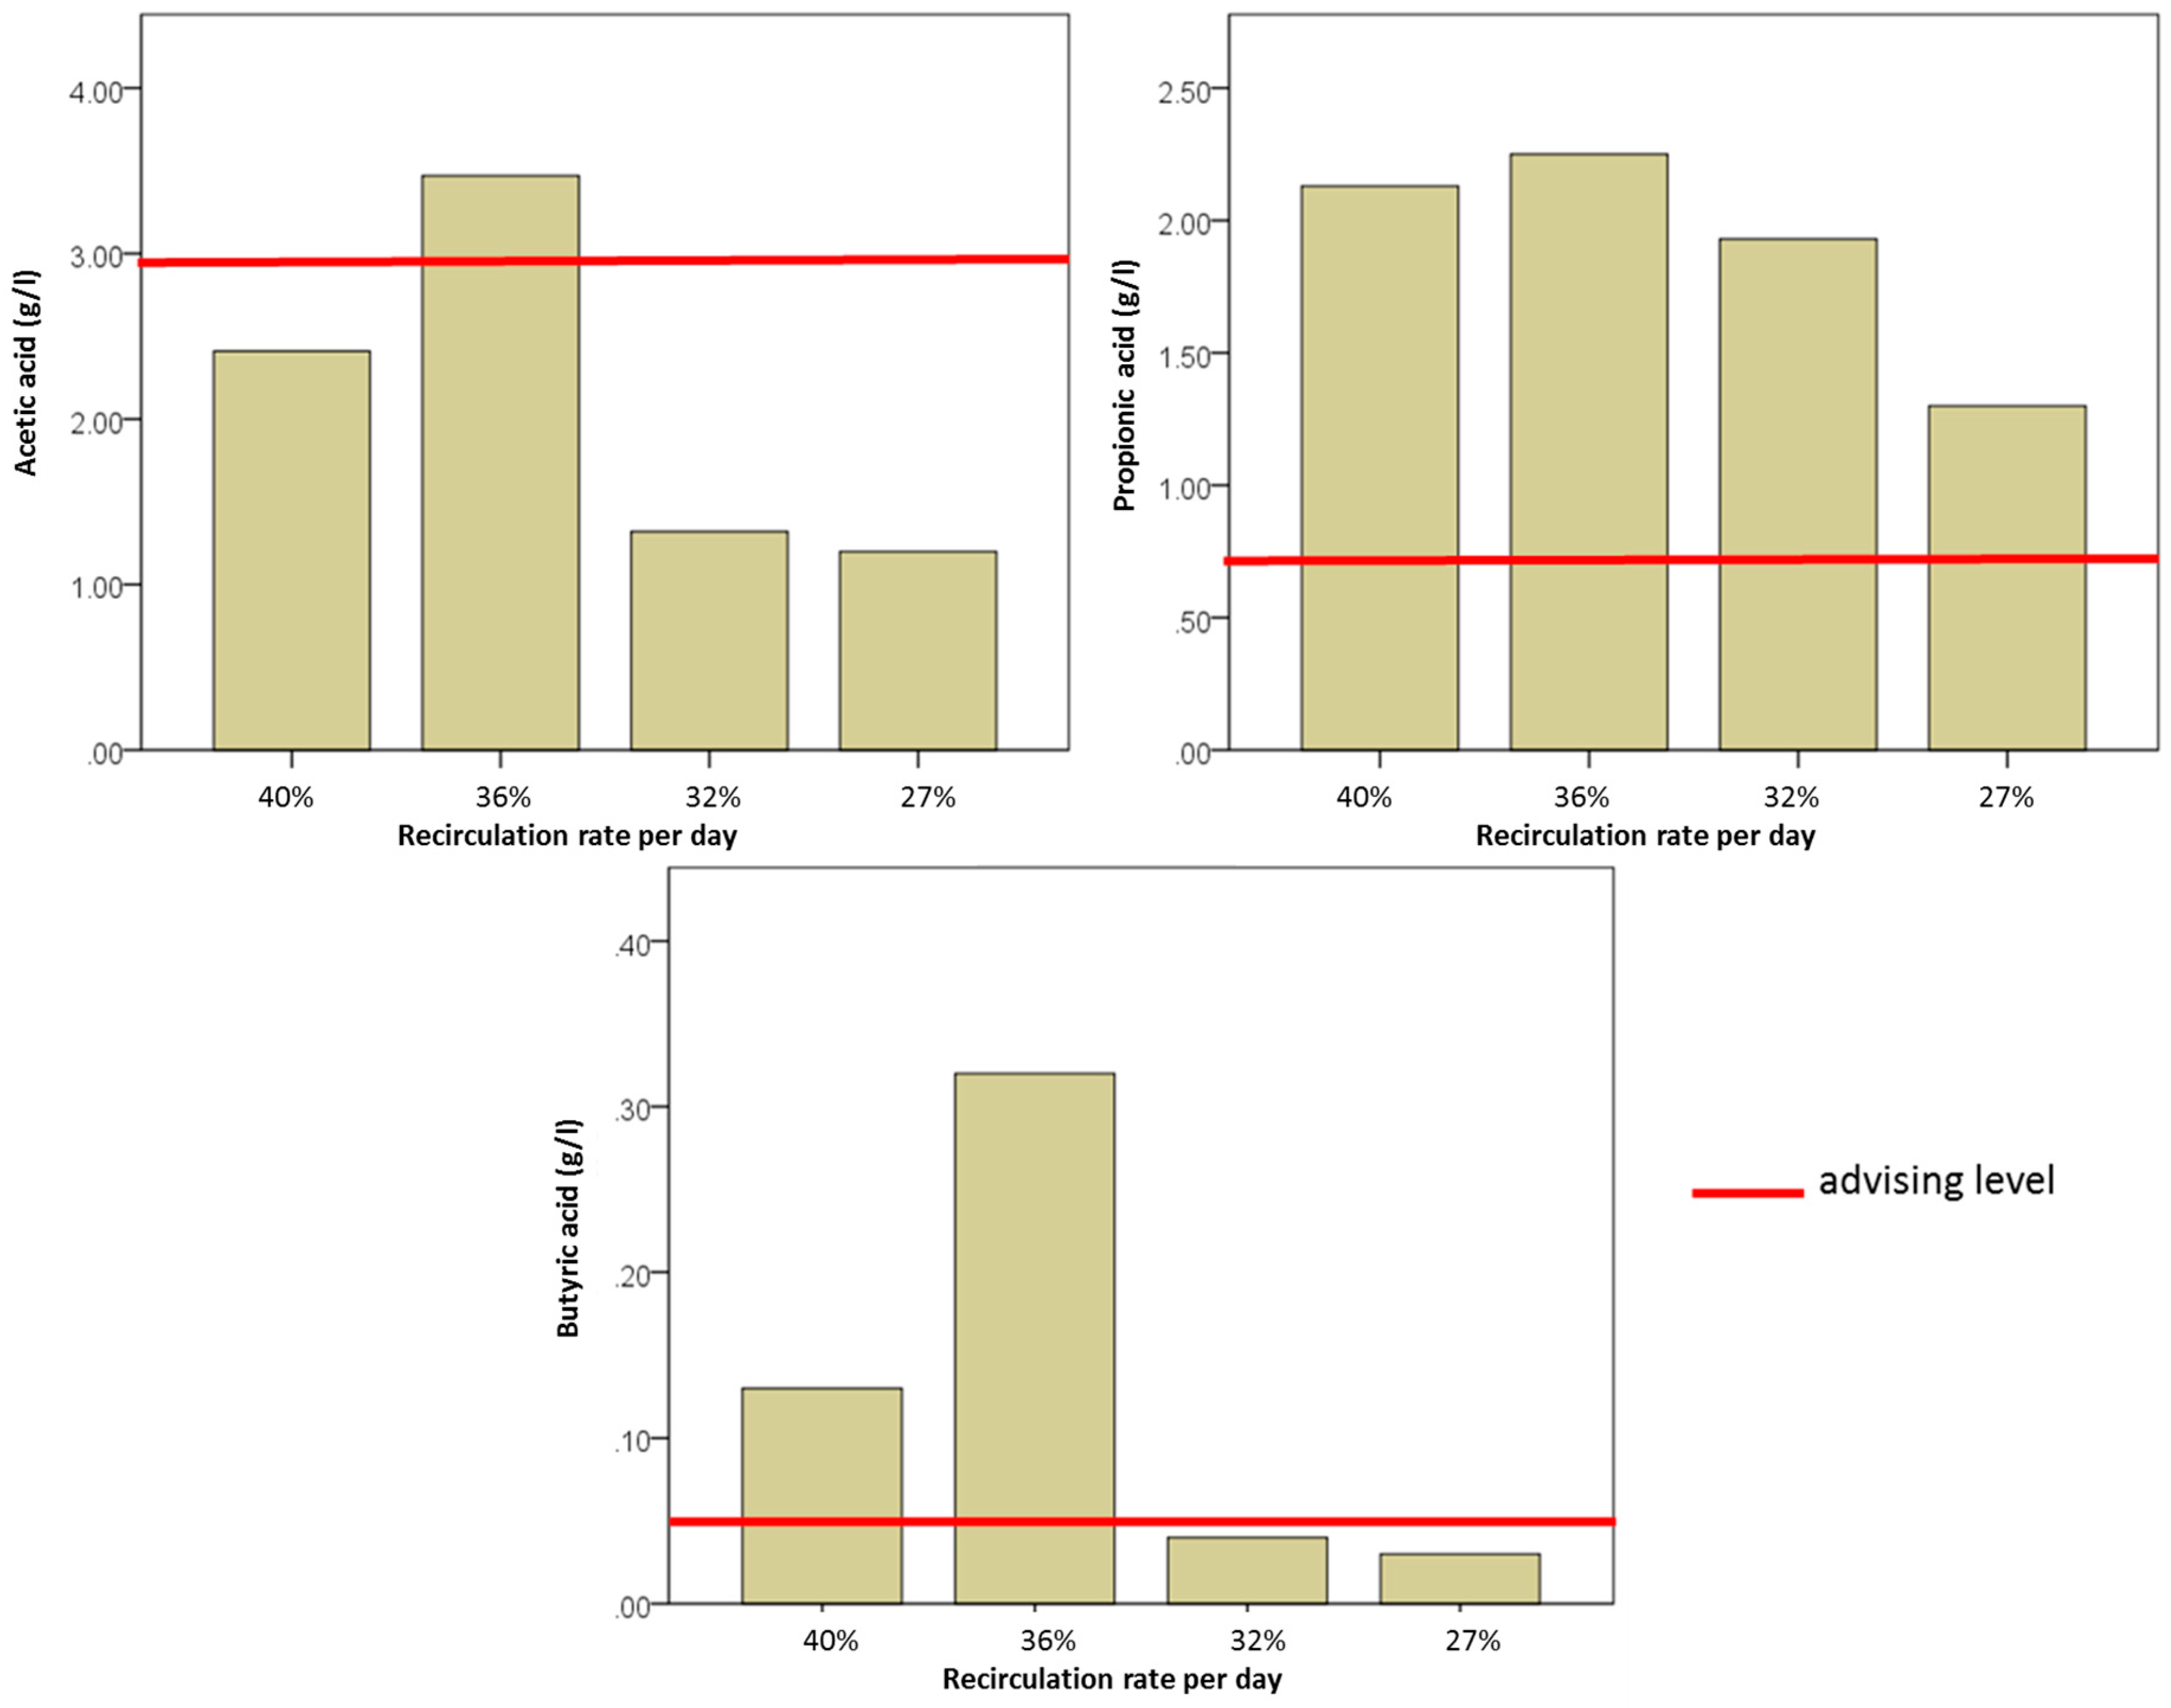
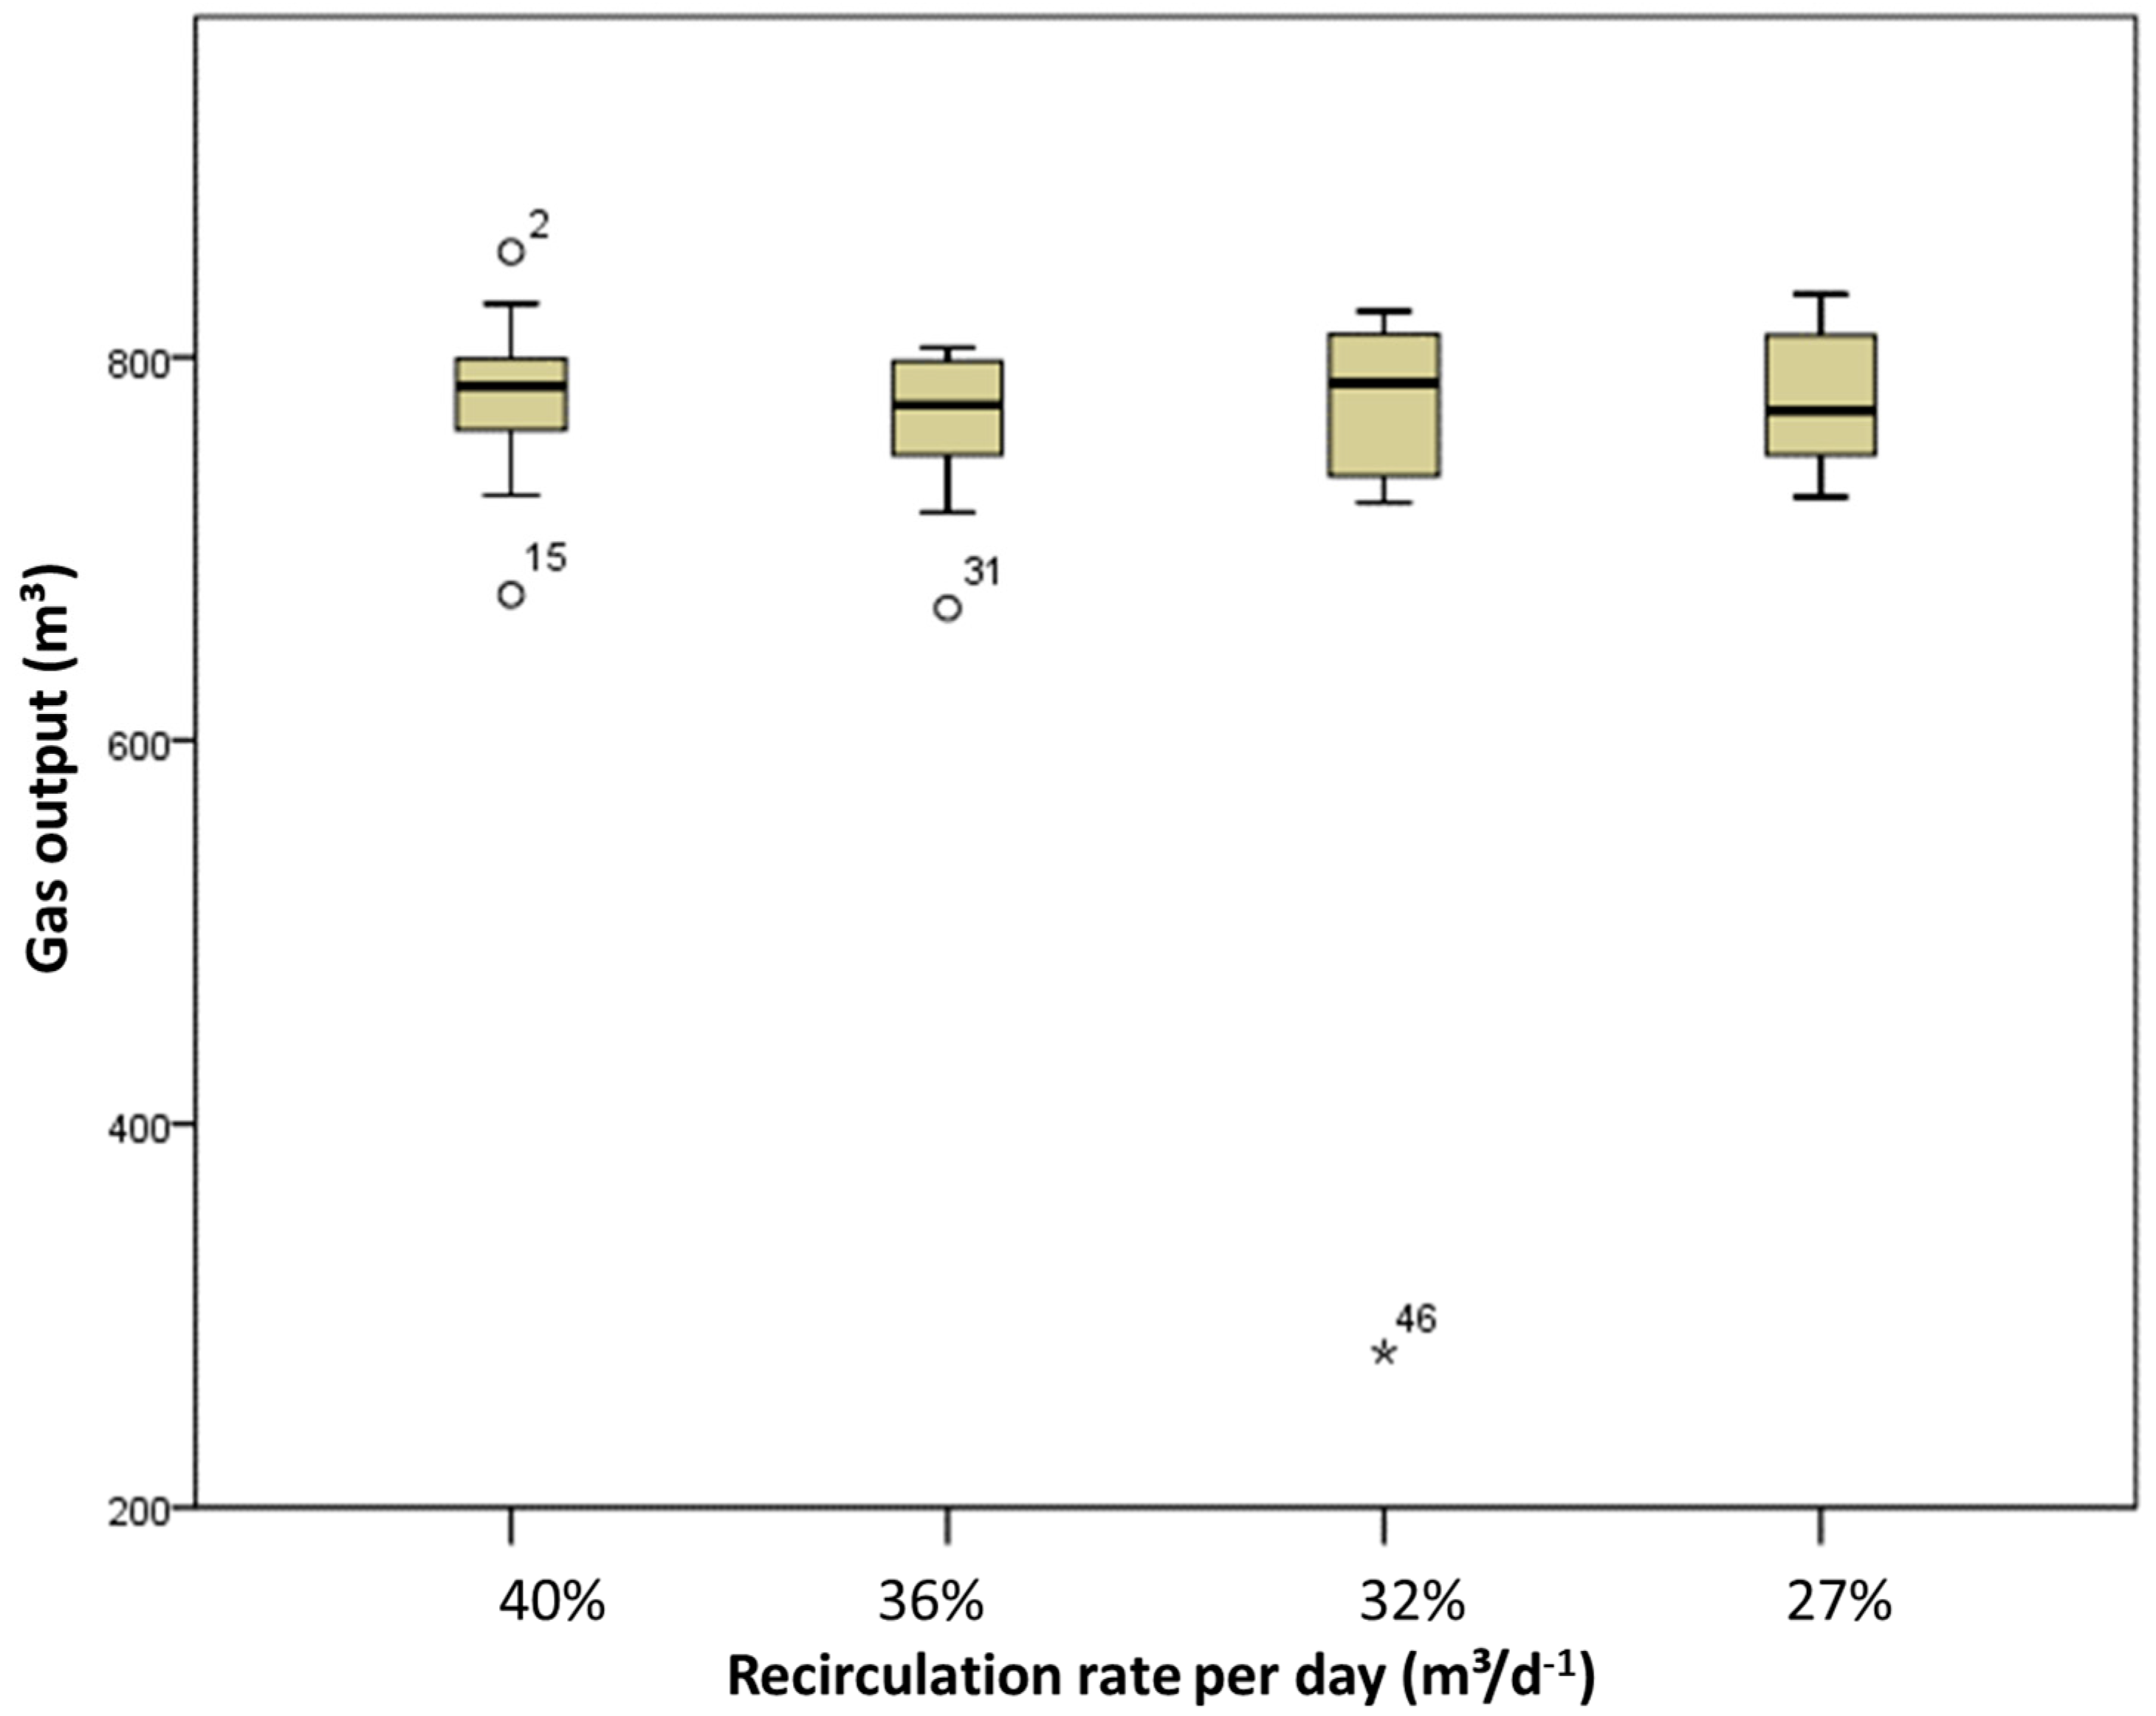
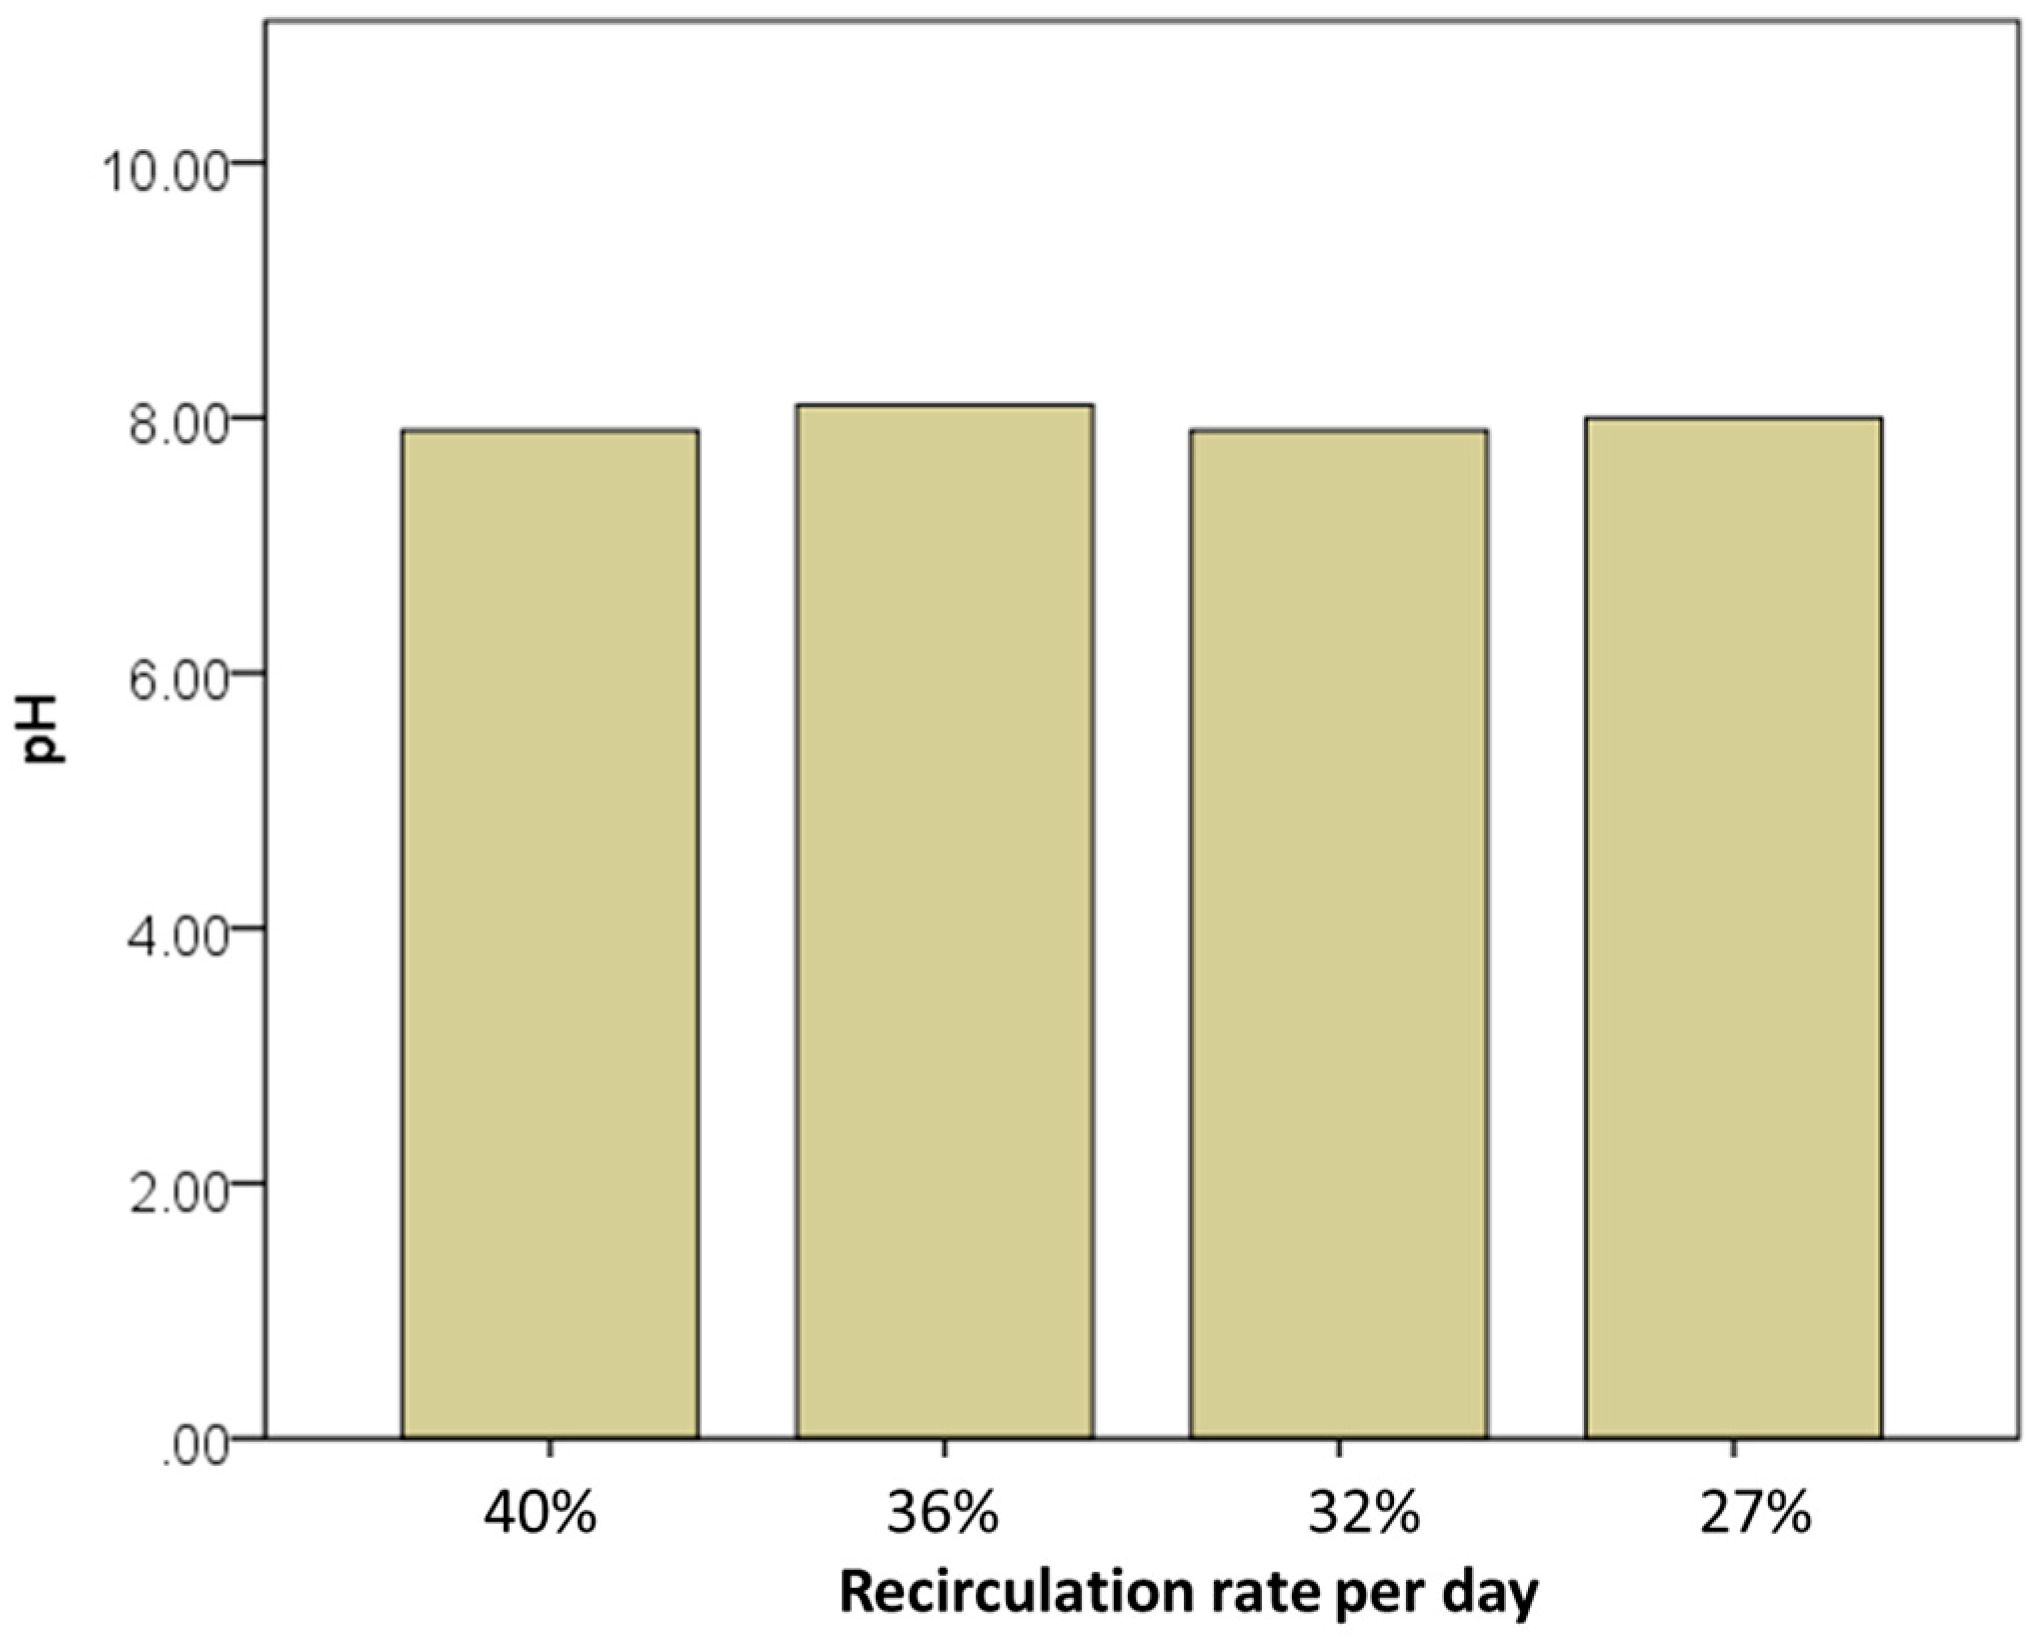
3. Results and Discussion

The reduction in the RA of digested substrate from the second fermenter to the first fermenter affected the biological structure and methane output. RAs of 10.0, 8.5, 7.0 and 5.5 m3/d were compared using the technical parameters OLR and HRT; methane output and biological parameters such as pH, dry matter (DM) and organic dry matter (oDM) content; and butyric, acetic and propionic acid concentrations.
The calculated OLR and HRT confirm these values to be the most important parameters describing the functionality of the biogas system with regard to the economic viability of the optimized substrate reduction. The OLR increased (Figure 2) with decreasing RA, and the HRT (Figure 2) decreased during the investigated timeframe. A significant negative correlation of R = −0.912 was calculated for this relationship.
The ORL decreased from 1.97 kg·VS·m3·d [RR 40%; 10 m3·RA/d] to 1.09 kg·VS·m3·d [RR 27%; 5.5 m3·RA/d], and the HRT increased by 22% from an average of 4.21 d to 5.13 d (Figure 2).
The reduction in the RA caused significant variations amongst the test setups in terms of the OLR and the HRT, in contrast to other studies where the recirculation of the liquid fraction of the digestate did not lead to significant differences [27].
In comparison to other investigations, the HRT at a RR 40% (RA of 10 m3/d) is slightly higher than the recommendations made based on their results. An HRT of 3 d has been suggested [21], and Chen et al. [28] determined an efficient and smooth operation of a biogas system using an HRT of 1.8 d (OLR 12.5 kg/m3/day). In contrast to the HRT, the OLR of Chen et al. is approximately 10 times higher than that of this investigation (Figure 3).
In contrast to the technical parameters OLR and HRT, the differences in terms of efficiency, gas output (m3/d) (Figure 3) and energy output (kWh/d) (Figure 4) were not pronounced.
The boxplots in Figure 3 (also in Figure 4 and Figure 5) describe the terms between the 25% and 75% percentile. The black line in the middle of the boxplots defines the median.
The lines above and below the boxplots show the highest as well as the lowest values measured. Values that were categorized as statistical outliers are signified with circles. In Figure 4 also an extreme value can be seen, marked with a little star.
At a RR 40% (RA of 10 m3/d), the gas output is 779 m3/d (σ = ±34.17), amounting to 733 m3/d (σ = ±153.75) on average at an RA of 7 m3/d, with a high standard deviation. At the lowest rate (5.5 m3/d), the gas output is almost as high as that at the first RR Step (40%; RA 10 m3/d).
The energy output exhibits the same trend. First, with a RR 40% (RA of 10 m3/d), an average energy output of 1.789 kWh/d (σ = ±80.98 kWh/d) was measured. This amount decreases to 1.736 kWh/d (σ = ±162.62 kWh/d) (RR 32%; RA 7 m3/d), and at a RR 27% (RA 5.5), it again obtains the current output value (Figure 4).
Nevertheless, both parameters can be fixed so that the RA does not provoke a data break-out, even though there are significant differences amongst the four rates. In practice, it can be assumed that the RA has no major influence on efficiency and economic profit. In contrast, the measurements of the methane content in the biogas showed highly significant variations with the RA levels (Figure 5). At an RA of 8.5 m3/d, the methane content reached its highest average level of 52.6% (σ = ±1.18%). In this example, the OLR is 1.52 kg·VS/m3/d, and the HRT is 4.65 d.
The studies by Babaee and Shayegan [29] and Estevez et al. [30] found the highest methane content at an OLR of approximately 1.4 to 1.5 kg·VS/m3/d and are therefore comparable to our results.
The lowest methane content (51.5%) was measured at a RR 40% (RA 10 m3/d). The OLR here was at a maximum of 1.67 kg·VS/m3/d, and the HRT was 4.21 d. In addition, the spread of the values decreased with decreased RA. This results in a more secure fermentation process, and the actual RR, defined as best practice (40%; RA 10 m3/d), should be reduced.
To examine the possible causes, data of the various biological parameters should be combined with data of the technical parameters. In Figure 6, the dry matter (DM) and organic dry matter (oDM) contents are presented for all RRs. A decreased substrate input causes the DM and oDM contents of the biogas substrate to decrease. As mentioned in Table 1, the ratio of the SR to the ST is high, namely, one third of the substrate used in fermentation is based on the recirculated biogas substrate. With the lowest RR, 13% less substrate input was measured. With higher DM and oDM contents, the recirculated substrate was found not only to dilute the mature but also to be an important source of fermentation material.
Further examining the fermentation of the organic material, the biogas process can be separated into four main stages. During acidogenesis and acetogenesis (the second and third stage), organic acids were the main end products and were used as raw materials for the last stage, methanogenesis, where methane is produced as an end product.
During this investigation, we demonstrated that an increasing RR results in lower concentrations of various organic acids (Figure 7) and leads to a positive effect on the acid concentration as well as in the pH-regulation. The acetic-acid content varies between 3.5 and 1.2 g/L and is 50% lower at a RR of 27% (RA 5.5 m3/d) compared to a RR of 40% (RA 10.0 m3/d).
The acetic acid content of the biogas fermentation should be <3.0 g/L, the propionic acid content should be <0.6 g/L, and the butyric acid content should be <0.05 g/L [31]. In contrast, Gourdon and Vermande [32] claimed that a propionic acid content of up to 6.0 g/L has no toxic effect on the methanogenesis based on their investigation. Overall, the propionic acid content should not be higher than 50% of the acetic acid content. This is justified by the fact that propionic acid cannot be recovered by methanogens. Otherwise, a malfunction in the biogas process could result [31].
The propionic acid concentration decreases by 60% from 2.13 g/L (RR 40%) to 1.3 g/L (RR 27%), and the butyric acid content decreases by 23% from 0.13 g/L (RR 40%) to 0.03 g/L (RR 27%). When comparing the propionic acid concentration to the acetic acid content, the 50% difference proposed by KTBL [31] could not be observed for every recirculation rate. The propionic acid content is almost equal to the acetic acid concentration, and for RRs of 32% and 27%, the content is even higher. Only at a RR of 36% is the optimal relationship obtained. As a consequence, the methanogenesis process could be disturbed. Munk et al. [16] stated that acidification reactions at low OLRs may occur. This is in line with our own results and the observed imbalance of the acetic acid concentration with the propionic acid content. However, it should be noted that from the beginning, at a RR of 40%, the acetic acid and propionic acid contents are imbalanced. The results of other authors demonstrate that a positive effect can be achieved based on the RR via dilution, the lack of volatile fatty acid inhibition and better pH regulation [21].
Exceeding of the optimal acid concentration for fermentation is also observed based on the measured pH values for all four RAs. Normally, the optimal pH value for thermophilic biogas plants is approximately 6.5 to 7.5 [8,33]. During this investigation, the pH value of the biogas substrate was approximately 7.9 to 8.1 (Figure 8). There was no significant decrease or increase in pH observed based on changes in the RA. Zuo et al. [18] recognised that the pH decreases with increasing OLR. This observation could not be confirmed by this investigation. Generally, it should be noted that the measured pH is above the optimal value, with a tendency to be basic. Moreover, the anticipated effect of the dilution of the substrate within the first fermenter with increased RR was not observed.
Recalling the positive trend followed by the methane concentration of the biogas resulting from the decreased RR, it should be noted that a high acid concentration did not have a negative effect on the methane yield of the investigated biogas plant. However, with the decreasing acid content approaching the optimal range and the required ratio of acetic acid to propionic acid, the fermentation process was observed to have stabilized based on the increasing methane content and smaller variations in the concentrations.
The second question concerning the use of the RR as a control mechanism could not be clearly answered based on the results generated using the various parameters. The RR was found to have a significant influence on the main technical as well as biological parameters. The concentrations of the most important acids decreased during fermentation at lower recirculation rates. Thus, the RR can be used to control the acid contents within a certain framework without the use of other critical additives.

4. Conclusions

Starting with a RR of 40%, which is the standard recommendation (“best practice”), the RA was decreased by 1.5 m3 every ten days for a total of four times. A significant change in OLR and HRT could be observed in addition to the anticipated negative correlation of OLR to HRT. However, the use of the RR as a control mechanism for biogas parameters cannot be recommended.
Because of the decreased RR, a stabilisation of the fermentation process could be obtained, and an increasing methane yield and smaller variations in the measured terms were observed. The acid concentrations were analysed as a possible reason for these results. During this investigation, the acid concentrations were higher than the optimal levels. An approximation of the optimum concentration could be obtained with decreased recirculation.
Using a combination of the measured parameters (OLR, HRT, methane content, acid concentration) and a comparison based on varying the RR, the proposed so-called “best practice” could not be confirmed with our results. A RR of 27% provided the best efficiency for this investigated biogas plant.

Acknowledgments

This work was financially supported by Fachagentur Nachwachsende Rohstoffe e.V. (FNR). The authors acknowledge Stefan Bleser and Benedikt Humpert for their experimental and technical support.

Author Contributions

All authors contributed equally in the creation of this paper.

Conflicts of Interest

The authors declare no conflict of interest.

Nomenclature

cconcentration of organic matter (volatile solids) (% VS)
HRThydraulic retention time
LUlivestock unit (500 kg body weight)
m ˙ substrate added per unit of time (kg/d)
oDMorganic dry matter
OLRorganic loading rate
RArecirculation amount
V ˙ volume of substrate added daily
VRreactor volume m3
VSvolatile solids or organic dry matter

References

  1. Asam, Z.; Poulsen, T.G.; Nizami, A.; Rafique, R.; Kiely, G.; Murphy, J.D. How can we improve biomethane production per unit of feedstock in biogas plants? Appl. Energy 2011, 88, 2013–2018. [Google Scholar] [CrossRef]
  2. Chynoweth, D.P.; Owens, J.M.; Legrand, R. Renewable methane from anaerobic digestion of biomass. Renew. Energy 2001, 22, 1–8. [Google Scholar] [CrossRef]
  3. Esposito, G.; Frunzo, L.; Panico, A.; Pirozzi, F. Enhanced bio-methane production from co-digestion of different organic wastes. Environ. Technol. 2012, 33, 2733–2740. [Google Scholar] [CrossRef] [PubMed]
  4. Buhr, H.O.; Andrews, J.F. The thermophilic anaerobic digestion process. Water Res. 1977, 11, 129–143. [Google Scholar] [CrossRef]
  5. Ahring, B.K. Methanogenesis in thermophilic biogas reactors. Antonie Van Leeuwenhoek 1995, 67, 91–102. [Google Scholar] [CrossRef] [PubMed]
  6. Pap, B.; Györkei, Á.; Boboescu, I.Z.; Nagy, I.K.; Bíró, T.; Kondorosi, É.; Maróti, G. Temperature-dependent transformation of biogas-producing microbial communities points to the increased importance of hydrogenotrophic methanogenesis under thermophilic operation. Bioresour. Technol. 2015, 177, 375–380. [Google Scholar] [CrossRef] [PubMed]
  7. Hartmann, H.; Ahring, B.K. Strategies for the anaerobic digestion of the organic fraction of municipal solid waste: An overview. Water Sci. Technol. 2006, 53, 7–22. [Google Scholar] [CrossRef] [PubMed]
  8. Ward, A.J.; Hobbs, P.J.; Holliman, P.J.; Jones, D.L. Optimisation of the anaerobic digestion of agricultural resources. Bioresour. Technol. 2008, 99, 7928–7940. [Google Scholar] [CrossRef] [PubMed]
  9. Panico, A.; D’Antonio, G.; Esposito, G.; Frunzo, L.; Iodice, P.; Pirozzi, F. The effect of substrate-bulk interaction on hydrolysis modelling in anaerobic digestion process. Sustainability 2014, 6, 8348–8363. [Google Scholar] [CrossRef]
  10. Yadvika, S.; Santosh, T.R.; Sreekrishnan, T.R.; Kohli, S.; Rana, V. Enhancement of biogas production from solid substrates using different techniques—A review. Bioresour. Technol. 2004, 95, 1–10. [Google Scholar] [CrossRef] [PubMed]
  11. Mahmoud, N.; Zeeman, G.; Gijzen, H.; Lettinga, G. Solids removal in upflow anaerobic reactors, a review. Bioresour. Technol. 2003, 90, 1–9. [Google Scholar] [CrossRef]
  12. Michele, P.; Giuliana, D.; Carlo, M.; Sergio, S.; Fabrizio, A. Optimization of solid state anaerobic digestion of the OFMSW by digestate recirculation: A new approach. Waste Manag. 2015, 35, 111–118. [Google Scholar] [CrossRef] [PubMed]
  13. Nordberg, Å.; Jarvis, A.; Stenberg, B.; Mathisen, B.; Svensson, B.H. Anaerobic digestion of alfalfa silage with recirculation of process liquid. Bioresour. Technol. 2007, 98, 104–111. [Google Scholar] [CrossRef] [PubMed]
  14. Bories, A.; Raynal, J.; Bazile, F. Anaerobic digestion of high-strength distillery wastewater (cane molasses stillage) in a fixed-film reactor. Biol. Wastes 1988, 23, 251–267. [Google Scholar] [CrossRef]
  15. Rincón, B.; Borja, R.; González, J.M.; Portillo, M.C.; Sáiz-Jiménez, C. Influence of organic loading rate and hydraulic retention time on the performance, stability and microbial communities of one-stage anaerobic digestion of two-phase olive mill solid residue. Biochem. Eng. J. 2008, 40, 253–261. [Google Scholar] [CrossRef]
  16. Munk, B.; Bauer, C.; Gronauer, A.; Lebuhn, M. Population dynamics of methanogens during acidification of biogas fermenters fed with maize silage. Eng. Life Sci. 2010, 10, 496–508. [Google Scholar] [CrossRef]
  17. Estevez, M.M.; Sapci, Z.; Linjordet, R.; Schnürer, A.; Morken, J. Semi-continuous anaerobic co-digestion of cow manure and steam-exploded Salix with recirculation of liquid digestate. J. Environ. Manag. 2014, 136, 9–15. [Google Scholar] [CrossRef] [PubMed]
  18. Zuo, Z.; Wu, S.; Zhang, W.; Dong, R. Performance of two-stage vegetable waste anaerobic digestion depending on varying recirculation rates. Bioresour. Technol. 2014, 162, 266–272. [Google Scholar] [CrossRef] [PubMed]
  19. Jarvis, S.; Nordberg, Å.; Mathisen, B.; Svensson, B.H. Stimulation of conversion rates and bacterial activity in a silage-fed two-phase biogas process by initiating liquid recirculation. Antonie Van Leeuwenhoek 1995, 68, 317–327. [Google Scholar] [CrossRef] [PubMed]
  20. Baader, W.; Braunschweig, F.R. Performance of completely filled vertical through-flow anaerobic digester. In Alternative Sources of Energy for Agriculture; FFTC Book Series 28; FFTC: Taipei, Taiwan, 1985; pp. 51–65. [Google Scholar]
  21. Zuo, Z.; Wu, S.; Zhang, W.; Dong, R. Effects of organic loading rate and effluent recirculation on the performance of two-stage anaerobic digestion of vegetable waste. Bioresour. Technol. 2013, 146, 556–561. [Google Scholar] [CrossRef] [PubMed]
  22. Aslanzadeh, S.; Rajendran, K.; Jeihanipour, A.; Taherzadeh, M. The effect of effluent recirculation in a semi-continuous two-stage anaerobic digestion system. Energies 2013, 6, 2966–2981. [Google Scholar] [CrossRef]
  23. British Standards Institution. EN 12176:1998: Characterization of Sludge. Determination of pH Value; 13.030.20; BSI: London, UK, 1998. [Google Scholar]
  24. British Standards Institution. EN 12880:2000: Characterization of Sludges. Determination of Dry Residue and Water Content; 13.030.20; BSI: London, UK, 2000. [Google Scholar]
  25. British Standards Institution. EN 12879:2000: Characterization of Sludges. Determination of the Loss of Ignition of Dry Mass; 13.030.20; BSI: London, UK, 2000. [Google Scholar]
  26. Al Seadi, T.; Rutz, D.; Prassl, H.; Köttner, M.; Finsterwalder, T.; Volk, S.; Janssen, R. Biogas Handbook; University of Southern Denmark: Esbjerg, Denmark, 2008. [Google Scholar]
  27. Hu, Y.; Shen, F.; Yuan, H.; Zou, D.; Pang, Y.; Liu, Y.; Zhu, B.; Chufo, W.A.; Jaffar, M.; Li, X. Influence of recirculation of liquid fraction of the digestate (LFD) on maize stover anaerobic digestion. Biosyst. Eng. 2014, 127, 189–196. [Google Scholar] [CrossRef]
  28. Chen, Y.; Rößler, B.; Zielonka, S.; Wonneberger, A.; Lemmer, A. Effects of organic loading rate on the performance of a pressurized anaerobic filter in two-phase anaerobic digestion. Energies 2014, 7, 736–750. [Google Scholar] [CrossRef]
  29. Babaee, A.; Shayegan, J. Effect of organic loading rates (OLR) on production of methane from anaerobic digestion of vegetables waste. In Proceedings of the World Renewable Energy Congress, Linköping, Sweden, 8–13 May 2011.
  30. Estevez, M.M.; Linjordet, R.; Morken, J. Organic loading rate effect on anaerobic digestion: Case study on co digestion of lignocellulosic pre-treated material with cow manure. In Proceedings of the International Conference of Agricultural Engineering, Valencia, Spain, 8–12 July 2012.
  31. Kuratorium für Technik und Bauwesen in der Landwirtschaft (KTBL). Faustzahlen Biogas: 3. Ausgabe, Tabellenwerk, Kuratorium für Technik und Bauwesen in der Landwirtschaft; Kuratorium für Technik und Bauwesen in der Landwirtschaft: Darmstadt, Germany, 2013. [Google Scholar]
  32. Gourdon, R.; Vermande, P. Effects of propionic acid concentration on anaerobic digestion of pig manure. Biomass 1987, 13, 1–12. [Google Scholar] [CrossRef]
  33. Zhang, T.; Mao, C.; Zhai, N.; Wang, X.; Yang, G. Influence of initial pH on thermophilic anaerobic co-digestion of swine manure and maize stalk. Waste Manag. 2015, 35, 119–126. [Google Scholar] [CrossRef] [PubMed]
Figure 1. “Functional elements” of the investigated biogas plant. 1: CHP; 2: Control room; 3: solids fedders 4: Fermenter dump (slurry); 5: Agiator; 6: Fermenter; 7: Gas storage; 8: Secondary fermenter; 9: Paddle-giant; 10: Final storage; 11: Agiator.
Energies 10 00325 g001
Figure 2. Linear regression of the OLR and the HRT (R = −0.912; p < 0.05).
Energies 10 00325 g002
Figure 3. Gas output as a function of recirculation rate (p < 0.05).
Energies 10 00325 g003
Figure 4. Energy output as a function of recirculation rate (p < 0.05).
Energies 10 00325 g004
Figure 5. Methane content in the biogas as a function of recirculation rate (p < 0.05).
Energies 10 00325 g005
Figure 6. Dry matter (DM) and organic dry matter (oDM) contents in the biogas substrate as a function of recirculation rate.
Energies 10 00325 g006
Figure 7. Acetic, propionic and butyric acid contents of the biogas substrate as a function of recirculation rate.
Energies 10 00325 g007
Figure 8. pH as a function of recirculation rate.
Energies 10 00325 g008
Table 1. Input volumes of fresh substrate (SF) and recirculated substrate (SR).
RA (SR) m3/dPercentage of Fermenter Volume (120 m3)Fresh Substrate (SF) m3/dTotal Substrate Input (ST) m3/dRR Ratio of SR to ST
TheoreticalIn Practice
10.08%15.025.024.840%
8.57%15.023.523.736%
7.06%15.022.022.332%
5.55%15.020.520.627%

