Article

Wind Turbine Power Curve Design for Optimal Power Generation in Wind Farms Considering Wake Effect

1
Department of Energy Technology, Aalborg University, 9220 Aalborg, Denmark
2
Sino-Danish Centre for Education and Research, 8000 Aarhus, Denmark
*
Author to whom correspondence should be addressed.
Energies 2017, 10(3), 395; https://doi.org/10.3390/en10030395
Submission received: 2 December 2016 / Revised: 14 March 2017 / Accepted: 15 March 2017 / Published: 20 March 2017
(This article belongs to the Collection Wind Turbines)

Abstract

:
In modern wind farms, maximum power point tracking (MPPT) is widely implemented. Using the MPPT method, each individual wind turbine is controlled by its pitch angle and tip speed ratio to generate the maximum active power. In a wind farm, the upstream wind turbine may cause power loss to its downstream wind turbines due to the wake effect. According to the wake model, downstream power loss is also determined by the pitch angle and tip speed ratio of the upstream wind turbine. By optimizing the pitch angle and tip speed ratio of each wind turbine, the total active power of the wind farm can be increased. In this paper, the optimal pitch angle and tip speed ratio are selected for each wind turbine by the exhausted search. Considering the estimation error of the wake model, a solution to implement the optimized pitch angle and tip speed ratio is proposed, which is to generate the optimal control curves for each individual wind turbine off-line. In typical wind farms with regular layout, based on the detailed analysis of the influence of pitch angle and tip speed ratio on the total active power of the wind farm by the exhausted search, the optimization is simplified with the reduced computation complexity. By using the optimized control curves, the annual energy production (AEP) is increased by 1.03% compared to using the MPPT method in a case-study of a typical eighty-turbine wind farm.

1. Introduction

In recent years, wind power has increasingly been integrated into the power system worldwide. According to the International Energy Agency (IEA) wind report [1], wind energy production provided close to 4% of the world’s electricity demand in 2015. In many countries, the development of large-scale wind farms has already been started and tended to move from onshore to offshore. In 2015, the offshore wind sector had a strong year, with an estimated 3.4 GW connected to the power grid out of a world total amount of 12 GW. In wind farms, especially large-scale ones, the power loss due to the wake effect came to be of particular importance.
According to a field investigation from onshore wind farms, the power loss due to the wake effect is about 5%–10% of overall power generation [2]. Because of the higher investment in offshore wind farms, the per-unit installation area is lower than for onshore wind farms. Thus, the power loss due to the wake effect in large-scale offshore wind farms may reach a higher value, up to approximately 15% [3,4]. In modern wind farms, a widely implemented active power control method is maximum power point tracking (MPPT) [5,6]. Each wind turbine is controlled by the MPPT method to generate the maximum active power at its current wind speed, without the consideration of the power loss due to the wake effect in the wind farm.
Many researchers have focused on the mitigation of power loss in the wind farm due to the wake effect. By the optimal control of each individual wind turbine, the total active power of the wind farm can be increased. By developing new active power controllers in [7], using the boundary layer tunnel experiments in [8], and analyzing the wind turbine load in [9], the authors concluded that the power loss in the wind farm due to the wake effect can be reduced by optimizing the pitch angle and tip speed ratio of each wind turbine. In [10,11], optimal pitch angle and tip speed ratio of all the wind turbines are selected at the same time by the optimization algorithms to maximize the total active power of the wind farm, where the wind speed of each wind turbine is estimated by the wake model with the ambient wind speed. The optimized pitch angle and tip speed ratio of each wind turbine are supposed to be implemented in the wind farm central controller. Thus, each wind turbine is controlled according to the estimated wind speed. Considering the estimation error of the wake models, there is a difference between the estimated wind speed and the real wind speed at the position of each wind turbine. In the case that the estimated wind speed is higher than the real wind speed, the optimized active power reference can be higher than the available active power. In this case, due to greater output power than input power, the rotor speed will be automatically decreased. Afterwards, according to aerodynamic model, due to the rotor speed decrease, the available active power will be further decreased. Then, the rotor speed will be further decreased. Gradually, the wind turbine will be halted [12]. In [13], the authors calculated the transient wind speed of each wind turbine by the computational fluid dynamics (CFD) method, where the computation complexity is the main drawback of this approach.
In [14,15], online model free optimization methods are proposed to increase the total active power of the wind farm. This method generates the optimal pitch angle and tip speed ratio for each wind turbine by the comparison of the active power of the wind turbine and of its neighborhood wind turbines. The problem with this method is that the algorithm has to wait during the transition of wind conditions, as it takes time for the wind flow to transit from one steady-state condition to another. As acknowledged by the authors, this method is much more suitable for the steady-state wind conditions.
In this paper, firstly, the optimal pitch angle and tip speed ratio of each wind turbine to maximize the total active power of the wind farm are selected by the exhausted search method. Compared with the particle swarm optimization (PSO)- and genetic algorithm (GA)-based optimization methods as adopted in [10,11], the advantage of by the exhausted search method is that the total active powers of the wind farm at all sets of the pitch angle and tip speed ratio of all the wind turbines are calculated. By the comparison of the total active power of the wind farm at all sets of the pitch angle and tip speed ratio of all the wind turbines, the implementation of the optimized pitch angle and tip speed ratio can be simplified. Secondly, considering the estimation error of the wake model, the optimal pitch angle curve and active power curve in terms of the wind speed are generated for each individual wind turbine with the optimized pitch angle and tip speed ratio. The optimized control curves are limited by the maximum rotor speed, the minimum rotor speed and the rated power. With the measurement of the real wind speed, the optimized pitch angle reference and the optimized active power reference can be obtained from the optimized control curves. As a consequence, each wind turbine is controlled according to the real wind speed at the position of the wind turbine. Compared with the method to implement the optimized pitch angle and tip speed ratio in the wind farm central controller, the active power reference will not be higher than the available active power. Thus, the wind turbine will not be halted. By the proposed method, the active power of the wind farm may not be maximized due to the wake model estimation error. However, the optimized control curves can be implemented at the wind directions where the wind farm has large power loss due to the wake effect. At these wind directions, a large amount of active power can be increased. Thus, the estimation error can be neglected.
The remaining part of this paper is organized as follows. The doubly fed induction generator (DFIG) wind turbine and the MPPT method are addressed and described in Section 2. The wake effect and the proposed method to generate the optimized control curves are illustrated by case study in a two-turbine wind farm in Section 3. Afterwards, the case study is extended to a three-turbine wind farm with multi-wake in Section 4. The case study is analyzed in a typical Danish eighty-turbine wind farm with the real wind profile in Section 5. Finally, concluding remarks are drawn in Section 6.

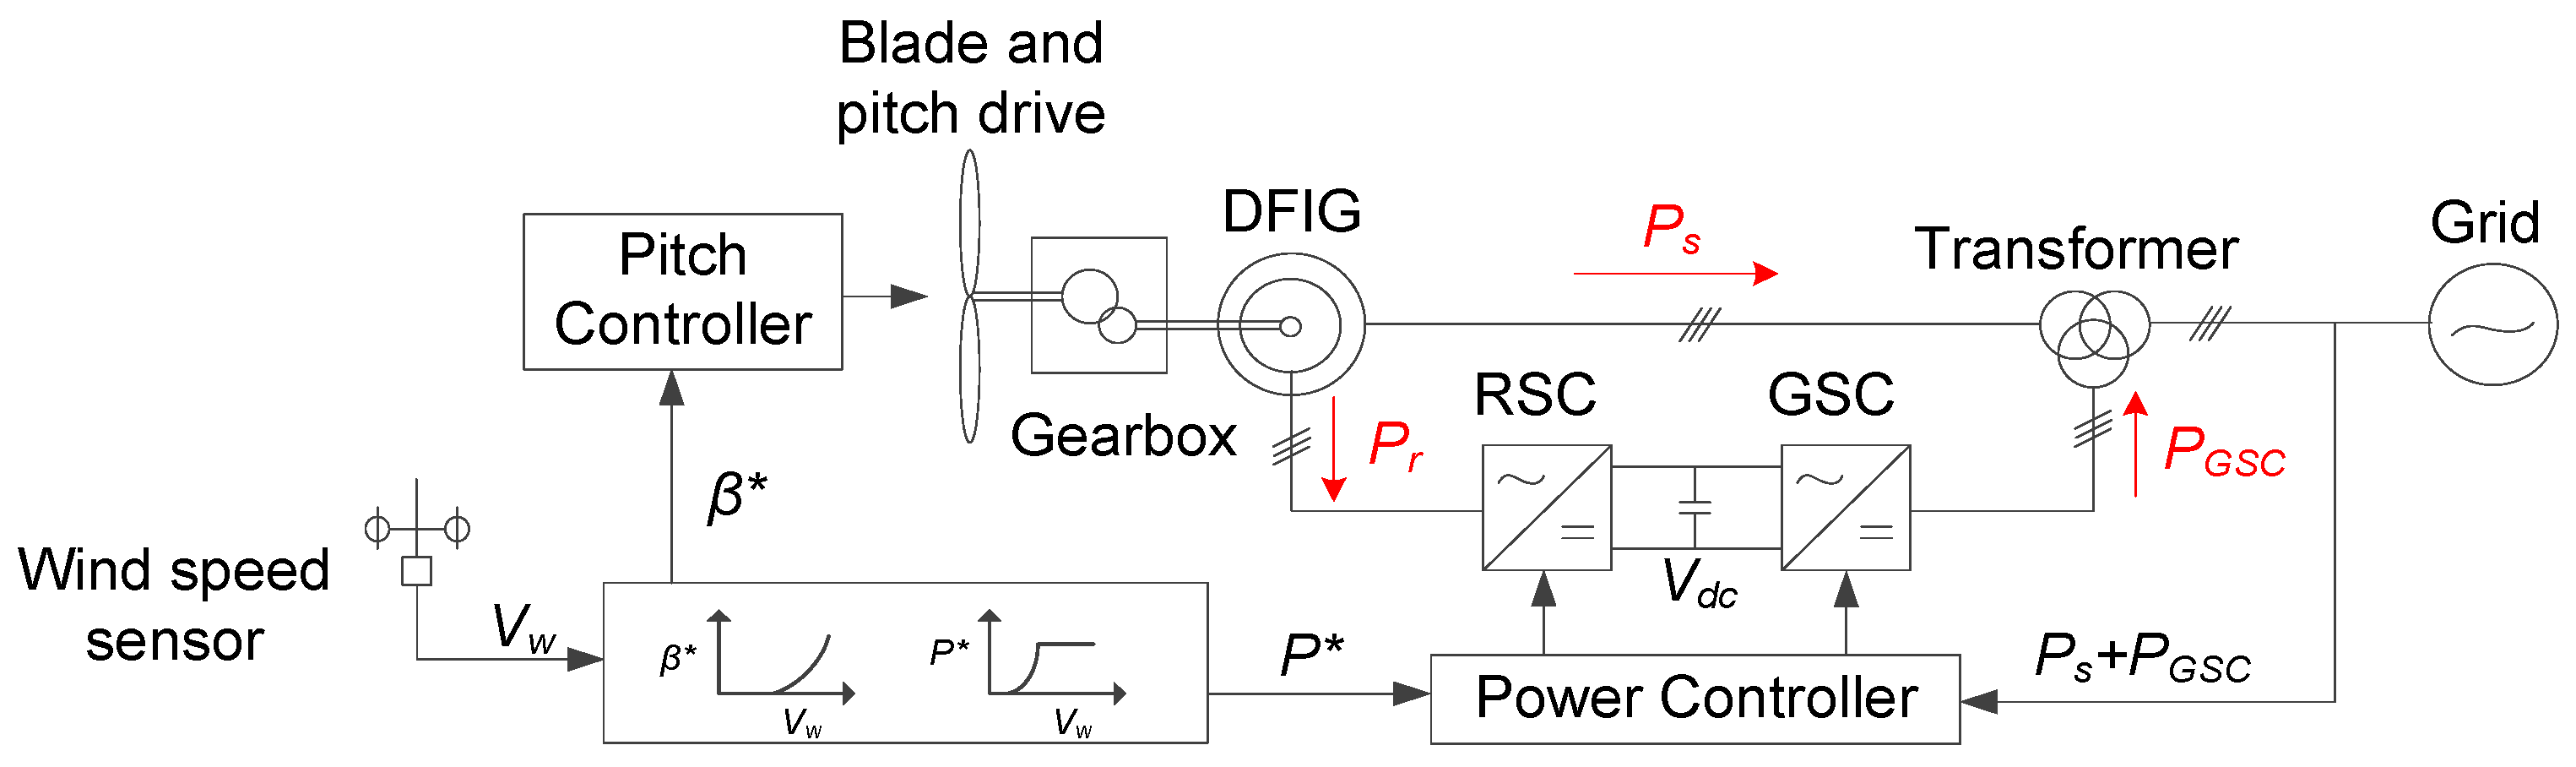
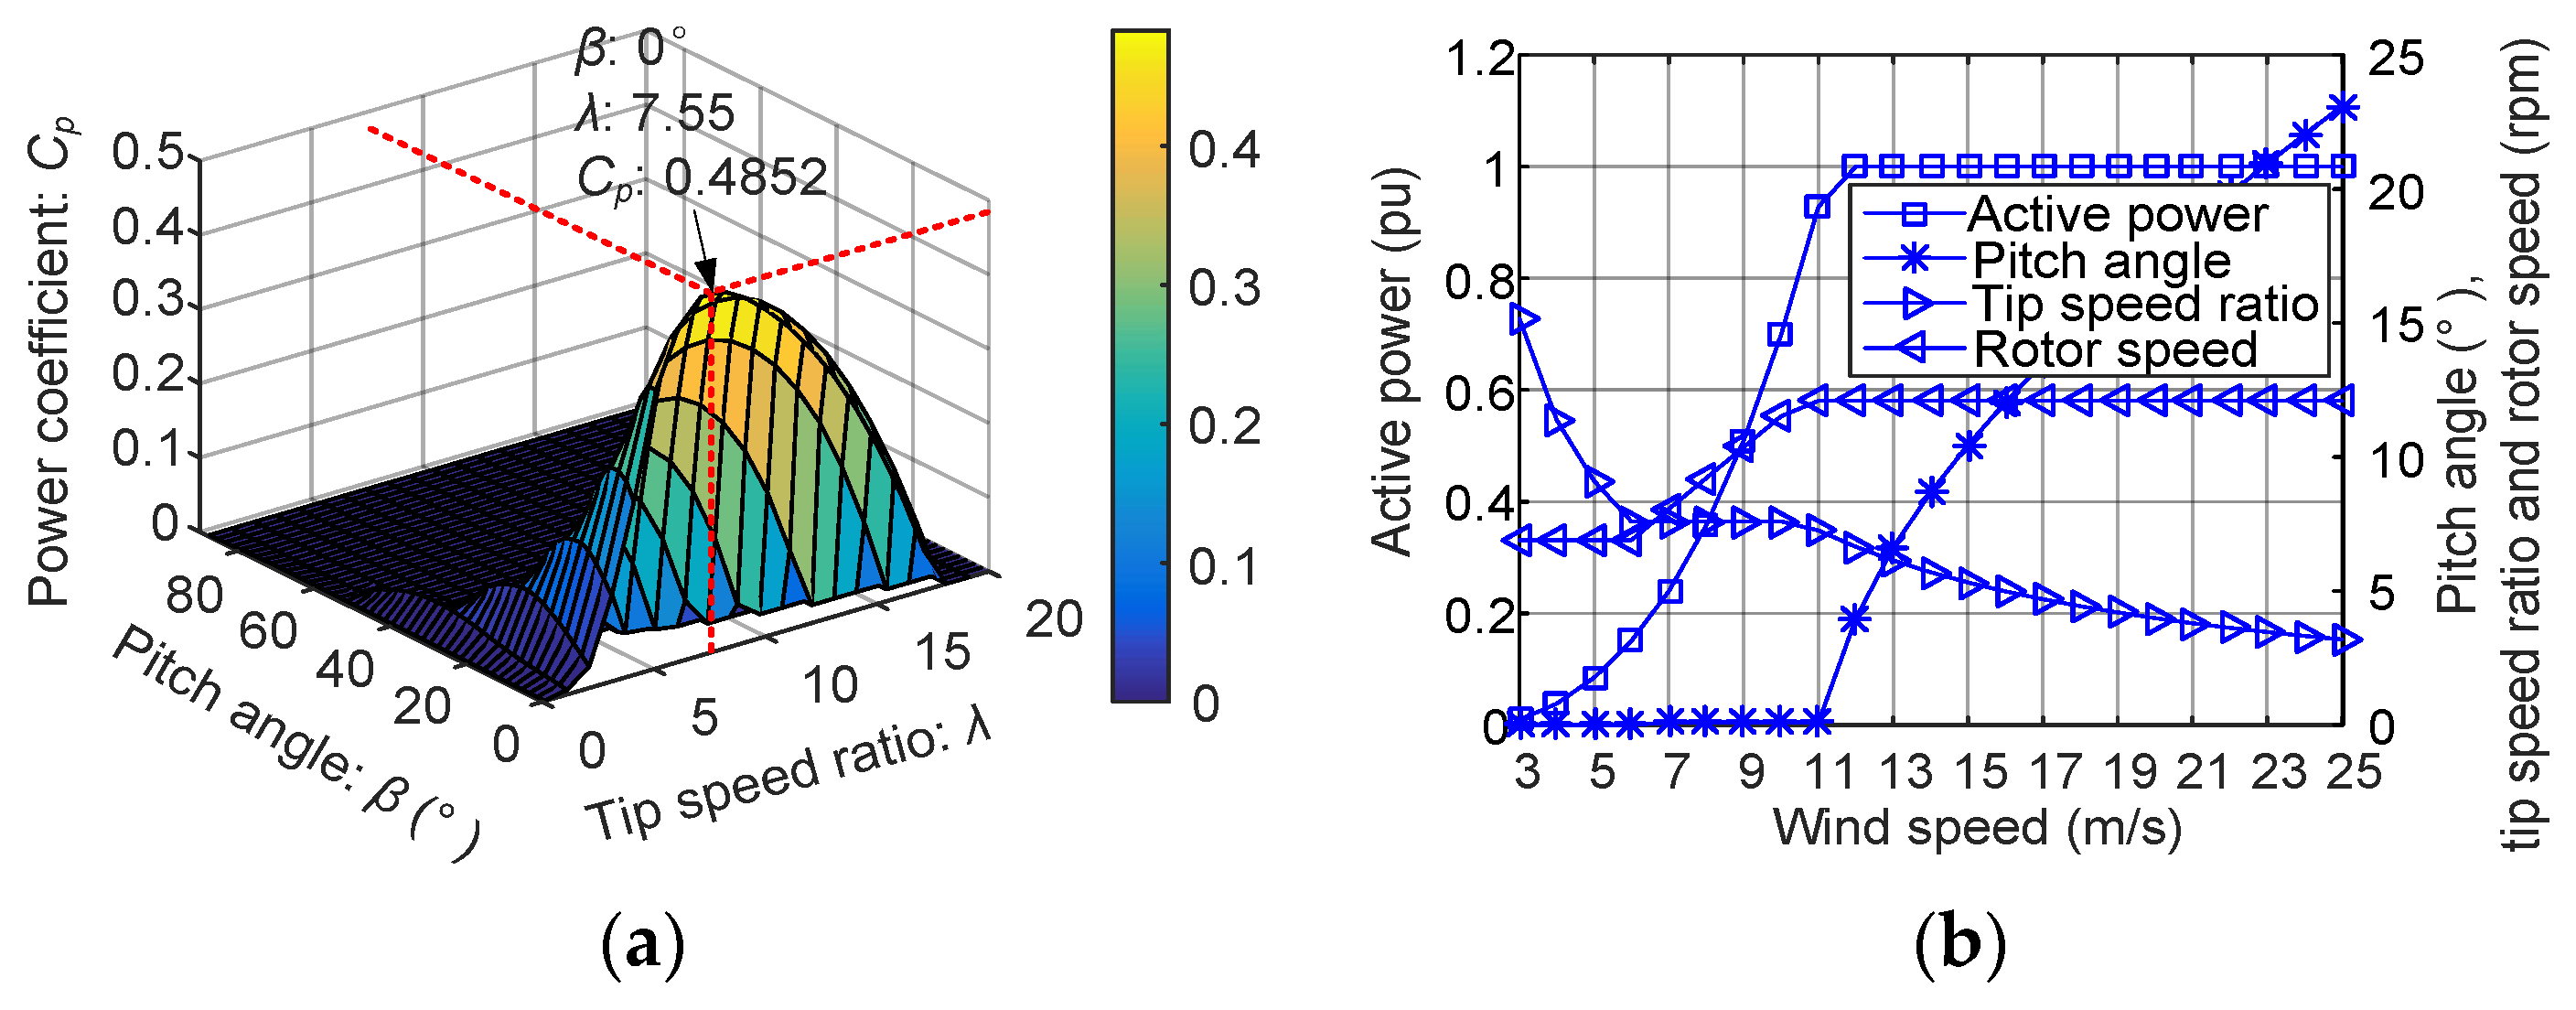
2. DFIG Wind Turbine and MPPT

In this section, the DFIG wind turbine and its active power control method is presented. As shown in Figure 1, the DFIG wind turbine generates the active power from the stator side of the generator. Depending on the slip, it also generates or absorbs active power from the rotor side of the generator. One of the active power control methods of the DFIG wind turbine is based on the active power curve in terms of the wind speed. By the measurement of the wind speed, the active power reference and the pitch angle reference can be separately obtained from the active power curve and the pitch angle curve.
According to the aerodynamic model, the active power P generated by the turbine can be calculated by:
P = 1 2 ρ π R 2 C p ( β , λ ) v 3
where ρ is the air density, R is the radius of the turbine blade, v is the wind speed, and Cp is the power coefficient, which is related to the pitch angle β and the tip speed ratio λ. The tip speed ratio, defined as the ratio of the blade tip speed over the speed of the incoming wind, is given by:
λ = ω r R v
where ωr is the rotor speed.
As expressed in Equation (1), at a specific wind speed, the active power generated by the wind turbine is determined by the power coefficient. By the MPPT method, the wind turbine generates the active power at the maximum power coefficient. The power coefficients of the National Renewable Energy Laboratory (NREL) 5 MW wind turbine in terms of the pitch angle and the tip speed ratio are shown in Figure 2a [16]. It can be observed that the maximum power coefficient is obtained at the pitch angle of 0° and the tip speed ratio of 7.55.
The parameters of the NREL 5 MW DFIG wind turbine are shown in Table 1 [16]. With the MPPT method implemented, the active power, the pitch angle, the tip speed ratio and the rotor speed in terms of the wind speed of the NREL 5 MW DFIG wind turbine are shown in Figure 2b. It is noted that the pitch angle and the tip speed ratio are respectively kept at 0° and 7.55 for the wind turbine to generate the maximum power, at wind speeds from 7 m/s to 10 m/s. At wind speeds lower than 7 m/s, the tip speed ratio is increased due to the minimum rotor speed limit of 6.9 rpm. Similarly, at wind speeds higher than 10 m/s, the tip speed ratio is decreased due to the maximum rotor speed limit of 12.1 rpm. When the wind speed is higher than the rated wind speed, the pitch angle controller is activated to limit the active power no larger than the rated power.

3. Wake Effect and Active Power Maximization in a Two-Turbine Wind Farm

In the wind farm, the wind turbine causes the wind speed deficit to a column of its downstream air flow. This phenomenon is named as the wake effect. The column of air flow is called the wake. Many wake models have been developed to estimate the wind speed deficit in the wake [17,18]. The Katic wake model [19], which extends the previous work of Jensen [20], is one of the most widely used wake models. In this paper, the Katic wake model is adopted to estimate the wind speed deficit at the position of downstream wind turbines.
In this section, the wake effect is addressed and an active power control method to maximize the total active power of the wind farm is proposed. Case studies are carried out in a two-turbine wind farm. The two-turbine wind farm is shown in Figure 3, where it is assumed that the two wind turbines are the NREL 5 MW DFIG wind turbine and the distance between the two wind turbines is 6.5 times the blade diameter.

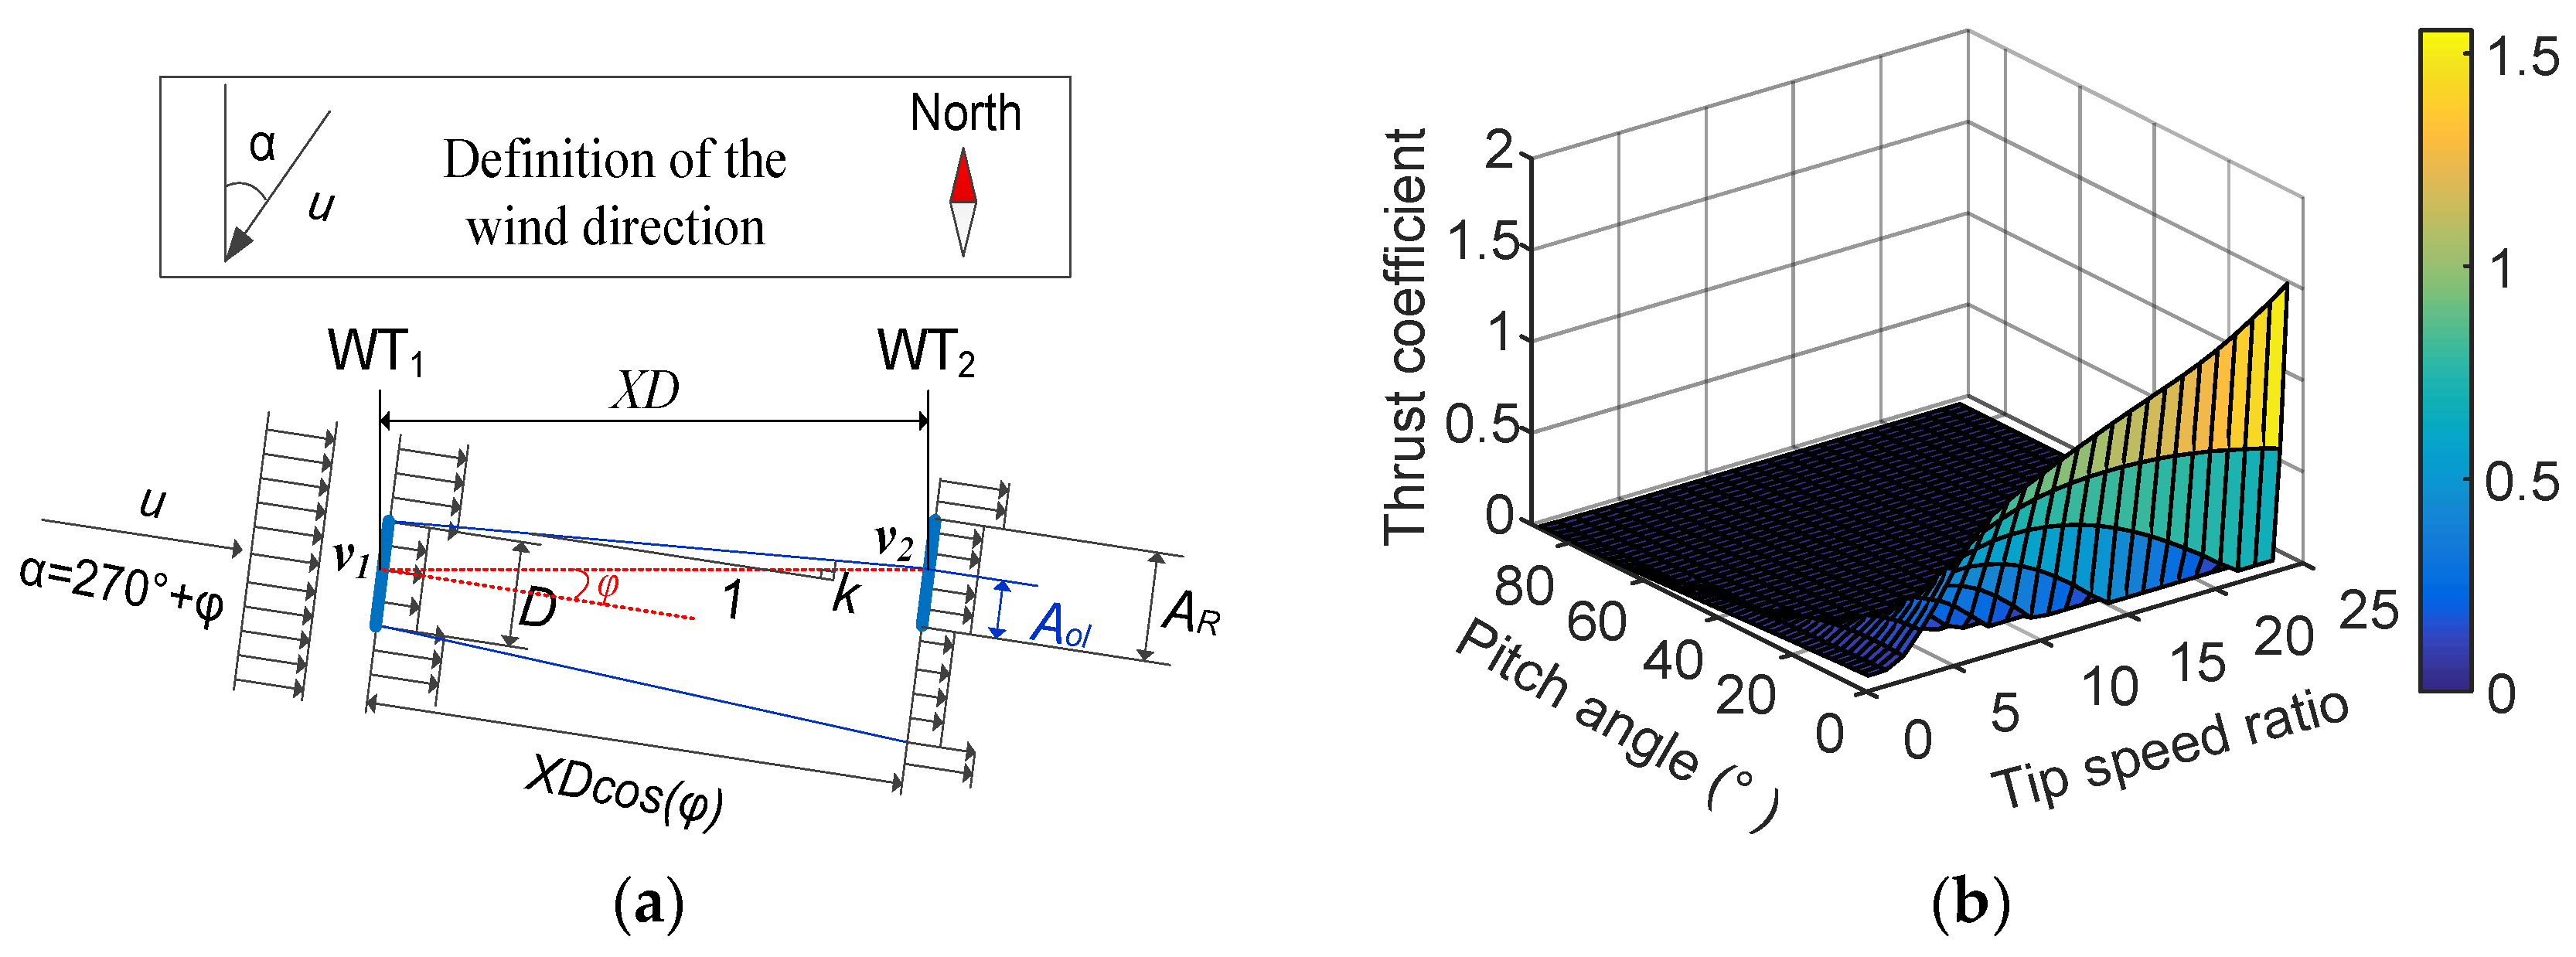
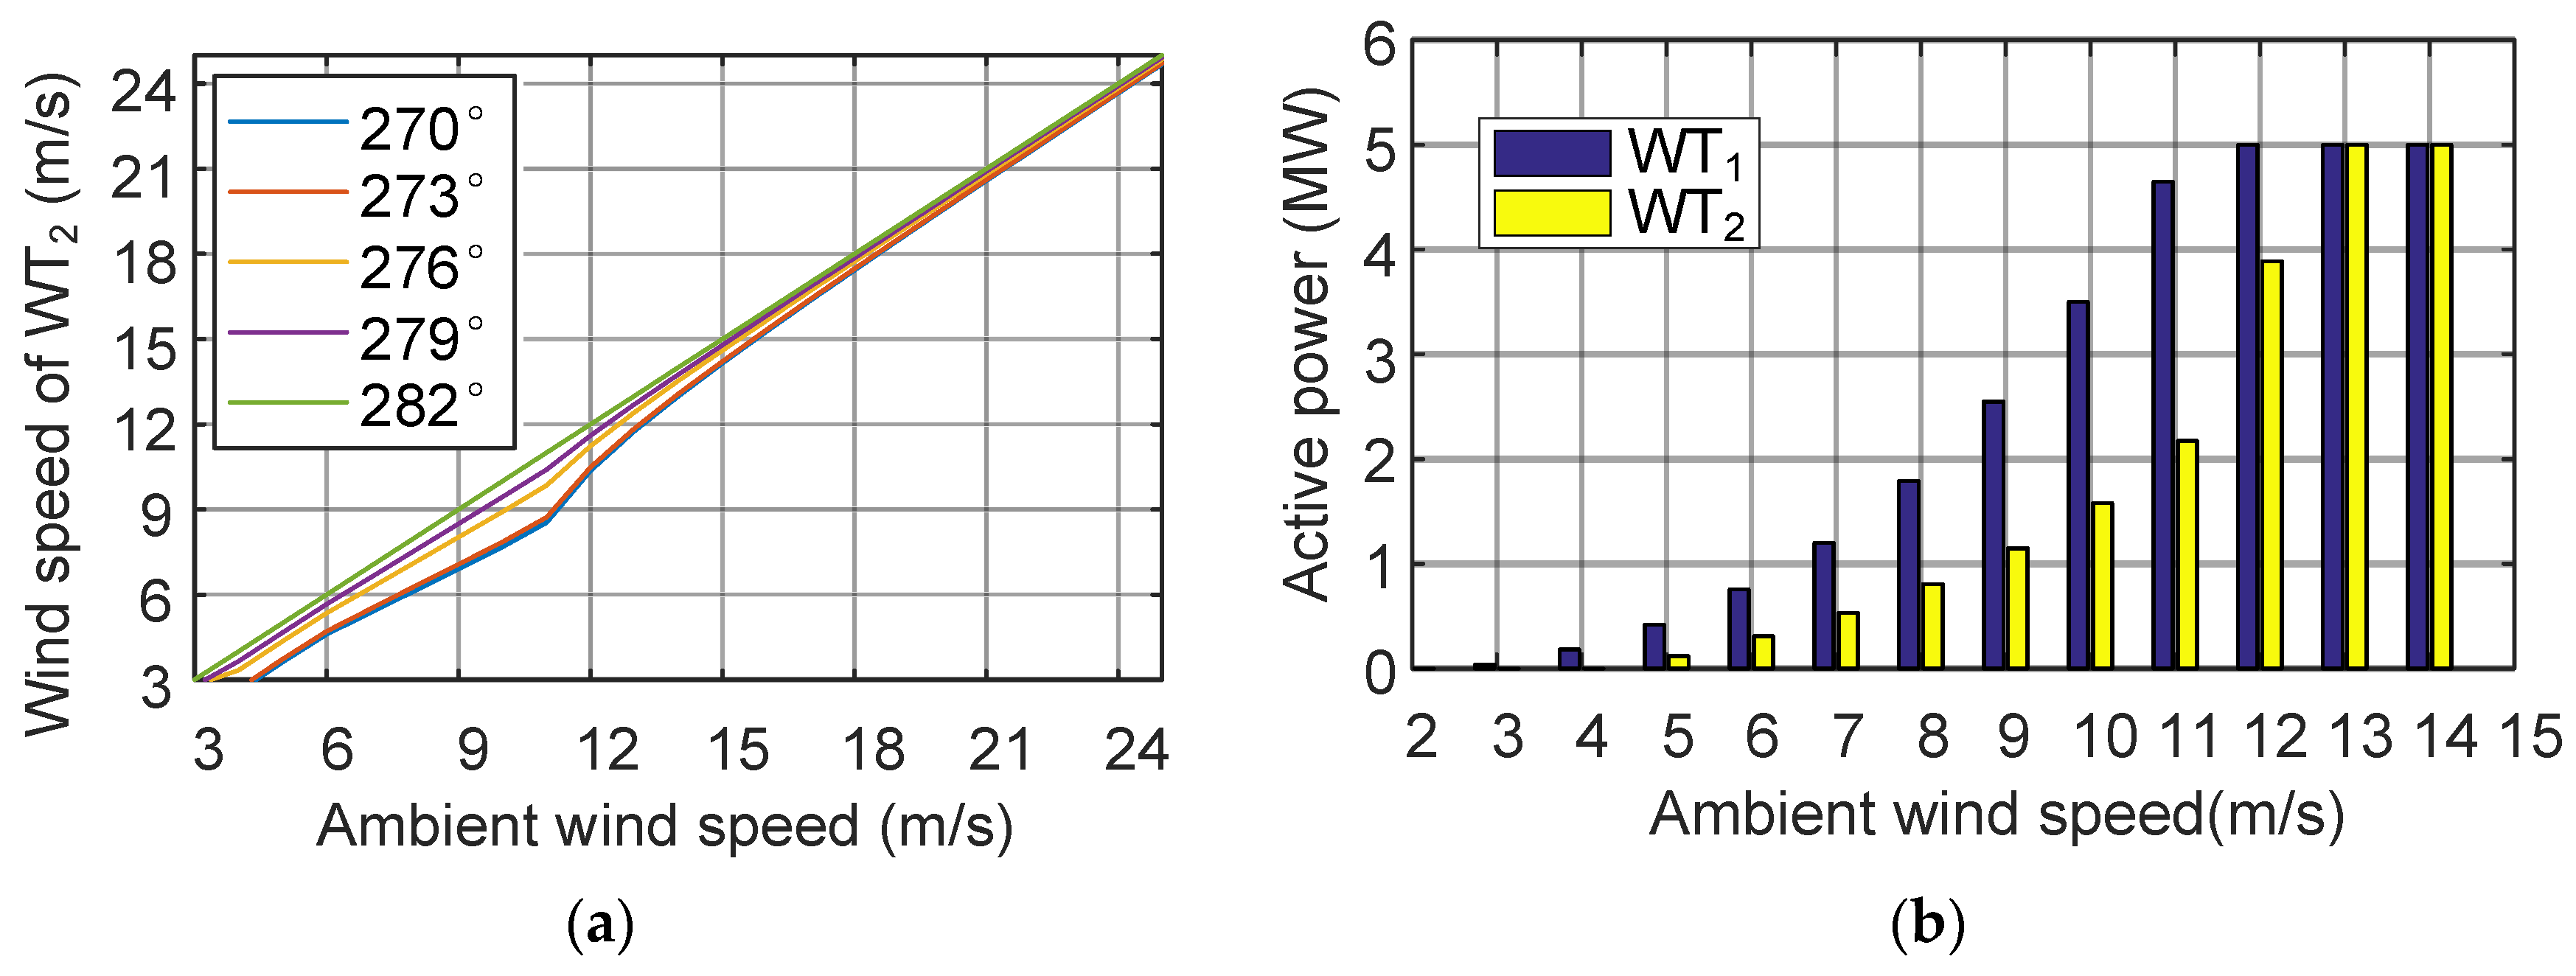
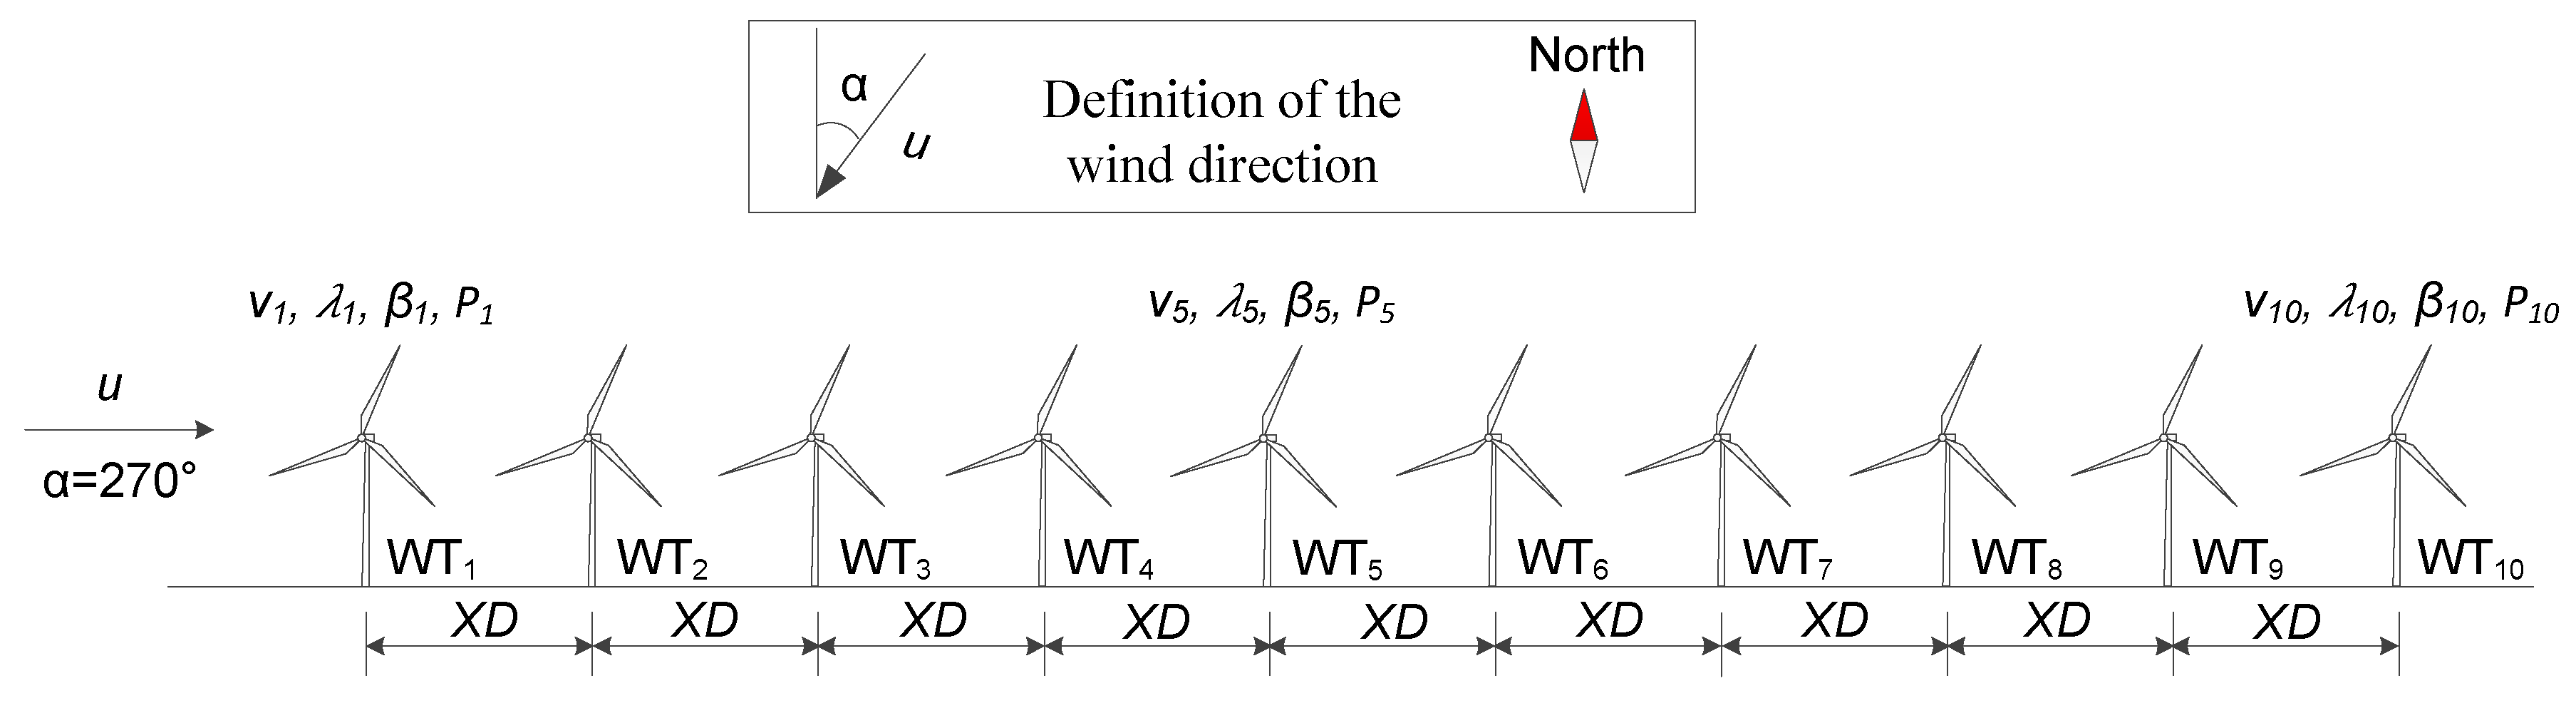
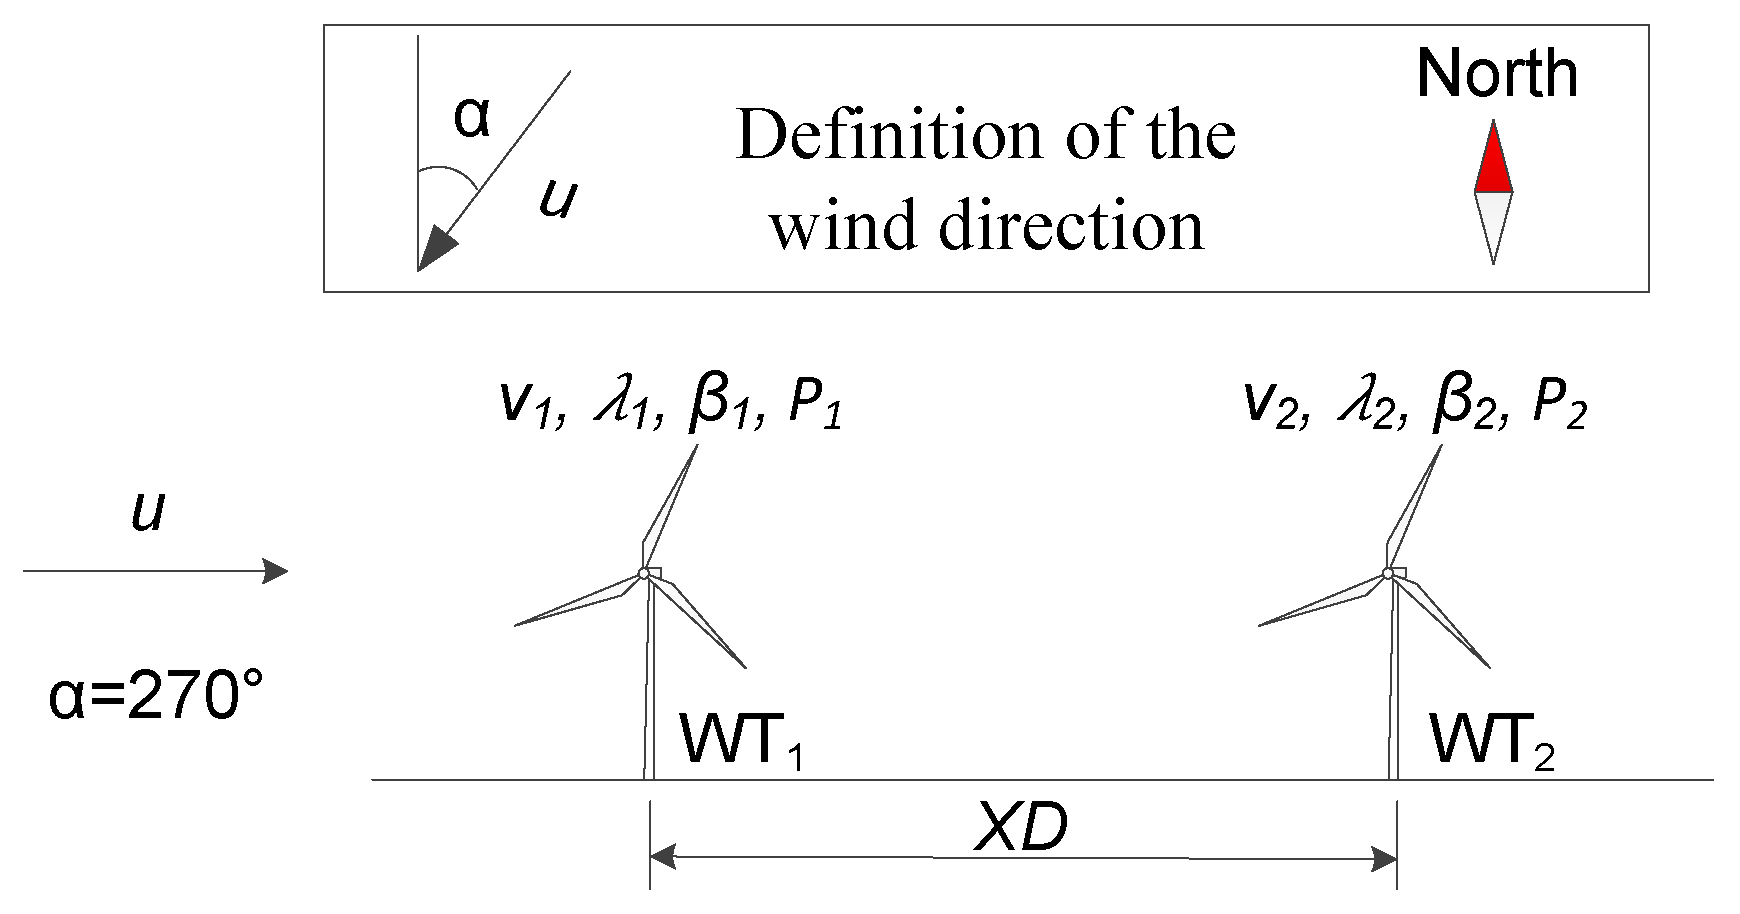
3.1. Wake Effect in Two-Turbine Wind Farm

The Katic wake model, as shown in Figure 4a, estimates the downstream wind speed deficit 1−v2/u by Equation (3) [19]:
1 v 2 u = ( 1 1 C t _ 1 ( β 1 , λ 1 ) ) ( D D + 2 k X D cos ( φ ) ) 2 A o l _ 12 A R
where u is the ambient wind speed, v2 is the wind speed of the downstream wind turbine, Ct is the thrust coefficient of the upstream wind turbine, which is a function of the pitch angle and the tip speed ratio [16], D is the blade diameter, XD is the distance between the two wind turbines, AR is the blade sweep area, Aol_12 is the overlap between the wake area of WT1 and the blade sweep area of WT2, and the decay constant k of 0.075 for the onshore wind farm and 0.04–0.05 for the offshore wind farms is recommended in the Wind Atlas Analysis and Application Program-WAsP help facility [21]. The thrust coefficients of the NREL 5 MW wind turbine in terms of the pitch angle and the tip speed ratio are shown in Figure 4b [16].
By assuming that the offshore decay constant is 0.04 and MPPT method is implemented in WT1 and WT2, the downstream wind speed deficit calculated by Katic model appears in the four symmetrical wind direction ranges of 258°–270°, 270°–282°, 78°–90° and 90°–102°. The wind speed of WT2 at the wind directions α of from 270° to 282° with the resolution of 3° is shown in Figure 5a, where the ambient wind speed from 3 m/s to 25 m/s with the resolution of 1 m/s is taken into account. At these wind directions, the wind speed of WT1 is the same as the ambient wind speed. It can be observed in Figure 5a that the wind speed of WT2 has the maximum deficit at the wind direction of 270°, because WT2 is totally inside of the wake of WT1, where the overlap area equals to the blade sweep area of WT2. With the increasing of the wind direction, the overlap area is reduced and thus the wind speed deficit of WT2 is reduced. At the wind direction of 282°, there is no wind speed deficit of WT2, and the wind speed of WT2 is the same as the ambient wind speed. Meanwhile, the active power of WT1 and WT2 at the wind direction of 270° is shown in Figure 5b.

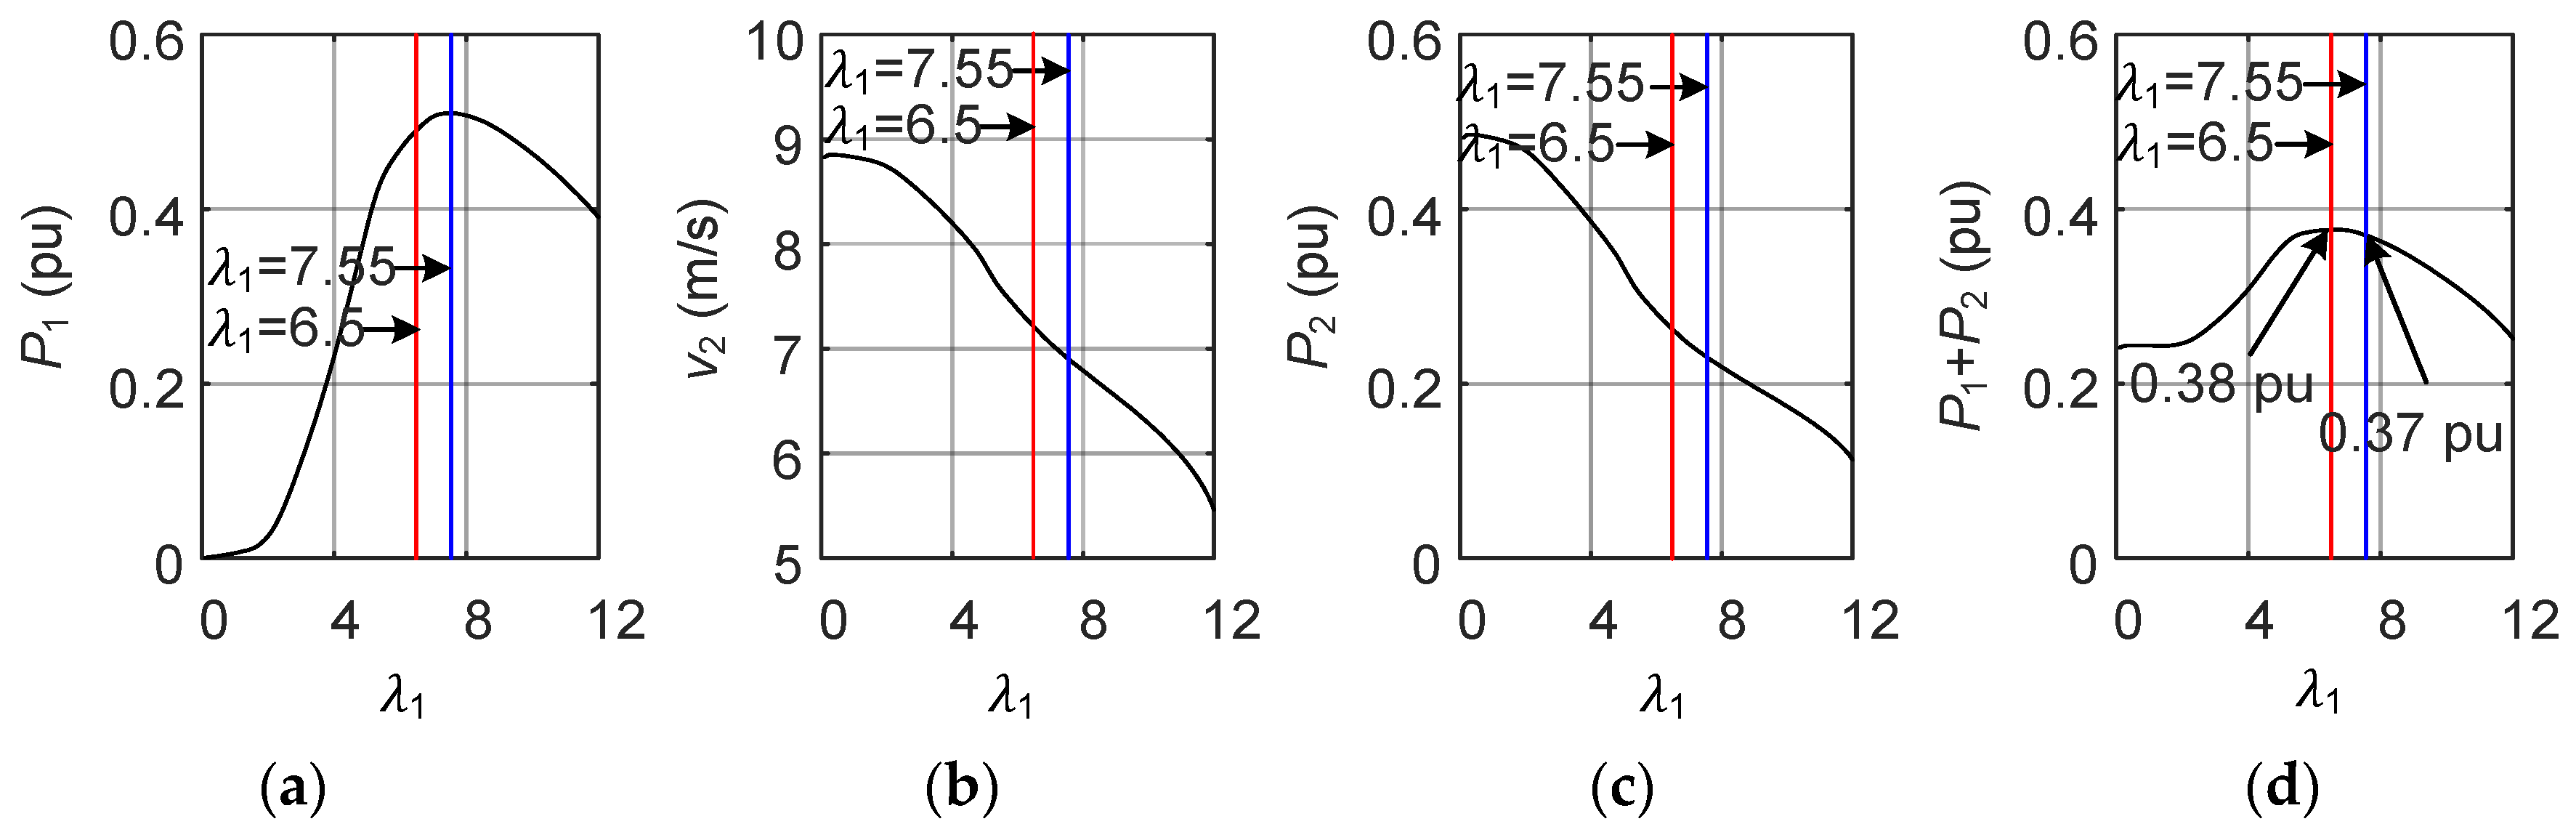
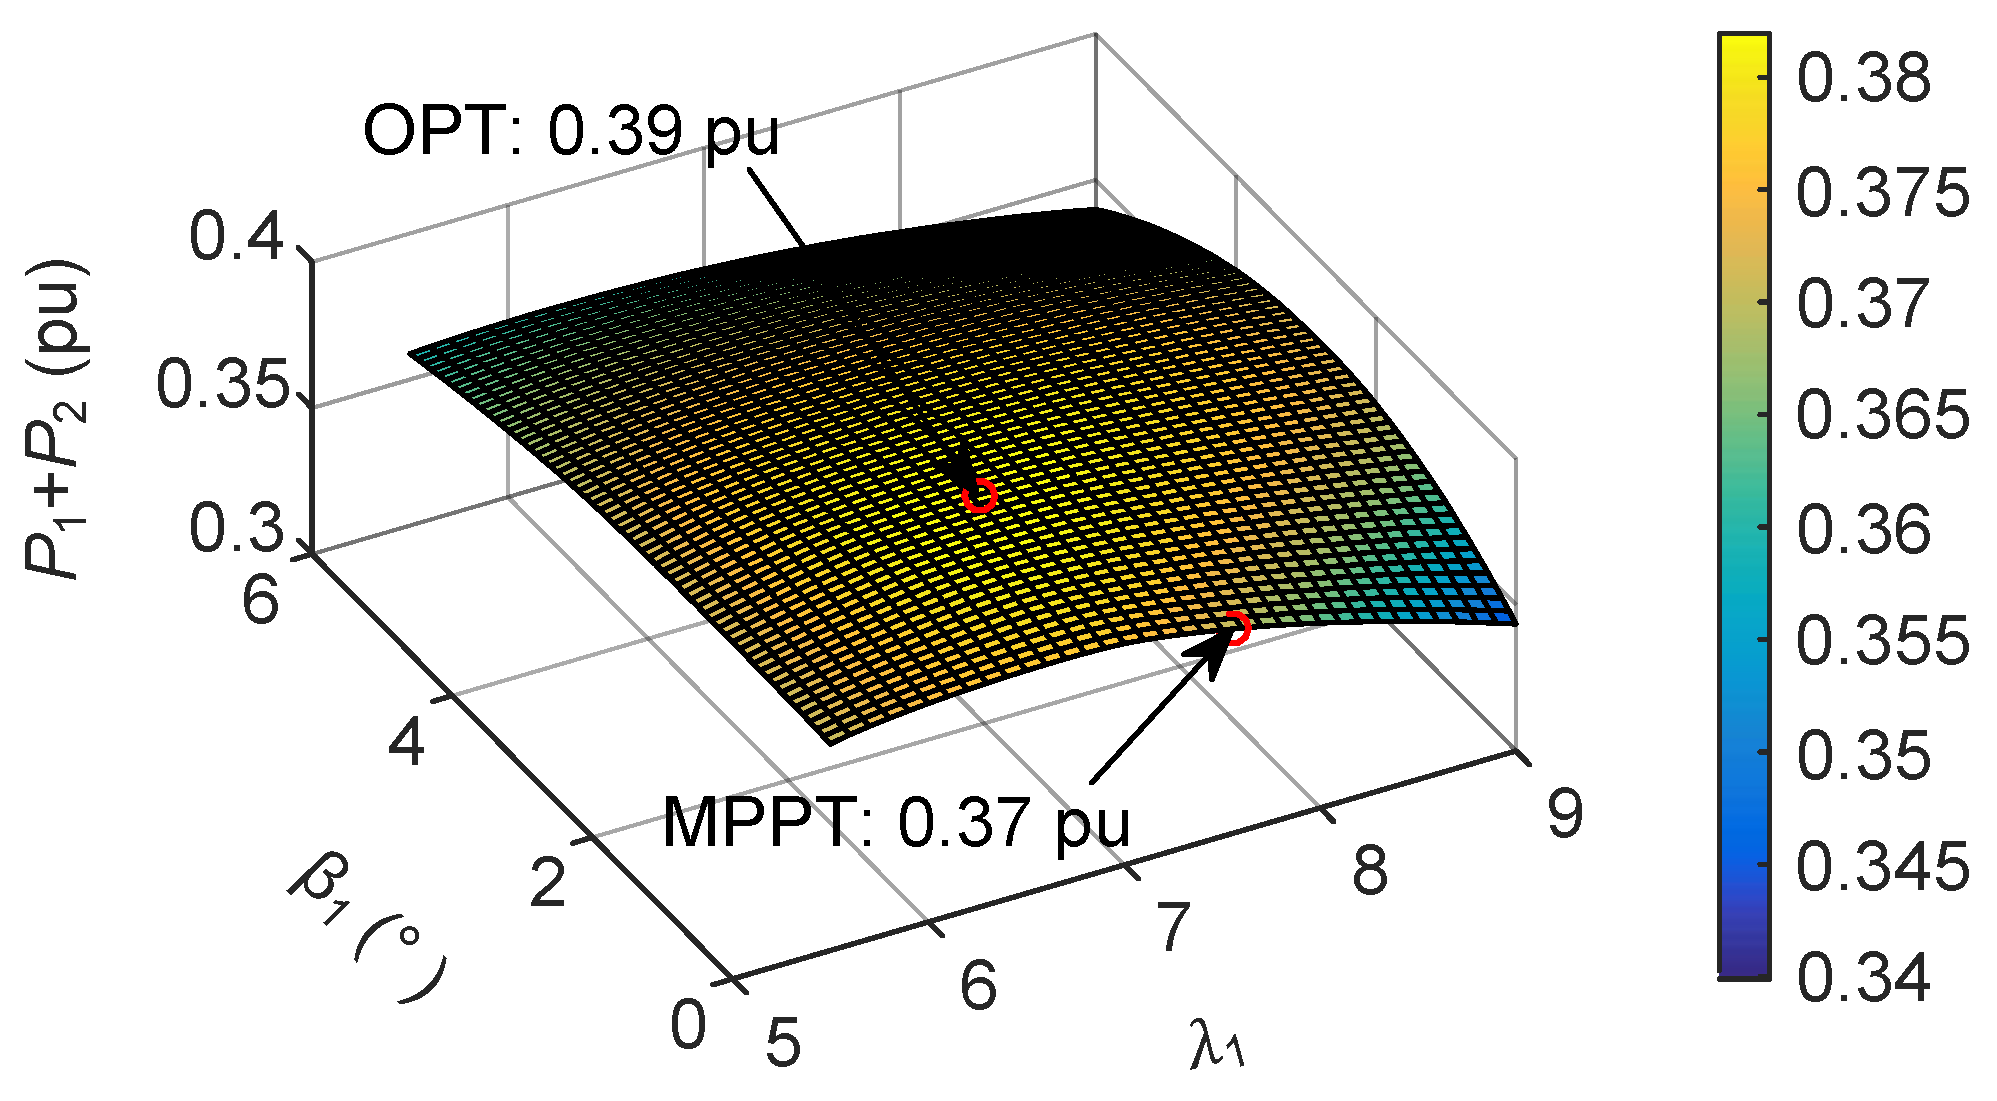
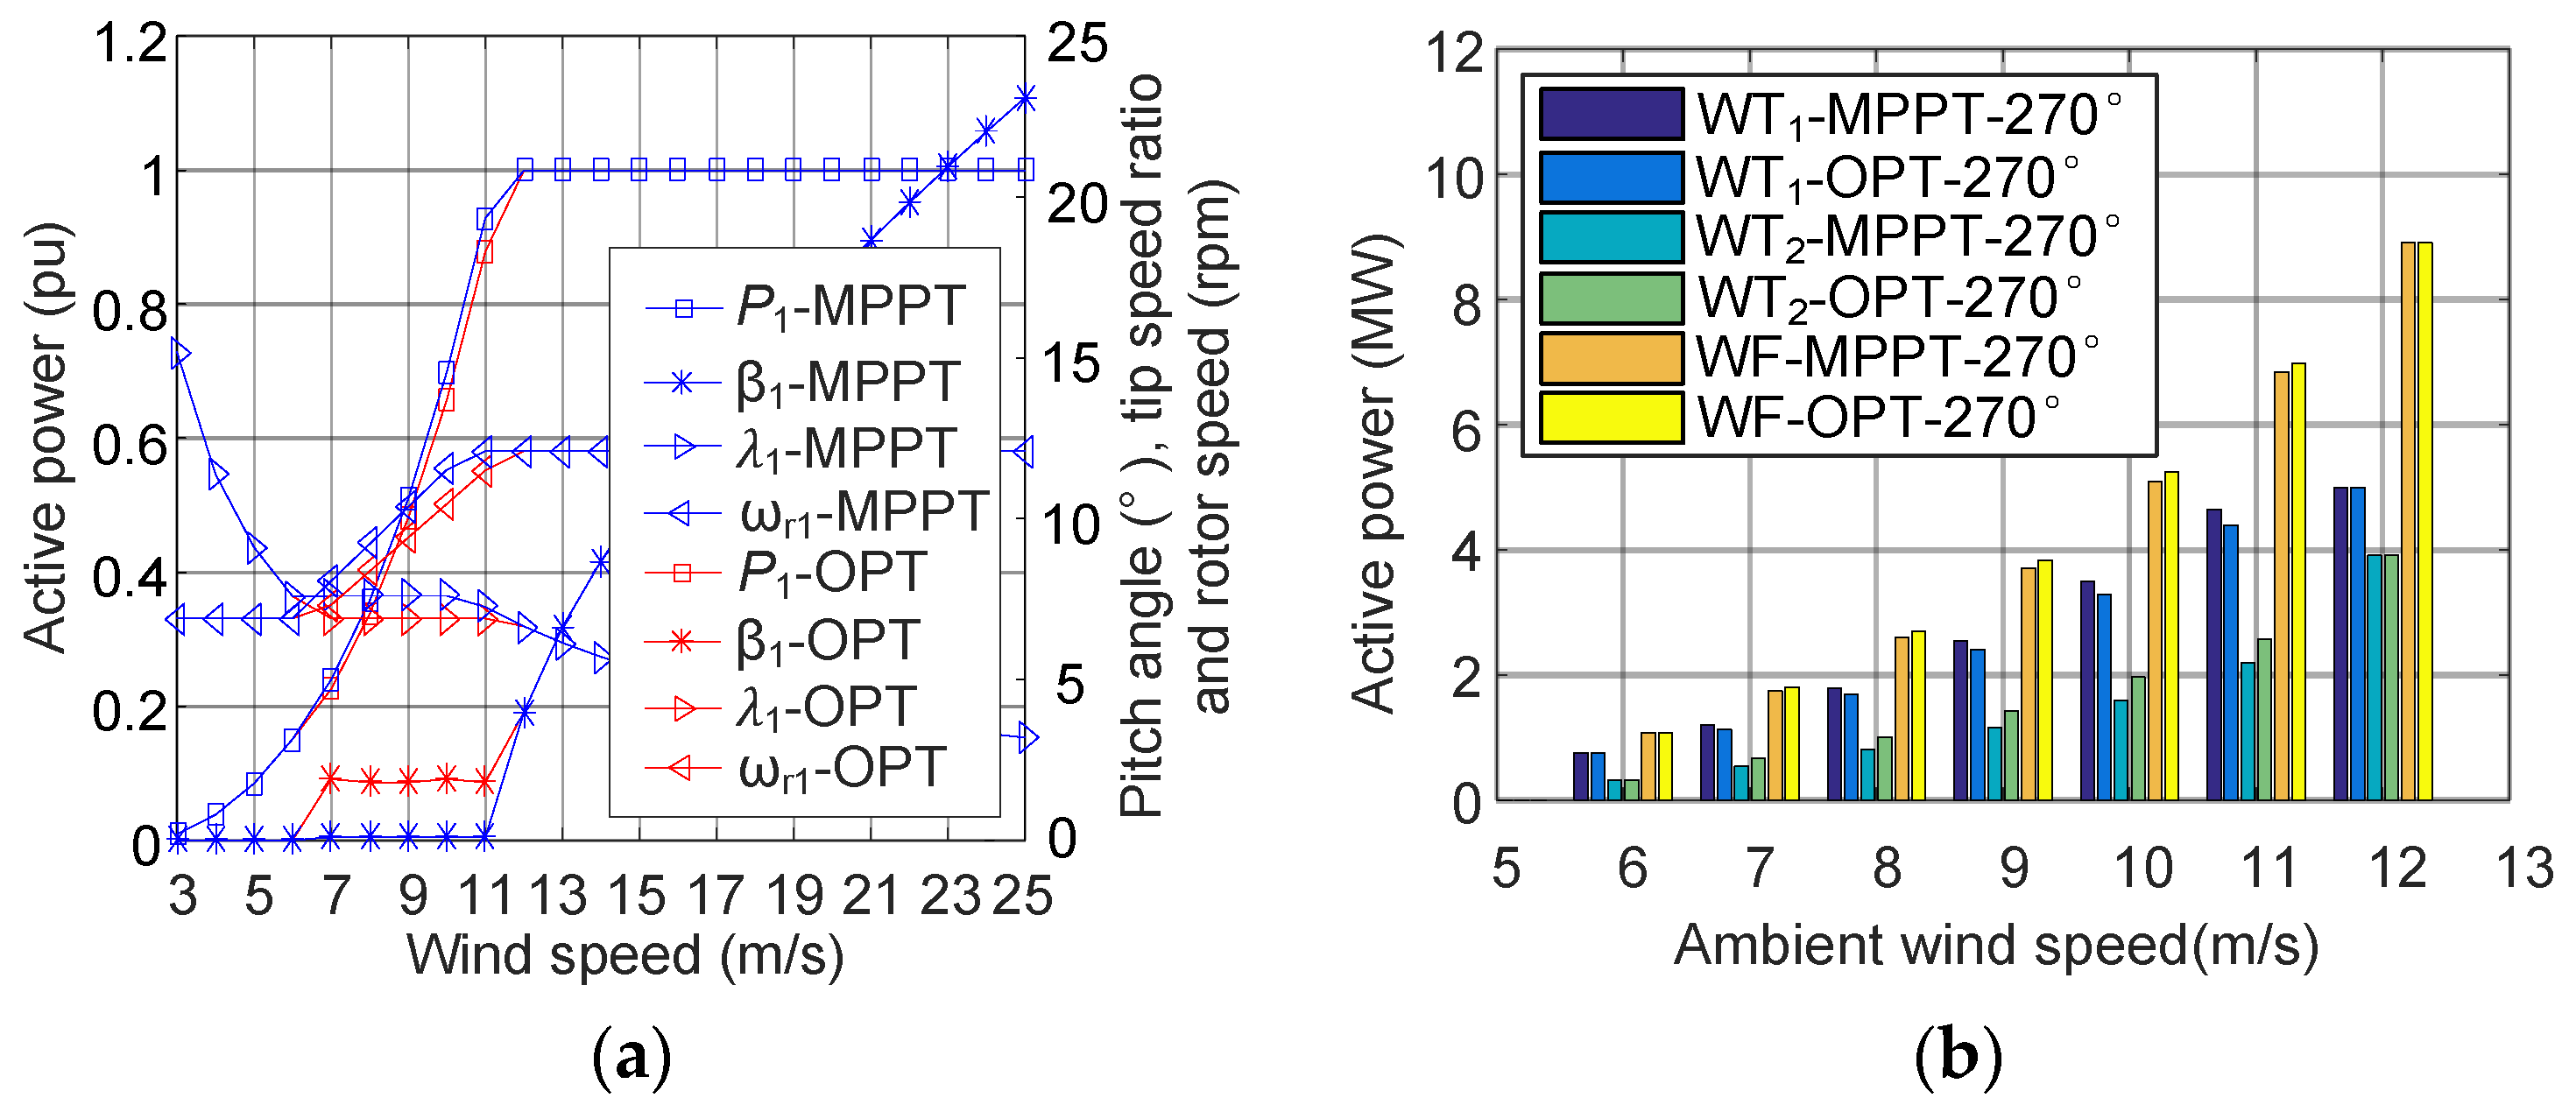
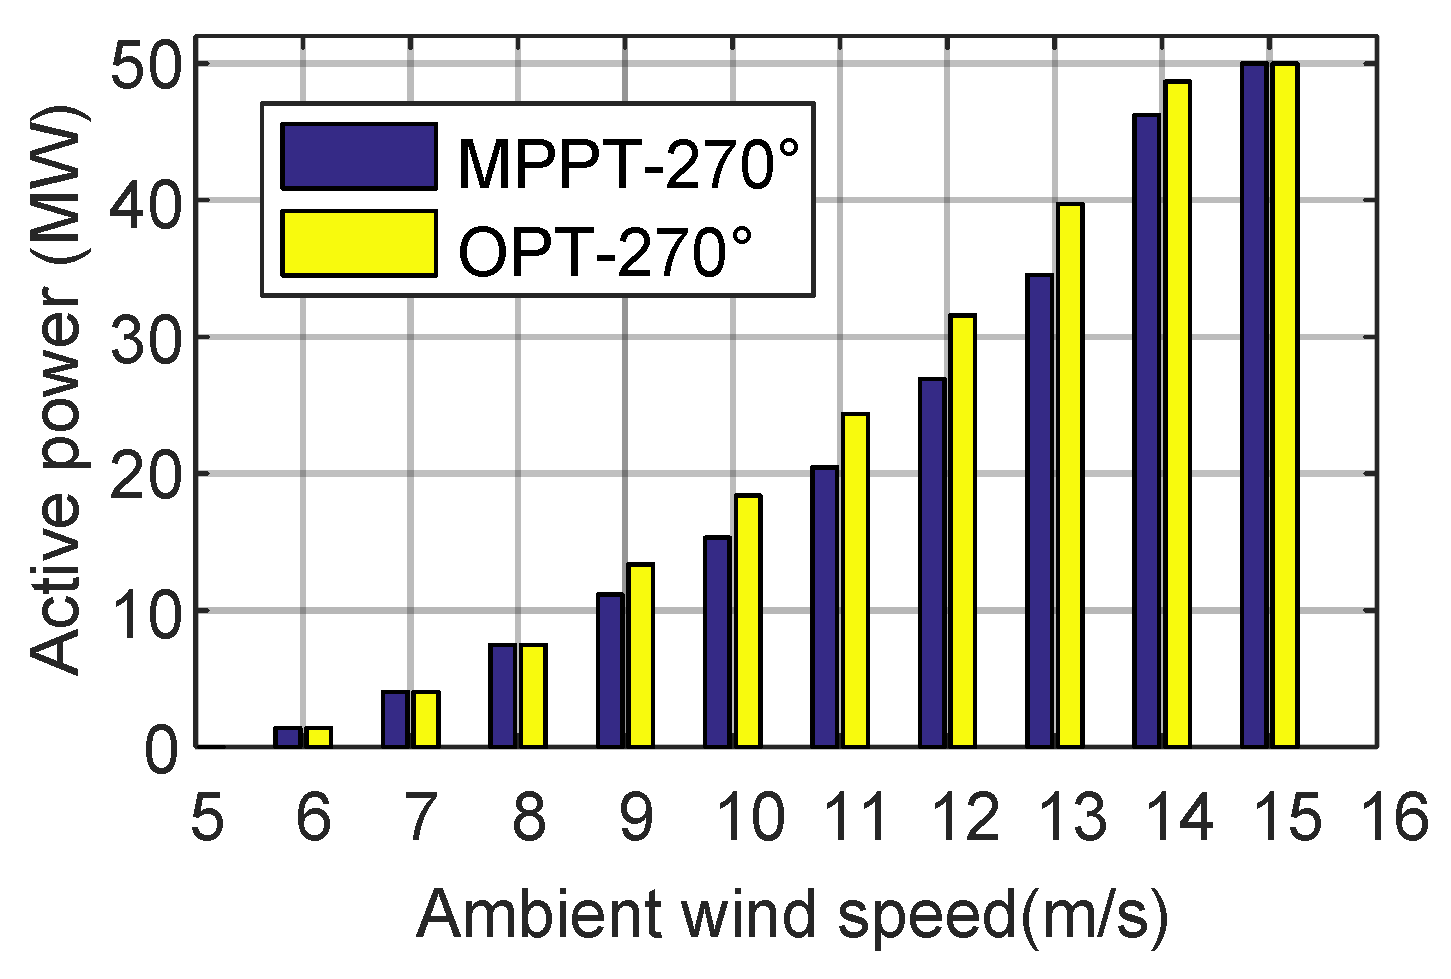
3.2. Active Power Maximization

At the wind direction of 270°, as expressed by Equation (1), the active power of WT1 is determined by the pitch angle and tip speed ratio of WT1. Meanwhile, as expressed by Equation (3), the wind speed of WT2 is also determined by the pitch angle and tip speed ratio of WT1. Compared with the MPPT method, by changing the pitch angle and tip speed ratio of WT1, the active power of WT1 will be reduced. However, the wind speed of WT2 can be increased, which results in the increase of the active power of WT2. In consequence, the total active power of the wind farm can be increased.
At the wind direction of 270°, the wind speed of WT1 is the same as the ambient wind speed. The wind speed of WT2 can be calculated by Equation (3). The active power of WT1 and WT2 can be calculated by Equation (1). By assuming that the pitch angle of WT1 is the same as the MPPT method and WT2 is controlled by the MPPT method, the active power of WT1, the wind speed of WT2, the active power of WT2, and the total active power of the wind farm in terms of the tip speed ratio of WT1 can be calculated. For instance, at the ambient wind speed of 9 m/s, the effect of the tip speed ratio of WT1 on the total active power generation is shown in Figure 6. In the case that WT1 is controlled by the MPPT method, where the tip speed ratio of WT1 is 7.55, WT1 generates the maximum active power, as shown in Figure 6a. The total active power of the wind farm is 0.37 pu, as shown in Figure 6d. If changing the tip speed ratio of WT1 to 6.5, the active power of WT1 is reduced, as shown in Figure 6a. The total active power of the wind farm is increased to the maximum value of 0.38 pu, as shown in Figure 6d. Compared with the MPPT method, 0.01 pu can be increased.
The optimal tip speed ratio of 6.5 can be obtained by the exhausted search method. Firstly, all the possible total active power of the wind farm in terms of the tip speed ratios of WT1 with the resolution of 0.1 is calculated. Afterwards, the maximum total active power of the wind farm is selected. Then, the corresponding optimal tip speed ratio of WT1 can be obtained, which is 6.5.
If the pitch angle of WT1 is considered as well, at the wind direction of 270° and ambient wind speed of 9 m/s, the total active power of the wind farm in terms of the pitch angle and tip speed ratio of WT1 is shown in Figure 7. As marked by optimal (OPT), the maximum total active power of the wind farm of 0.39 pu is achieved at the pitch angle of 1.8° and the tip speed ratio of 6.9 of the WT1. Compared with the WT1 controlled by the MPPT method where the total active power of the wind farm is 0.37 pu, the total active power of the wind farm can be increased by 0.02 pu.
The optimal pitch angle and tip speed ratio of WT1, which are 1.8° and 6.9 respectively, can also be obtained by the exhausted search method. Firstly, all the total active power of the wind farm in terms of the pitch angle and tip speed ratio of WT1 are calculated with the pitch angle resolution of 0.2° and tip speed ratio resolution of 0.1. Afterwards, the maximum total active power of the wind farm can be selected. Finally, the corresponding optimal pitch angle and tip speed ratio of WT1 can be obtained, which are 1.8° and 6.9, respectively.
At the wind direction of 270°, the WT2 will not cause the power loss to the wind farm, as there is no wind turbine behind WT2 along the wind direction. Therefore, WT2 should be controlled by the MPPT method to generate the maximum active power of WT2 at its current wind speed. The total active power of the wind farm can be maximized by optimizing the pitch angle and tip speed ratio of WT1. It is evident the pitch angle and tip speed ratio of WT1 is optimized at the ambient wind speeds of 7 m/s to 11 m/s. When the ambient wind speed is lower than 7 m/s and higher than 11 m/s, the rotor speed is limited by 6.9 rpm and 12.1 rpm. To simplify the problem, the pitch angle and tip speed ratio of WT1 is just optimized at the ambient wind speeds from 7 m/s to 11 m/s, as shown in Figure 8a.
Comparing the MPPT method and the optimized method, the active power of WT1, the active power of WT2 and the total active power of the wind farm at the ambient wind speeds from 7 m/s to 11 m/s are shown in Figure 8b. It can be seen that the active power of WT1 is reduced. However, the active power of WT2 is increased. Overall, the active power of the wind farm is increased.
Due to the wind farm layout, as shown in Figure 6, the power loss of the wind farm caused by the wake effect appears within the four symmetrical wind direction areas of 258°–270°, 270°–282°, 78°–90° and 90°–102°. It can be expected that the maximum power loss appears at the wind directions of 270° and 90°. The power loss reduces with the wind direction change from 270° to 282°, from 270° to 258°, from 90° to 102° and from 90° to 78°. At the wind directions that the wind farm has no power loss due to the wake effect, WT1 and WT2 should be controlled by the MPPT method to maximize the total active power of the wind farm.
The optimized pitch angle, tip speed ratio, rotor speed and active power of WT1 at the wind directions of 270°, 276° and 282° are shown in Figure 9a. Comparing WT1 controlled by MPPT method and the optimized method, the optimized total active power of the wind farm at the wind directions of 270°, 276° and 282° are shown in Figure 9b. It is clear that the total active power of the wind farm can be increased mostly at the wind direction of 270°. Moreover, the increased amount of the active power in the wind farm reduces with the increase of wind direction from 270° to 282°.

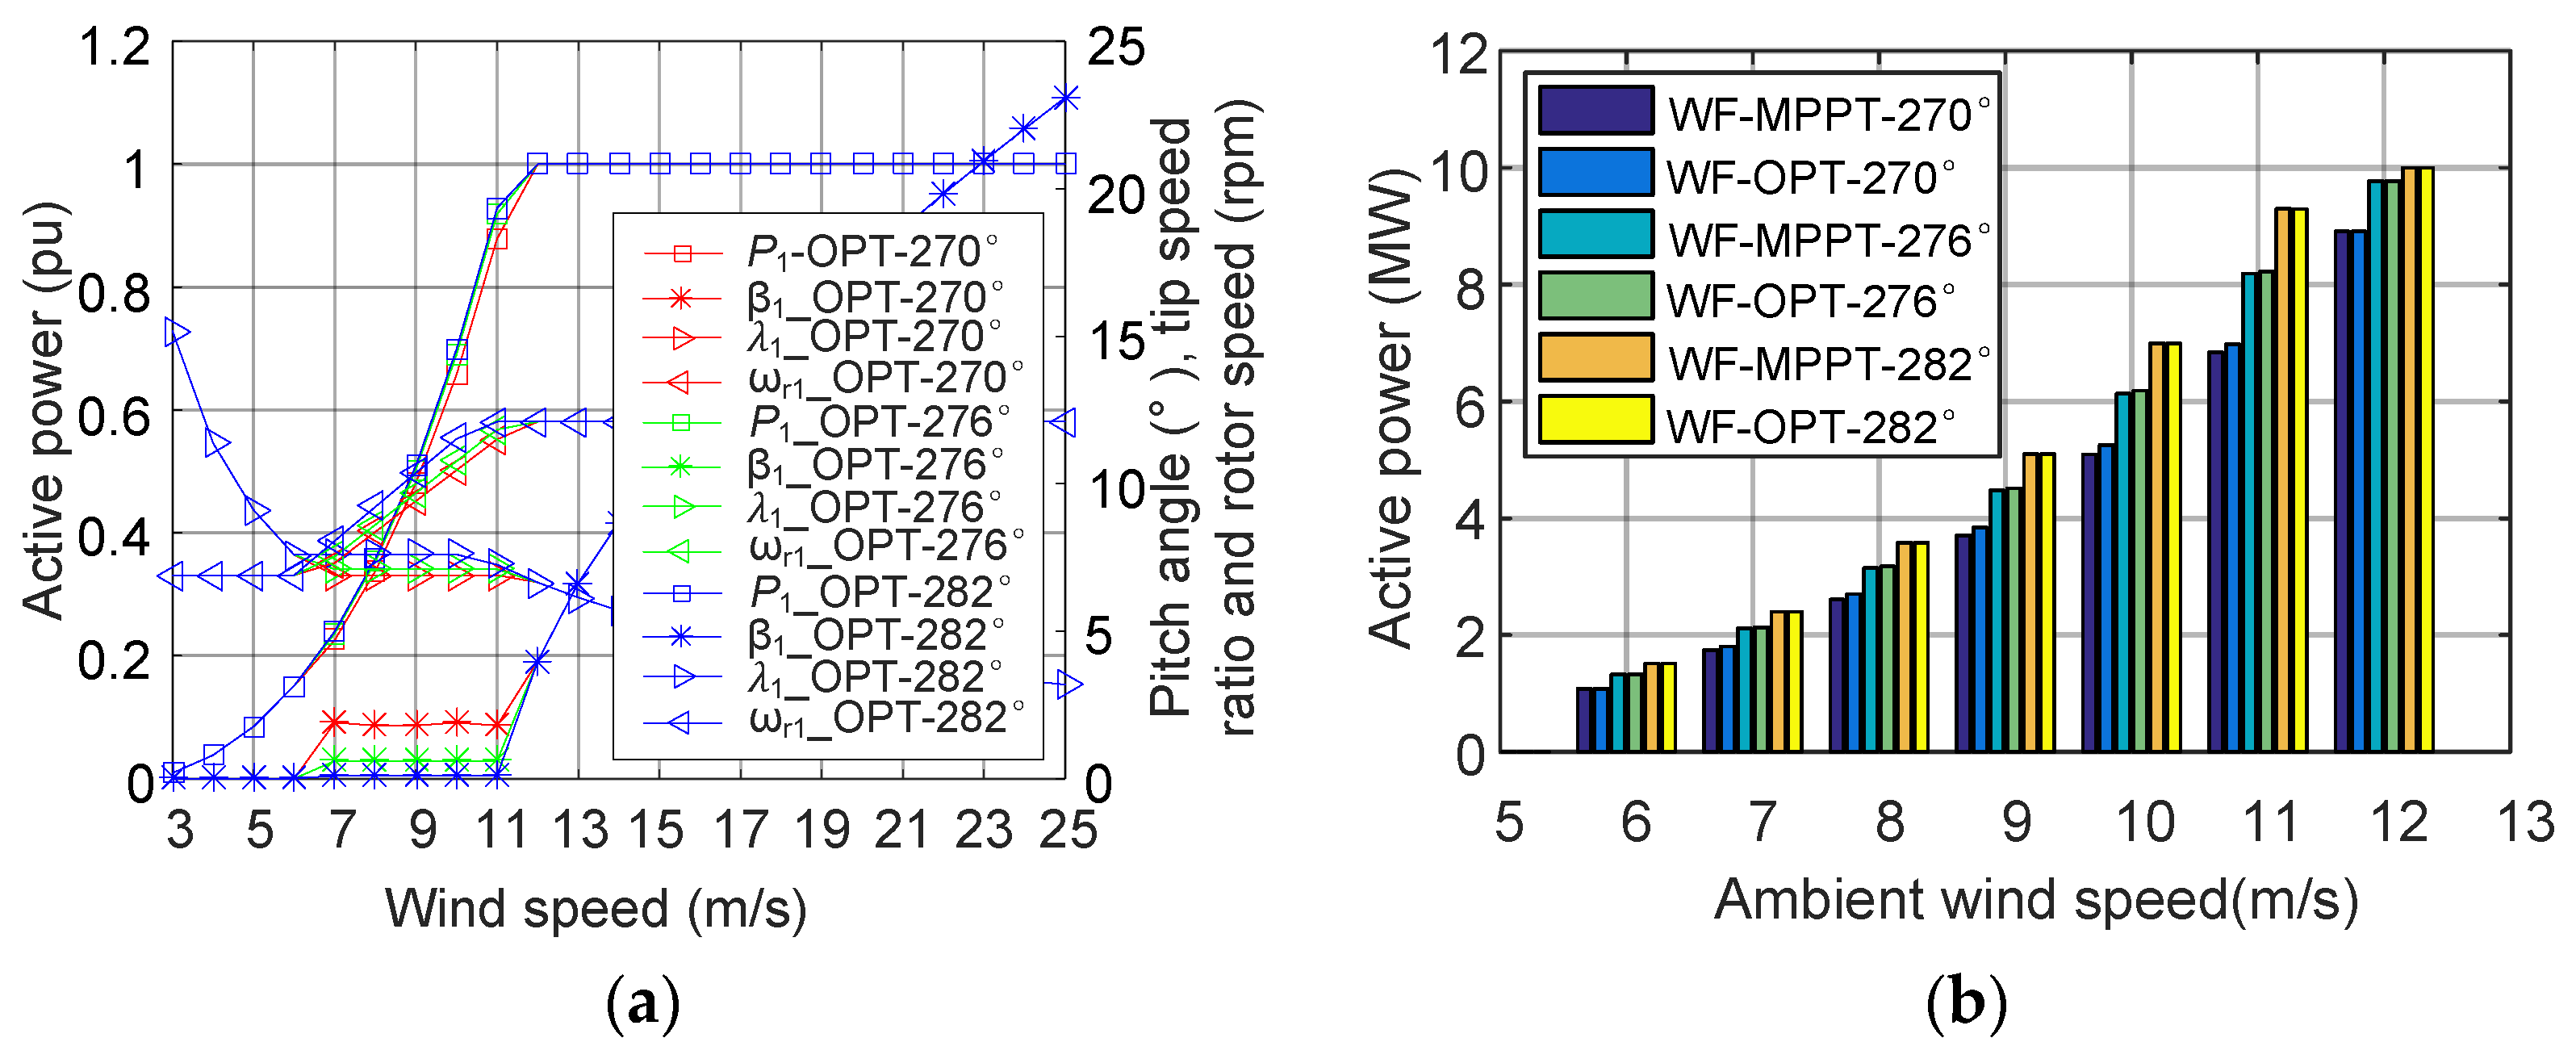
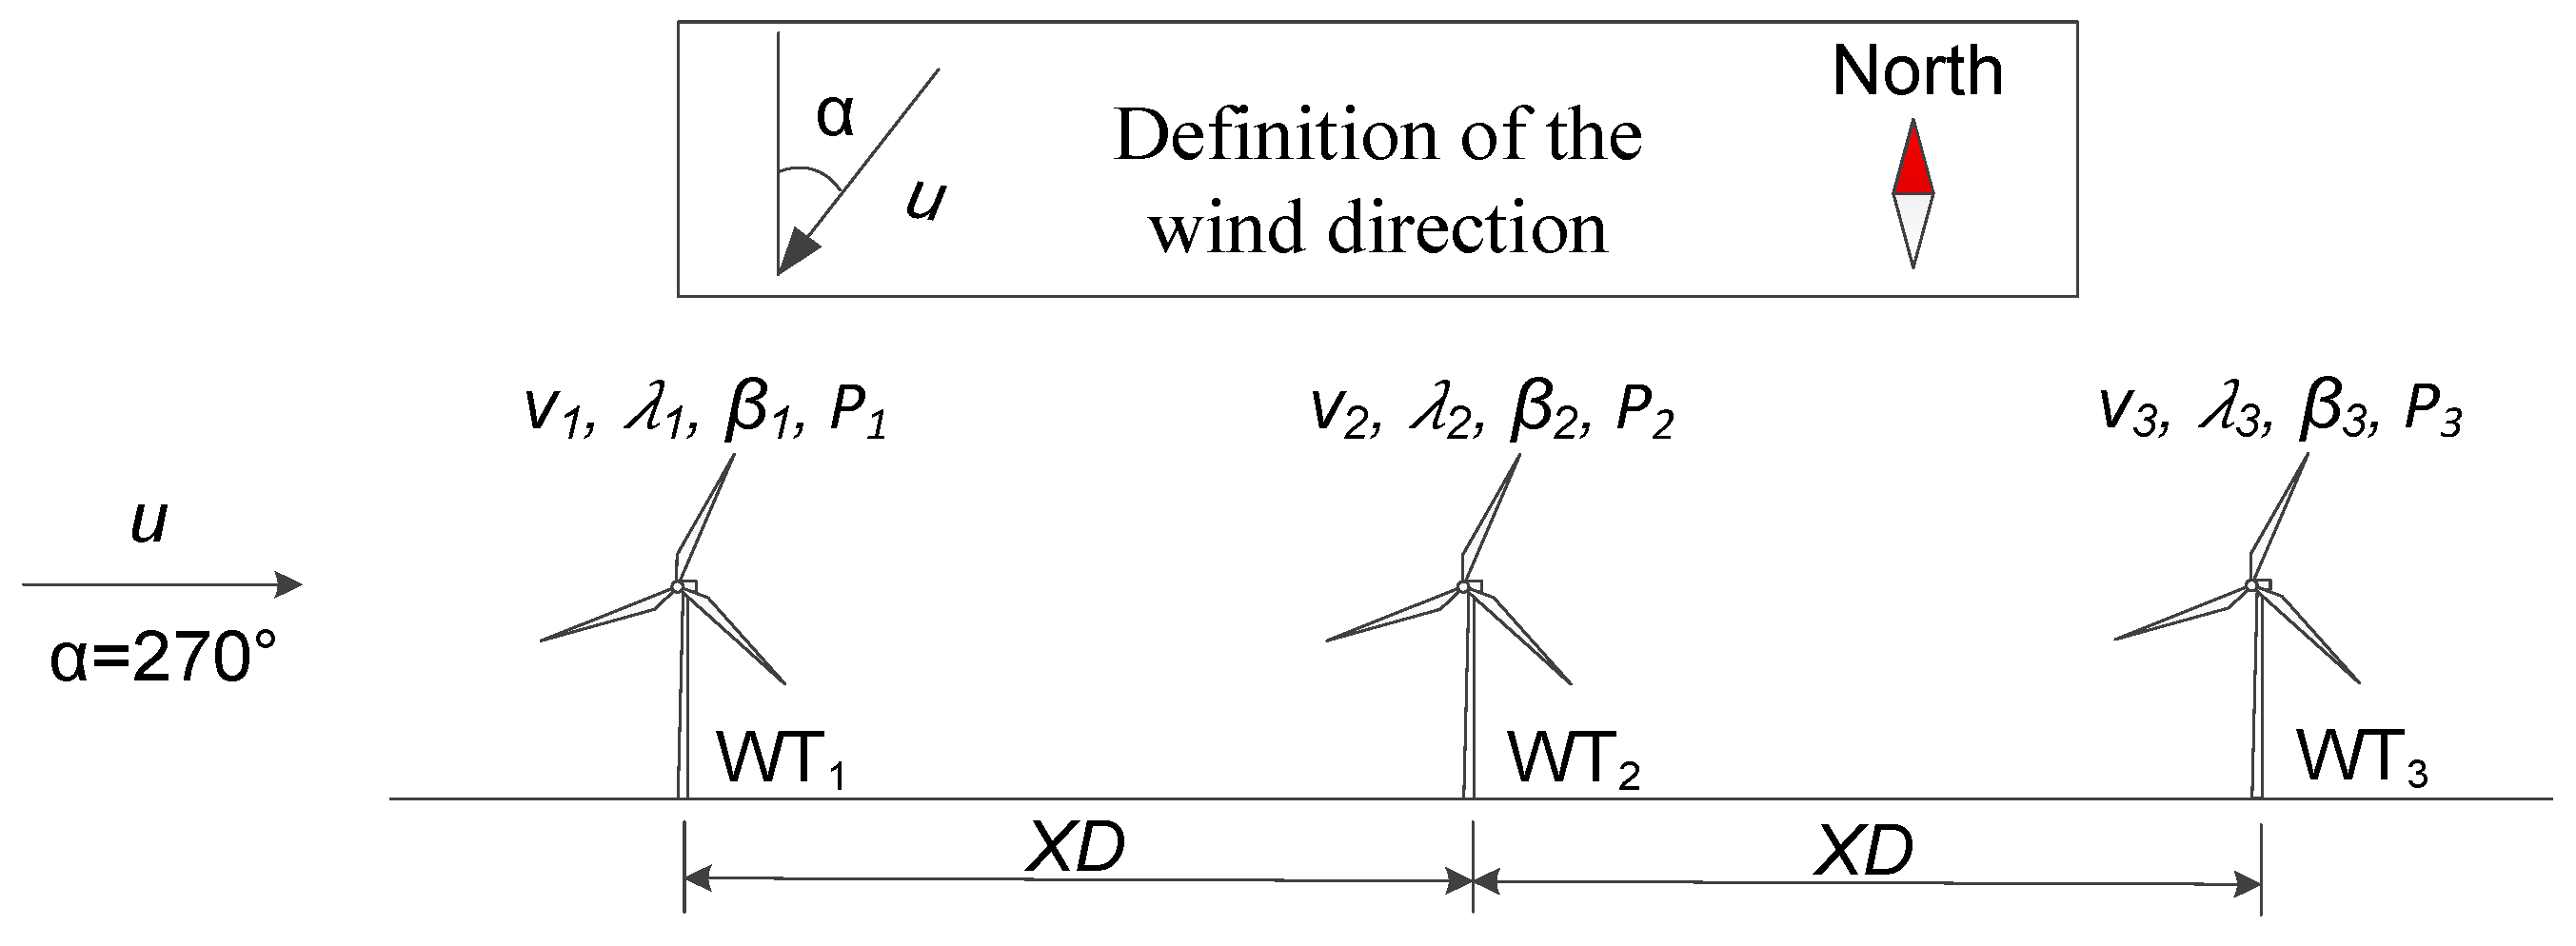
4. Wake Effect and Active Power Maximization in a Three-Turbine Wind Farm

In this section, case studies of the wake effect and the proposed optimization method are carried out in a three-turbine wind farm. The three-turbine wind farm is shown in Figure 10, where it is assumed that the two wind turbines are the NREL 5 MW DFIG wind turbine and the distance between the two adjacent wind turbines is 6.5 times the blade diameter.

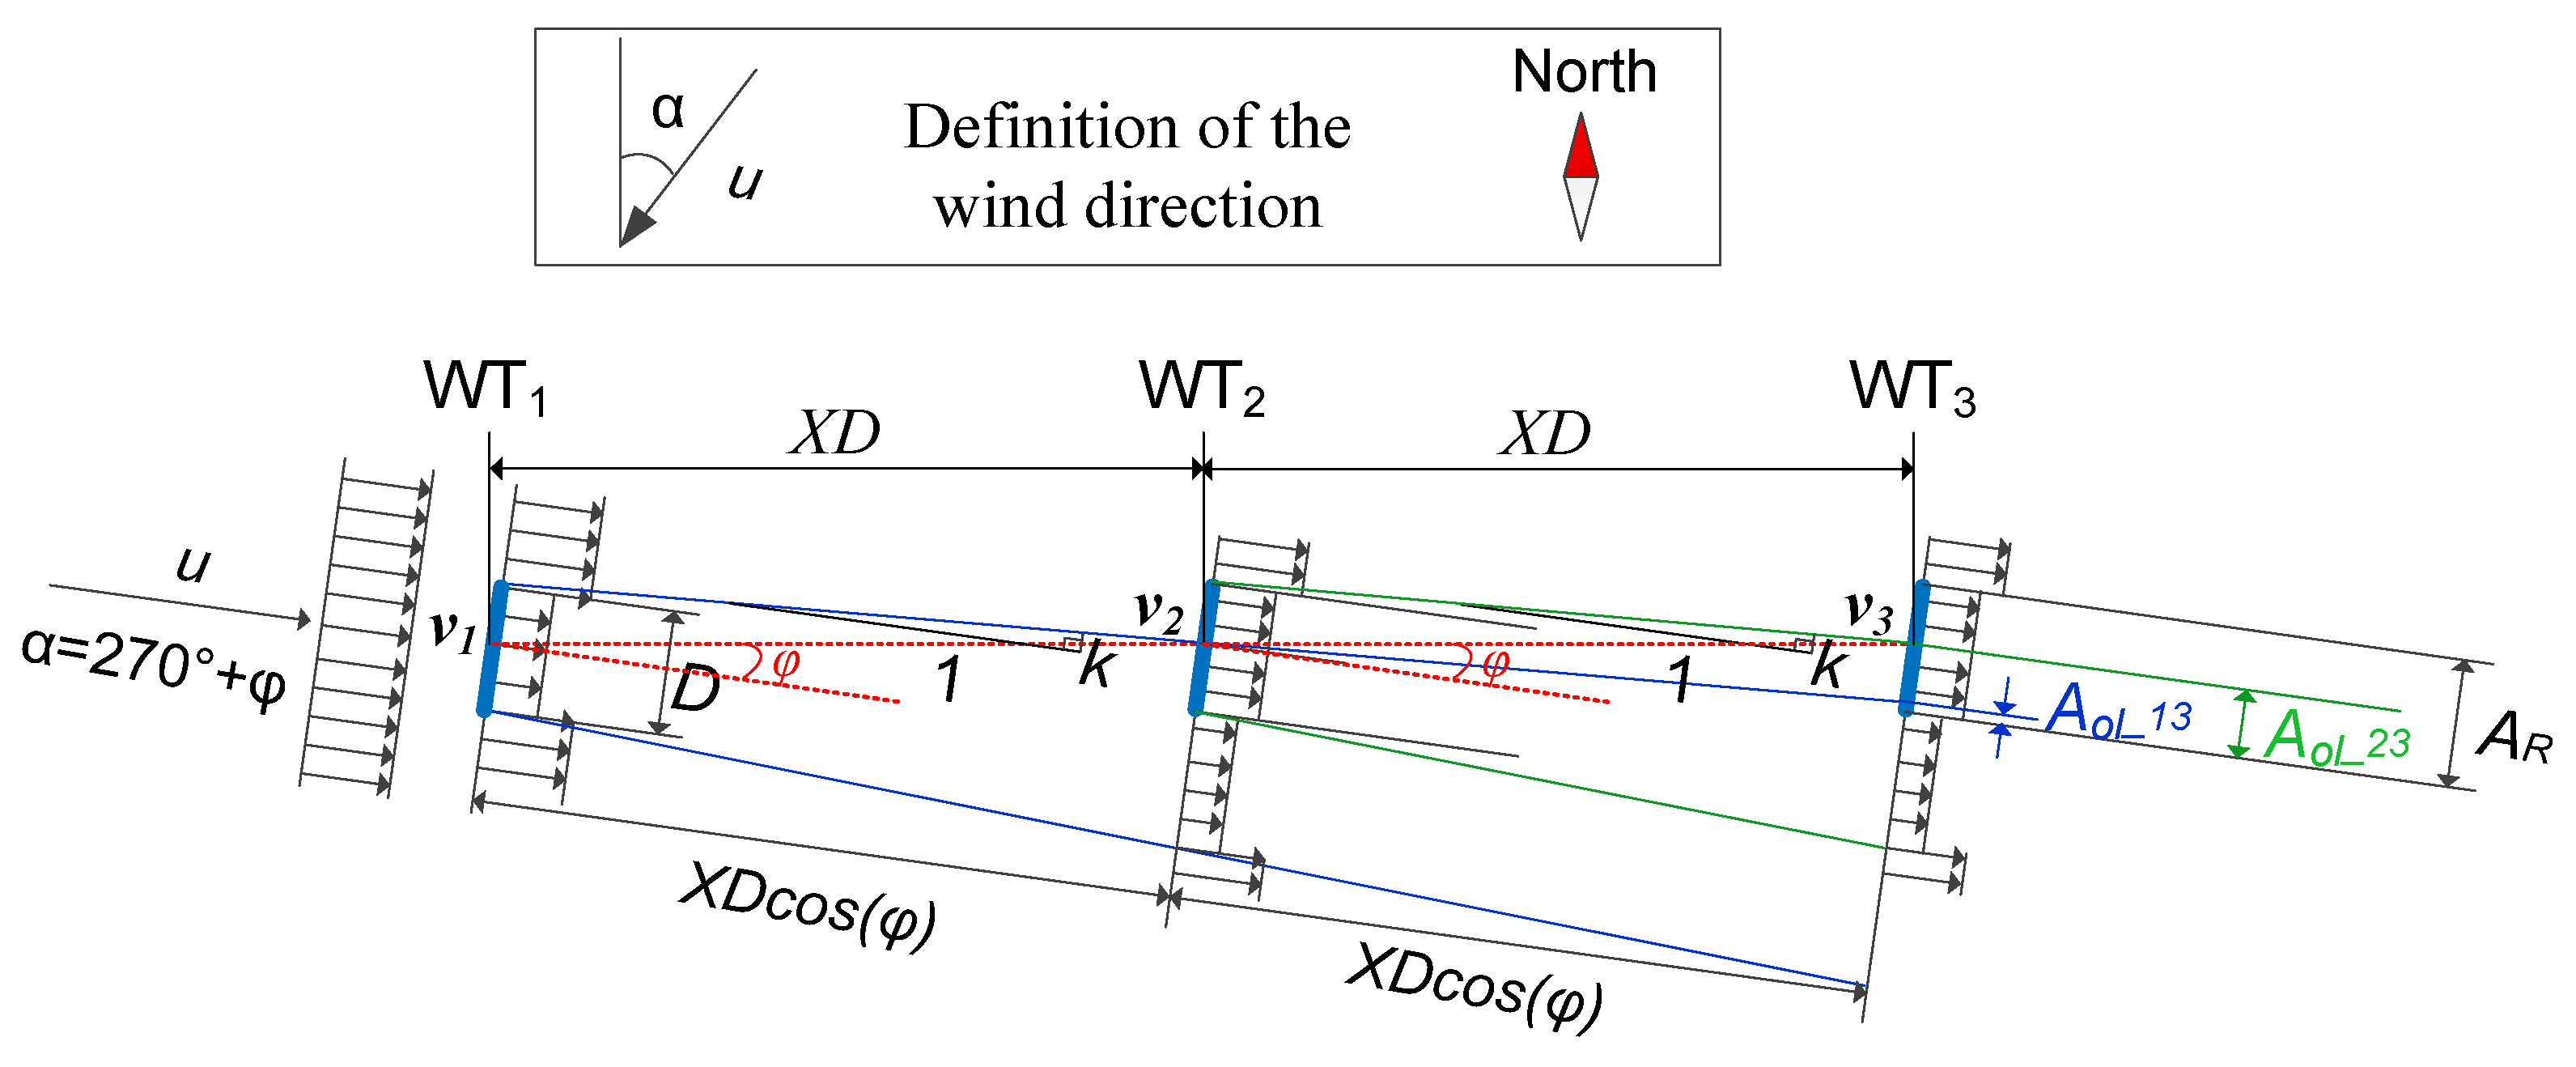
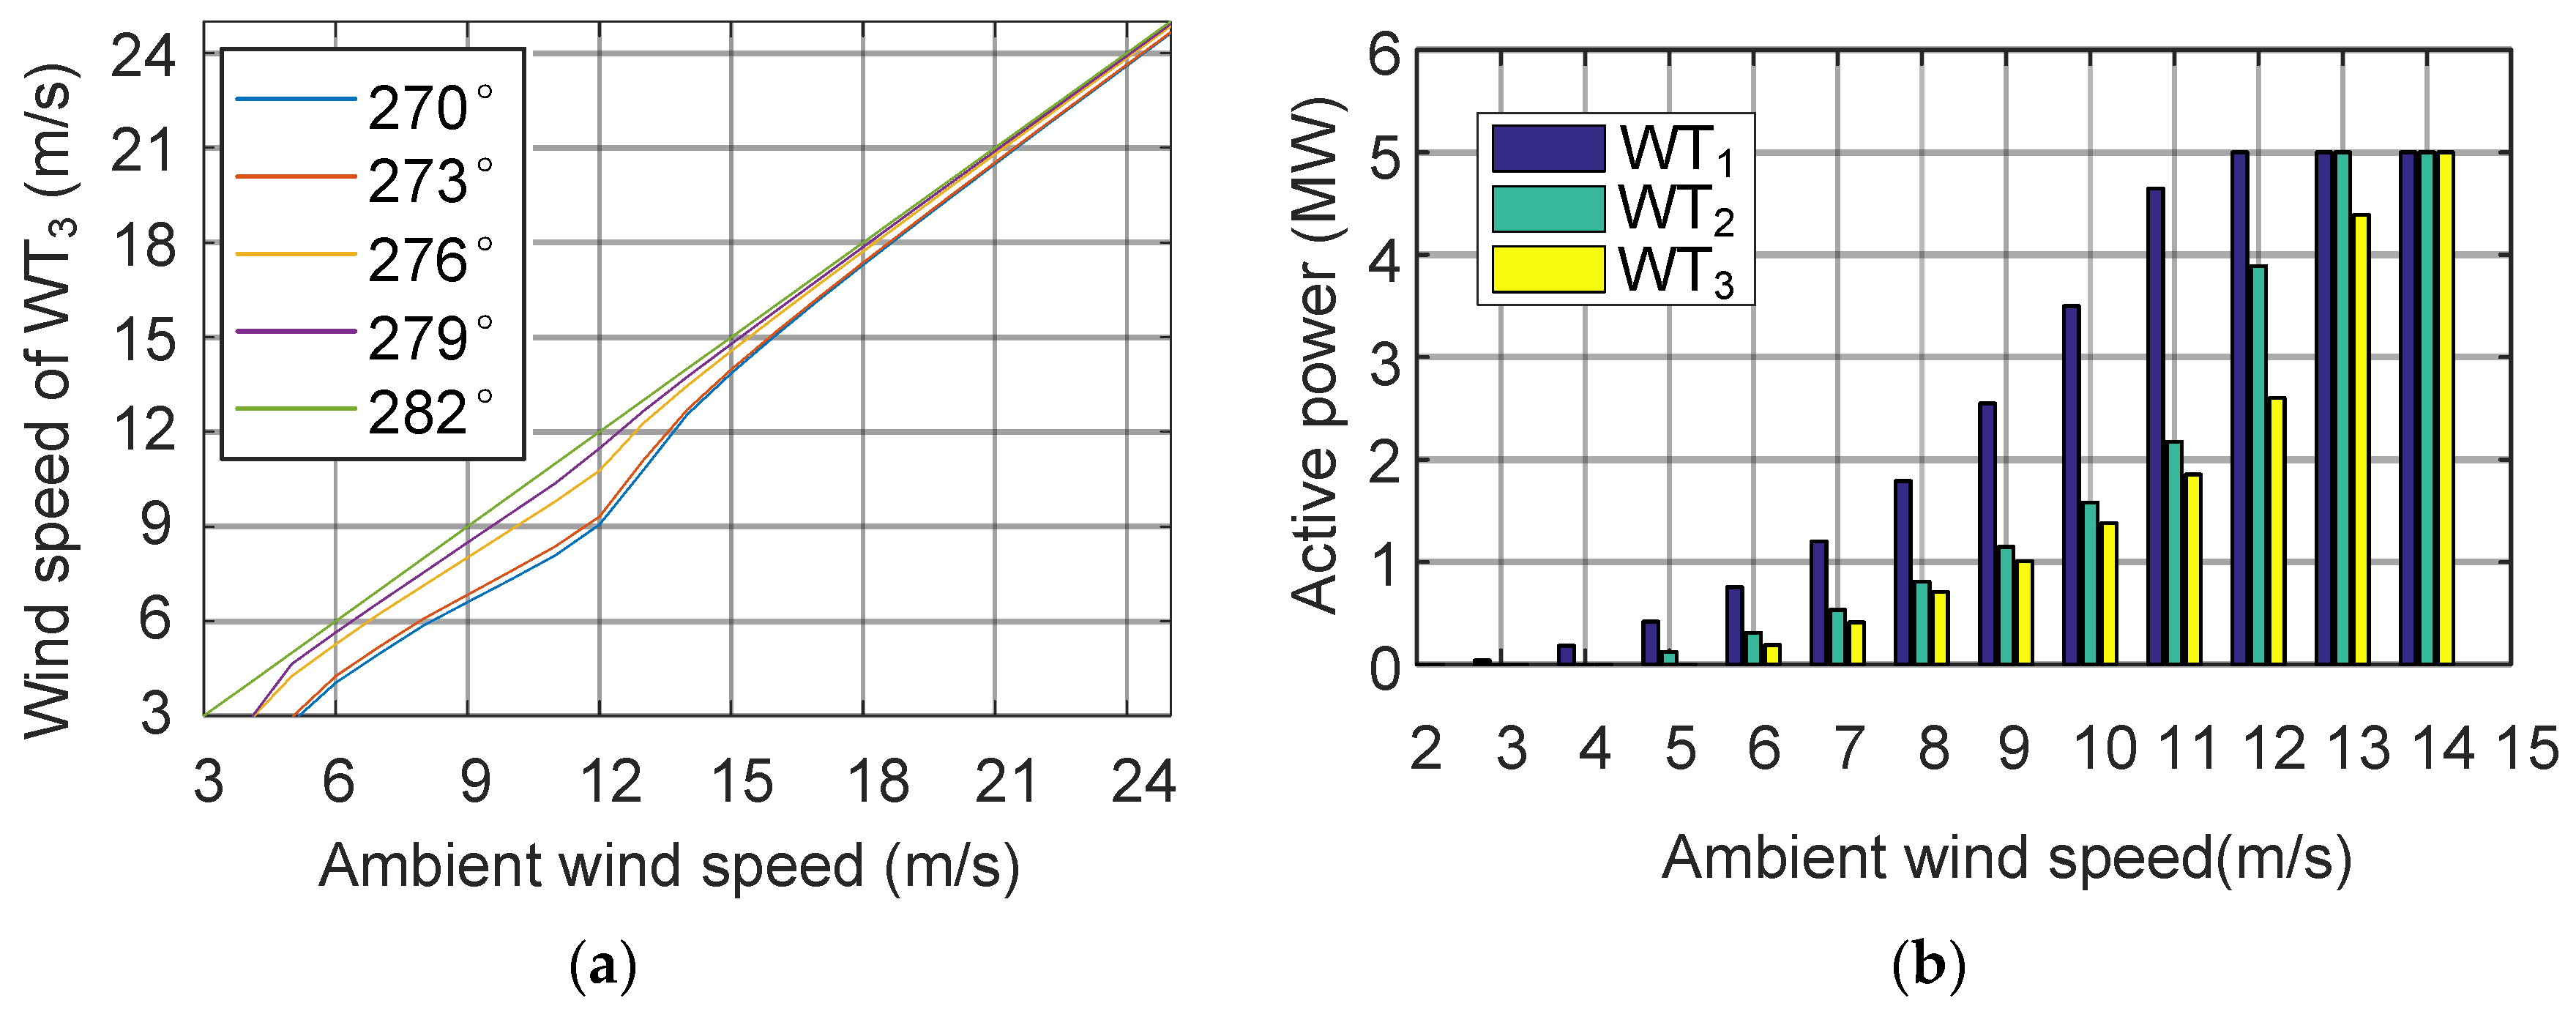
4.1. Multi-Wake Effect

The Katic wake model estimates the wind speed deficit in multiple wakes by summing all the wind speed deficits caused by the upstream wind turbines. At the wind direction of 270°, the wind speed deficit at the position of WT3 1 − v3/u can be calculated by:
( 1 v 3 u ) 2 = ( 1 v 13 ( β 1 , λ 1 ) u ) 2 + ( 1 v 23 ( β 2 , λ 2 ) u ) 2
where v3 is the wind speed at the position of WT3, β1 and λ1 are the pitch angle and tip speed ratio of WT1, and β2 and λ2 are the pitch angle and tip speed ratio of WT2. Referring to Equation (3), the wind speed deficit at the position of WT3 caused by WT1 1 − v13(β1,λ1)/u and the wind speed deficit at the position of WT3 caused by WT2 1 − v23(β2,λ2)/u can be expressed as:
1 v 13 ( β 1 , λ 1 ) u = ( 1 1 C t _ 1 ( β 1 , λ 1 ) ) ( D D + 4 k X D cos ( φ ) ) 2 A o l _ 13 A R
1 v 23 ( β 2 , λ 2 ) u = ( 1 1 C t _ 2 ( β 2 , λ 2 ) ) ( D D + 2 k X D cos ( φ ) ) 2 A o l _ 23 A R
where Aol_13, which is the overlap between the wake area of WT1 and the blade sweep area of WT3, and Aol_23, which is the overlap between the wake area of WT2 and the blade sweep area of WT3, are shown in Figure 11.
In Figure 11, it is noted that Aol_13 is smaller than Aol_23, which indicates that the wind direction range where the WT3 has wind speed deficit caused by WT1 is smaller than the wind direction range where the WT3 has wind speed deficit caused by WT2. Consequently, the wind direction ranges in which the three-turbine wind farm has power loss are the same as wind direction ranges in which the two-turbine wind farm has the power loss, which are four symmetrical wind direction ranges of 258°–270°, 270°–282°, 78°–90° and 90°–102°.
With the MPPT method implemented in WT1, WT2 and WT3, the wind speed of WT3 is shown in Figure 12a, at the wind directions from 270° to 282° with the resolution of 3°. It can be observed in Figure 12a that the wind speed of WT3 has the maximum deficit at the wind direction of 270°. There is no wind speed deficit at the wind direction of 282°. Moreover, the active power of WT1, WT2 and WT3 at the wind direction of 270° is shown in Figure 12b.

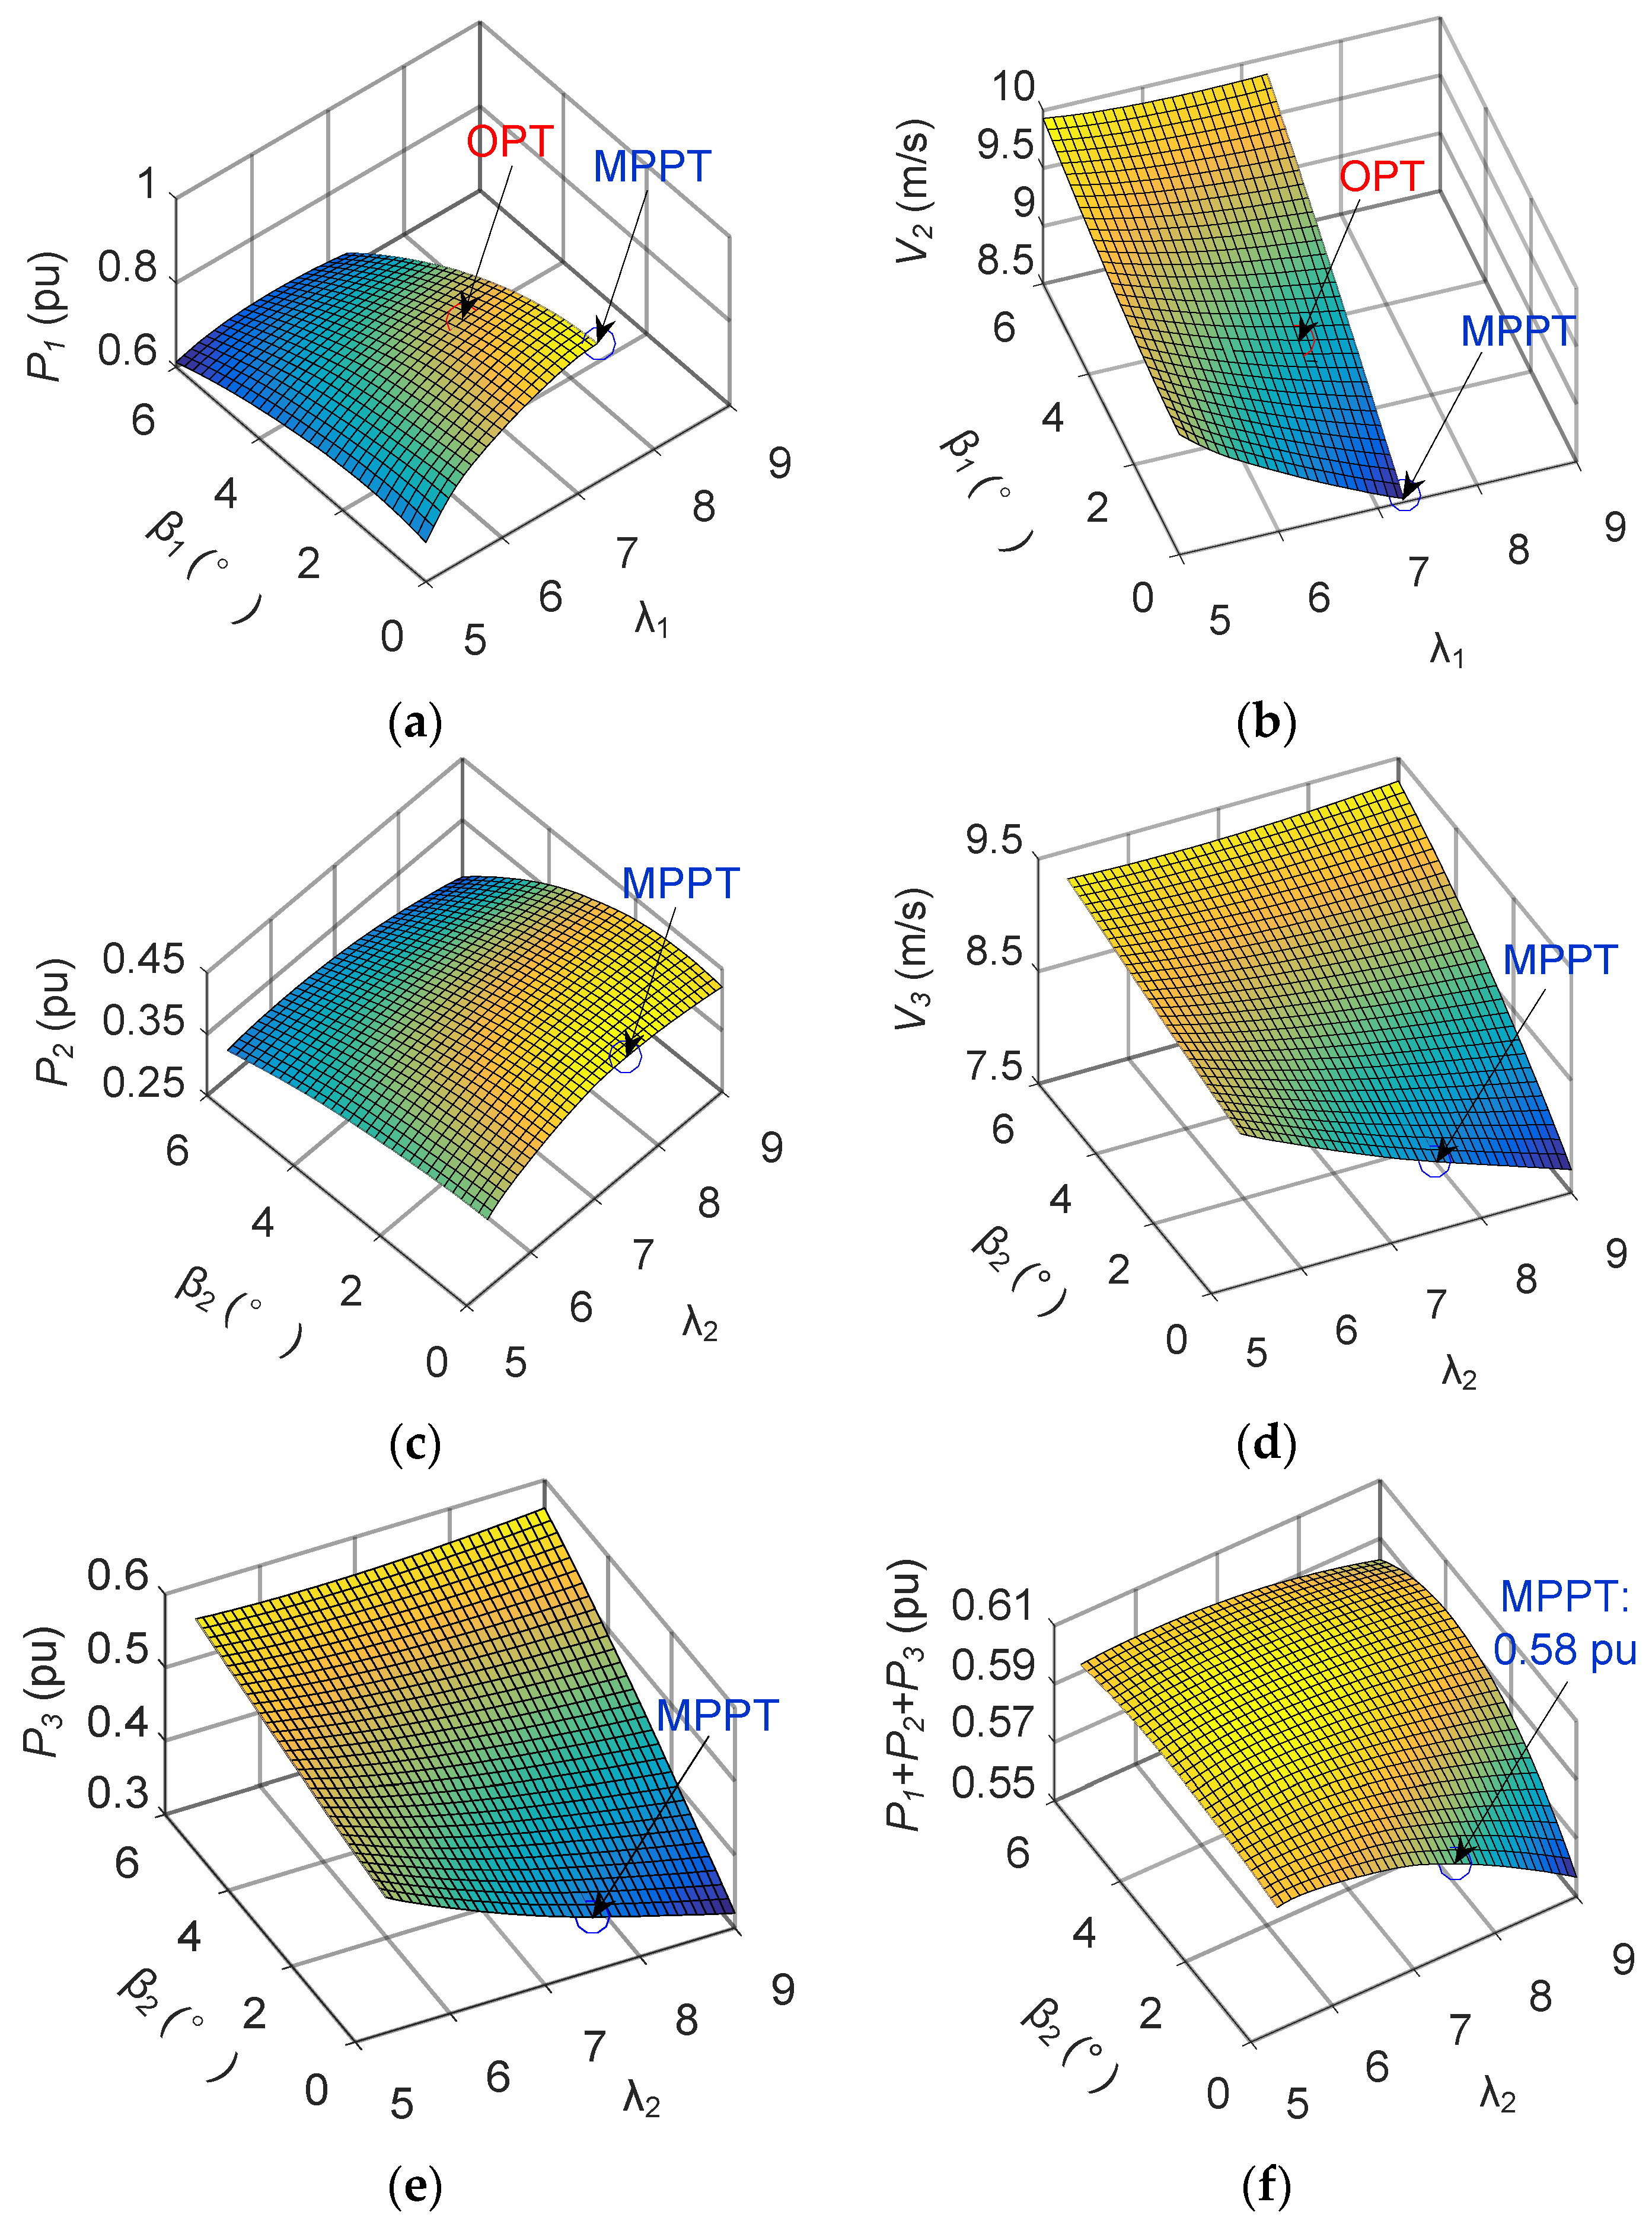
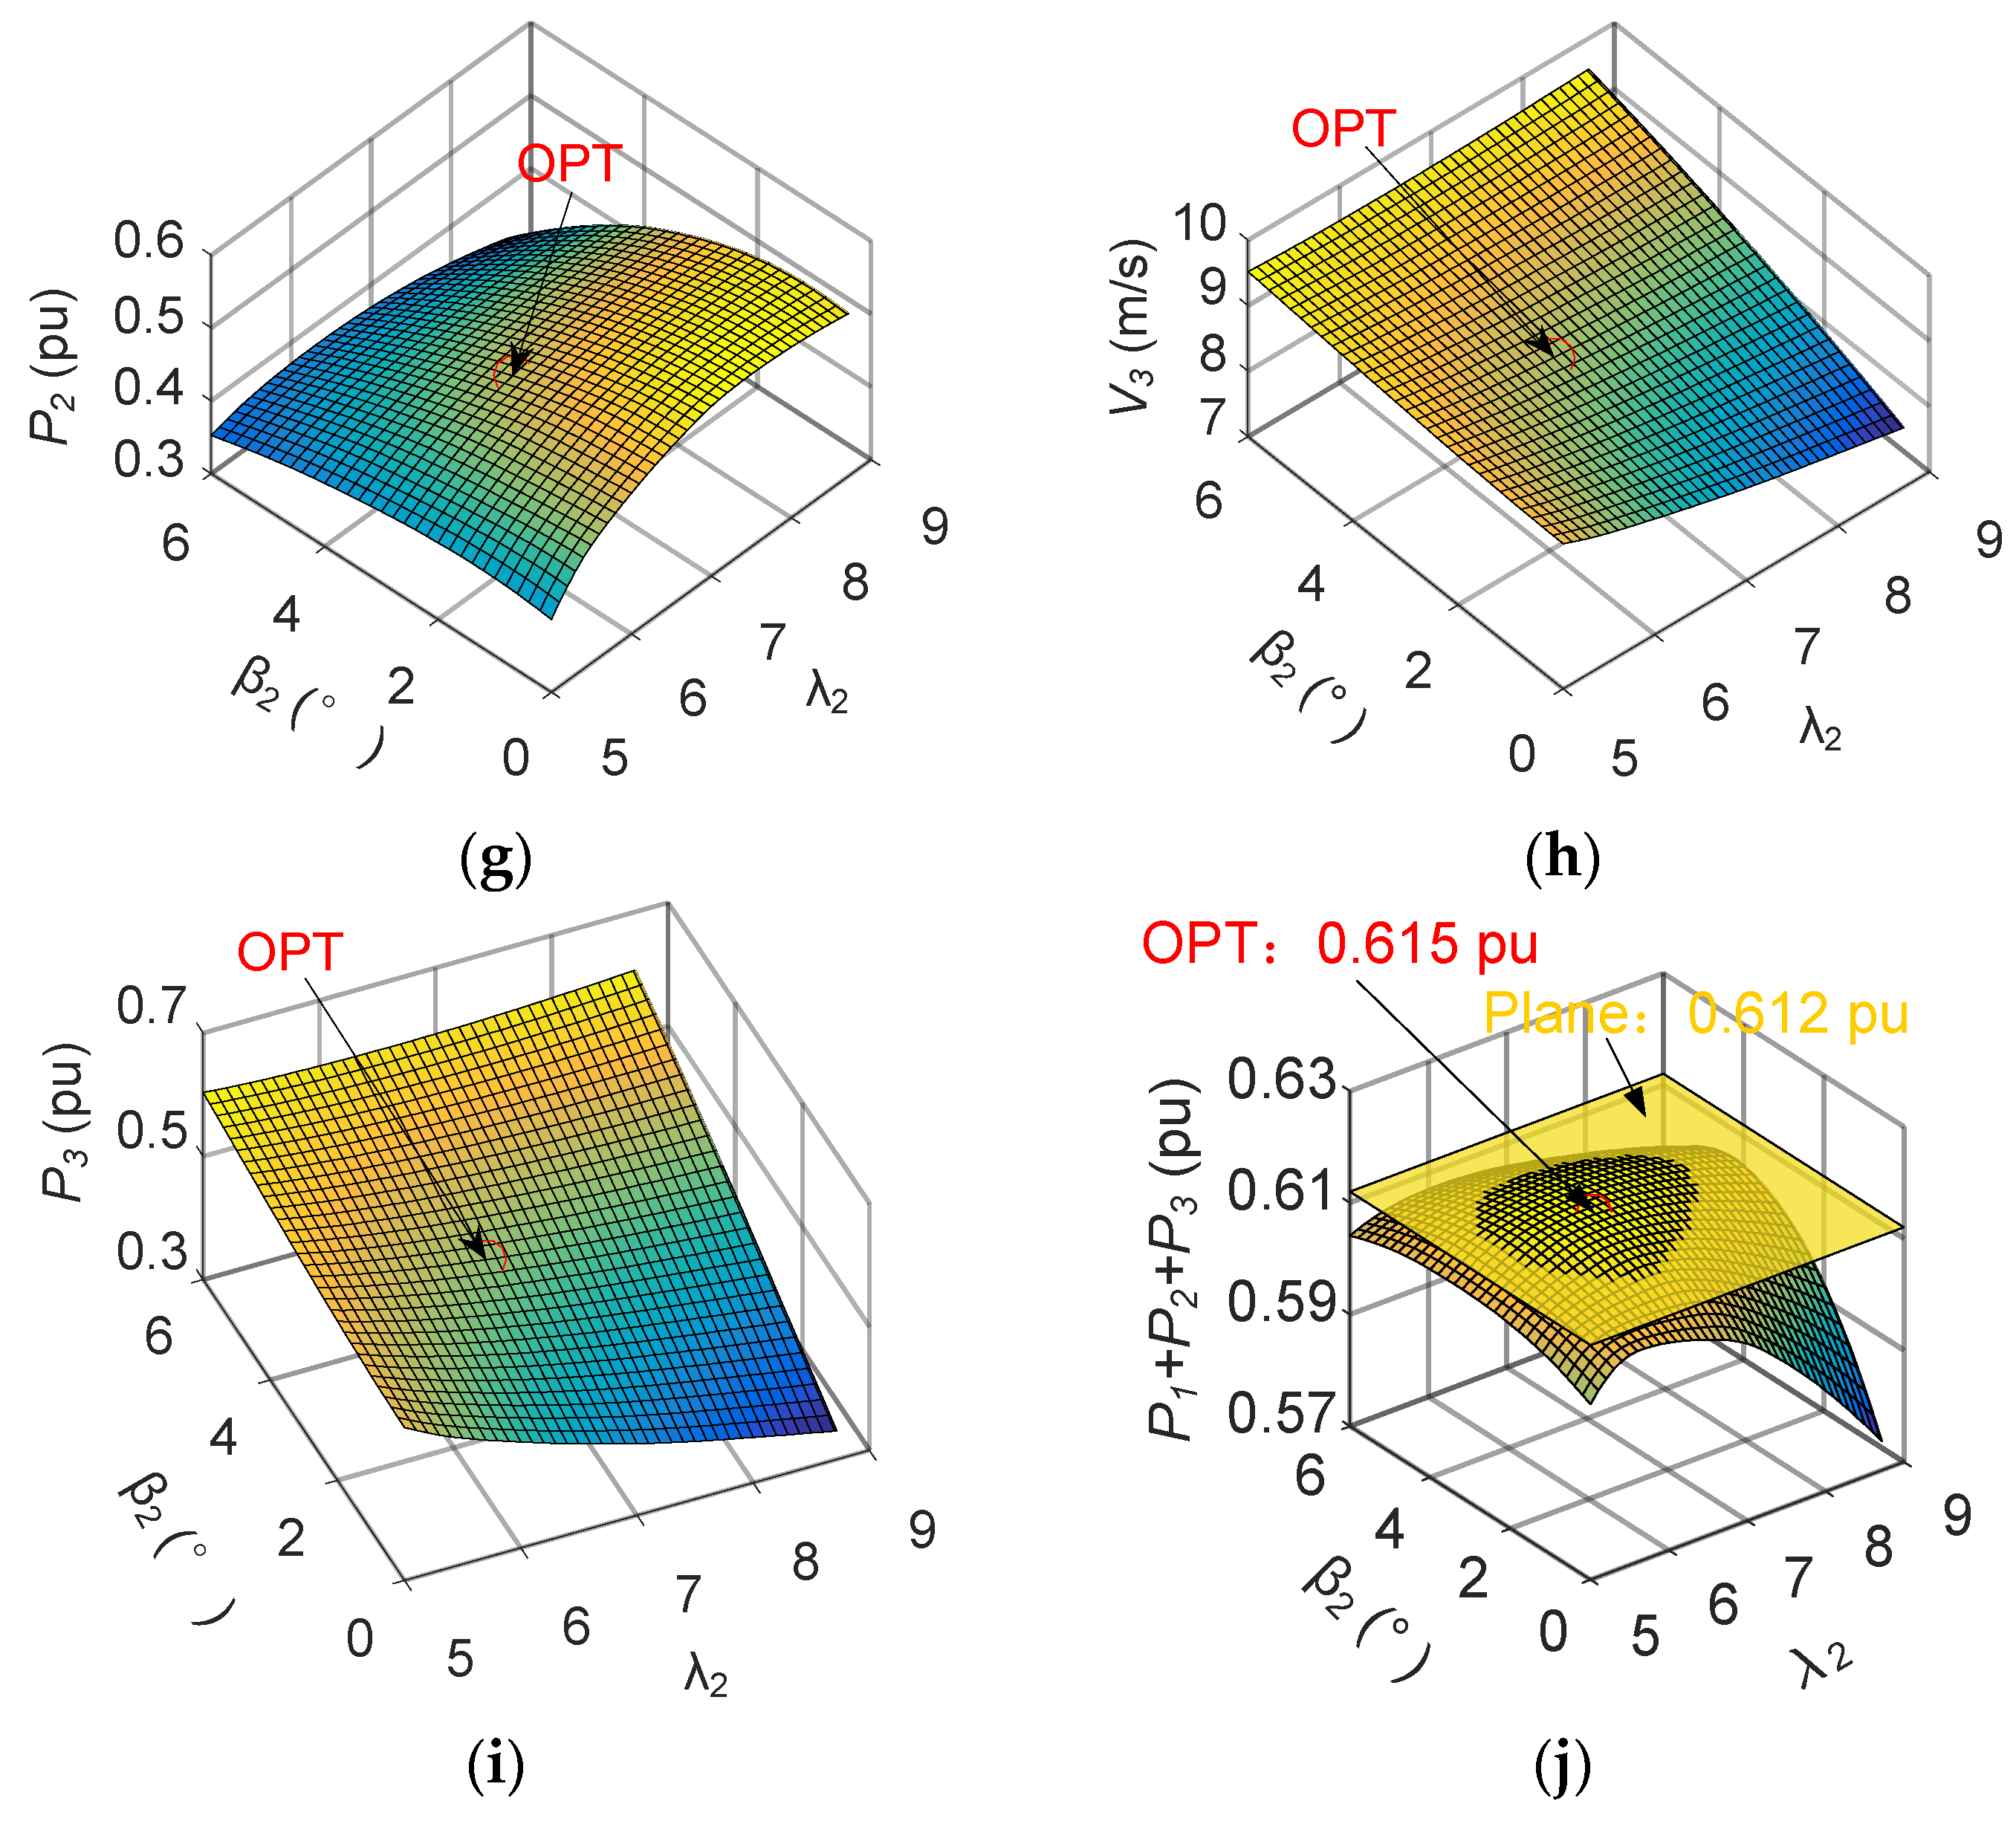
4.2. Active Power Maximization

At the wind direction of 270°, as no power loss is caused by WT3 to the wind farm due to its position, WT3 should be controlled by the MPPT method. The control curves of WT1 and WT2 can be optimized to maximize the total active power of the wind farm. At the wind direction of 270° and at a fixed ambient wind speed u, in the case of m sets of pitch angle and tip speed ratio of WT1 and that m sets of pitch angle and tip speed ratio of WT2 are assumed, m × m possible total active power of the wind farm are expected, as shown in Figure 13. According to Equations (1), (3) and (5), the active power of WT1, the wind speed of WT2 and the wind speed deficit caused by WT1 to WT3 are determined by the pitch angle and tip speed ratio of WT1. At a fixed wind speed of WT2, according to Equations (1) and (6), the active power of WT2 and the wind speed deficit caused by the WT2 to WT3 are determined by the pitch angle and tip speed ratio of WT2. Then, the wind speed of WT3 is determined both by the pitch angle and tip speed ratio of WT1 and WT2, as expressed by Equation (4). Controlled by the MPPT method, the active power of WT3 can be calculated by Equation (1).
In the three-turbine wind farm, the optimal pitch angle and tip speed ratio of WT1 and WT2 can also be selected by the exhausted search method. Firstly, all the total active power of the wind farm in terms of the pitch angle and tip speed ratio of WT1 and WT2 are calculated with a resolution. Afterwards, the maximum total active power of the wind farm can be selected. Finally, the corresponding optimal pitch angle and tip speed ratio of WT1 and WT2 can be obtained.
At the wind direction of 270° and ambient wind speed of 11 m/s, the active power of WT1 and the wind speed of WT2 in terms of the pitch angle and tip speed ratio of WT1 are shown in Figure 14a,b. In the case that WT1 is controlled by the MPPT method, the pitch angle and the tip speed ratio of WT1 are 0° and 7.55 respectively. Due to the rotor speed limit of 12.1 rpm, the tip speed ratio of WT1 is limited at 7.26. When WT1 is operating at the pitch angle of 0° and tip speed ratio of 7.26, the active powers of WT2, the wind speeds of WT3, the active powers of WT3 and the total active powers of the wind farm in terms of the pitch angle and tip speed ratio of WT2 are respectively shown in Figure 14c–f. As shown in Figure 14f, the total active power of the wind farm is 0.58 pu.
At the wind direction of 270° and ambient wind speed of 11 m/s, selected by the exhausted search method, the optimal pitch angle and tip speed ratio of WT1 are 2.2° and 6.7 respectively. The optimal pitch angle and tip speed ratio of WT2 are 2.8° and 6.5 respectively. When the WT1 is operating at the optimal pitch angle and tip speed ratio of WT1 as shown in Figure 14a,b marked with OPT, the active powers of WT2, the wind speeds of WT3, the active powers of WT3 and the total active powers of the wind farm in terms of the pitch angle and tip speed ratio of WT2 are respectively shown in Figure 14g–j. As shown in Figure 14j, the total active power of the wind farm is increased to 0.615 pu. Compared with the MPPT method, the total active power is increased by 0.035 pu.
With the optimized pitch angle and tip speed ratio of WT1 and WT2, the optimized pitch angle and active power curve of WT1 and WT2, at the wind directions from 270° to 282°, with the resolution of 6°, are shown in Figure 15a,b. It can be observed that the pitch angle and tip speed ratio of WT1 and WT2 are optimized at the wind speeds from 7 m/s to 11 m/s. Comparing the MPPT method and the proposed active power control method, the active power of WT1, WT2, WT3 and the total active power of the wind farm at the wind direction of 270° are shown in Figure 15c, with the ambient wind speeds in the range of from 3 m/s to 11 m/s with a resolution of 1 m/s. It can be seen that, at the ambient wind speed of from 7 m/s to 13 m/s, the active power of WT1 is reduced. However, the active powers of WT2 and WT3 are increased. Overall, the active power of the wind farm is increased.
As shown in Figure 15a,b, the optimal pitch angle and tip speed ratio of WT1 are 2.0° and 6.8, at the wind speed of 9 m/s at the position of WT2. The optimal pitch angle and tip speed ratio of WT2 are 1.8° and 6.9 at the wind speed of 9 m/s at the position of WT2. The optimized pitch angle of WT1 is larger than the optimized pitch angle of WT2, because of greater power loss caused by WT1 compared to WT2 to the wind farm. It is evident that the optimized pitch angle of the upstream wind turbine is larger than the optimized pitch angle of the downstream wind turbine and the optimized tip speed ratio of the upstream wind turbine is smaller than the optimized tip speed ratio of the downstream wind turbine. Moreover, as shown in Figure 14j, the total active power of the wind farm has a slight difference, less than 0.003 pu, when the WT2 is operating in the pitch angle range from 1.5° to 4° and in the tip speed ratio range from 6 to 7. Consequently, to simplify the problem, the optimized control curves of WT1 and WT2 can be assumed to be the same.
Furthermore, at the wind direction of 270°, as the optimized control curves of WT1 and WT2 in the three-turbine wind farm is almost the same as the optimized control curves of WT1 in the two-turbine wind farm, the optimized control curves of WT1 in the two-turbine wind farm can simply be implemented in WT1 and WT2 in the three-turbine wind farm. Thus, the computation complexity can be reduced from m × m to m, where m is the number of possible sets of pitch angle and tip speed ratio of each wind turbine. This simplification can be extended into the wind farms with more wind turbines in a line, e.g., in the wind farm with ten turbines in a line, the optimized control curves of WT1 in the two-turbine wind farm at the wind direction of 270° can simply be implemented in all the upstream wind turbines. The computation complexity will be reduced from m10 to m.

5. Wake Effect and Active Power Maximization in a Large-Scale Wind Farm
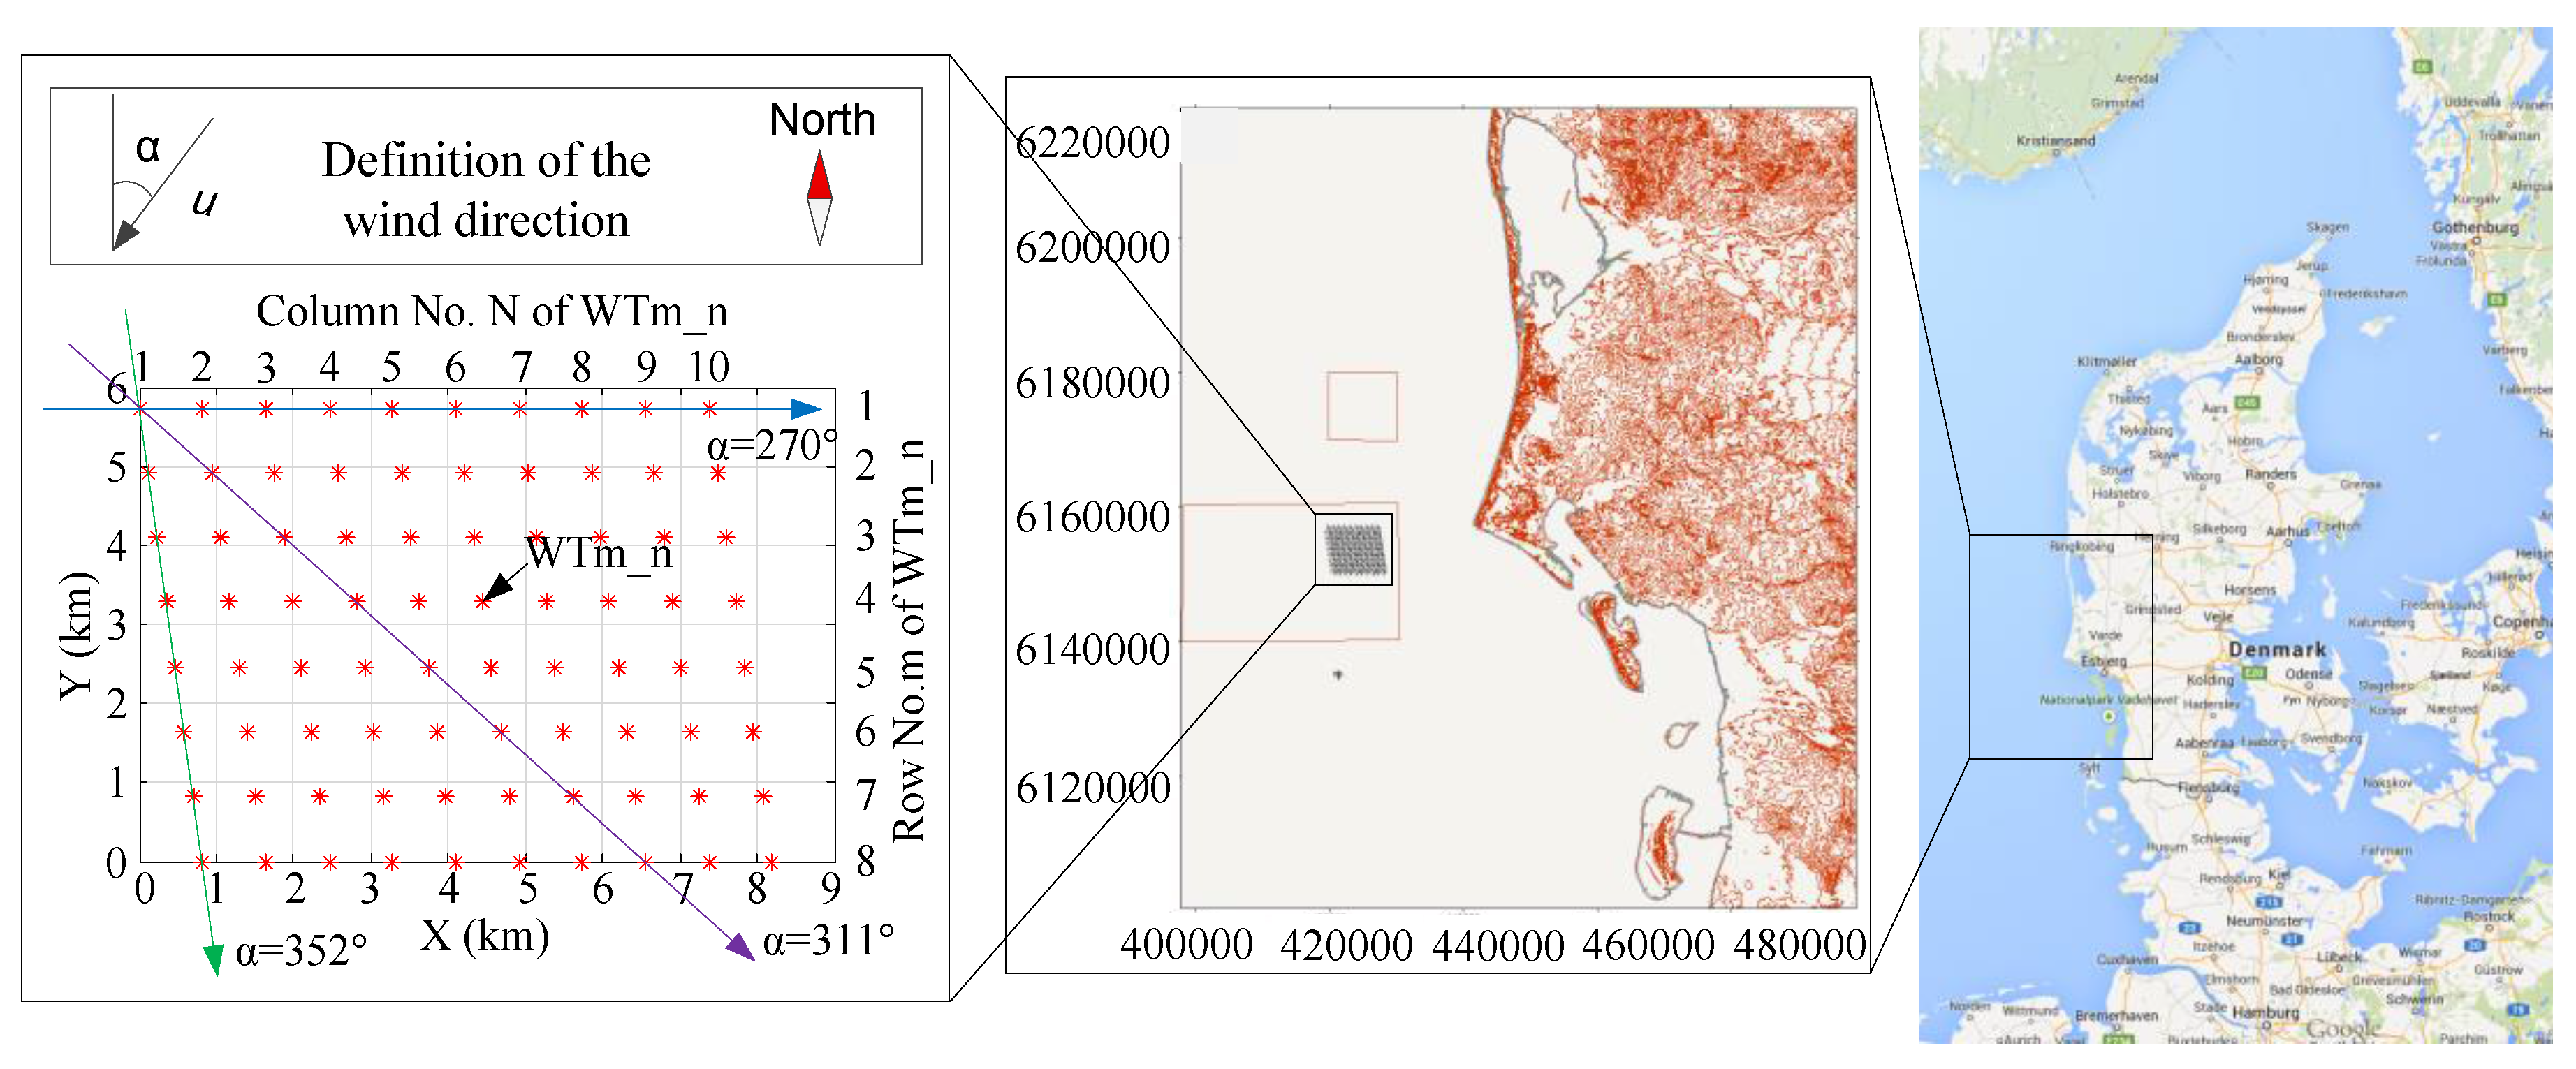
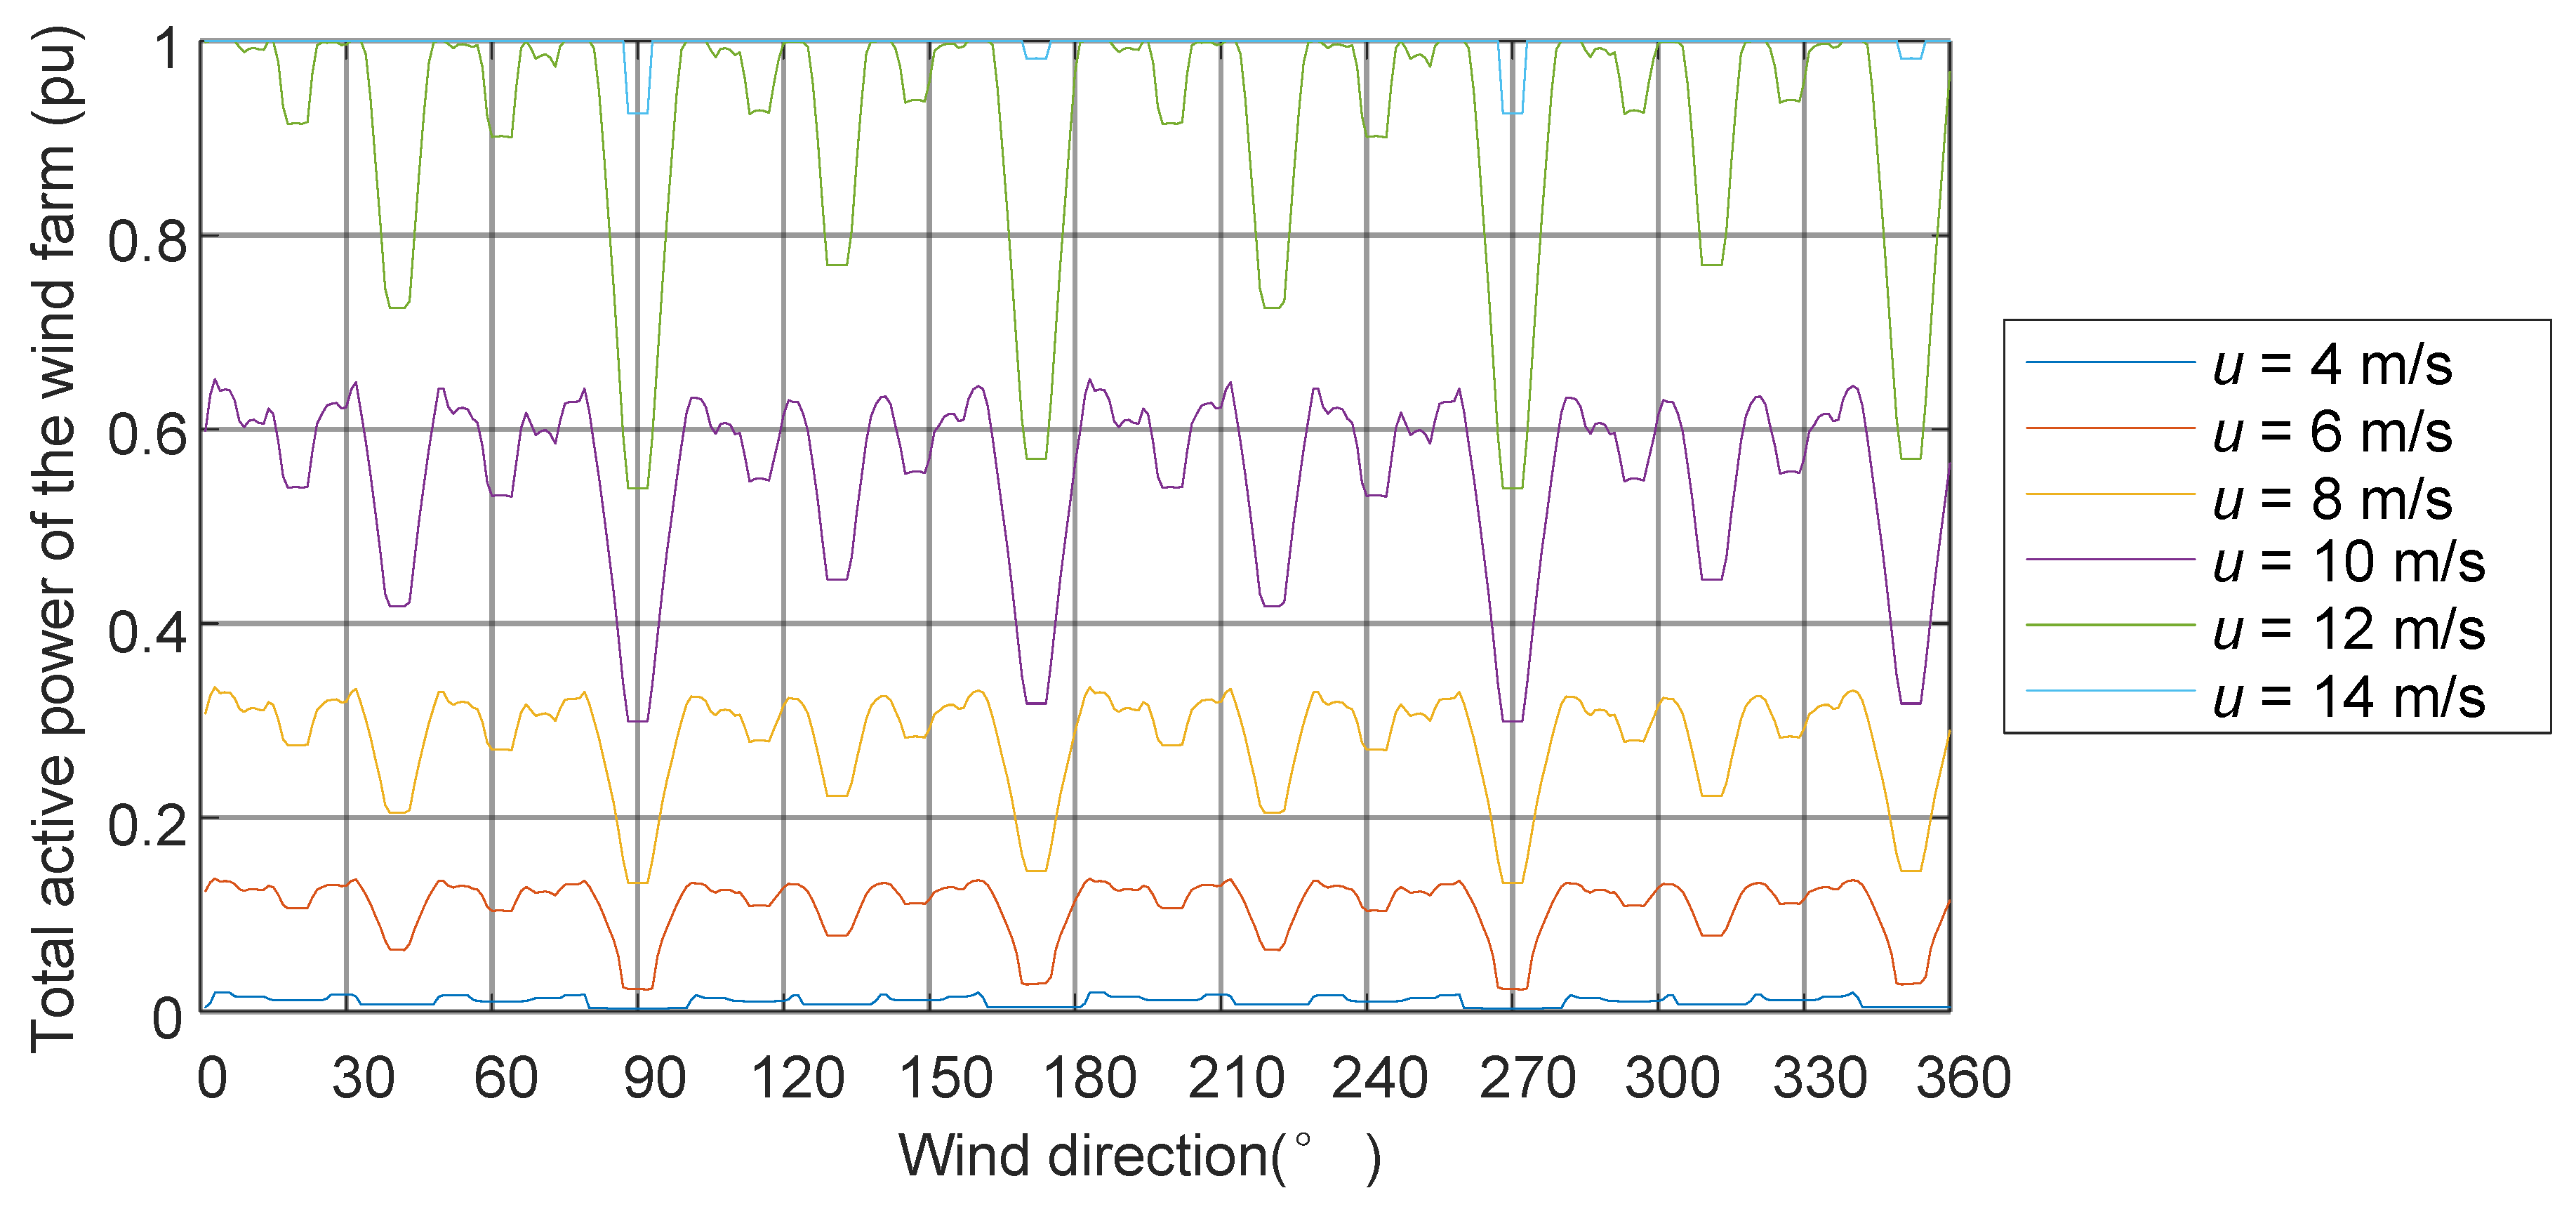
In this section, the proposed method to maximize the total active power of the wind farm is demonstrated in an eighty-turbine wind farm. The layout of the wind farm is shown in Figure 16, which is the same as the Horns Rev offshore wind farm in Denmark [22]. A total of 80 NREL 5 MW DFIG wind turbines in the wind farm with 6.5 diameters of distance between the two adjacent wind turbines in the same row or in the same column are assumed. Finally, the annual energy production (AEP) of the wind farm is calculated and compared between the MPPT method and the proposed method.

5.1. Wake Effect

In the eighty-turbine wind farm, controlled by the MPPT method, the total active powers of the wind farm are shown in Figure 17. In Figure 17, the wind directions in the range of from 0° to 360° with a resolution of 1° and the ambient wind speeds of 4 m/s, 6 m/s, 8 m/s, 10 m/s, 12 m/s and 14 m/s are taken into account. The wind speed at the position of the downstream wind turbines are calculated by (3)–(6), where the decay constant k = 0.04 is assumed. In Figure 17, it can be observed that the large amount of power loss due to the wake effect in the wind farm appears at the wind directions of around 20°, 41°, 62°, 90°, 115°, 131°, 147°, 172°, 200°, 221°, 242°, 270°, 295°, 311°, 327° and 352°. At these wind directions, there is huge potential to increase the total active power of the wind farm with the proposed active power control method.

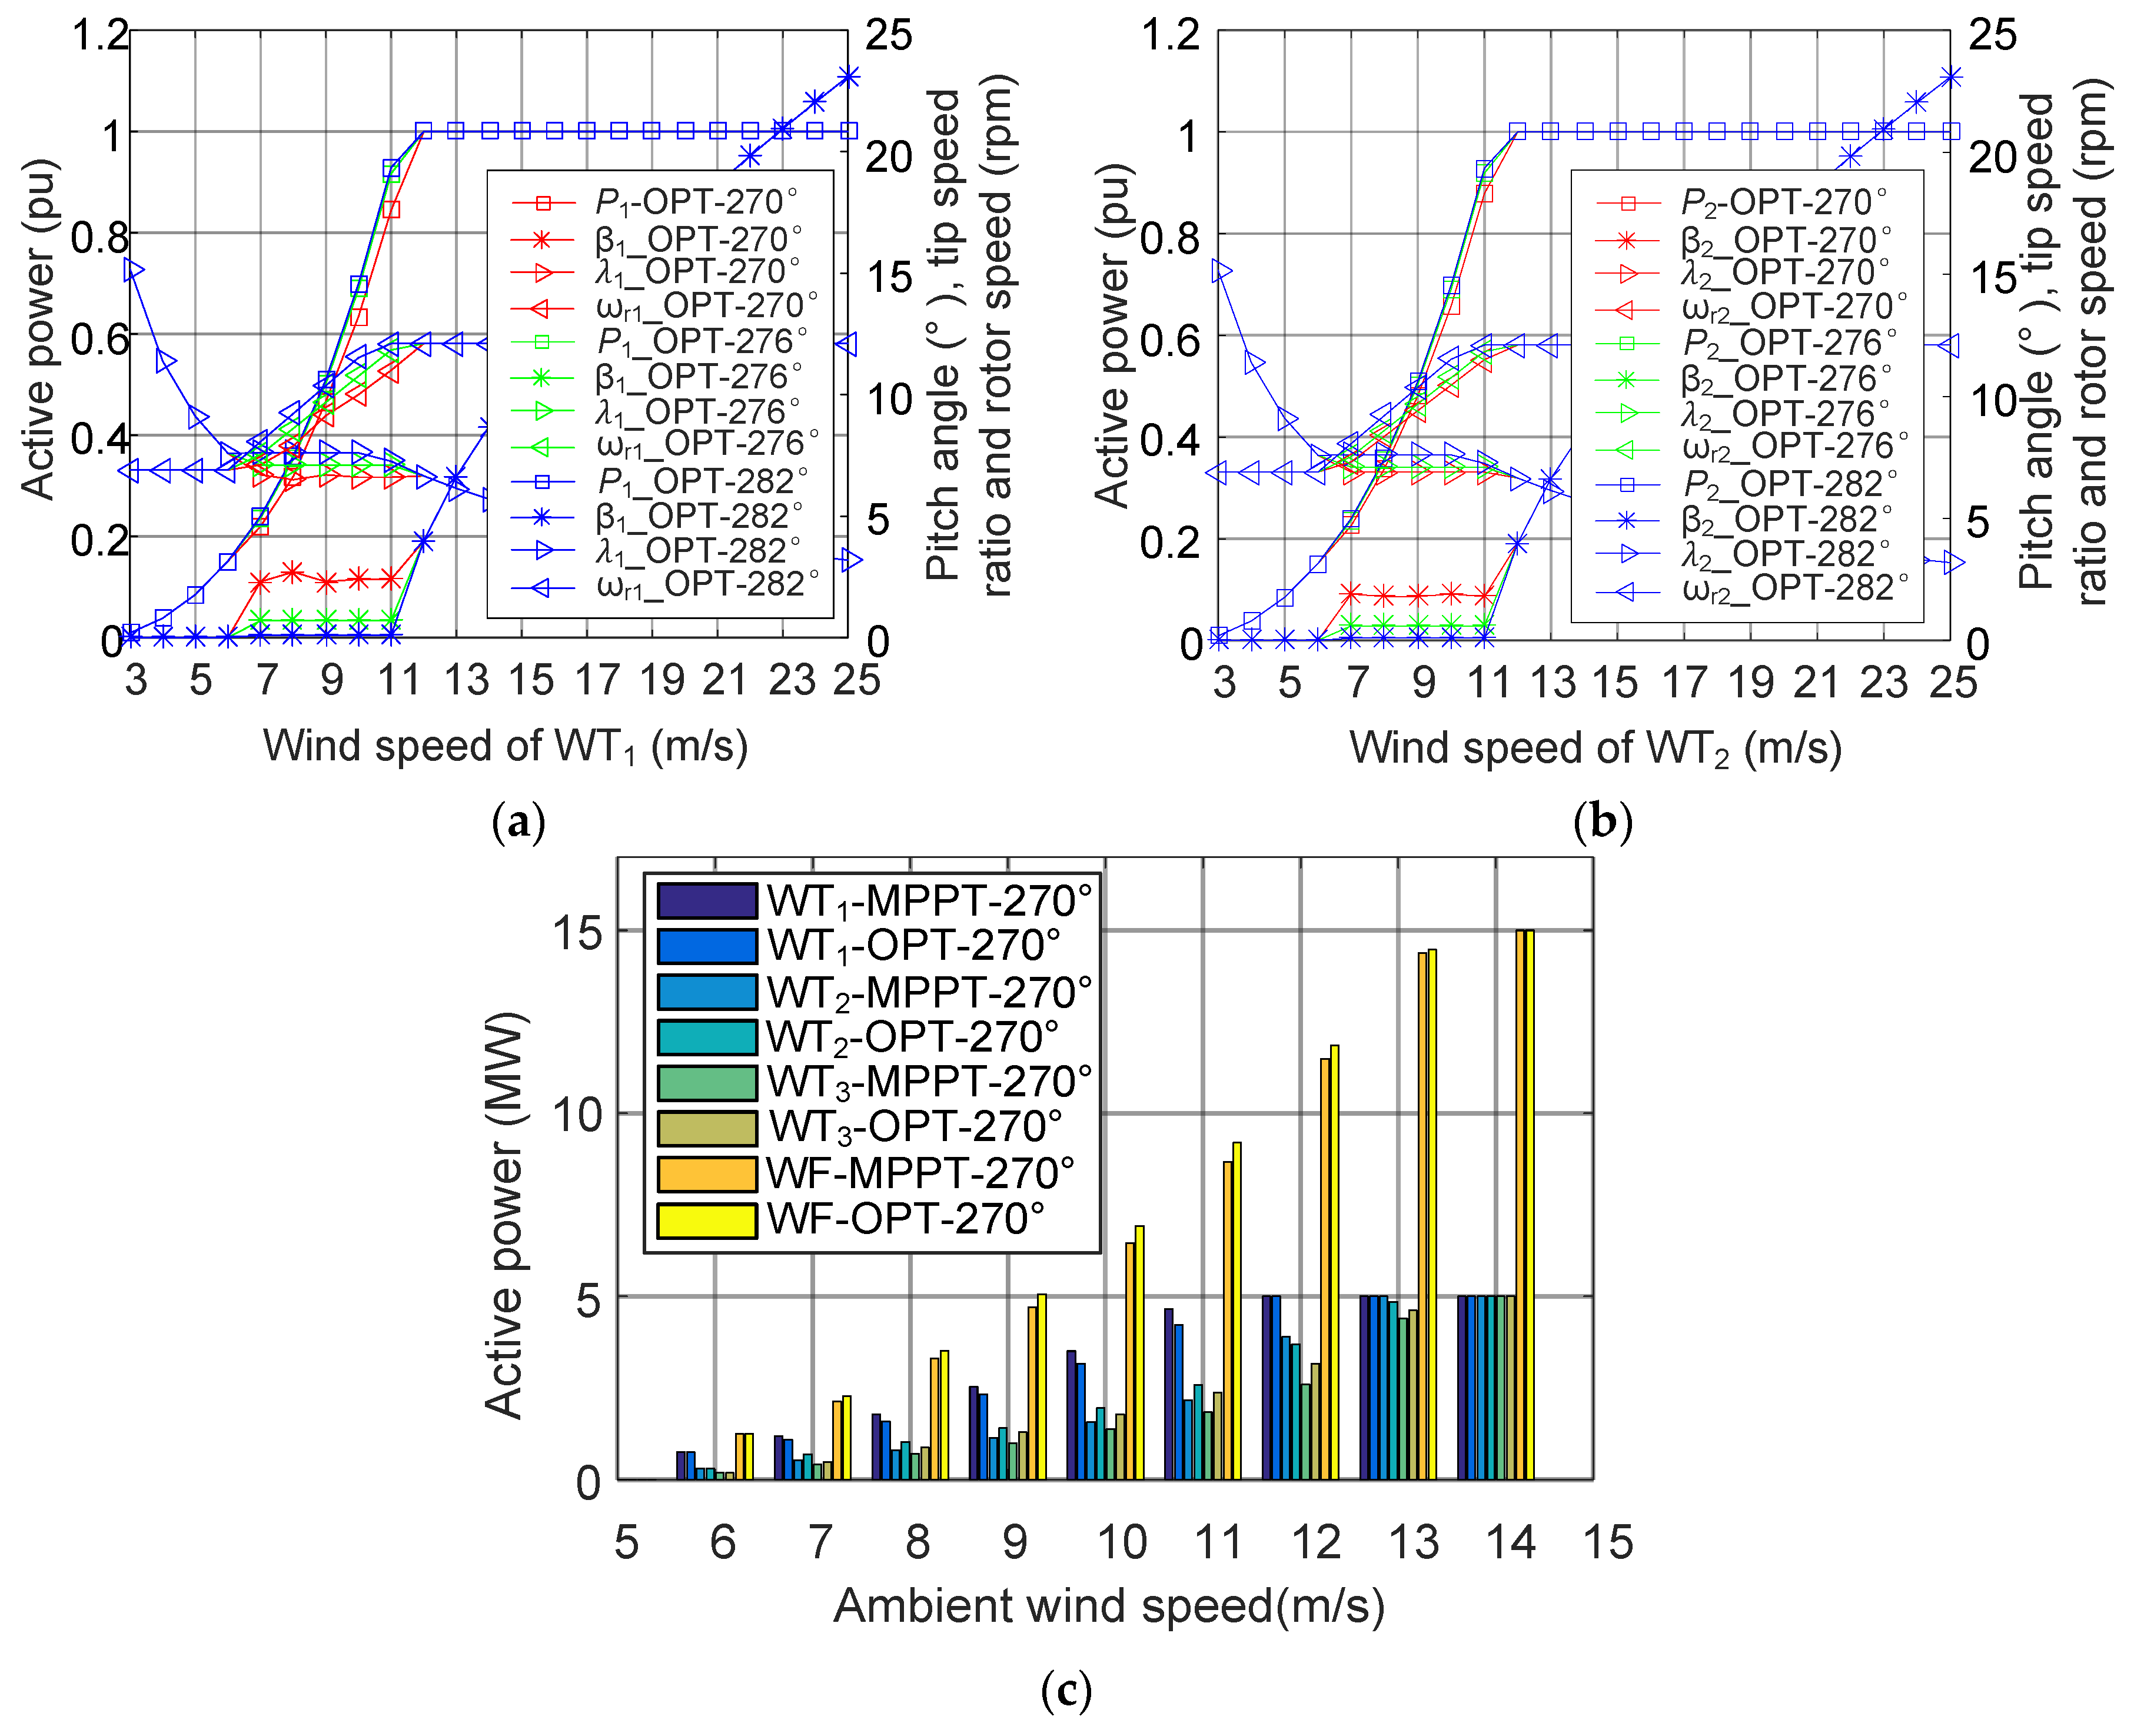
5.2. Active Power Maximization

In the eighty-turbine wind farm, at the wind direction of 270°, the wind turbine in one row will not cause the power loss to the wind turbines in other rows because of the small decay constant. In this case, the wind farm can be seen as eight isolated ten-turbine wind farms as shown in Figure 18. As discussed and concluded in Section 4.2, at the wind direction of 270°, the optimized control curves of WT1 in the two-turbine wind farm can simply be implemented in WT1–WT9 in the ten-turbine wind farm. Thus, the optimization computation complexity in the ten-turbine wind farm will be reduced from m10 to m. With the optimized control curves of WT1 in the two-turbine wind farm as shown in Figure 15a implemented in WT1–WT9 and with the MPPT method implemented in WT10, the total active power of the ten-turbine wind farm is shown in Figure 19, where the total active power of the ten-turbine wind farm can be increased at the ambient wind speeds from 7 m/s to 14 m/s. In the eighty-turbine wind farm, at the wind direction of 270°, the optimized control curves of the wind turbines in the same column are the same, e.g., the optimized control curves of WT1_1, WT2_1, WT3_1, WT4_1, WT5_1, WT6_1, WT7_1 and WT8_1 in the eighty-turbine wind farm are the same as the optimized control curves of WT1 in the ten-turbine wind farm.
As shown in Figure 17, the large amount of power loss due to the wake effect in the eighty-turbine wind farm appears at the wind directions of around 20°, 41°, 62°, 90°, 115°, 131°, 147°, 172°, 200°, 221°, 242°, 270°, 295°, 311°, 327° and 352°. At the wind direction of 90°, the eighty-turbine wind farm can also be seen as eight isolated ten-turbine wind farms. The optimized control curves of WT1 at the wind direction of 270° in the two-turbine wind farm as shown in Figure 15a can simply be implemented in WTm_1-WTm_9 in the eighty-turbine wind farm. At the wind direction of 172° and 352°, the eighty-turbine wind farm can be seen as 10 isolated eight-turbine wind farms. The optimized control curves of WT1 at the wind direction of 270° in the two-turbine wind farm as shown in Figure 15a can simply be implemented in WT8_n–WT2_n and WT1_n–WT7_n respectively in the eighty-turbine wind farm. At the wind directions of 41°, 131°, 221° and 311°, the wind farm can be seen as the isolated wind farms. However, the isolated wind farms have different number of wind turbines. In each of the isolated wind farms, the optimized control curves of WT1 at the wind direction of 270° in the two-turbine wind farm can also be implemented in the upstream wind turbines in each isolated wind farms. Besides, as the distance between two adjacent wind turbines is larger than in the ten-turbine wind farm, the optimized pitch angle is smaller than in Figure 15a and the tip speed ratio is larger than in Figure 15a.
In the rectangular layout wind farms at the wind directions where the wind farm should not seem isolated or in the nonrectangular layout wind farms, the optimal pitch angle and tip speed ratio of all the wind turbines can be selected by the exhausted search or by the PSO- or GA-based optimization algorithms. Then, optimal control curves of each individual wind turbine need to be generated with the optimized pitch angle and tip speed ratio. In this case, the computation complexity cannot be reduced. However, other solutions may be implemented to reduce the computation complexity (e.g., to separate the wind farm into number of zones or use the method proposed in [23]). In this paper, the typical regular layout wind farms are studied. In the eighty-turbine wind farm with the rectangular layout, at the wind directions of 20°, 62°, 115°, 147°, 200°, 242°, 295° and 327°, the wind farms cannot be considered as isolated wind farms. Considering the smaller power loss in the wind farm due to wake effect, the large computation complexity and the estimation error of the wake model, the wind farm operator can make a trade-off whether to do the optimization at these wind directions.

5.3. Annual Energy Production

In this subsection, the annual energy production (AEP) of the eighty-turbine wind farm is compared between the MPPT method and the proposed active power control method. The AEP is calculated by WAsP, which is the industry standard software for wind resource assessment and siting of wind turbines and wind farms [21]. The annual wind direction and wind speed distribution at the location of the wind farm, as shown in Figure 20, is taken into account. In Figure 20a, the wind rose is separated into 36 sectors with 10° for each.
As shown in Figure 17, the active power of the wind farm is the same at the wind directions from 269° to 273°. This is because, at these wind directions, each wind turbine has the same power loss due to the wake effect. Thus, the optimized control curves of each wind turbine are the same at these wind directions. However, the active power of the wind farm decreases with the wind direction changing from 269° to 265° and from 273° to 275°, because of the reduced power loss. To simplify the problem, the optimized control curves of each wind turbine at the wind direction of 270° are implemented at all the wind directions in the wind rose sector from 265° to 275°. It is the same case in the wind directions around 90°, 172° and 352°. Consequently, to calculate the AEP of each wind turbine in the rose sectors of 85°–95°, 165°–175°, 265°–275° and 345°–355°, the optimized control curves generated at the wind direction of 90°, 172°, 270° and 352° are respectively implemented at the wind directions in the wind rose sector of 85°–95°, 165°–175°, 265°–275° and 345°–355°.
Comparing the MPPT method and the proposed active power control method, the AEP of each wind turbine at the wind directions in the rose sectors of 85°–95°, 165°–175°, 265°–275° and 345°–355°, are calculated and shown in Table 2 and Table 3. It can be observed that the AEP of the wind turbines in the first two rows or columns along the wind direction are reduced, but the AEP of the other wind turbines are increased. The AEP of the wind farm are respectively increased by 19.2%, 12.7%, 11.0% and 15.2% in the four wind rose sectors. Overall, 1.36 × 10³ GWh more energy is produced in the four wind rose sectors with the proposed active power implemented. Compared with the 1.31 × 10⁶ GWh AEP of the wind farm with the MPPT method implemented in all the wind directions from 0° to 360°, an increase of 1.03% can be noticed. If the proposed active power control method is also implemented at other wind directions, this percentage can be larger.
As the proposed active power control method maximizes the active power of the wind farm by reducing the power loss due to the wake effect, the increased active power of the wind farm depends on the amount of power loss at each wind direction. At the wind directions where the power loss is small, the active power of the wind farm can be increased slightly. Due to the estimation error of the wake model, the proposed active power may not be able to maximize the active power generation in the wind farm, at the wind direction where the power loss is small. However, at the wind directions where the power loss is large, compared with the significantly increased active power of the wind farm, the power loss due to the estimation error of the wake model can be neglected. Moreover, the proposed active power control method generates the optimal control curves at separate wind directions. Consequently, the optimal control curves can be generated and implemented at the wind directions where the wind farm has the largest power loss.

6. Conclusions

Due to the wake effect, there is a significant amount of power loss in large scale wind farms. By the optimization of the pitch angle and tip speed ratio for the wind turbines in the wind farm, the total active power of the wind farm can be increased. In this paper, the optimized pitch angle and tip speed ratio are firstly selected for each wind turbine by exhausted search method. Then, the optimized pitch angle curve and active power curve in terms of the wind speed are generated for each wind turbine with the optimized pitch angle and tip speed ratio. With the optimized control curves, the wind turbine can be controlled according to the real wind profile at the position of the wind turbine, where both the wind speed and wind direction are taken into account. In typical regular layout wind farms, due to the slight difference of the optimized pitch angle and tip speed ratio between the upstream and the downstream wind turbines, and due to the small variation of the total active power of the wind farm in a large range of pitch angle and tip speed ratio of the wind turbines analyzed by the exhausted search method, the optimized control curves of the upstream wind turbines can be simplified to be the same. As a consequence, the optimization computation complexity is greatly reduced. A case study in an eighty-turbine wind farm shows that the AEP of the wind farm is able to be increased by 1.03%, by using the proposed control method compared to the MPPT method. Moreover, the proposed method can be implemented to any wind farm layout with random wind profile at different locations.

Acknowledgments

The authors would like to thank the Aalborg University and the Sino-Danish Centre for Education and Research for the funding support.

Author Contributions

Jie Tian and Dao Zhou conceived and designed the simulations; Jie Tian performed the simulations; Jie Tian, Dao Zhou, Chi Su, Zhe Chen and Frede Blaabjerg analyzed the data; Mohsen Soltani contributed materials tools; Jie Tian wrote the paper.

Conflicts of Interest

The authors declare no conflict of interest. The founding sponsors had no role in the design of the study; in the collection, analyses, or interpretation of data; in the writing of the manuscript, and in the decision to publish the results.

References

  1. IEA Wind Annual Report. August 2016. Available online: http://www.ieawind.org (accessed in 2 August 2016).
  2. Krohn, S.; Morthorst, P.E.; Awerbuch, S. The Economics of Wind Energy; European Wind Energy Association (EWEA): Brussels, Belgium, 2009. [Google Scholar]
  3. Barthelmie, R.J.; Folkerts, L.; Larsen, G.C.; Rados, K.; Pryor, S.C.; Frandsen, S.T.; Lange, B.; Schepers, G. Comparison of wake model simulations with offshore wind turbine wake profiles measured by Sodar. J. Atmos. Ocean. Technol. 2006, 23, 888–901. [Google Scholar] [CrossRef]
  4. Gebraad, P.M.O.; Teeuwisse, F.W.; van Wingerden, J.W.; Fleming, P.A.; Ruben, S.D.; Marden, J.R.; Pao, L.Y. Wind plant power optimization through yaw control using a parametric model for wake effects—A CFD simulation study. Wind Energy 2014, 23, 95–114. [Google Scholar] [CrossRef]
  5. Zhang, Z.S.; Sun, Y.Z.; Lin, J.; Li, G.J. Coordinated frequency regulation by doubly fed induction generator-based wind power plants. IET Renew. Power Gen. 2012, 6, 38–47. [Google Scholar] [CrossRef]
  6. Slootweg, J.G.; de Haan, S.W.H.; Polinder, H.; Kling, W.L. General model for representing variable speed wind turbines in power system dynamics simulations. IEEE Trans. Power Syst. 2003, 18, 144–151. [Google Scholar] [CrossRef]
  7. Steinbuch, M.; de Boer, W.W.; Bosgra, O.H.; Peters, S.; Ploeg, J. Optimal control of wind power plants. J. Wind Eng. Ind. Aerodyn. 1988, 27, 237–246. [Google Scholar] [CrossRef]
  8. Corten, G.P.; Schaak, P. More power and less loads in wind farms: ‘Heat and flux’. In Proceedings of the European Wind Energy Conference & Exhibition, London, UK, 22–25 November 2004; pp. 1–10.
  9. Larsen, G.C.; Madsen, H.A.; Troldborg, N.; Larsen, T.J.; Réthoré, P.E.; Fuglsang, P.; Ott, S.; Mann, J.; Buhl, T.; Nielsen, M. TOPFARM-Next Generation Design Tool for Optimisation of Wind Farm Topology and Operation; Technical Report Risø-R-1805(EN); RisØ National Laboratory: Roskilde, Denmark, 2011. [Google Scholar]
  10. Tian, J.; Su, C.; Soltani, M.; Chen, Z. Active power dispatch method for a wind farm central controller considering wake effect. In Proceedings of the 2014 40th IEEE Industrial Electronics Society Conference, Dallas, TX, USA, 29 October–1 November 2014; pp. 5450–5456.
  11. González, J.S.; Payán, M.B.; Santos, J.R.; Rodríguez, Á.G.G. Maximizing the overall production of wind farms by setting the individual operating point of wind turbines. Renew. Energy 2015, 80, 219–229. [Google Scholar] [CrossRef]
  12. Abad, G.; Lopez, J.; Rodriguez, M.; Marroyo, L.; Iwanski, G. Doubly Fed Induction Machine; Wiley: Hoboken, NJ, USA, 2011; p. 19. [Google Scholar]
  13. Soleimanzadeh, M.; Wisniewski, R.; Brand, A. State-space representation of the wind flow model in wind farms. Wind Energy 2014, 17, 627–639. [Google Scholar] [CrossRef]
  14. Marden, J.R.; Ruben, S.D.; Pao, L.Y. A model-free approach to wind farm control using game theoretic methods. IEEE Trans. Control Syst. Technol. 2013, 21, 1207–1214. [Google Scholar] [CrossRef]
  15. Gebraad, P.M.O.; Wingerden, J.W. Maximum power-point tracking control for wind farms. Wind Energy 2015, 18, 429–447. [Google Scholar] [CrossRef]
  16. Jonkman, J.; Butterfield, S.; Musial, W.; Scott, G. Definition of a 5-MW Reference Wind Turbine for Offshore System Development; Technical Report NREL/TP-500-38060; National Renewable Energy Laboratory: Golden, CO, USA, 2009. [Google Scholar]
  17. Barthelmie, R.J.; Hansen, K.; Frandsen, S.T.; Rathmann, O.; Schepers, J.G.; Schlez, W.; Phillips, J.; Rados, K.; Zervos, A.; Politis, E.S.; et al. Modelling and measuring flow and wind turbine wakes in large wind farms offshore. Wind Energy 2009, 12, 431–444. [Google Scholar] [CrossRef]
  18. Duckworth, A.; Barthelmie, R.J. Investigation and validation of wind turbine wake models. Wind Eng. 2008, 32, 459–475. [Google Scholar] [CrossRef]
  19. Katic, I.; Højstrup, D.; Jensen, N.O. A sample model for cluster efficiency. In Proceedings of the 1986 European Wind Energy Association Conference, Rome, Italy, 7–9 October 1986; pp. 407–410.
  20. Jensen, N.O. A Note on wind Generator Interaction; Technical Report RisØ M-2411; RisØ National Laboratory: Roskilde, Denmark, 1983. [Google Scholar]
  21. Mortensen, N.G.; Heathfield, D.N.; Myllerup, L.; Landberg, L.; Rathmann, O. Wind Atlas Analysis and Application Program: WAsP 8 Help Facility; Risø National Laboratory: Roskilde, Denmark, 2005. [Google Scholar]
  22. Kristoffersen, J.R.; Christiansen, P. Horns rev off shore windfarm: Its main controller and remote control system. Wind Eng. 2003, 27, 351–366. [Google Scholar] [CrossRef]
  23. Gonzalez-Rodriguez, A.G.; Burgos-Payan, M.; Riquelme-Santos, J.; Serrano-Gonzalez, J. Reducing computational effort in the calculation of annual energy produced in wind farms. Renew. Sustain. Energy Rev. 2015, 43, 656–665. [Google Scholar] [CrossRef]
Figure 1. DFIG wind turbine and its active power control method.
Energies 10 00395 g001
Figure 2. NREL 5 MW wind turbine with: (a) Power coefficient in respect to the pitch angle and the tip speed ratio; (b) active power curve with the maximum power point tracking (MPPT) control.
Energies 10 00395 g002
Figure 3. Layout of the wind farm with two NREL wind turbines in a line. XD: distance between the two wind turbines.
Energies 10 00395 g003
Figure 4. (a) Speed relationship between the upstream and downstream wind turbines in Katic wake model; (b) thrust coefficient of the NREL 5 MW wind turbine.
Energies 10 00395 g004
Figure 5. (a) Wind speed deficit of WT2, at the wind directions of from 270° to 282° and at the ambient wind speeds of from 3 m/s to 25 m/s; (b) active power of WT1 and WT2 at the wind direction of 270°.
Energies 10 00395 g005
Figure 6. Comparison between WT1 operating at the tip speed ratio of 7.55 and 6.5, at the wind direction of 270° and ambient wind speed of 9 m/s: (a) The active power of WT1, where the base value is 5 MW; (b) the wind speed of WT2; (c) the active power of WT2, where the base value is 5 MW; (d) the total active power of the wind farm, where the base value is 10 MW.
Energies 10 00395 g006
Figure 7. Total active power of the wind farm in terms of the pitch angle and tip speed ratio of WT1, at 270° wind direction and 9 m/s ambient wind speed.
Energies 10 00395 g007
Figure 8. (a) Optimized pitch angle, tip speed ratio, blade speed and active power of WT1, at the wind direction of 270°; (b) comparison of the active power of WT1, active power of WT2, and the total active power of the wind farm between the WT1 controlled by MPPT method and the optimized method, at the wind direction of 270°.
Energies 10 00395 g008
Figure 9. (a) Optimized pitch angle, tip speed ratio, blade speed and active power of WT1, at the wind directions of 270°, 276° and 282°; (b) comparison of the total active power of the wind farm between the MPPT method and the optimization method, to maximize the total active power of the wind farm by selecting the optimal pitch angle and tip speed ratio for WT1, at the wind directions of 270°, 276° and 282°.
Energies 10 00395 g009
Figure 10. Layout of the wind farm with 3 NREL 5 MW DFIG wind turbines.
Energies 10 00395 g010
Figure 11. Katic wake model. WT3 is in the multiple wakes of WT1 and WT2.
Energies 10 00395 g011
Figure 12. (a) Wind speed of WT3; (b) active power of WT1, WT2 and WT3, at the wind direction of 270°.
Energies 10 00395 g012
Figure 13. Relationship of the variables in the wind farm with three wind turbines, at the wind direction of 270°.
Energies 10 00395 g013
Figure 14. (a) Active power of WT1 where the base value is 5 MW; (b) wind speed of WT2, in terms of the pitch angle and tip speed ratio of WT1; (c) active power of WT2 where the base value is 5 MW; (d) wind speed of WT3; (e) active power of WT3 where the base value is 5 MW; (f) total active power of the wind farm where the base value is 15 MW, in terms of the pitch angle and tip speed ratio of WT2,when WT1 is operating at the pitch angle and tip speed ratio of 0° and 7.23, respectively; (g) active power of WT2 where the base value is 5 MW; (h) wind speed of WT3; (i) active power of WT3 where the base value is 5 MW; (j) total active power of the wind farm where the base value is 15 MW, in terms of the pitch angle and tip speed ratio of WT2,when WT1 is operating at the pitch angle and tip speed ratio of 2.2° and 6.7.
Energies 10 00395 g014aEnergies 10 00395 g014b
Figure 15. (a) Optimized pitch angle, tip speed ratio, active power and rotor speed of WT1 in the three-turbine wind farm; (b) optimized pitch angle, tip speed ratio, active power and rotor speed of WT2 in the three-turbine wind farm; (c) comparison of the active power of WT1, WT2, WT3 and the total active power of the wind farm between the MPPT method and the proposed active power control method, at 270° wind direction.
Energies 10 00395 g015
Figure 16. Location and layout of the wind farm, where each wind turbine WTm_n is labeled with its row No. m and its column No. n.
Energies 10 00395 g016
Figure 17. Total active power of the wind farm by using the MPPT method.
Energies 10 00395 g017
Figure 18. Layout of the wind farm with 10 NREL 5 MW DFIG wind turbines.
Energies 10 00395 g018
Figure 19. Comparison of the total active power of the wind farm as shown in Figure 15 between the MPPT method and the proposed active power control method at the wind direction of 270°.
Energies 10 00395 g019
Figure 20. (a) Wind direction distribution in each rose sector; (b) wind speed distribution in all sectors.
Energies 10 00395 g020
Table 1. Parameters of the NREL 5 MW wind turbine [16].
ParameterValue
Rated power5 MW
Rotor diameter126 m
Cut-in, rated, Cut-out wind speed3 m/s, 11.4 m/s, 25 m/s
Min. and Max. rotor speed6.9 rpm, 12.1 rpm
Gearbox ratio97:1
Number of pole-pairs3
Synchronous frequency50 Hz
Electrical generator efficiency94.4%
Table 2. Comparison of annual energy production (AEP; GWh) between the MPPT method and the proposed active power control method in the wind rose sectors of 265°–275°and 85°–95°.
AEP265°–275° Sector85°–95° Sector
MPPTOPTMPPTOPT
WT1_11356.61280.985.5142.3
WT1_2977.8949.786.8130.7
WT1_3835.4880.788.7122.5
WT1_4760.8840.490.5123.4
WT1_5713.9815.694.5125.6
WT1_6689.1798.699.1128.8
WT1_7669.2786.8108.9134.2
WT1_8658.7780.4127.1143.3
WT1_9642.7814.0167.4161.0
WT1_10631.2859.3288.4262.8
Total63,482.270,450.49895.411,795.4
Increased11.0%19.2%
Table 3. Comparison of AEP (GWh) between the MPPT method and the proposed active power control method in the wind rose sectors of 345°–355° and 165°–175°.
AEP345°–355° Sector165°–175° Sector
MPPTOPTMPPTOPT
WT1_1382.9348.4169.9248.7
WT2_1234.1232.1173.0233.8
WT3_1185.3208.8180.1222.7
WT4_1162.5195.5187.7228.1
WT5_1148.4188.1203.9237.0
WT6_1142.3183.4230.1252.0
WT7_1136.1194.1283.7278.4
WT8_1134.0207.0435.2400.0
Total15,255.217,573.218,635.221,006.9
Increased15.2%12.7%

