
A Droop Control Based Three Phase Bidirectional AC-DC Converter for More Electric Aircraft Applications


Abstract
:1. Introduction
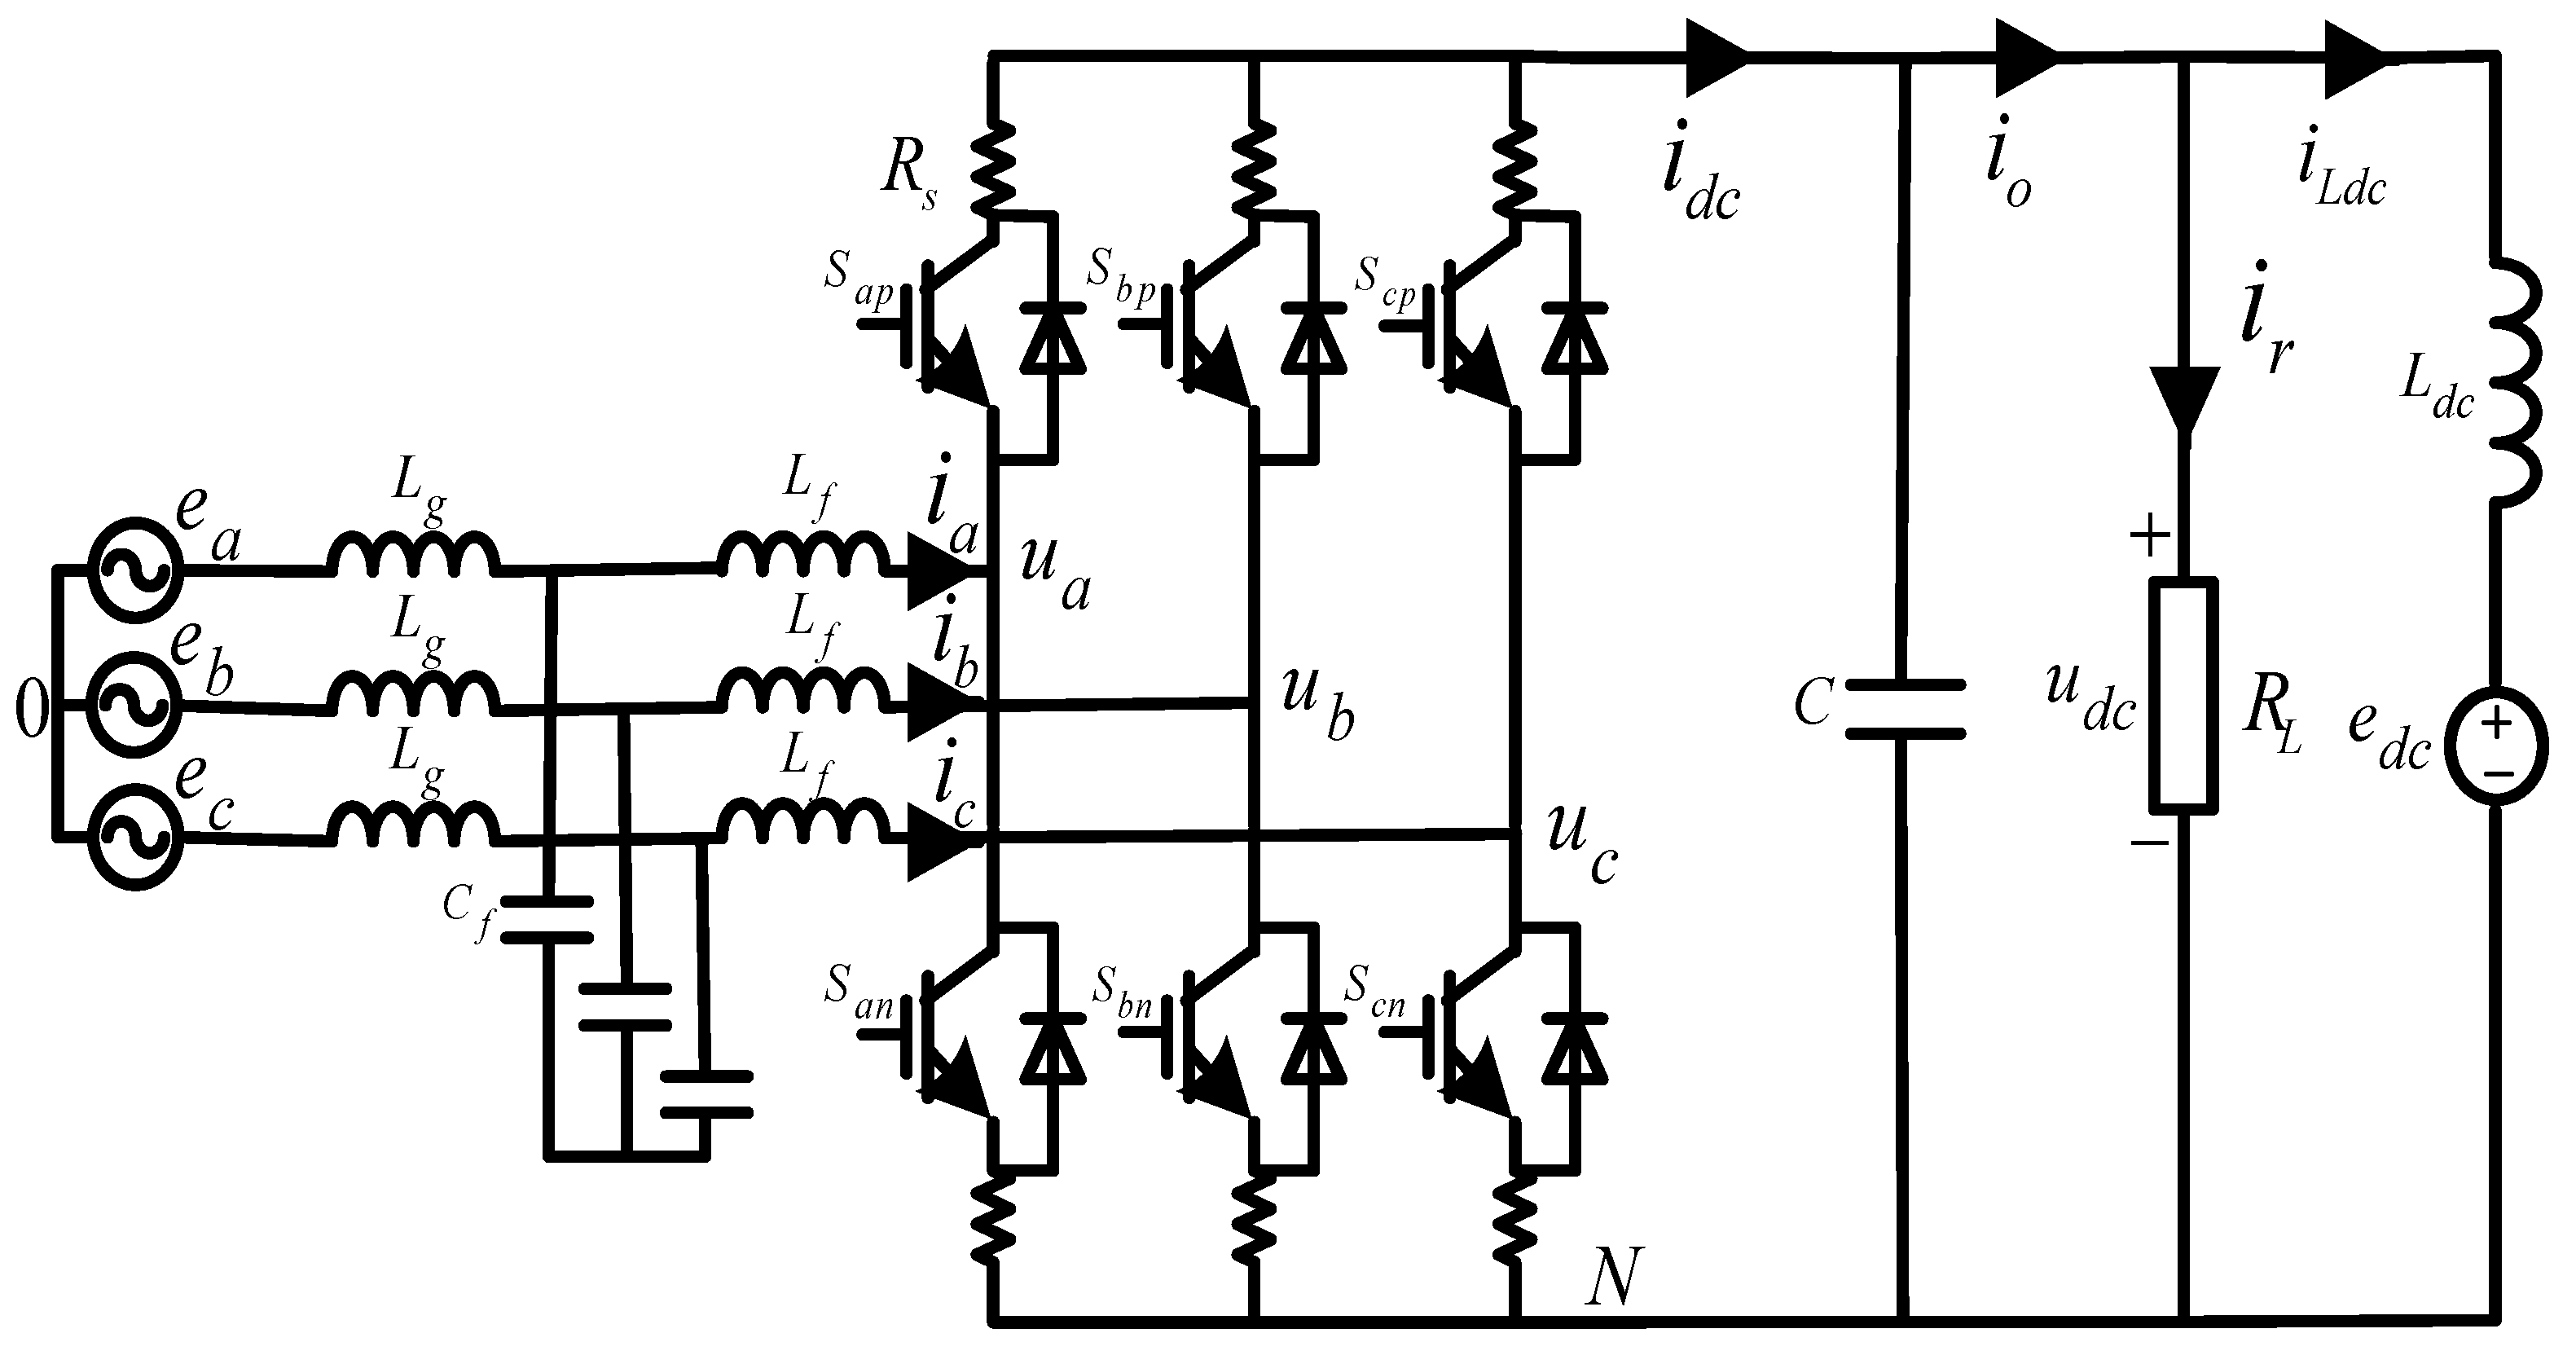
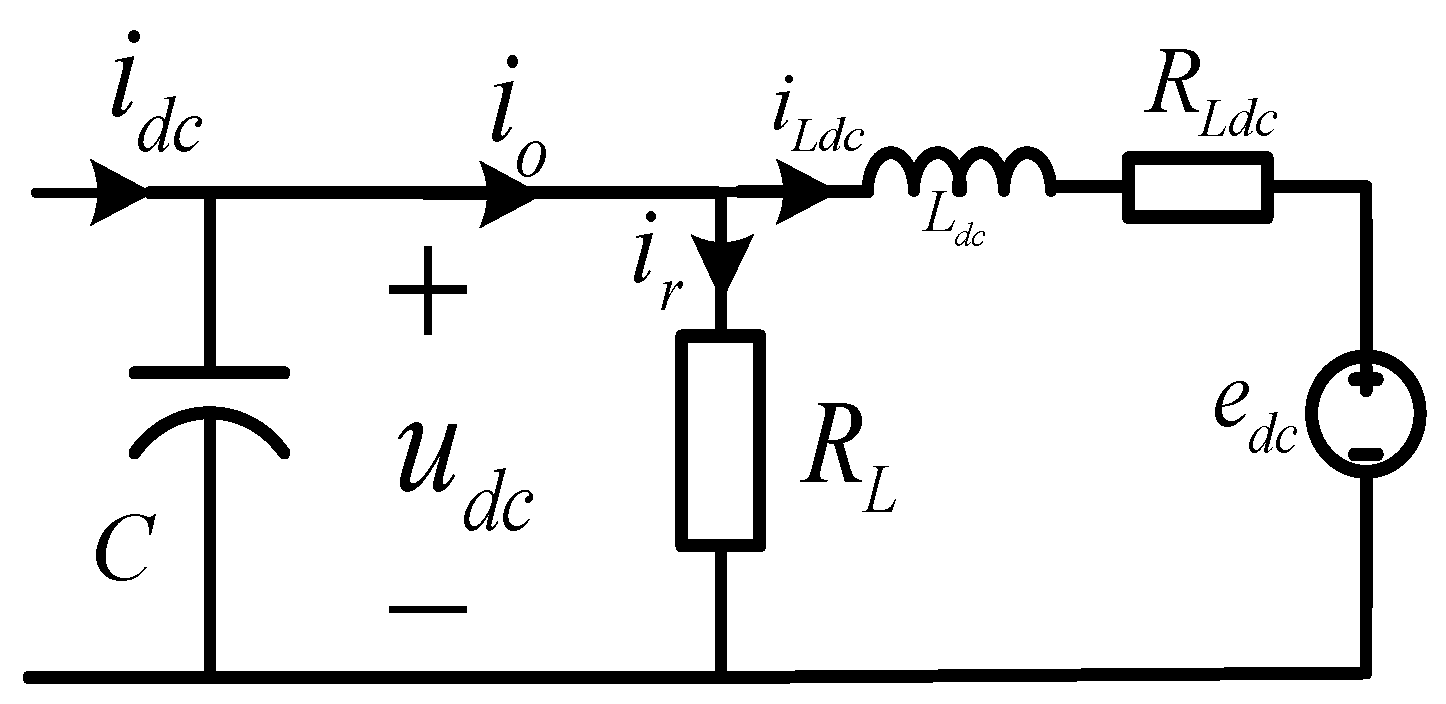
2. Mathematical Modeling of the Converter
2.1. Rectifier Mode
2.2. Inverter Mode
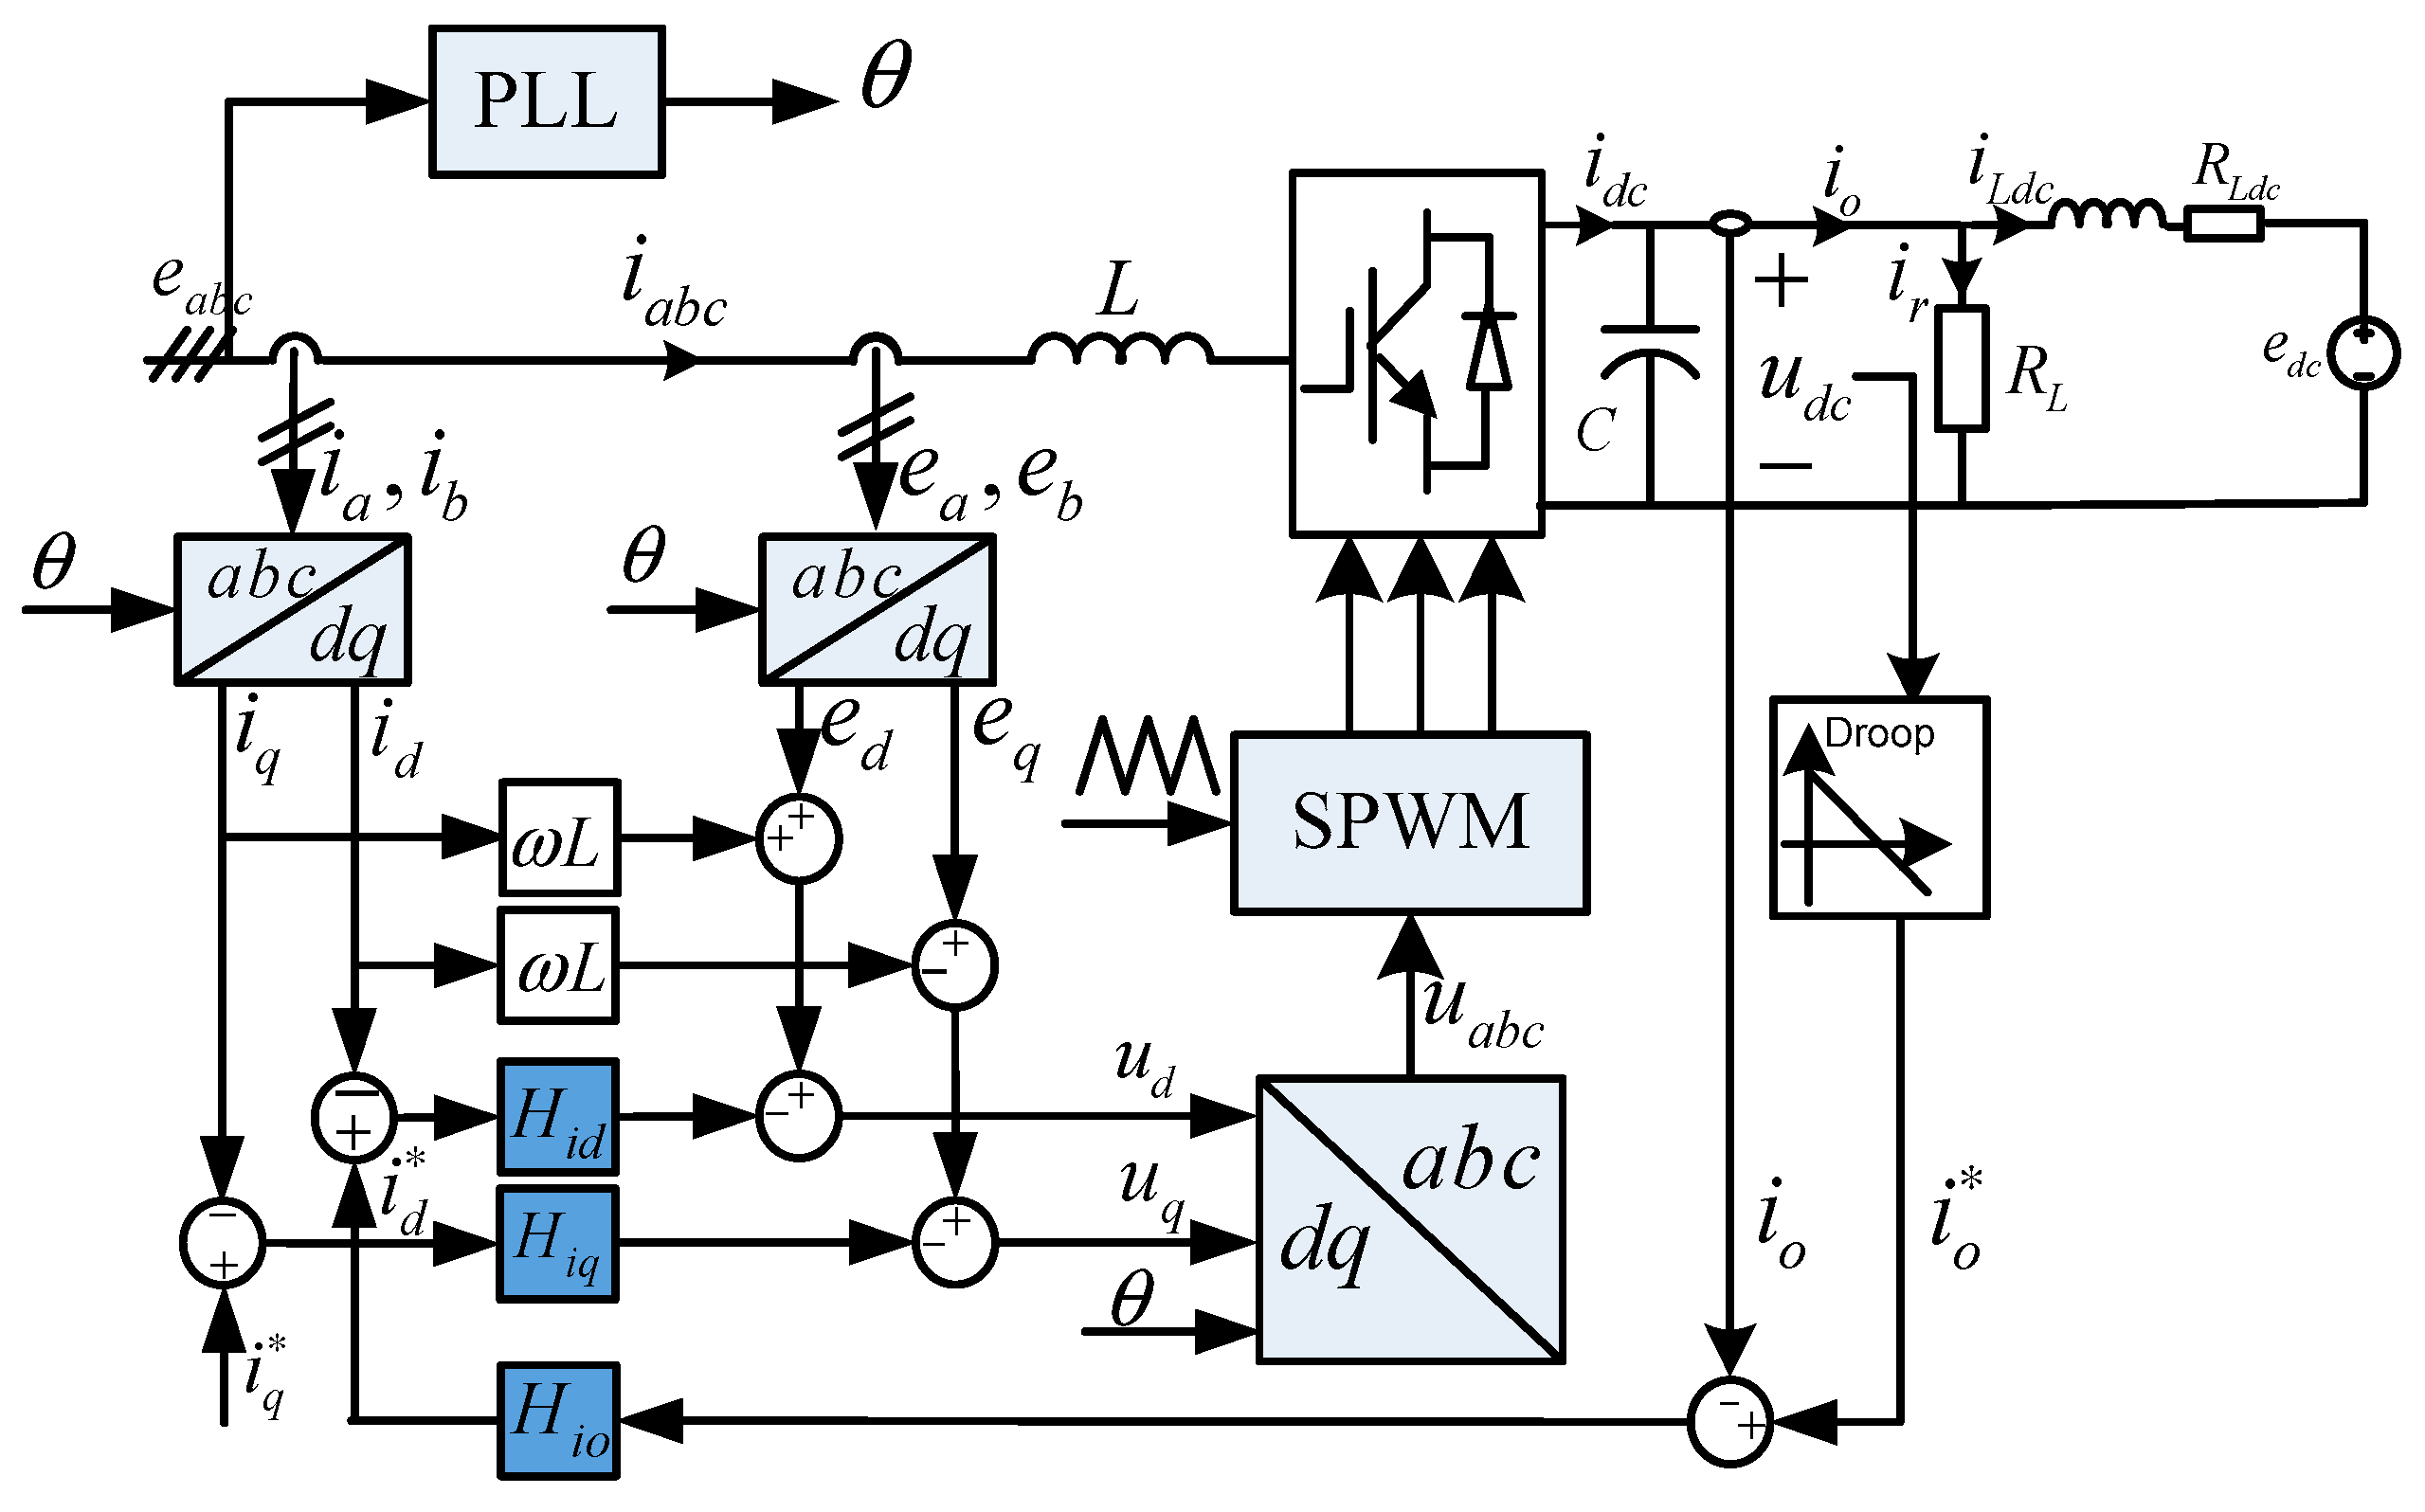
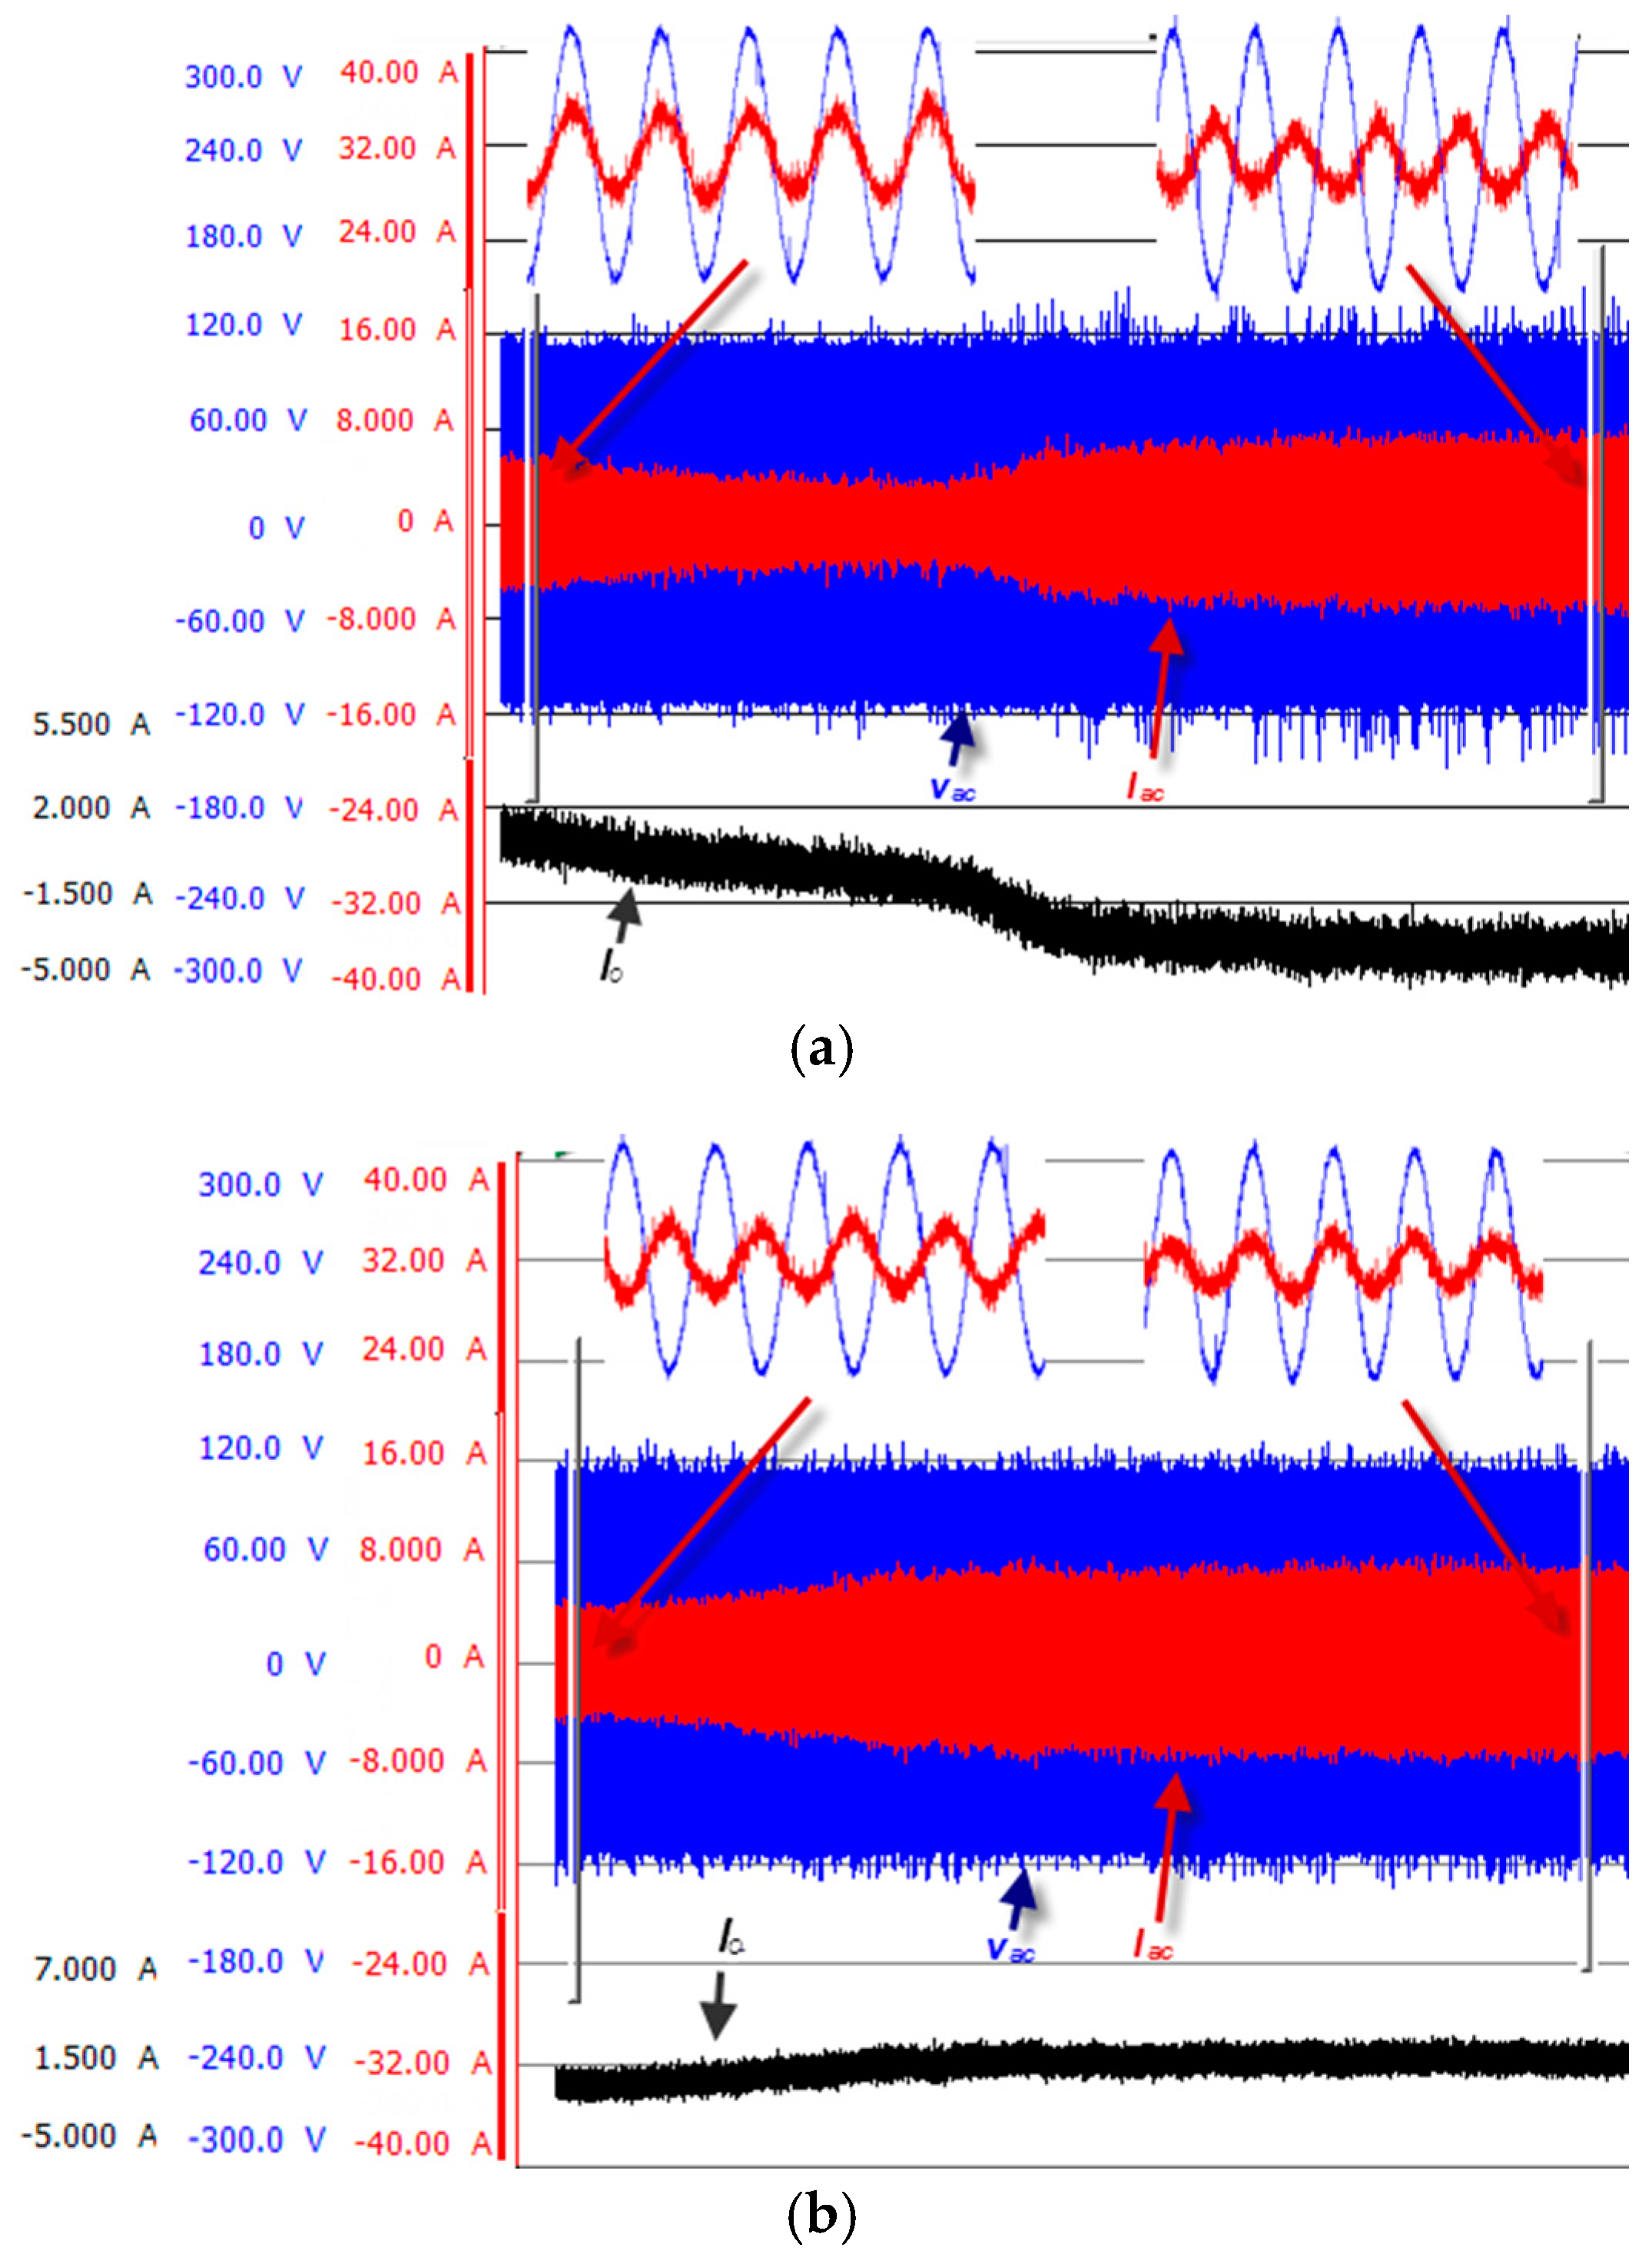
3. Control Design
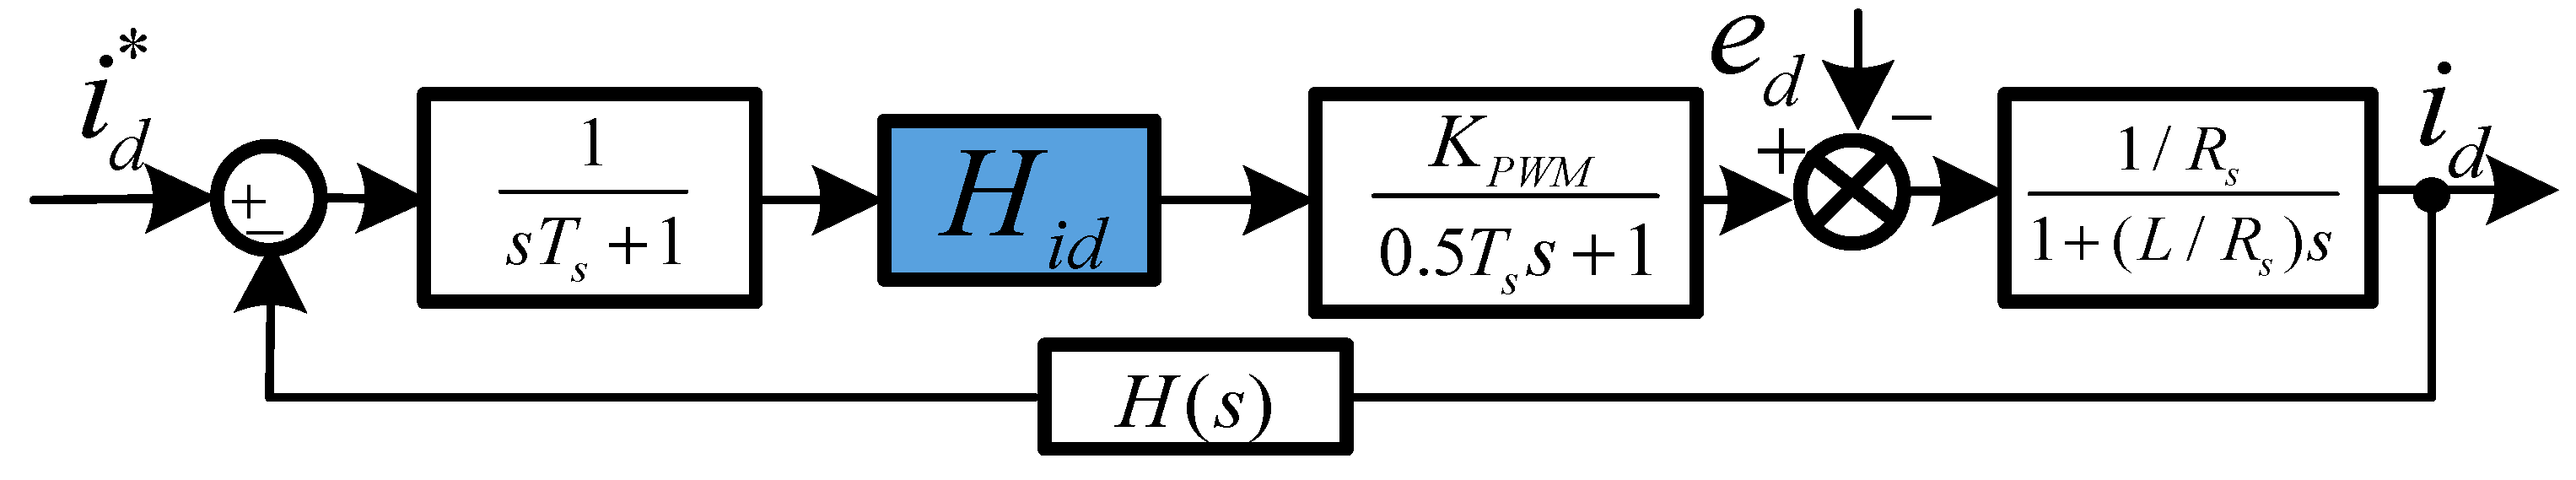
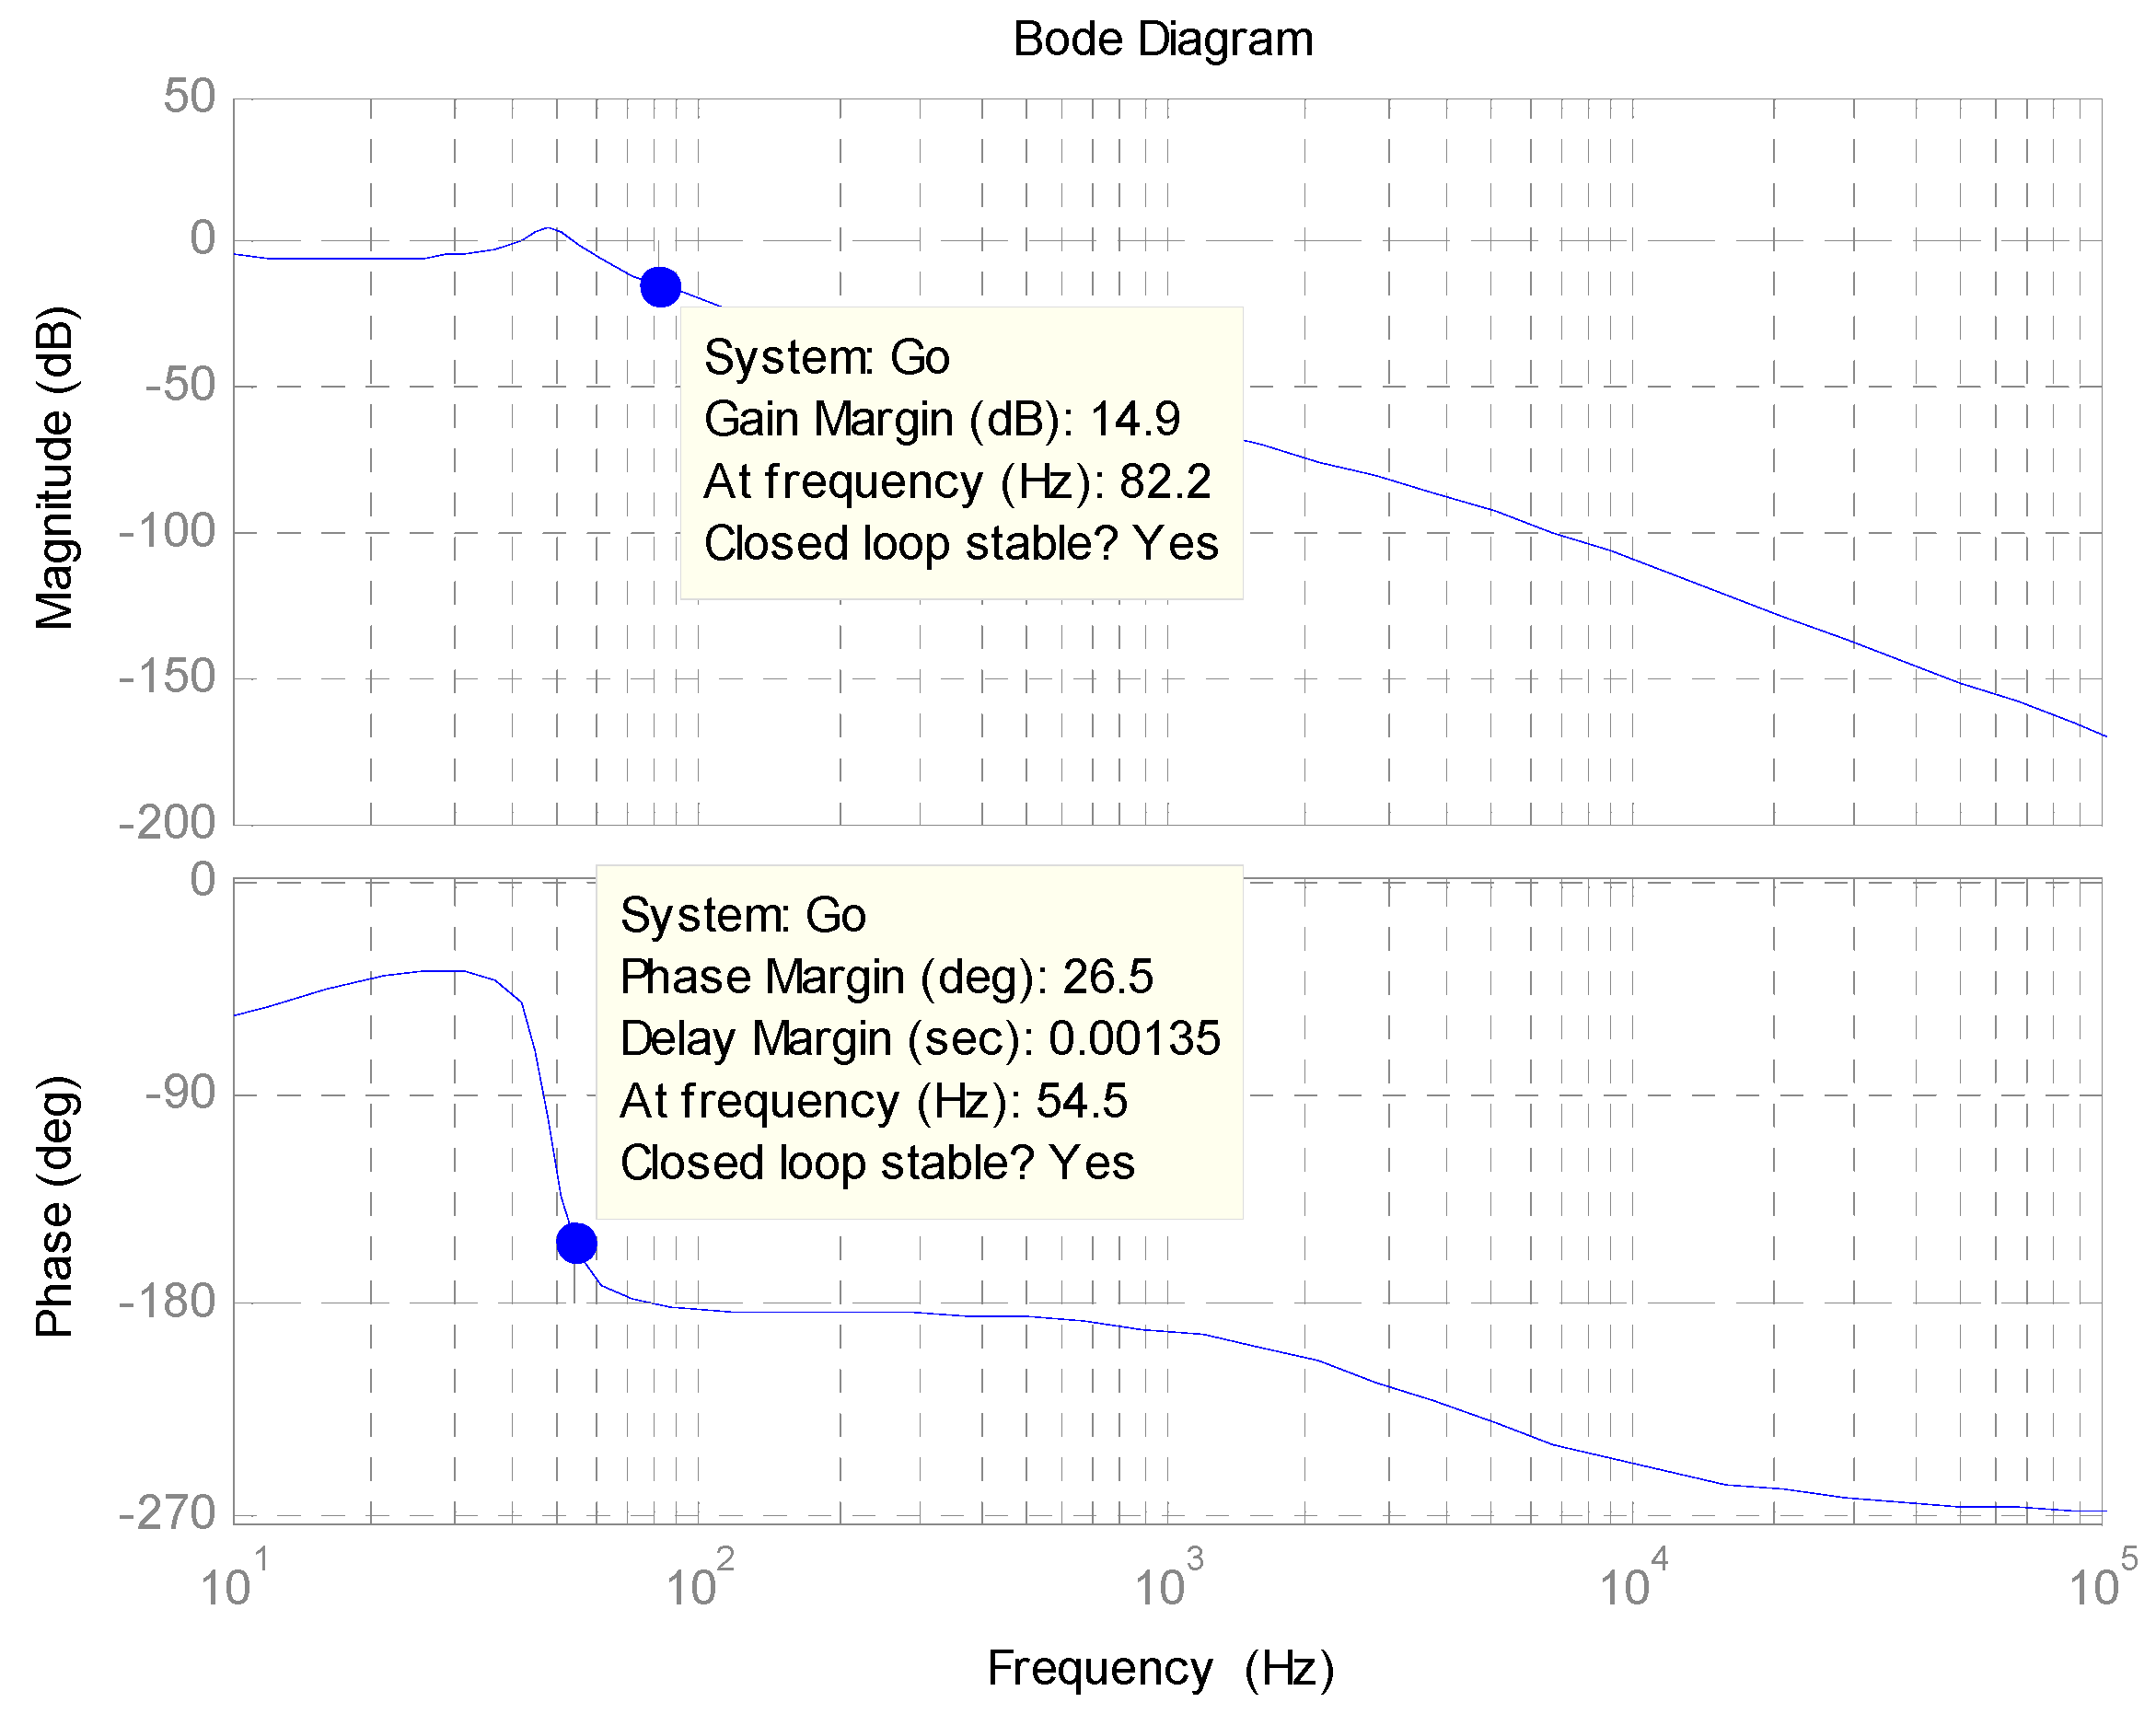
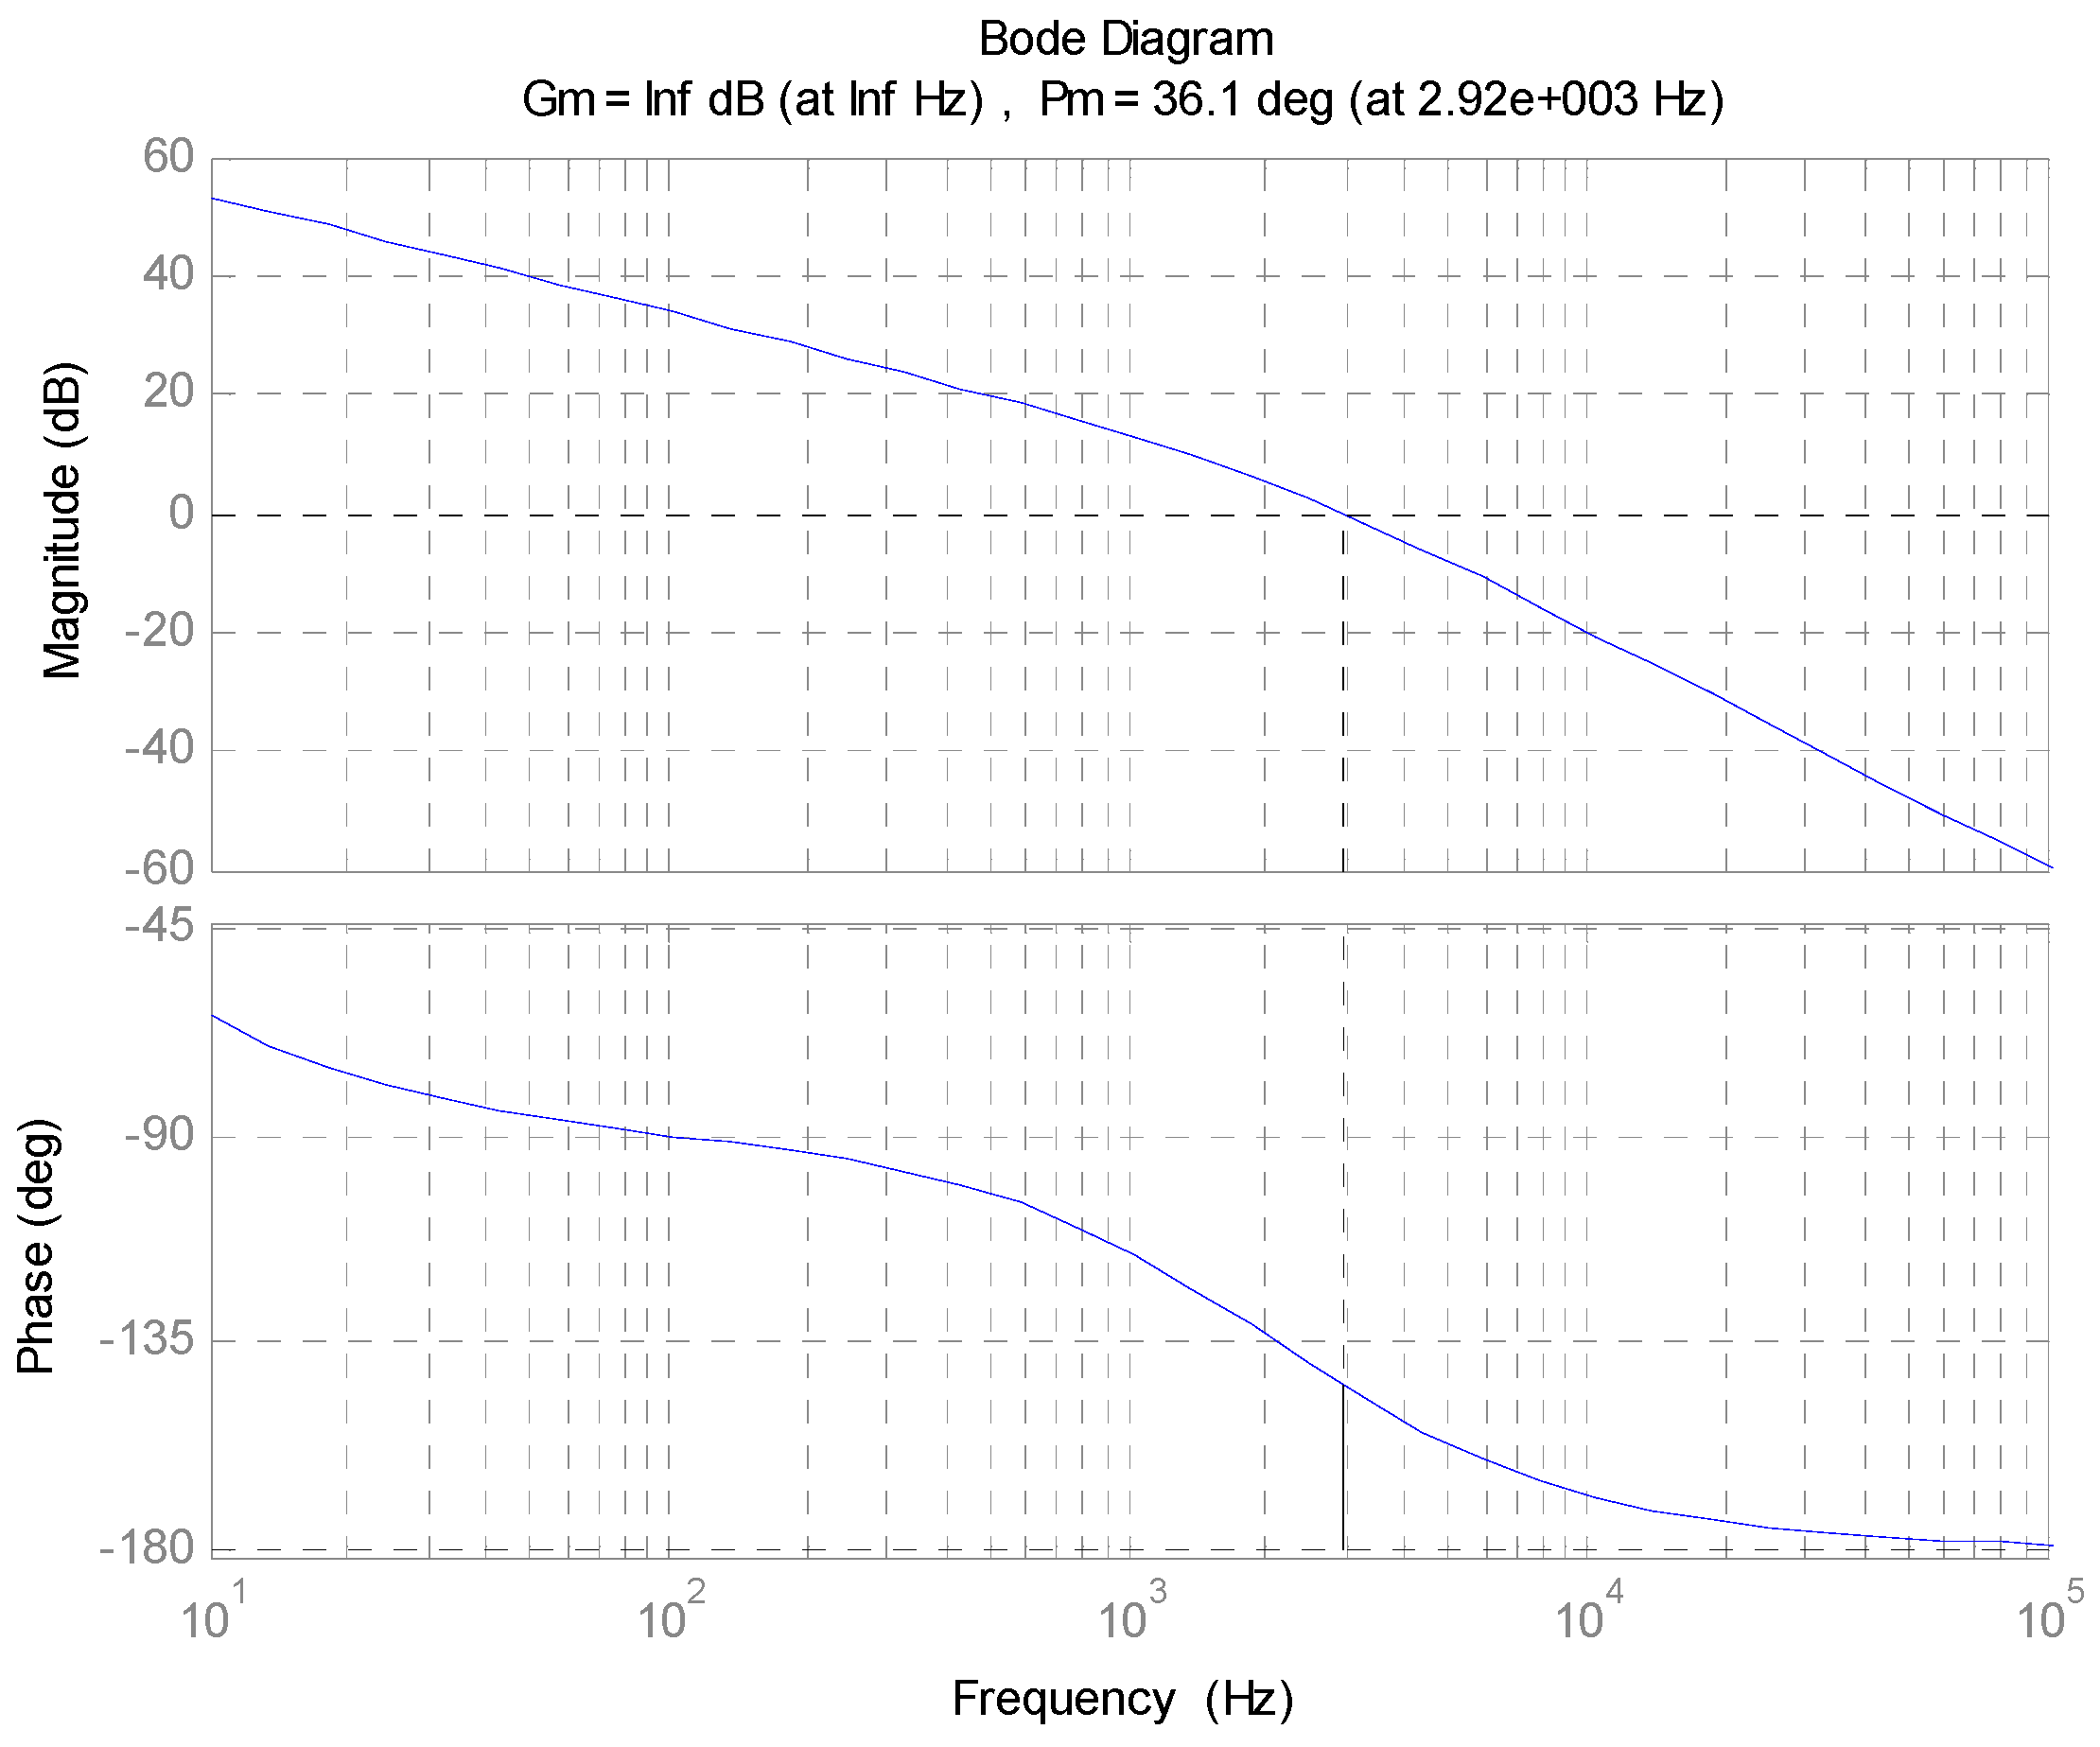
3.1. Inner Current Loop
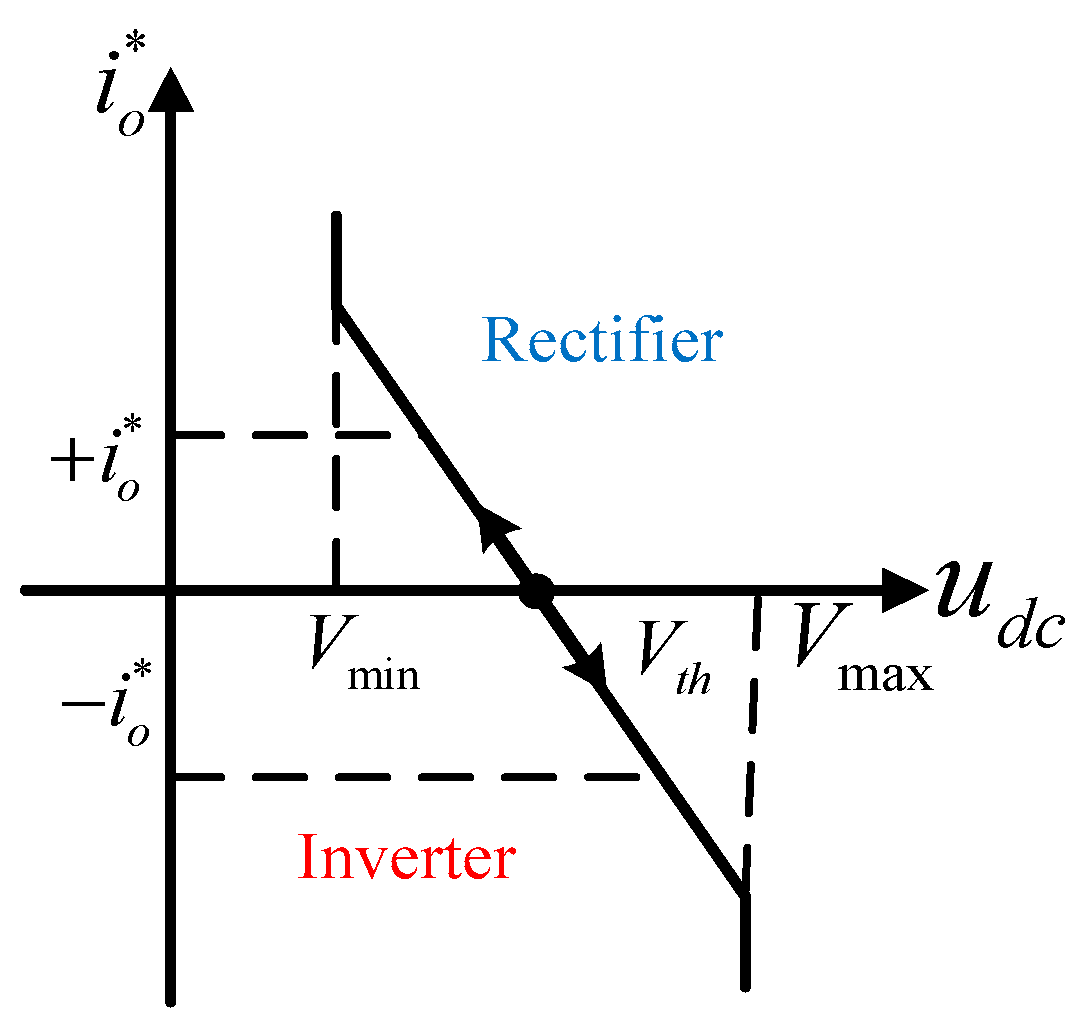
3.2. Droop Control
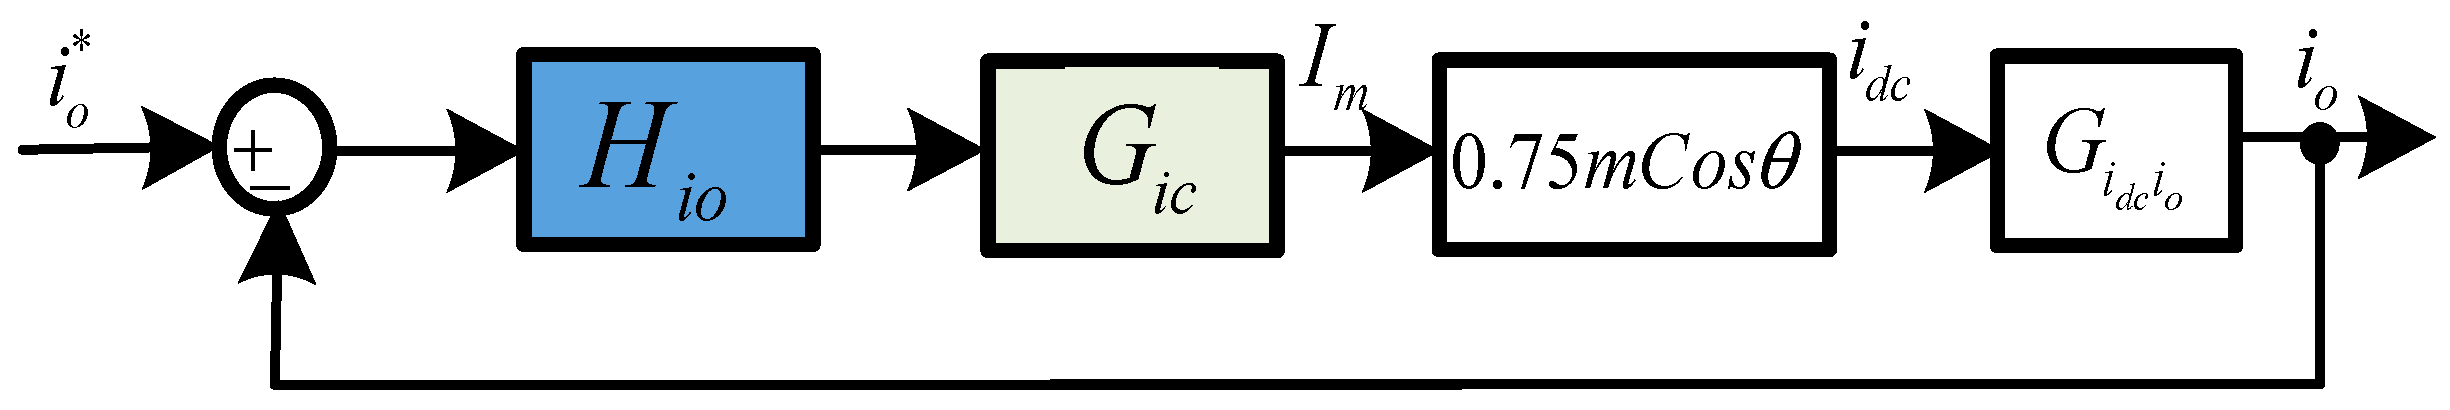
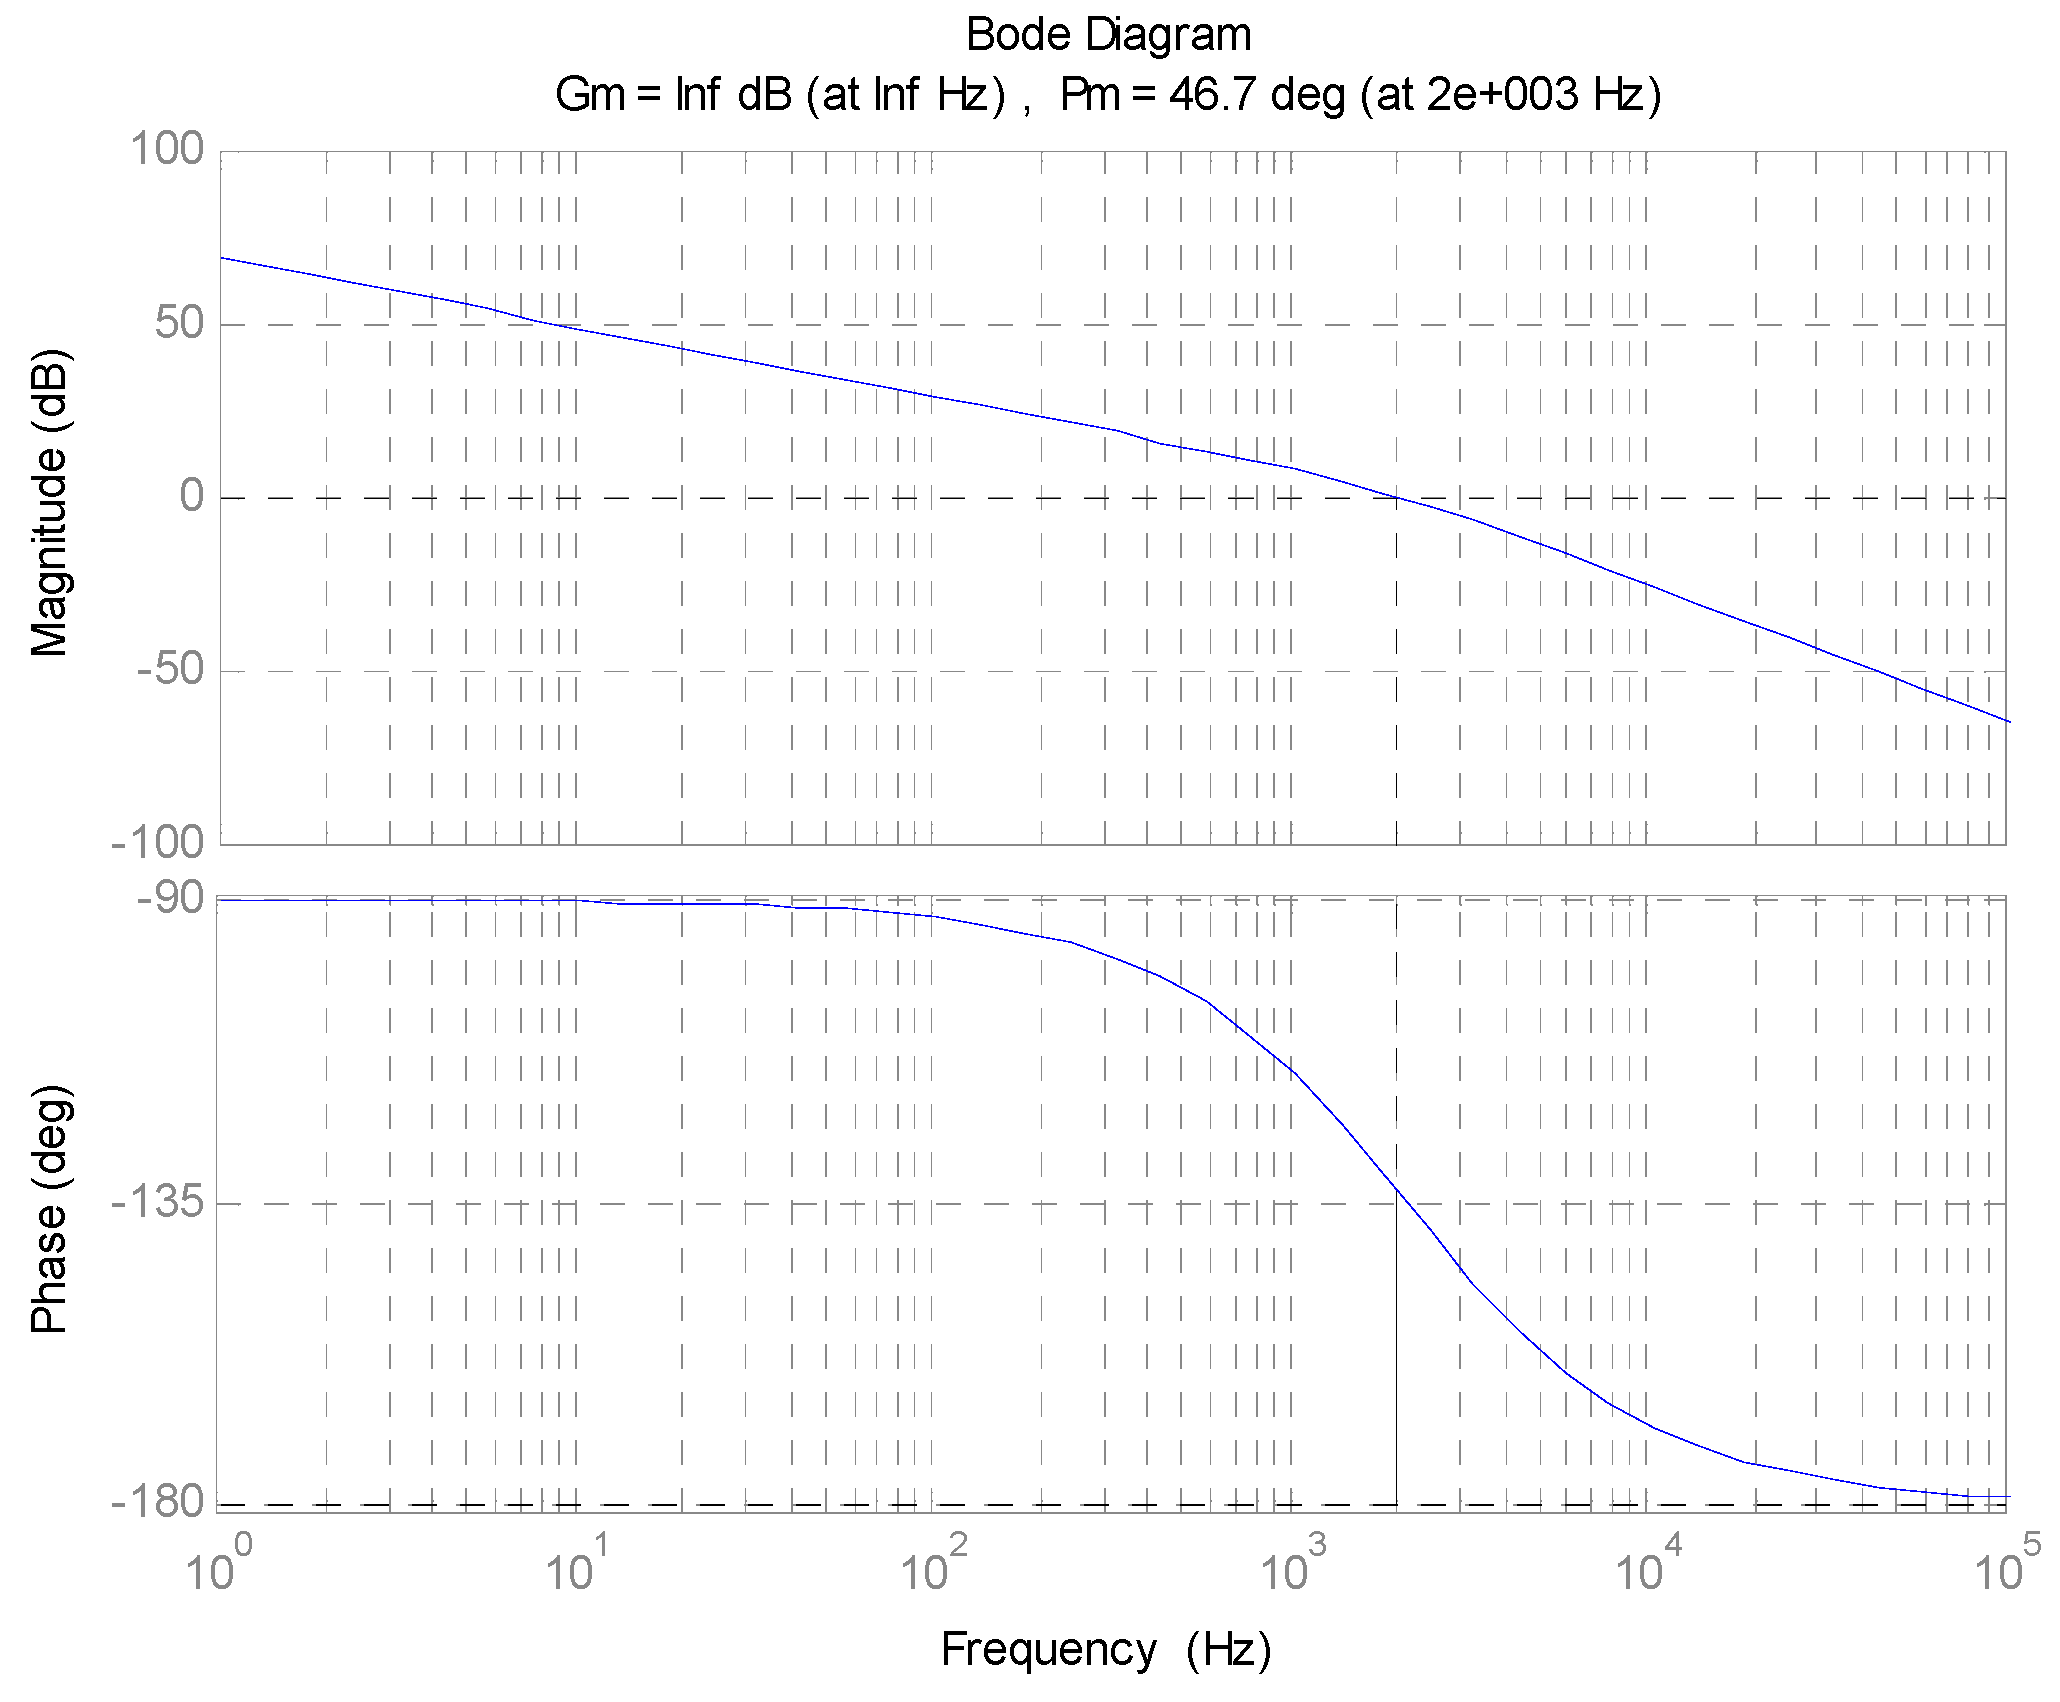
3.3. Outer DC Current Loop
4. Simulation Studies
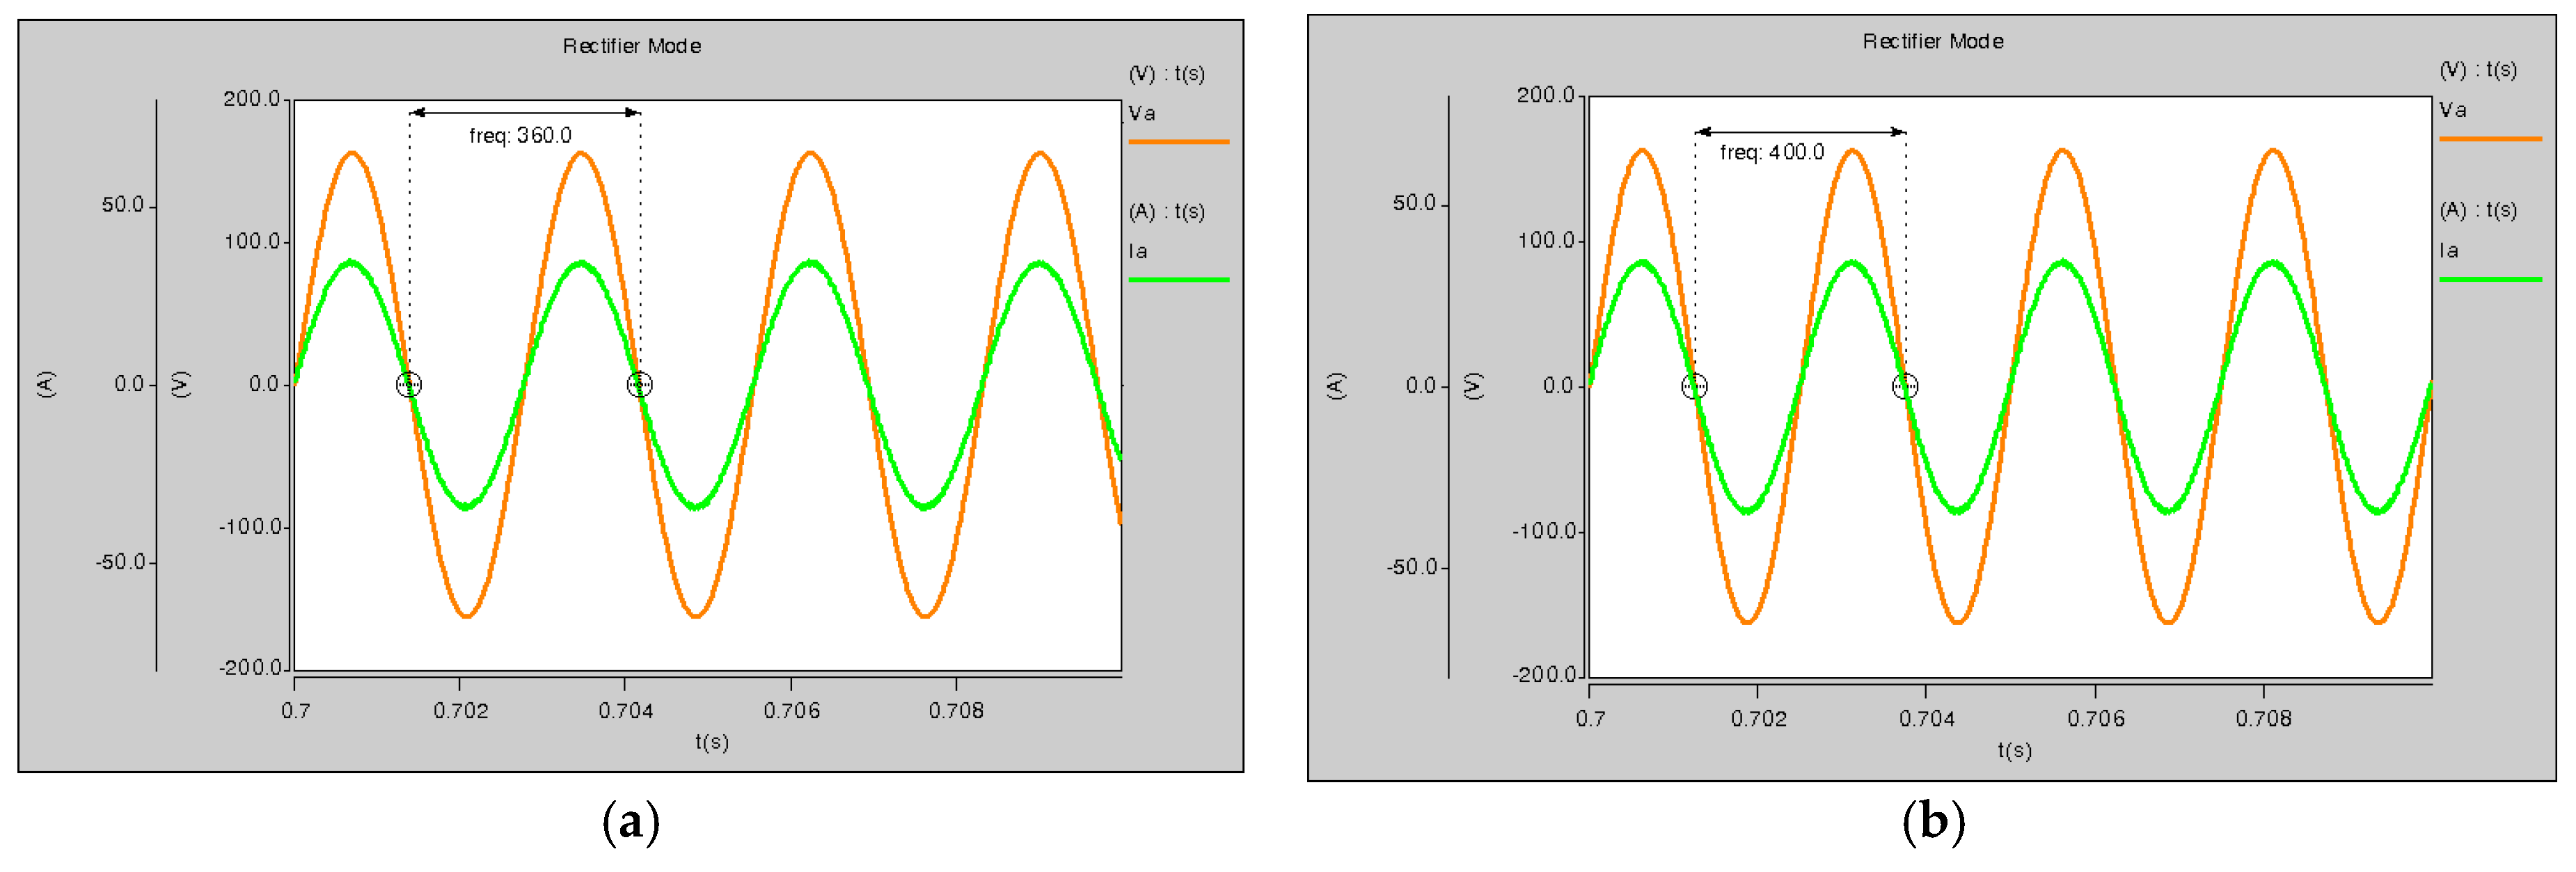
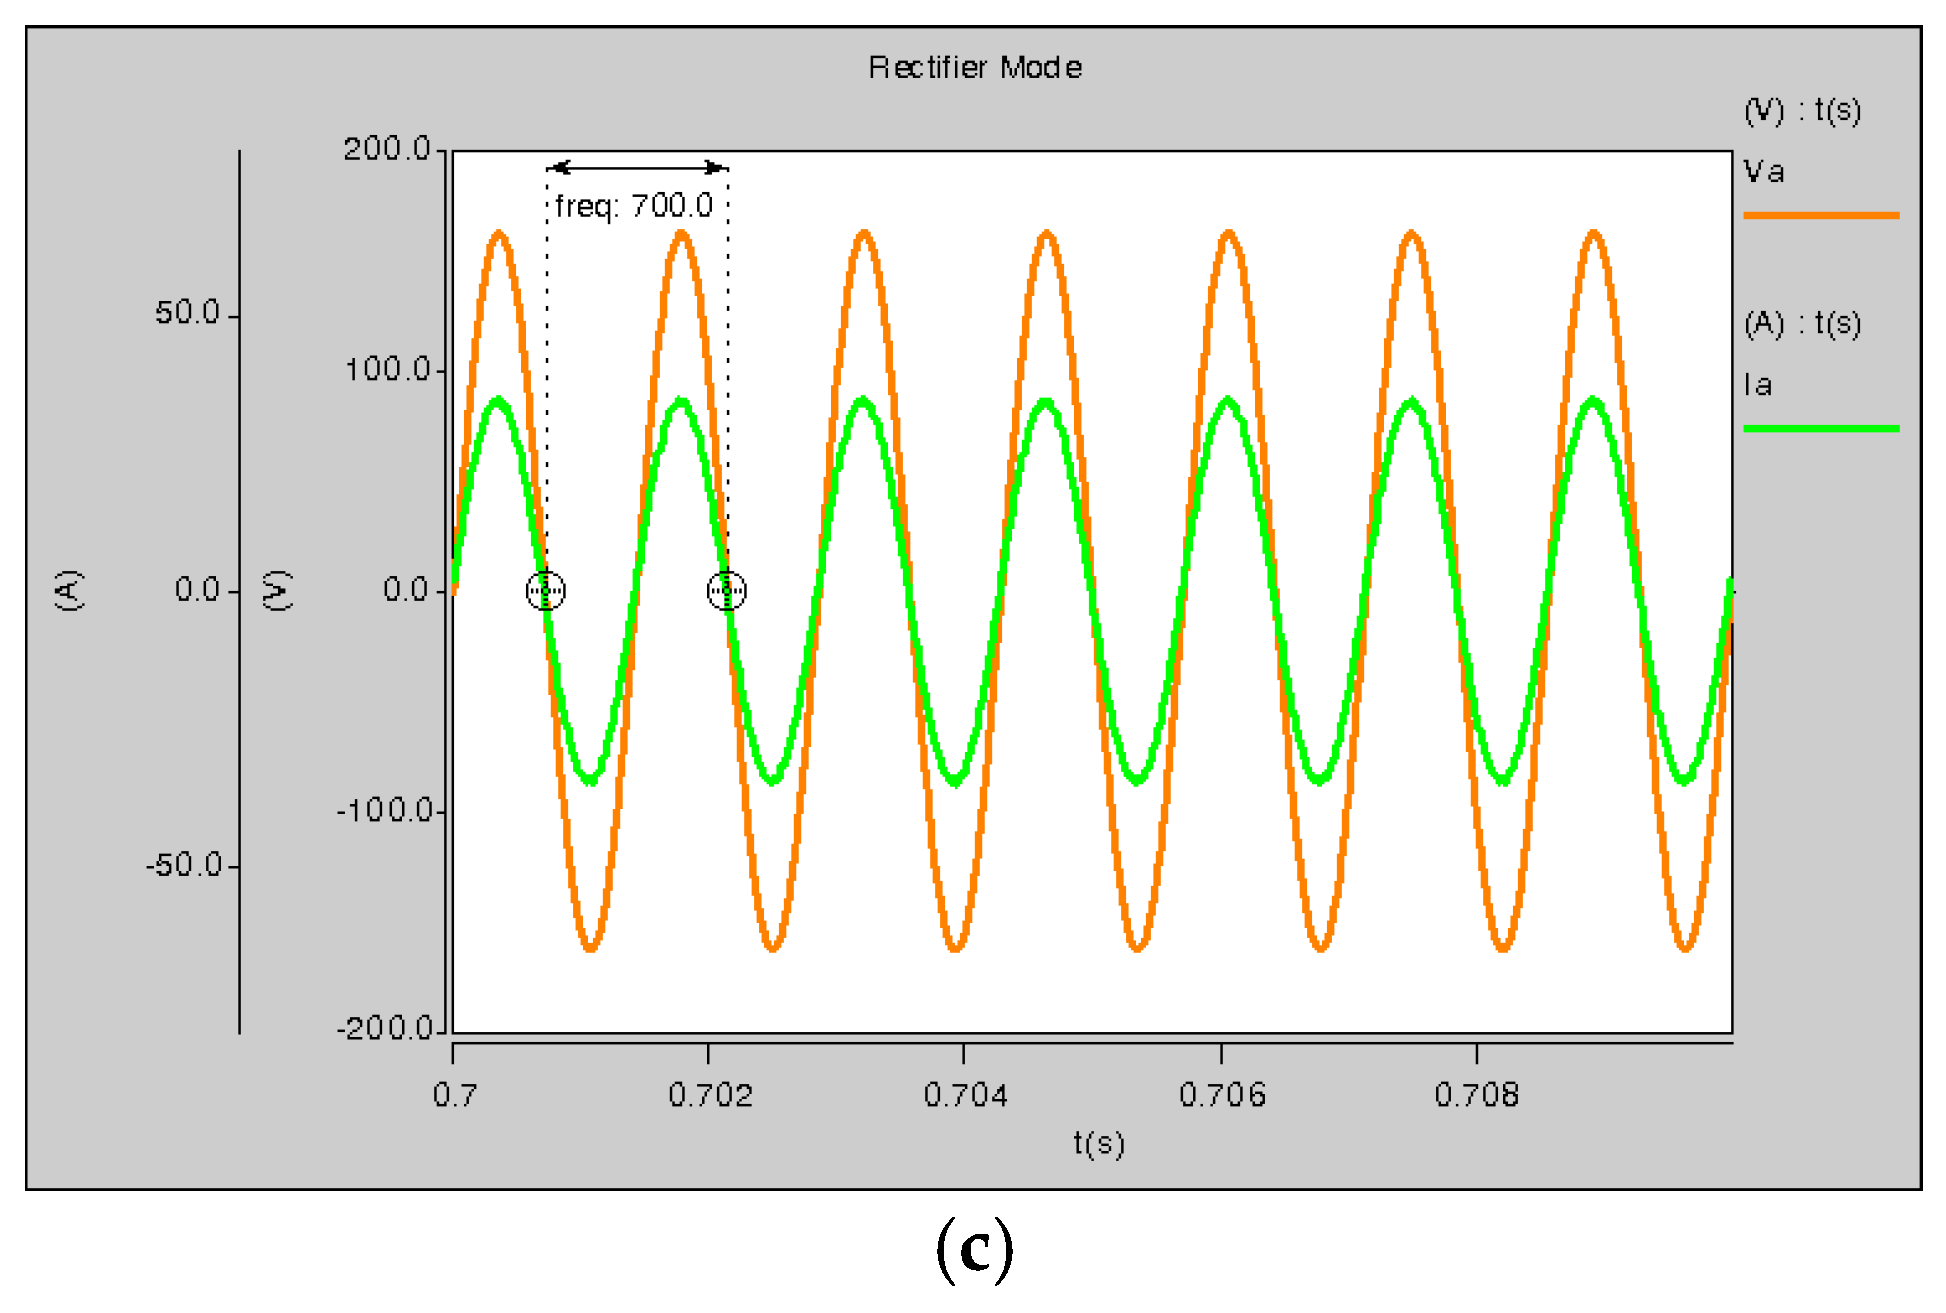
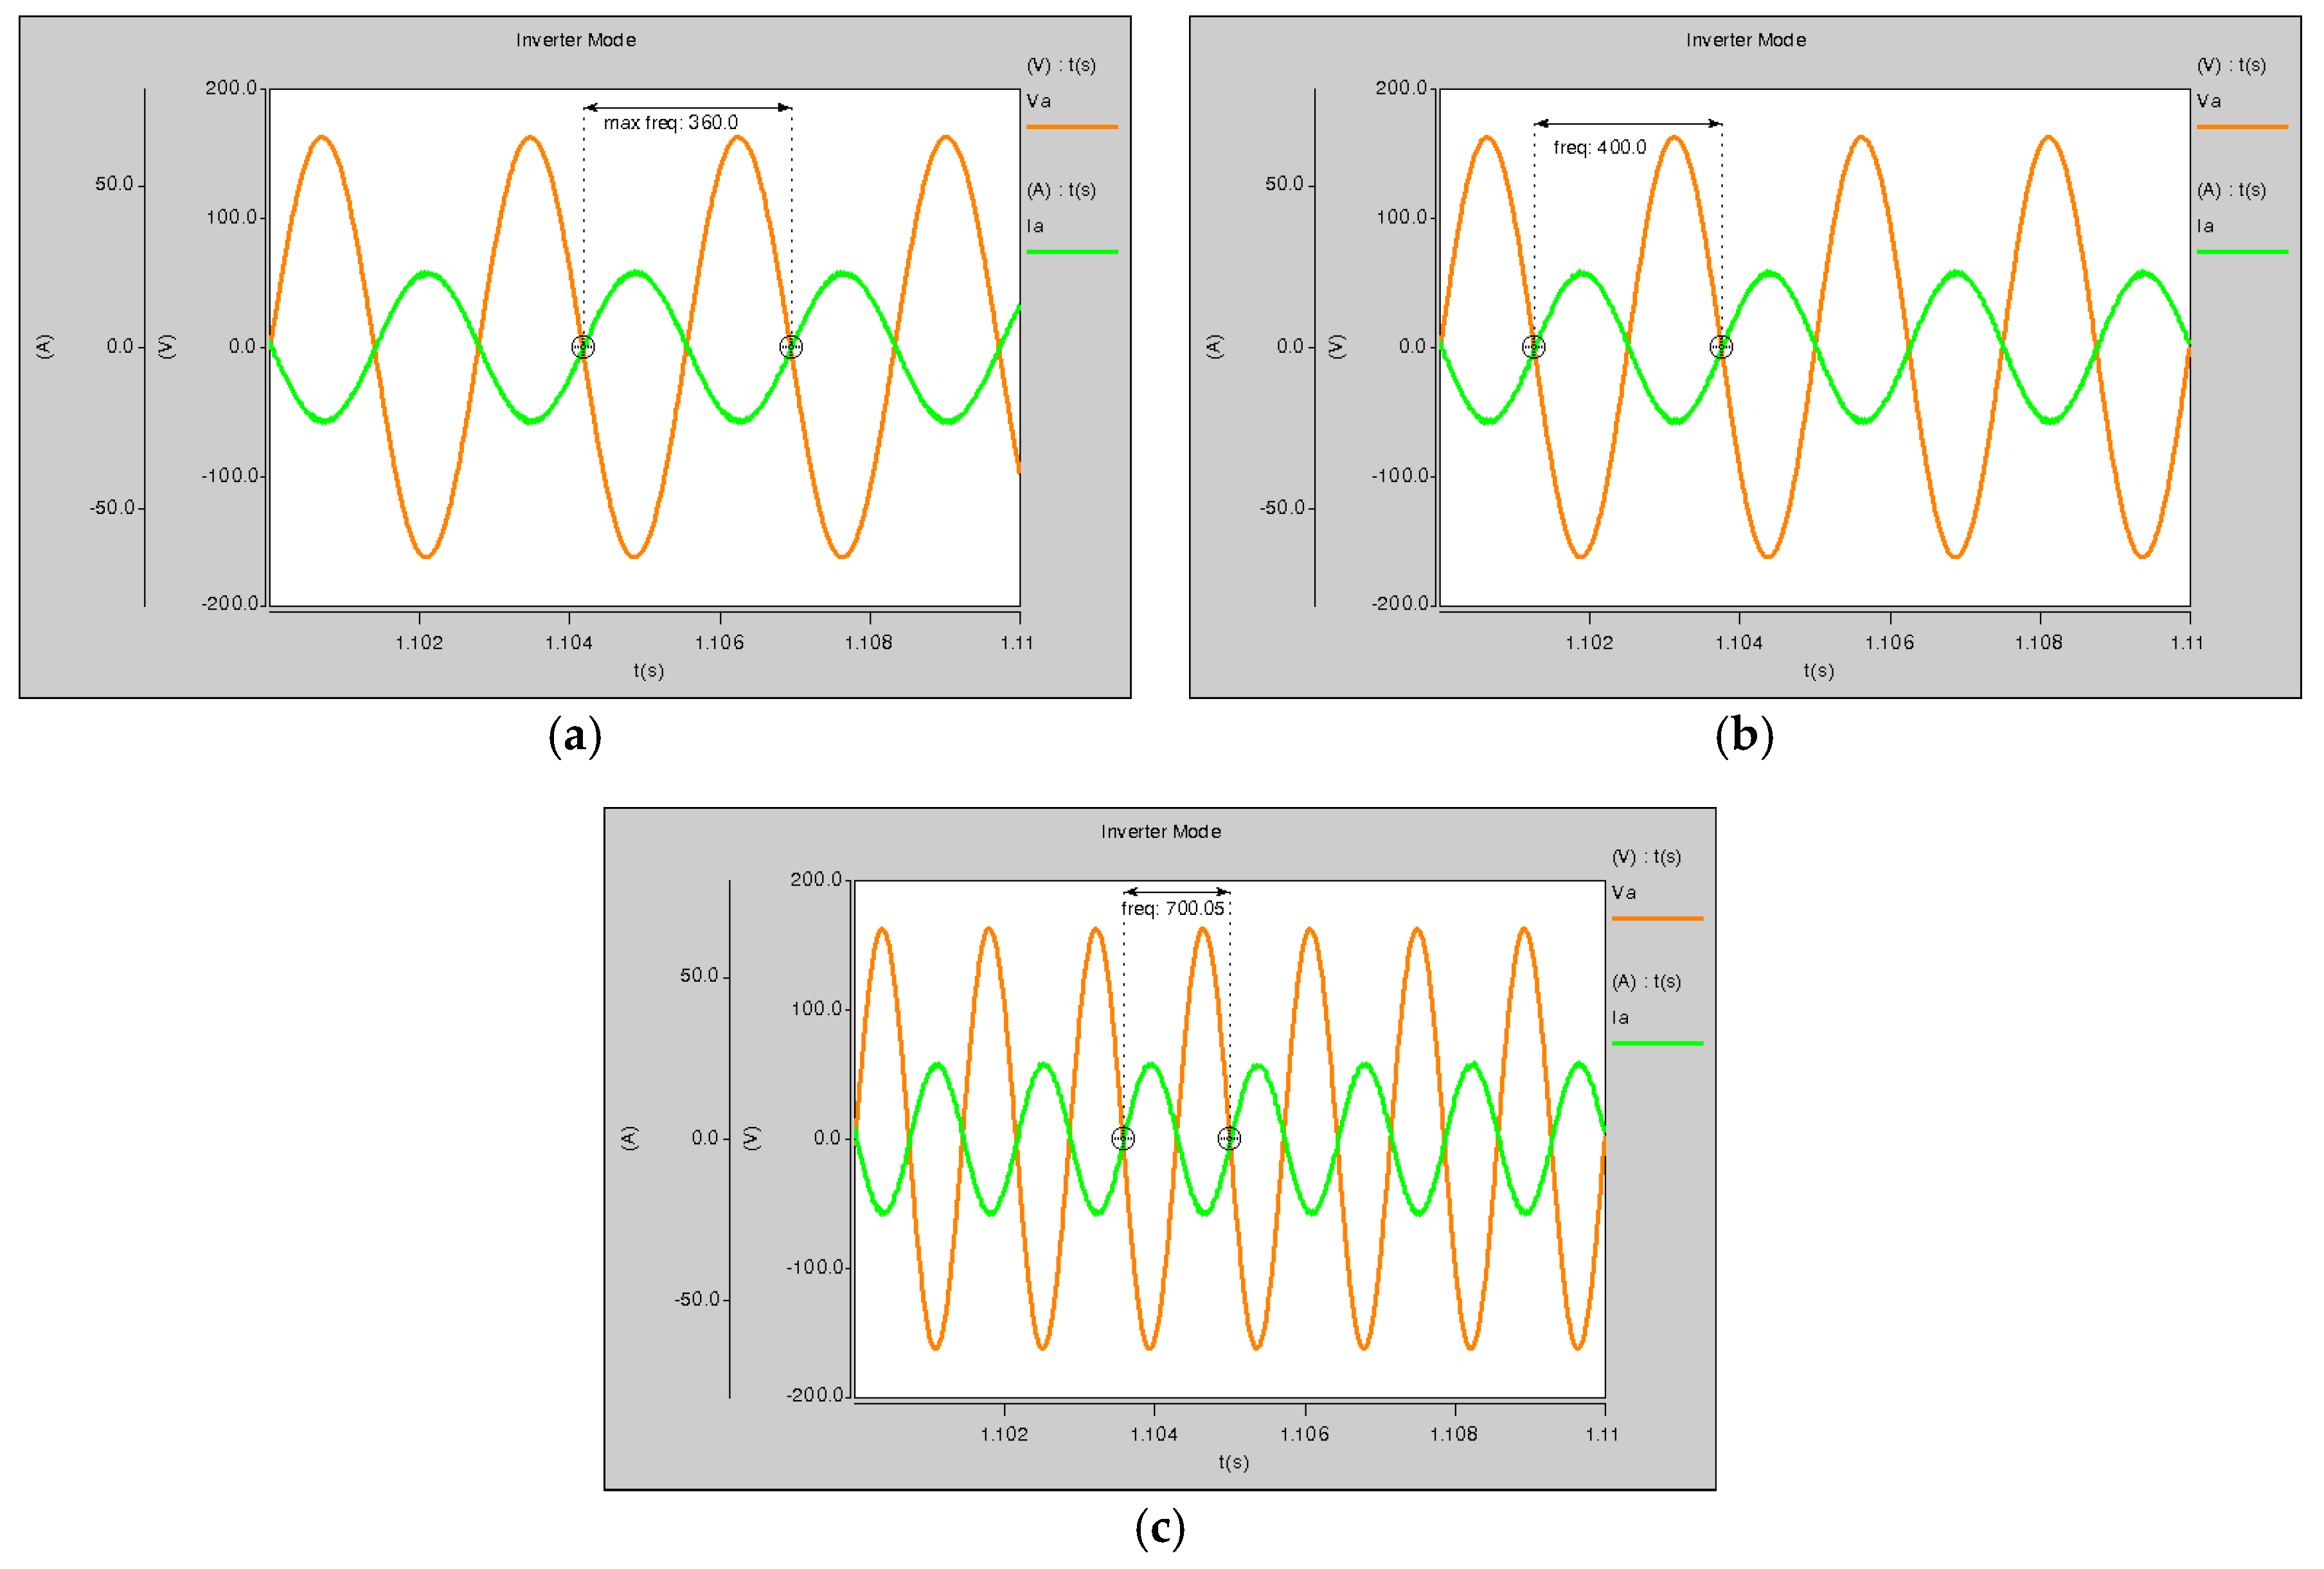
4.1. Variable Frequency Operation
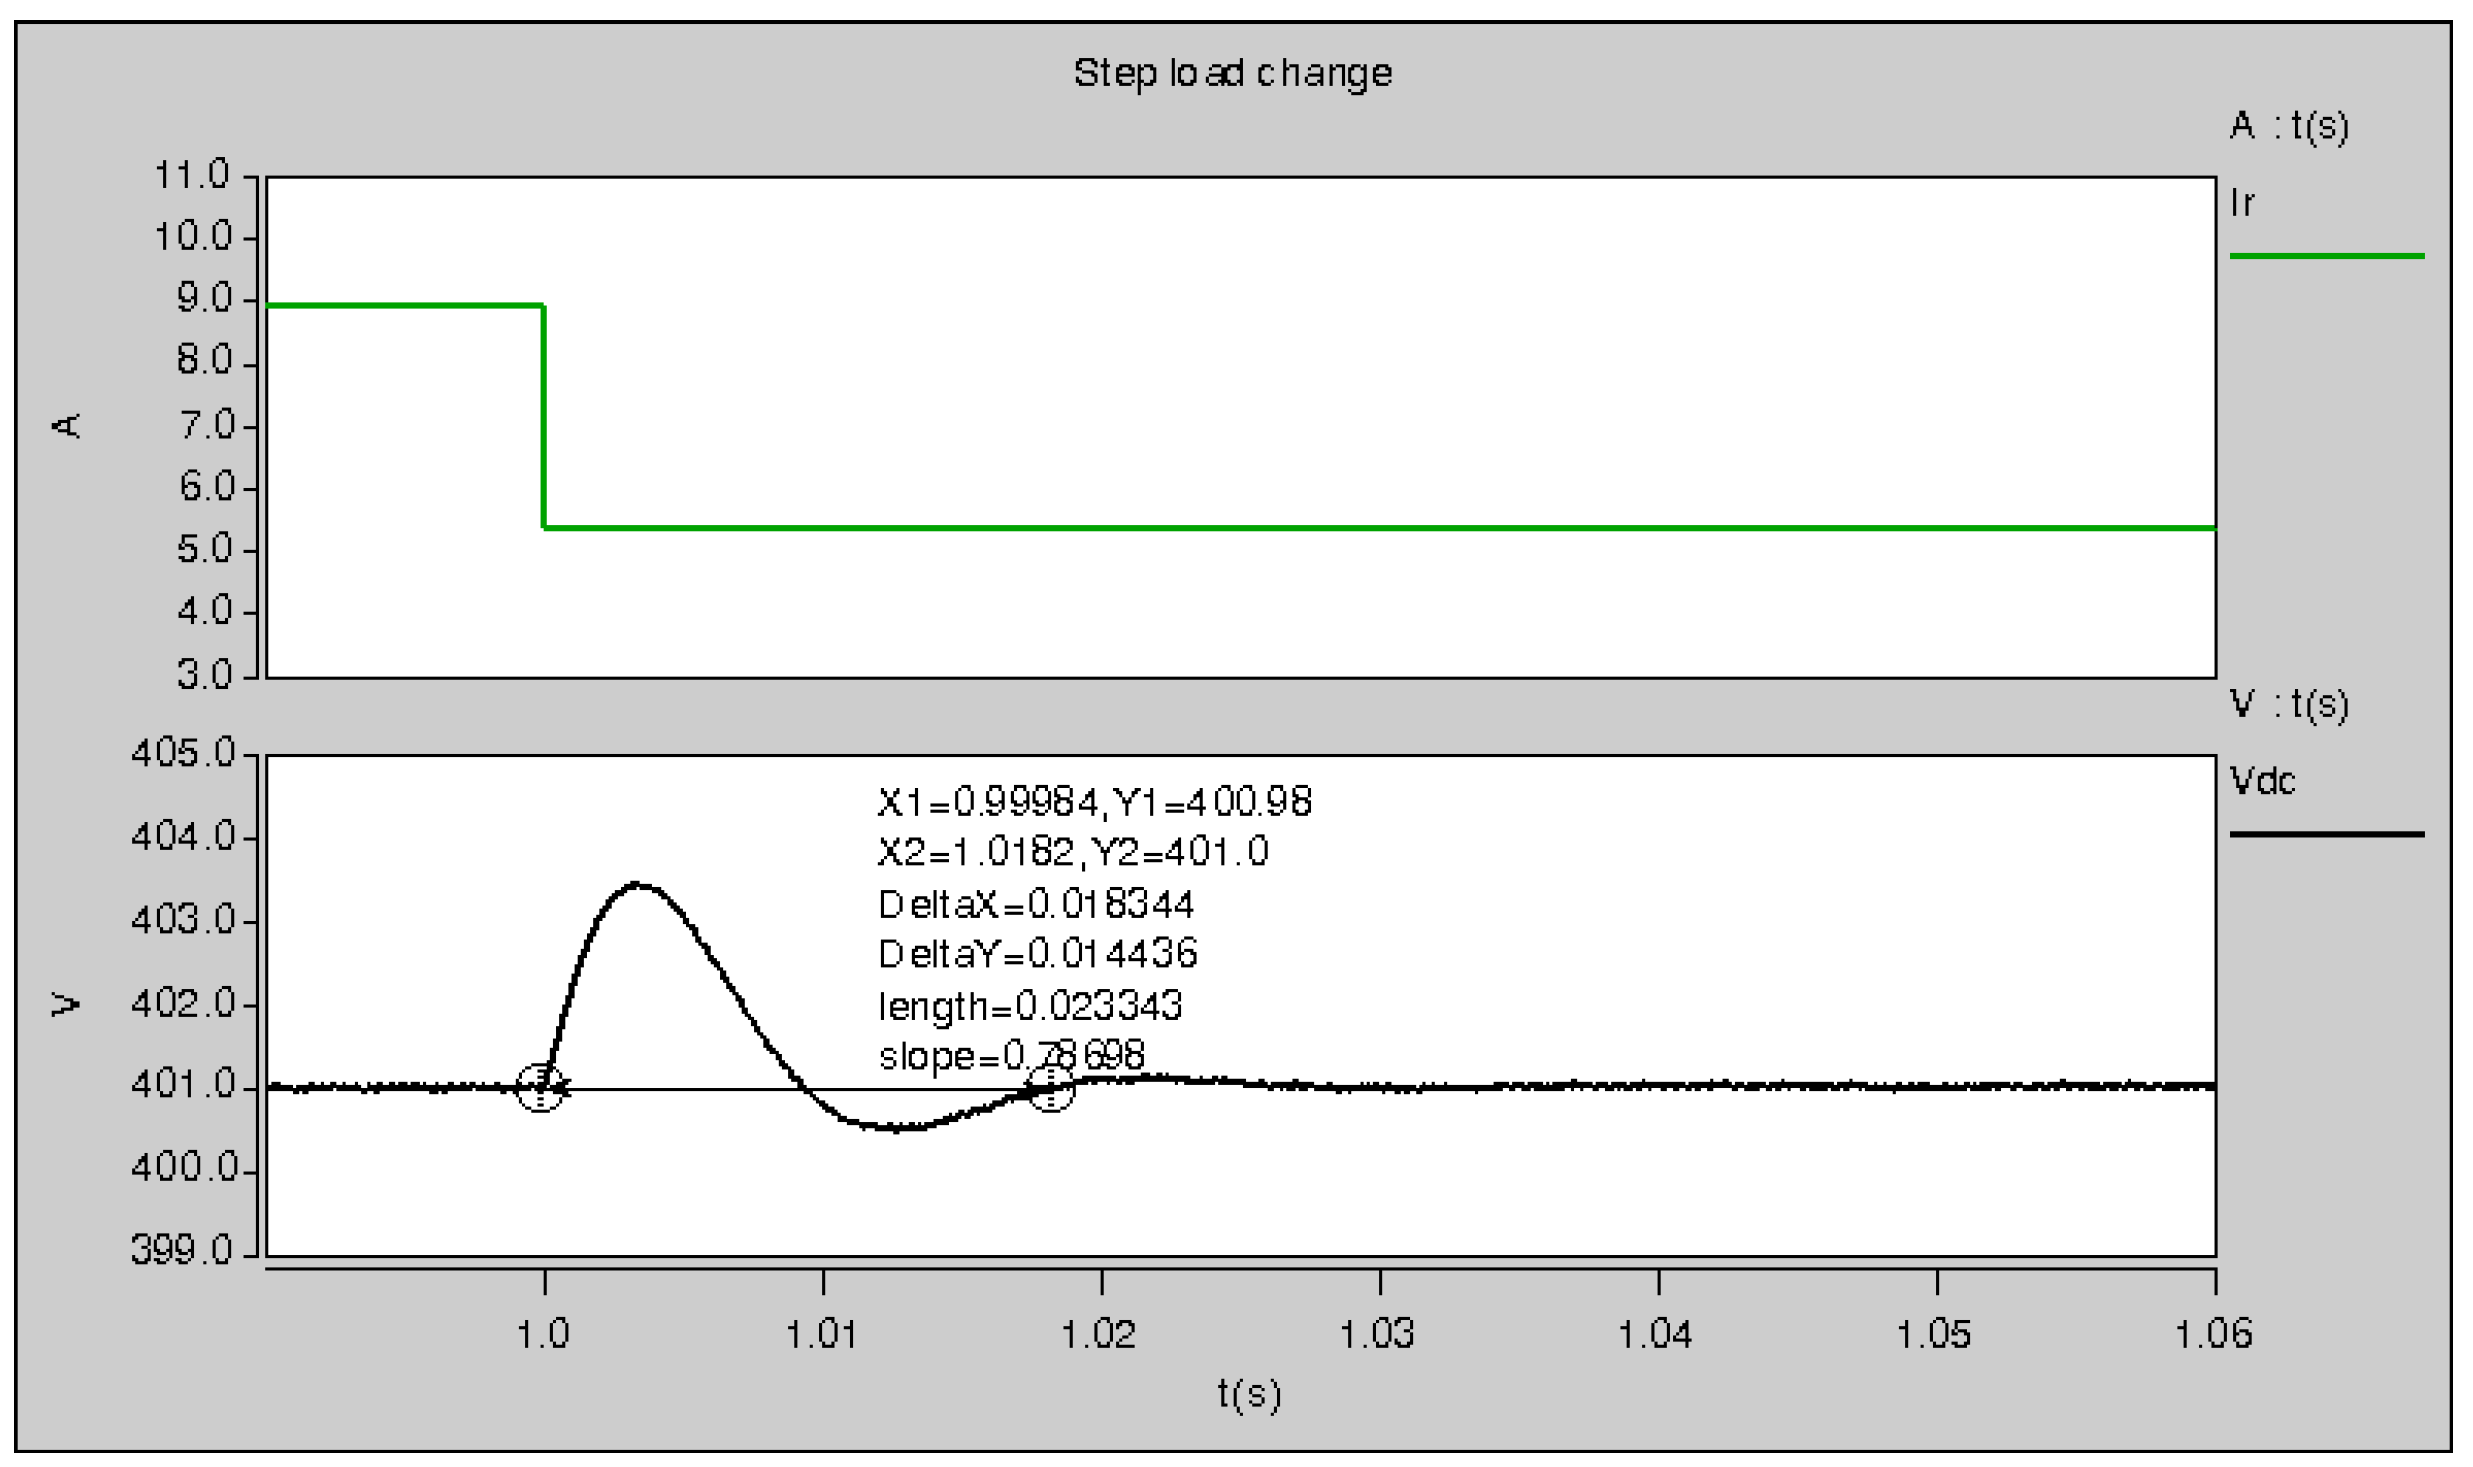
4.2. Change of the Working Mode
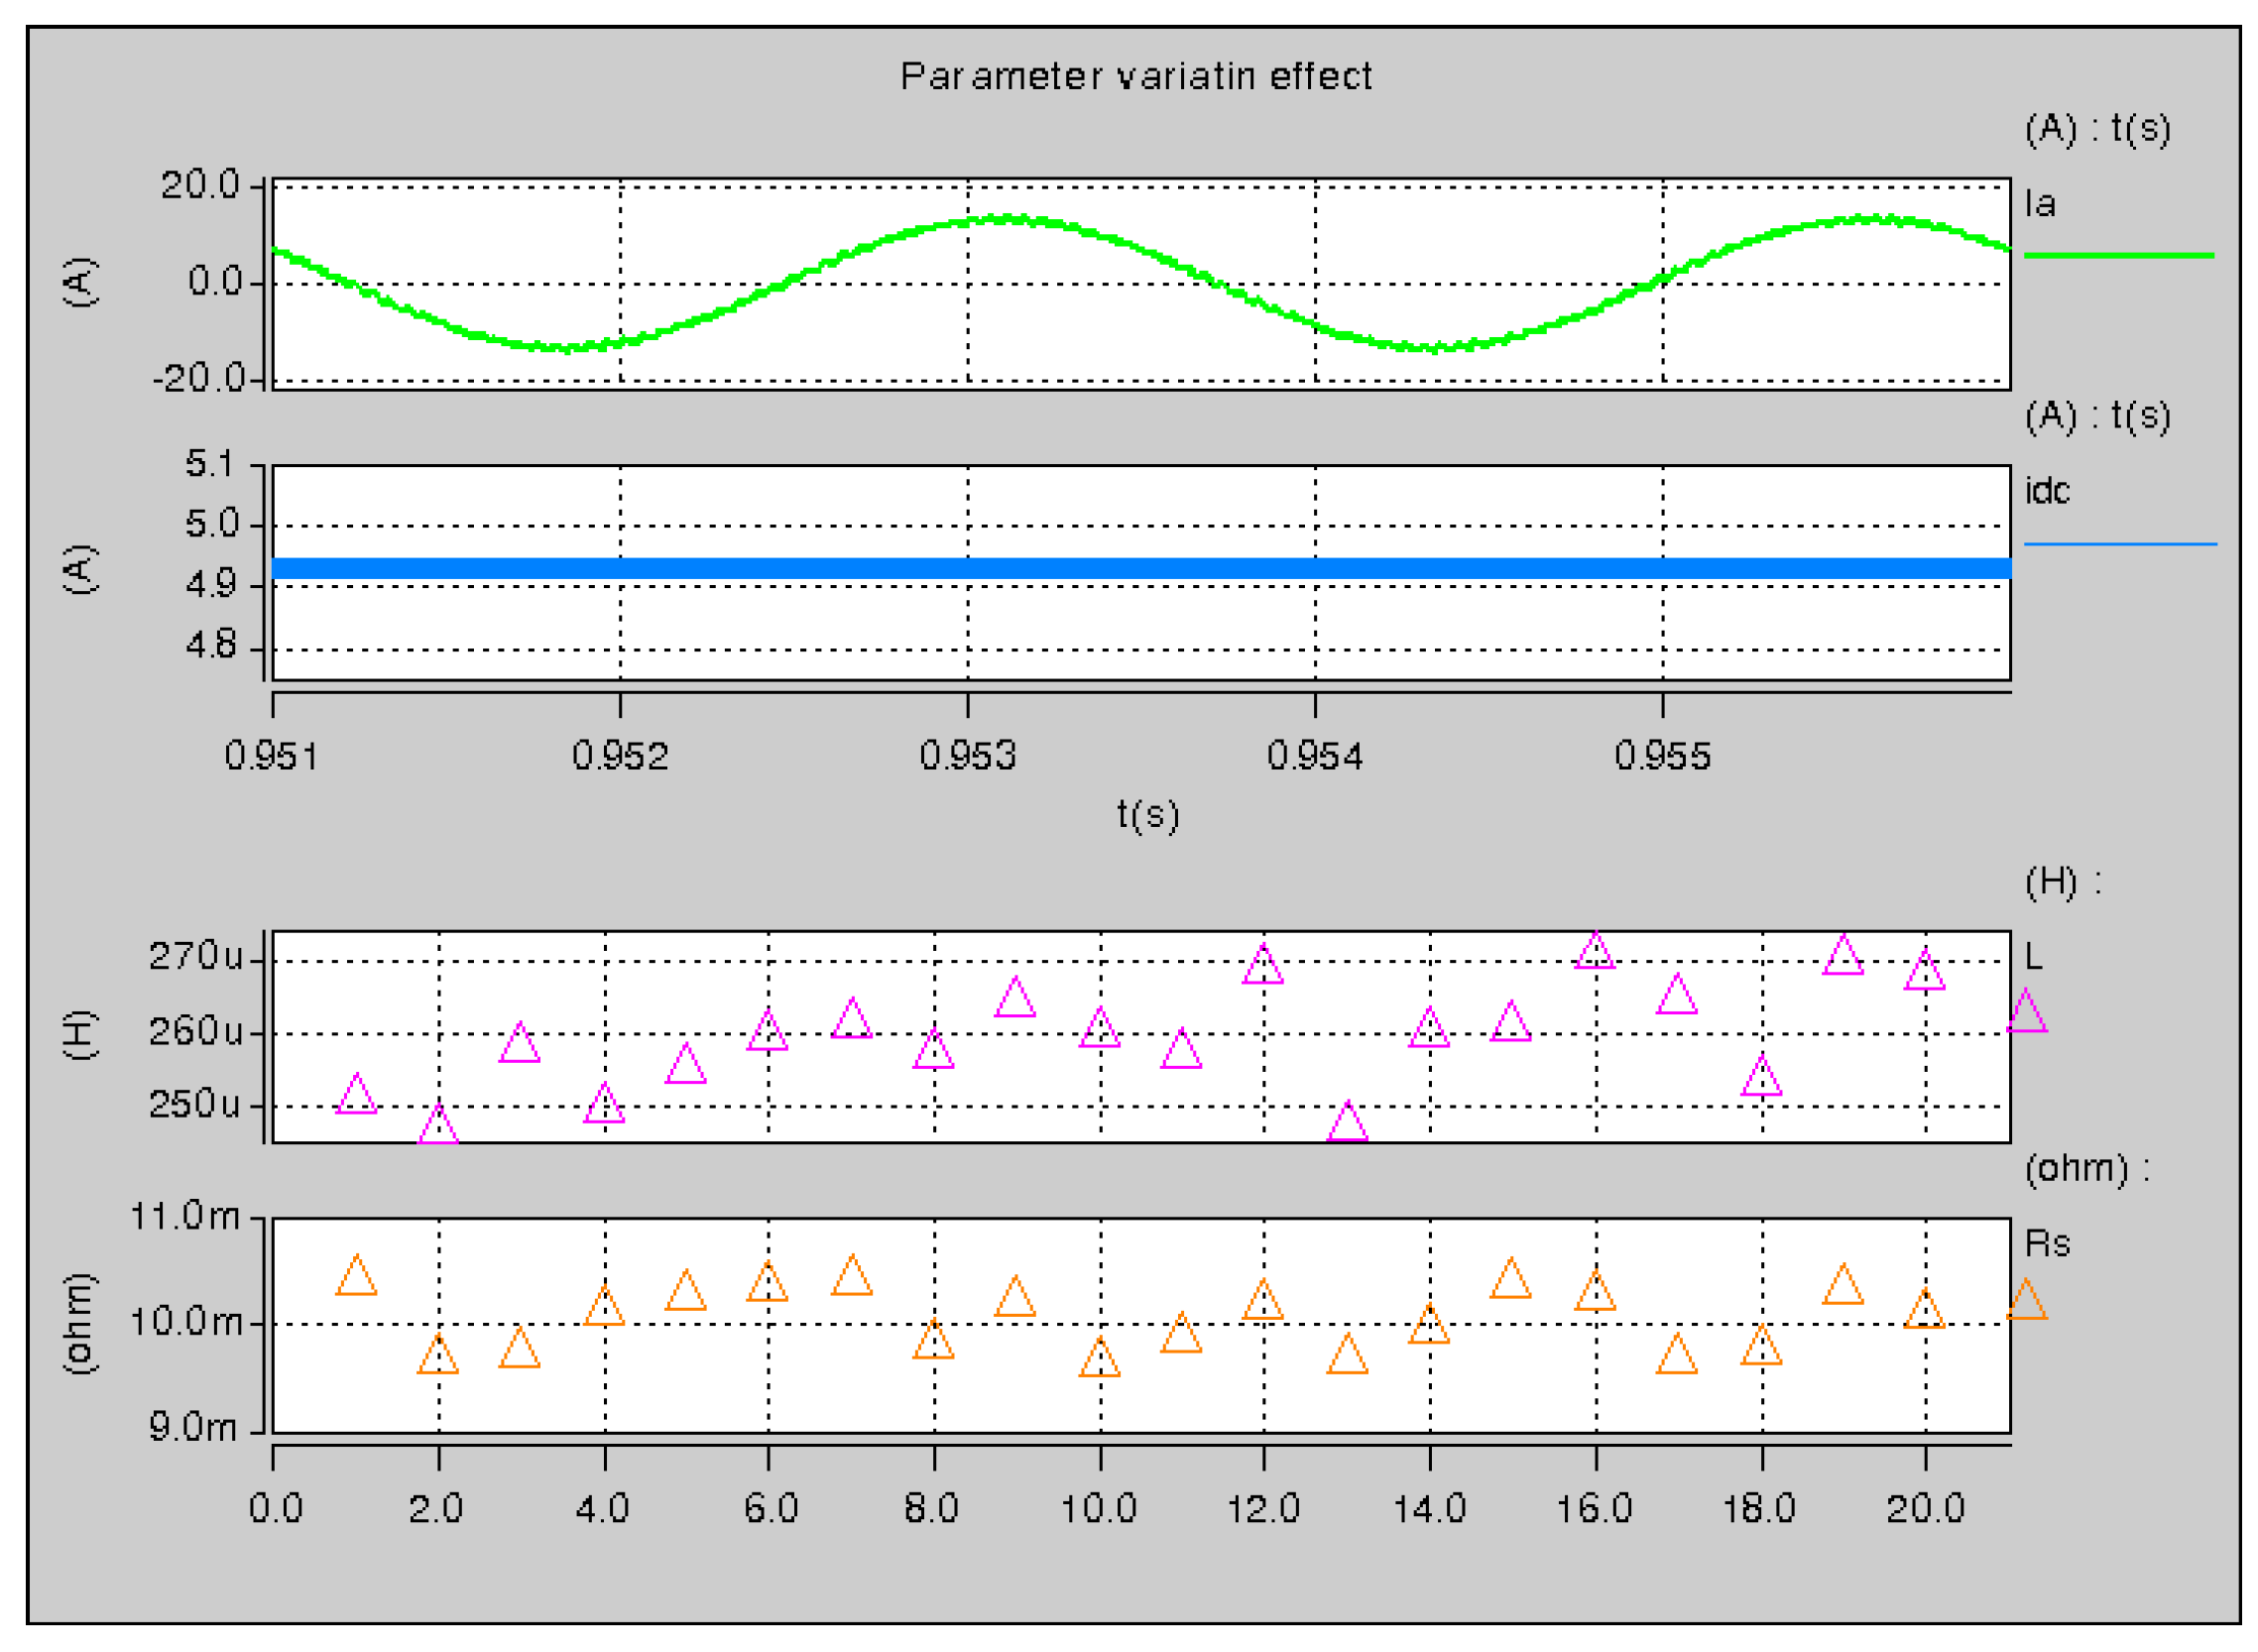
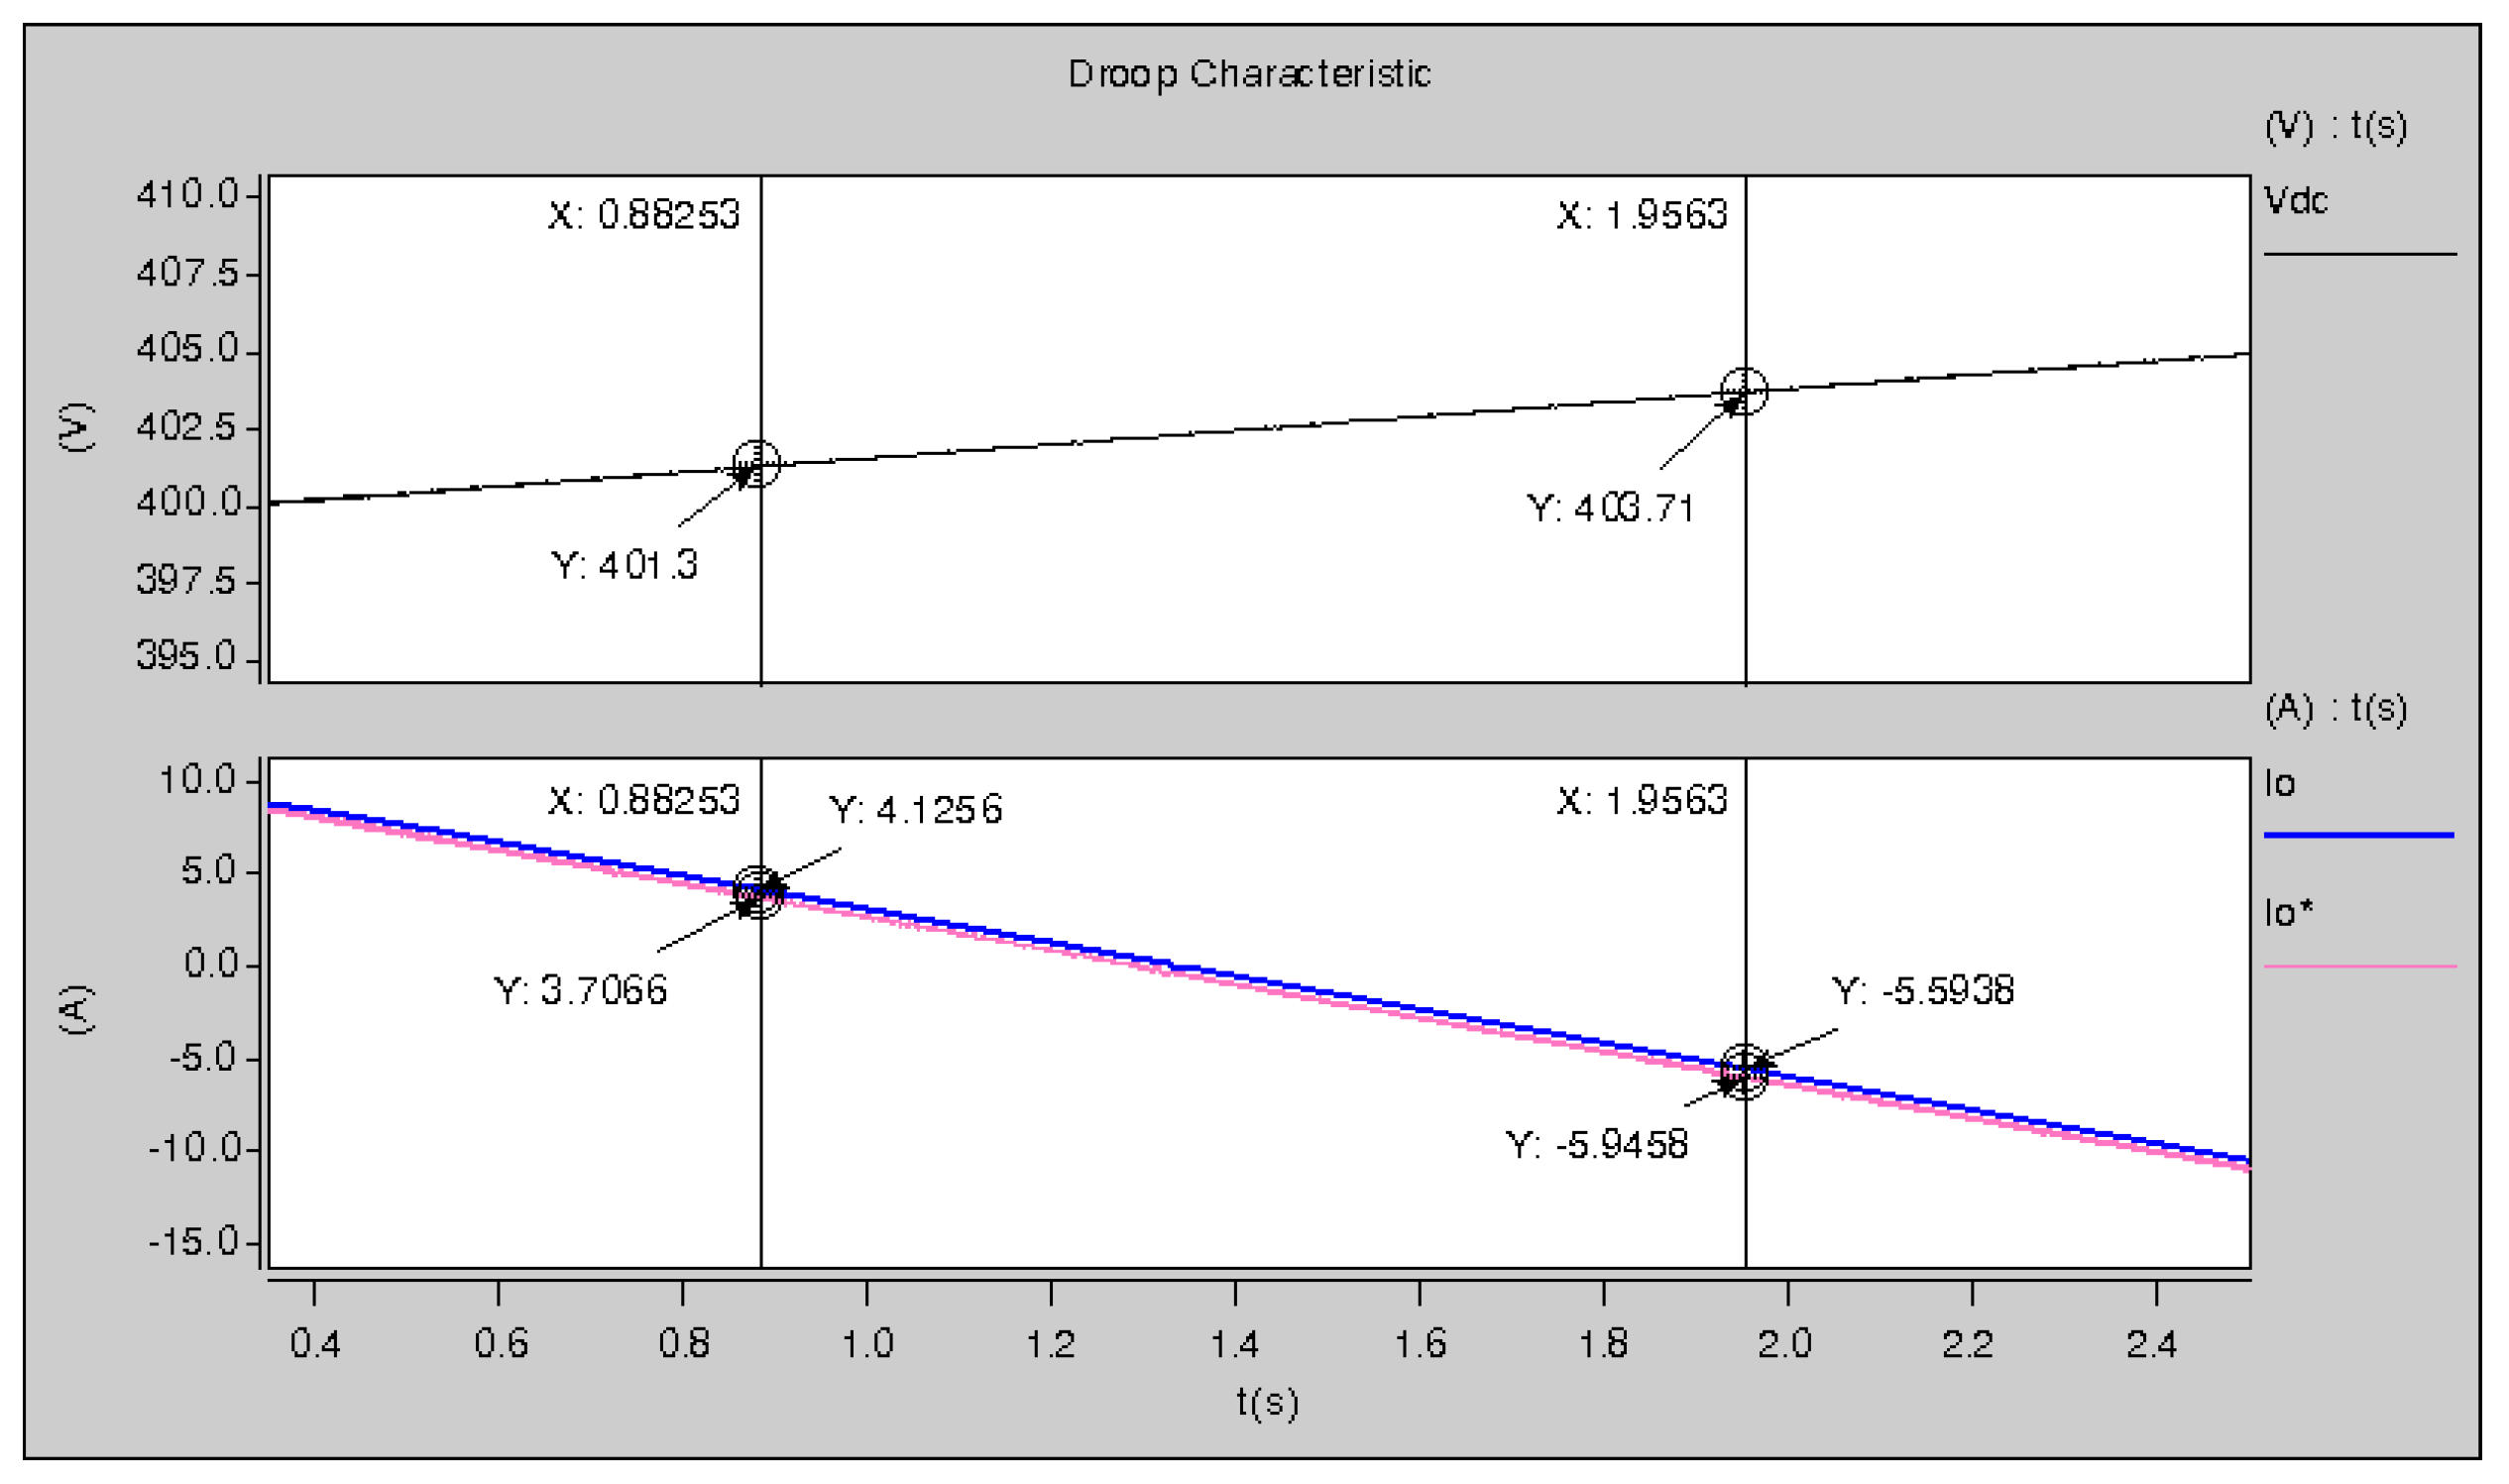
4.3. Robustness Analysis
5. Experimental Results
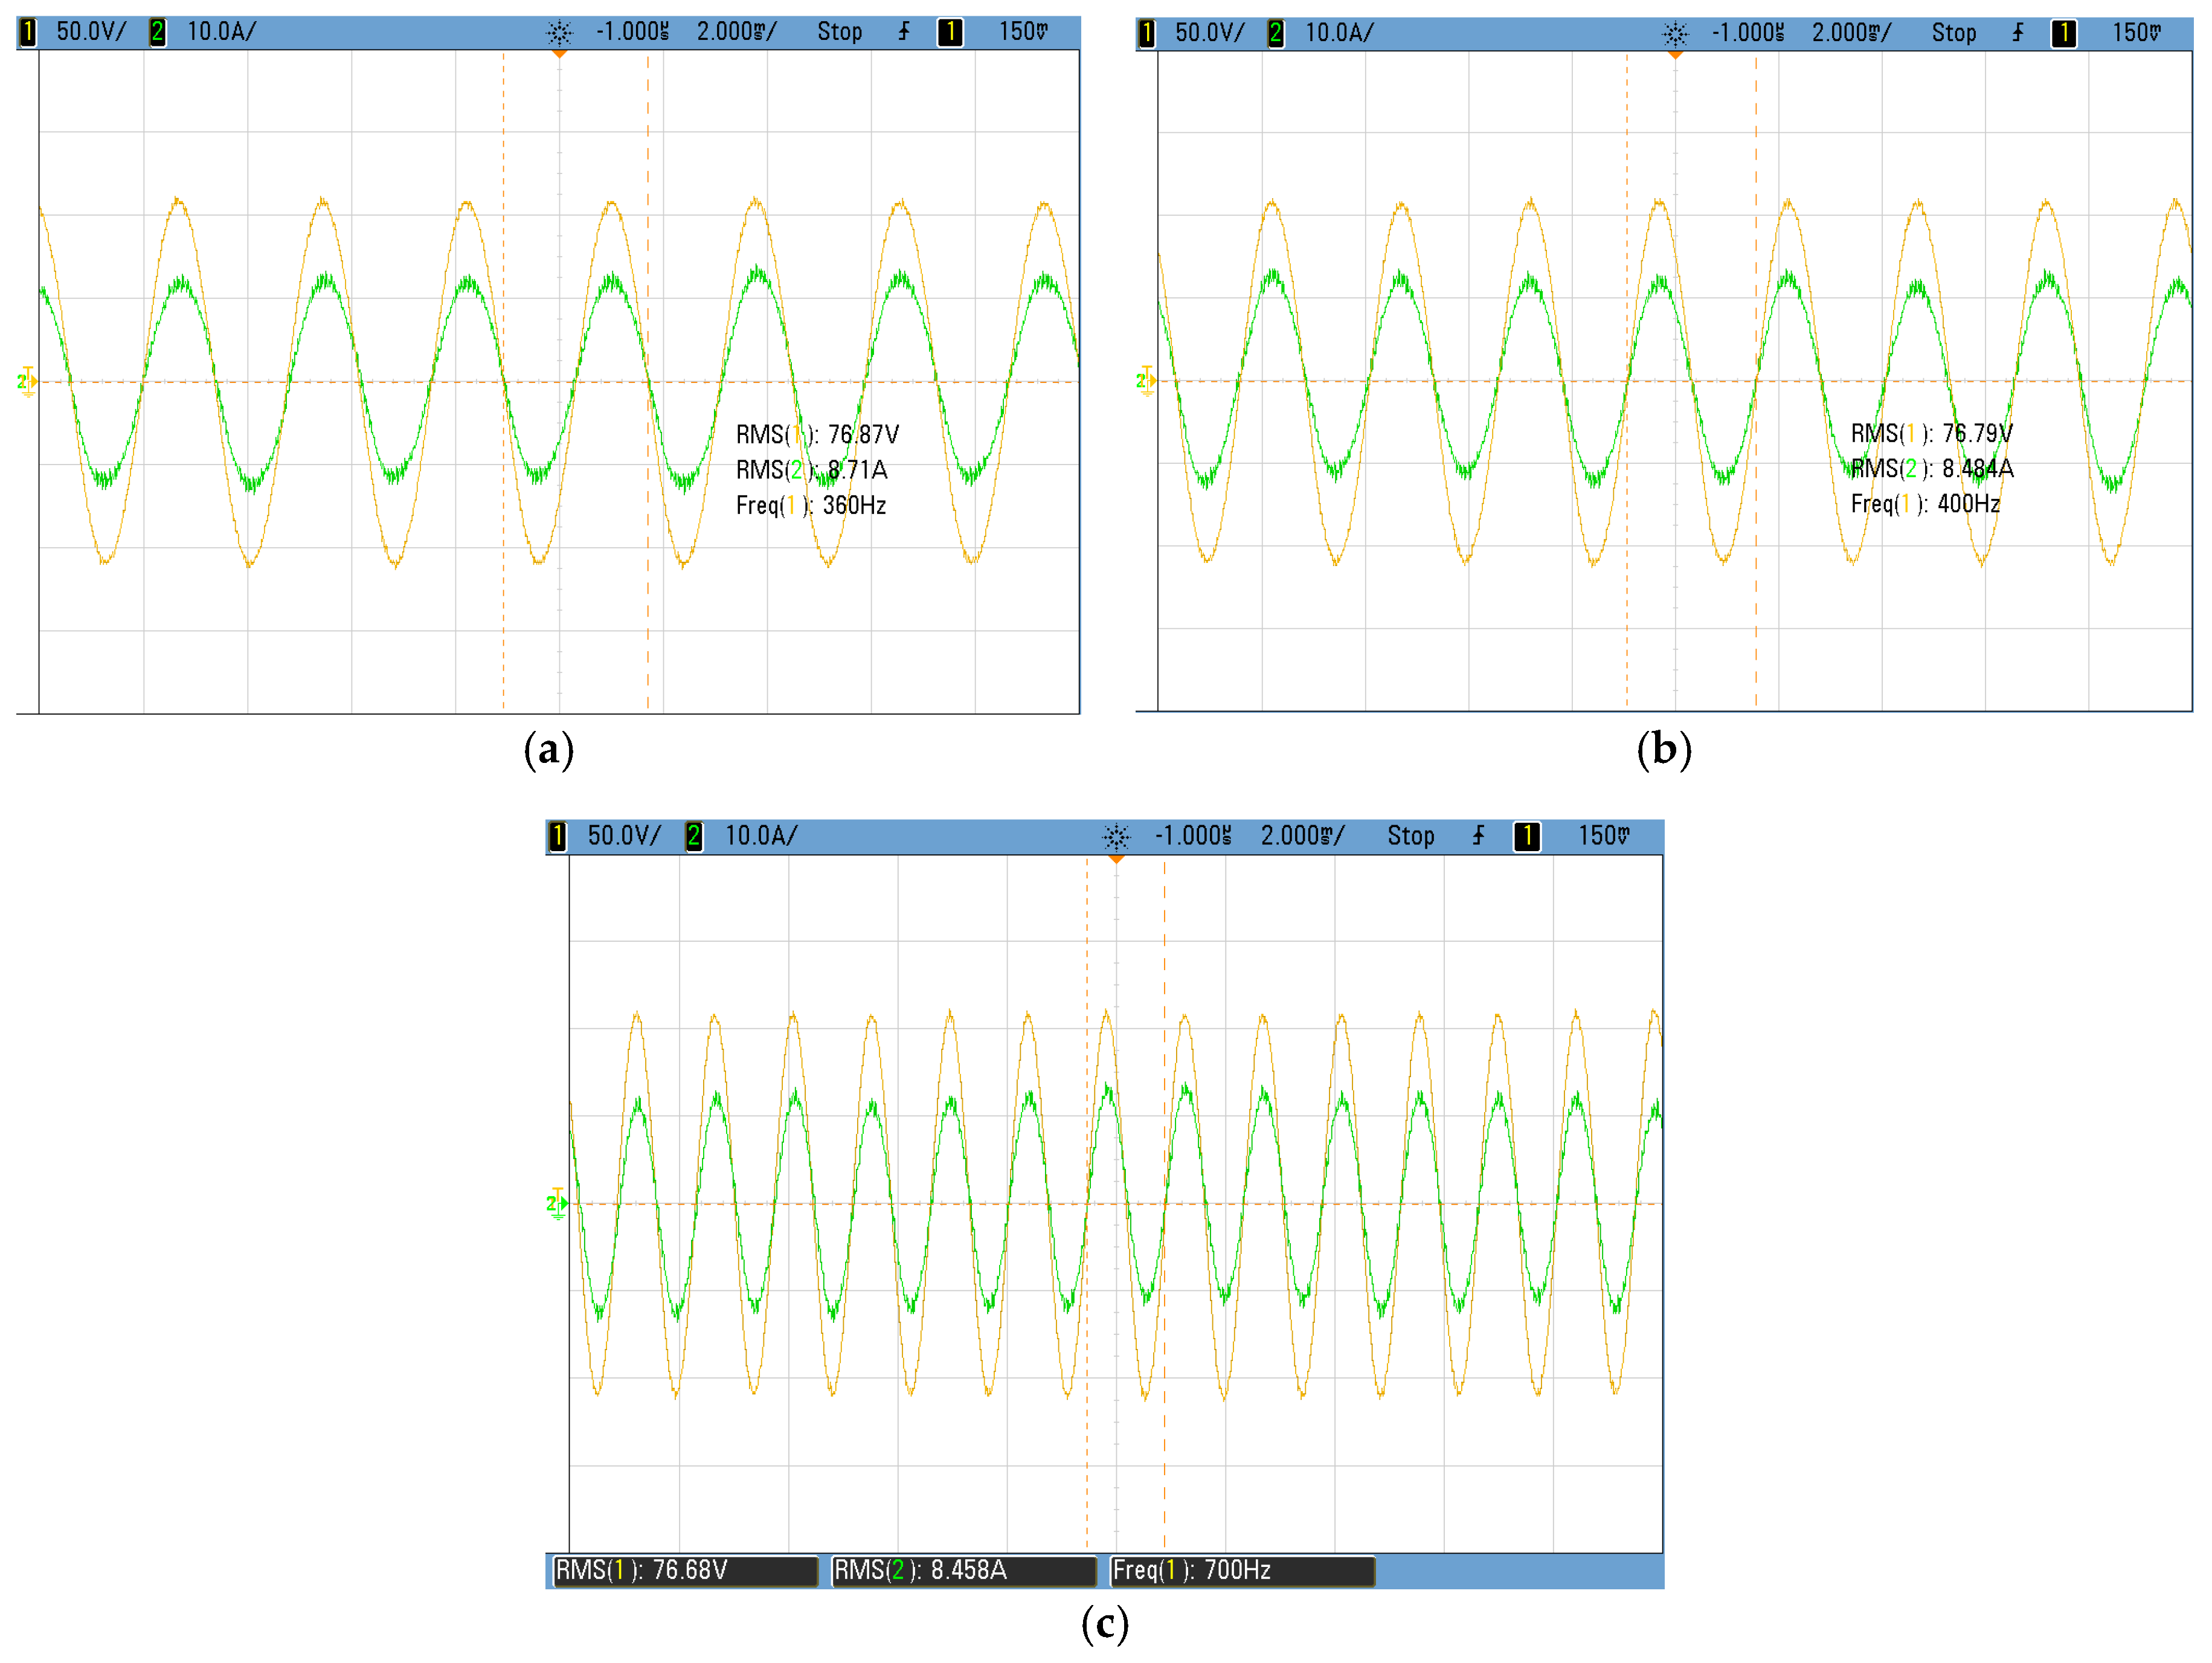
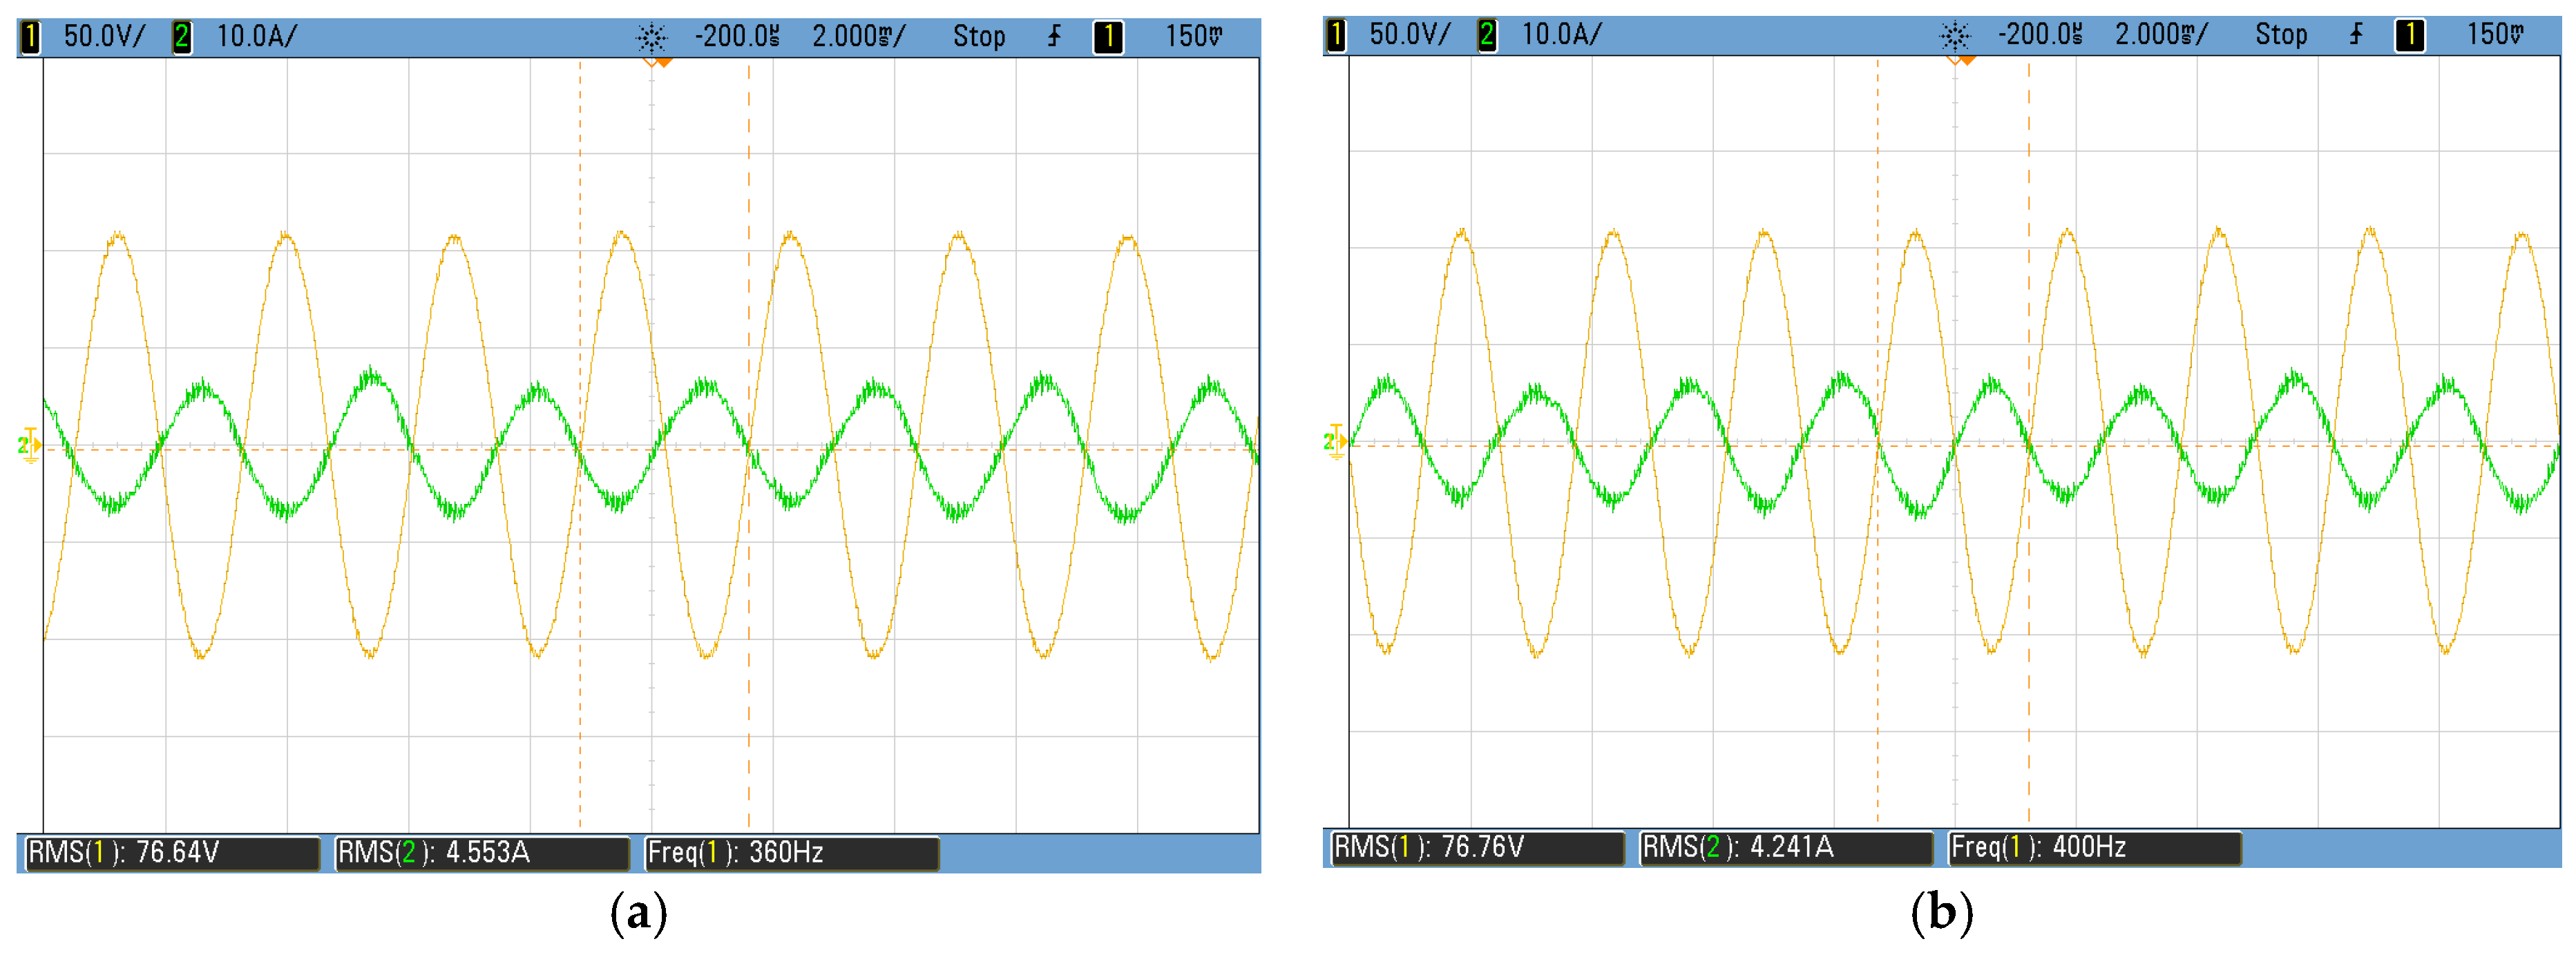
5.1. Variable Frequency Operation
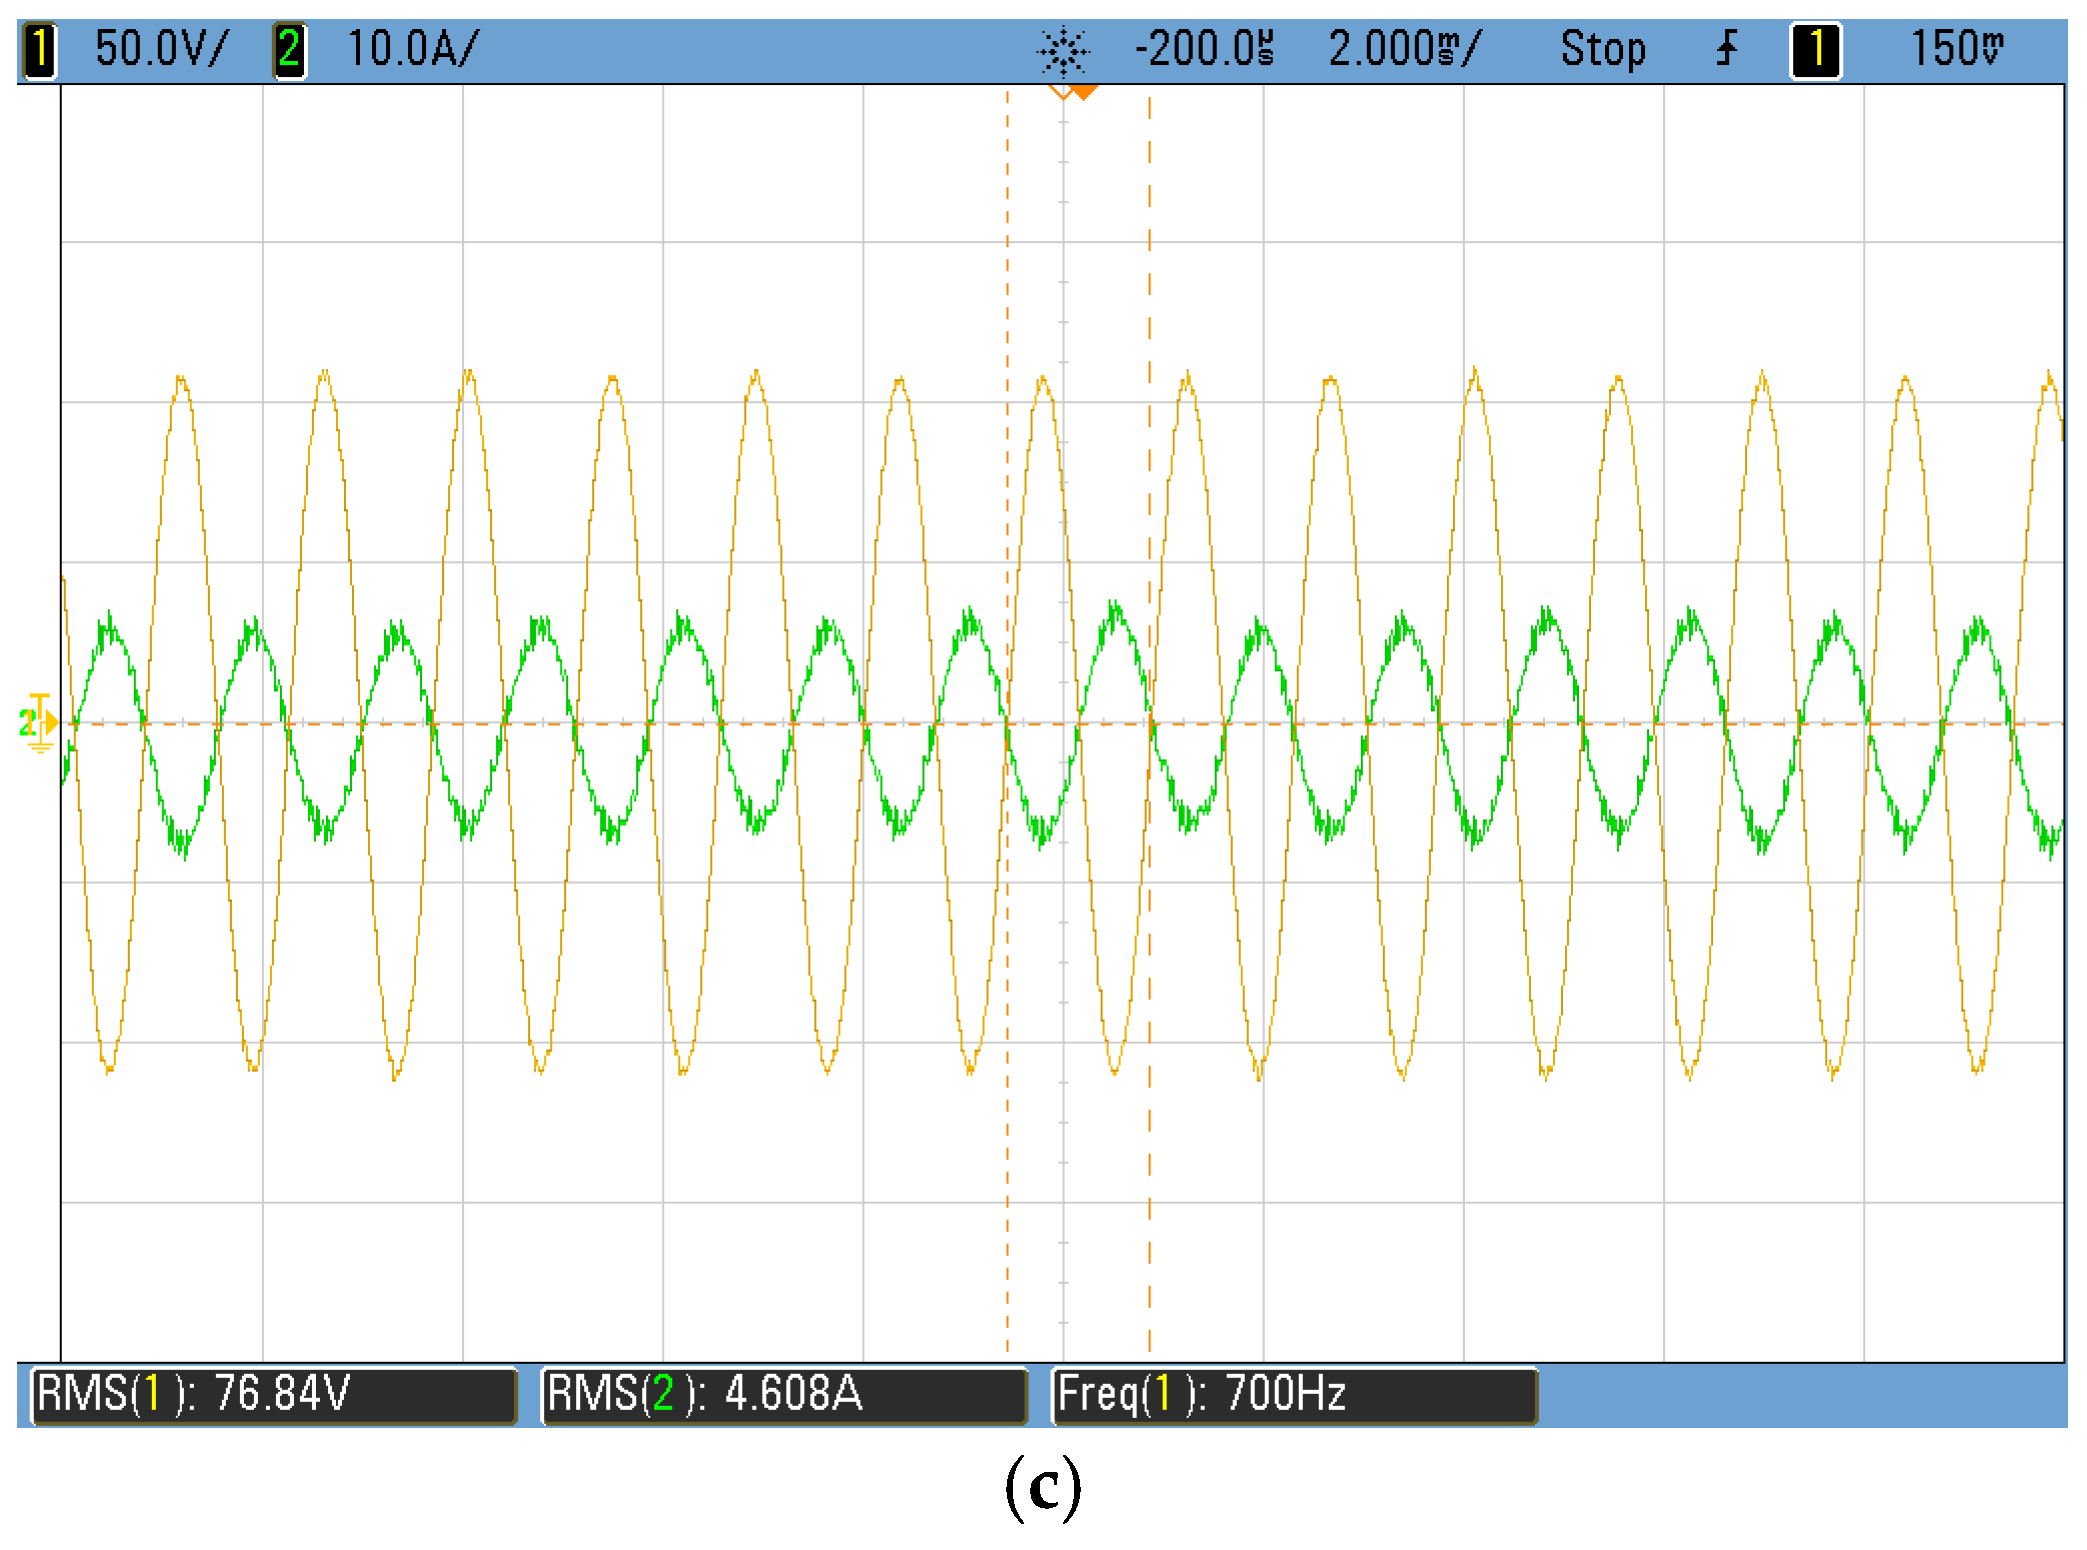
5.2. Change of the Working Mode
6. Conclusions
- (1)
- Unity power factor operation of the converter is performed under variable frequency input.
- (2)
- A unified control strategy is proposed for both rectifier/inverter modes. Rigorous control design of the LCL filter-based bidirectional converter is presented.
- (3)
- A droop characteristic is implemented to control the bidirectional power flow between the AC and DC sources.
Acknowledgments
Author Contributions
Conflicts of Interest
References
- Tariq, M.; Maswood, A.I.; Gajanayake, C.J.; Ooi, G.H.P.; Chatterjee, P.; Madishetti, S.; Molligoda, D.A.; Gupta, A.K. Battery integration with more electric aircraft DC distribution network using phase shifted high power bidirectional DC-DC converter. In Proceedings of the 2015 IEEE PES Asia-Pacific Power and Energy Engineering Conference (APPEEC), Brisbane, Australia, 15–18 November 2015.
- Rosero, J.A.; Ortega, J.A.; Aldabas, E.; Romeral, L. Moving towards a more electric aircraft. IEEE Aerosp. Electron. Syst. Mag. 2007, 22, 3–9. [Google Scholar] [CrossRef] [Green Version]
- Hartmann, M.; Miniboeck, J.; Ertl, H.; Kolar, J.W. A three-phase delta switch rectifier for use in modern aircraft. IEEE Trans. Ind. Electron. 2012, 59, 3635–3647. [Google Scholar] [CrossRef]
- Schroter, T.; Schulz, D. The electrical aircraft network—Benefits and drawbacks of modifications. IEEE Trans. Aerosp. Electron. Syst. 2013, 49, 189–200. [Google Scholar] [CrossRef]
- Deng, Y.; Foo, S.Y.; Bhattacharya, I. Regenerative electric power for more electric aircraft. In Proceedings of the IEEE SOUTHEASTCON, Lexington, KY, USA, 13–16 March 2014.
- Wheeler, P.; Bozhko, S. The more electric aircraft: Technology and challenge. IEEE Electr. Mag. 2014, 2, 6–12. [Google Scholar] [CrossRef]
- Guerrero, J.M.; Vasquez, J.C.; Matas, J.; Vicuña, L.G.; Castilla, M. Hierarchical control of droop-controlled AC and DC microgrids—A general approach toward standardization. IEEE Trans. Ind. Electron. 2011, 58, 158–172. [Google Scholar] [CrossRef]
- Dragicevic, T.; Guerrero, J.M.; Vasquez, J.C.; Skrlec, D. Supervisory control of an adaptive-droop regulated DC microgrid with battery management capability. IEEE Trans. Power Electron. 2014, 29, 695–706. [Google Scholar] [CrossRef]
- Bahrani, B.; Vasiladiotis, M.; Rufer, A. High-order vector control of grid-connected voltage-source converters with LCL-filters. IEEE Trans. Ind. Electron. 2014, 61, 2767–2775. [Google Scholar] [CrossRef]
- Gu, L.; Jin, J. A three-phase bidirectional AC-DC converter with Y–Δ connected transformers. IEEE Trans. Power Electron. 2016, 31, 8115–8125. [Google Scholar]
- Akter, M.P.; Mekhilef, S.; Tan, N.M.L.; Akagi, H. Modified model predictive control of a bidirectional AC-DC converter based on lyapunov function for energy storage systems. IEEE Trans. Ind. Electron. 2016, 63, 704–715. [Google Scholar] [CrossRef]
- Mohamed, A.; Elshaer, M.; Mohammed, O. Bi-directional AC-DC/DC-AC converter for power sharing of hybrid AC/DC systems. In Proceedings of the IEEE Power and Energy Society General Meeting, Detroit, MI, USA, 24–29 July 2011.
- Nassef, M.I.; Ashour, H.A.; Desouki, H. Battery-less hybrid micro-grid power management using bi-directional three phase power converter. In Proceedings of the IEEE 1st International Conference on DC Microgrids (ICDCM), Atlanta, GA, USA, 7–10 June 2015.
- Gao, F.; Bozhko, S.; Costabeber, A.; Patel, C.; Wheeler, P.; Hill, C.I.; Asher, G. Comparative stability analysis of droop control approaches in voltage-source-converter-based DC microgrids. IEEE Trans. Power Electron. 2017, 32, 2395–2415. [Google Scholar] [CrossRef]
- Wang, W.; Barnes, M. Power flow algorithms for multi-terminal VSC-HVDC with droop control. IEEE Trans. Power Syst. 2014, 29, 1721–1730. [Google Scholar] [CrossRef]
- Chen, F.; Zhang, W.; Burgos, R.; Boroyevich, D. Droop voltage range design in DC micro-grids considering cable resistance. In Proceedings of the IEEE Energy Conversion Congress and Exposition (ECCE), Pittsburgh, PA, USA, 14–18 September 2014.
- Haileselassie, T.M.; Uhlen, K. Impact of DC line voltage drops on power flow of MTDC using droop control. IEEE Trans. Power Syst. 2012, 27, 1441–1449. [Google Scholar] [CrossRef]
- Chaudhuri, N.R.; Chaudhuri, B. Adaptive droop control for effective power sharing in Multi-Terminal DC (MTDC) grids. IEEE Trans. Power Syst. 2013, 28, 21–29. [Google Scholar] [CrossRef]
- Lu, X.; Guerrero, J.M.; Sun, K.; Vasquez, J.C. An improved droop control method for DC microgrids based on low bandwidth communication with dc bus voltage restoration and enhanced current sharing accuracy. IEEE Trans. Power Electron. 2014, 29, 1800–1812. [Google Scholar] [CrossRef]
- Anand, S.; Fernandes, B.G.; Guerrero, J.M. Distributed control to ensure proportional load sharing and improve voltage regulation in low voltage DC microgrids. IEEE Trans. Power Electron. 2013, 28, 1900–1913. [Google Scholar] [CrossRef]
- Wang, P.; Lu, X.; Yang, X.; Wang, W.; Xu, D.G. An improved distributed secondary control method for DC microgrids with enhanced dynamic current sharing performance. IEEE Trans. Power Electron. 2016, 31, 6658–6673. [Google Scholar] [CrossRef]
- Gao, F.; Bozhko, S.; Asher, G.; Wheeler, P.; Patel, C. An improved voltage compensation approach in a droop-controlled DC power system for the more electric aircraft. IEEE Trans. Power Electron. 2016, 31, 7369–7383. [Google Scholar] [CrossRef]
- Zheng, X.; Gao, F.; Bozhko, S. Stability Study of DC Electric Power System with Paralleled Generators for More-Electric Aircraft; SAE Technical Paper 2014-01-2114; SAE International: Warrendale, PA, USA, 2014. [Google Scholar]
- Liserre, M.; Blaabjerg, F.; Hansen, S. Design and control of an LCL-filter-based three-phase active rectifier. IEEE Trans. Ind. Appl. 2005, 41, 1281–1291. [Google Scholar] [CrossRef]
- Liserre, M.; Dell’Aquila, A.; Blaabjerg, F. Stability improvements of an LCL-filter based three-phase active rectifier. In Proceedings of the IEEE 33rd Annual Power Electronics Specialists Conference (PESC), Cairns, Australia, 23–27 June 2002.
- Mohamed, A.; Nejadpak, A.; Mohammed, O. LCL-filter-based bi-directional converter for connectivity of microgrids involving sustainable energy sources. In Proceedings of the North American Power Symposium (NAPS), Champaign, IL, USA, 9–11 September 2012.


| Category | Symbols | Parameters |
|---|---|---|
| Inner current controller | Hic | Kpi = 0.553 Ω, Kli = 17.27 Ω·s−1 |
| Outer current controller | Hio | Kpv = 0.45, KIv = 40 s−1 |
| Droop controller | K1 | −4 A/V |
| Droop controller | K2 | 1608.89 A |
| Parameter | Symbols | Value |
|---|---|---|
| Input AC voltage | Vac | 115 |
| Source frequency | f | 360–800 Hz |
| Grid side inductor | 0.26 mH | |
| Converter side inductor | 0.18 mH | |
| Filter capacitor | 2.5 µF | |
| IGBT Resistance | 0.01 Ω | |
| Switching frequency | 20 kHz | |
| PWM gain | 10 | |
| DC link capacitor | 3000 µF | |
| Nominal voltage | 400 V | |
| DC source voltage | 380–420 V | |
| Threshold voltage | 402 V | |
| DC source series inductance | Ldc | 3.6 mH |
| Parameter | Symbols | Value |
|---|---|---|
| Input AC voltage | Vac | 77 VRMS |
| Nominal voltage | 273.5 V | |
| Power | P | 2 |
| DC source voltage | edc | 270–280 V |
| Threshold voltage | 275 V | |
| Droop characteristic | K1 | −4 |
| Droop characteristic | K2 | 1100 |
© 2017 by the authors. Licensee MDPI, Basel, Switzerland. This article is an open access article distributed under the terms and conditions of the Creative Commons Attribution (CC BY) license ( http://creativecommons.org/licenses/by/4.0/).
Share and Cite
Zheng, X.; Gao, F.; Ali, H.; Liu, H. A Droop Control Based Three Phase Bidirectional AC-DC Converter for More Electric Aircraft Applications. Energies 2017, 10, 400. https://doi.org/10.3390/en10030400
Zheng X, Gao F, Ali H, Liu H. A Droop Control Based Three Phase Bidirectional AC-DC Converter for More Electric Aircraft Applications. Energies. 2017; 10(3):400. https://doi.org/10.3390/en10030400
Chicago/Turabian StyleZheng, Xiancheng, Fei Gao, Husan Ali, and Huamei Liu. 2017. "A Droop Control Based Three Phase Bidirectional AC-DC Converter for More Electric Aircraft Applications" Energies 10, no. 3: 400. https://doi.org/10.3390/en10030400