1. Introduction
The climate is changing partly due to human activities, with impacts on economy and social vulnerability [
1,
2,
3,
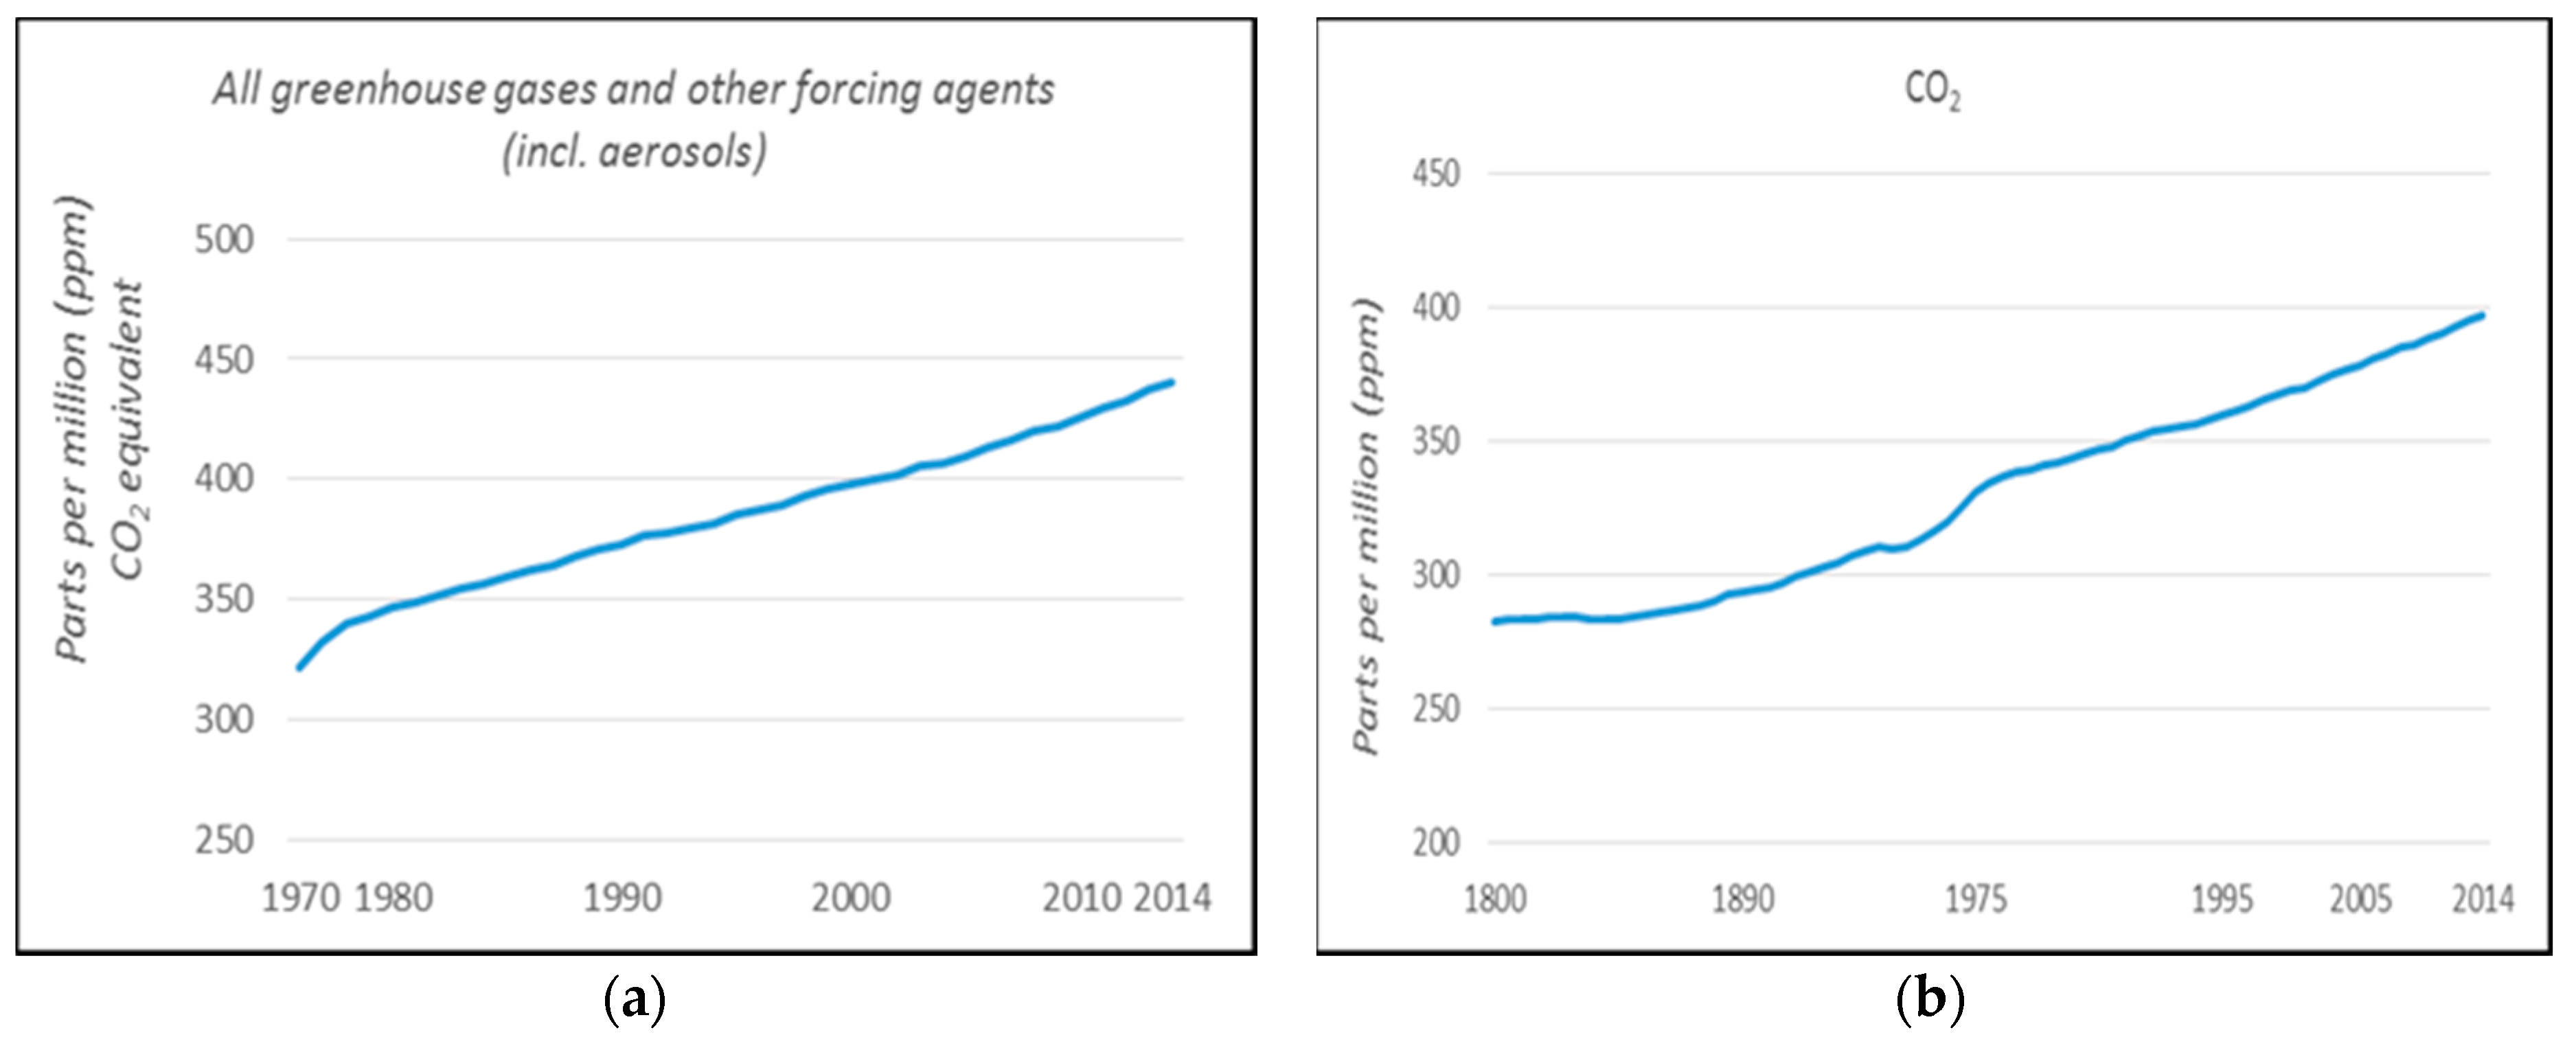
4]. An indicator of climate change is the Earth’s average surface temperature, which is rising. Globally-averaged temperatures in 2016 were 0.99 °C (1.78 °F) warmer than in the mid-20th century [
5]. Also, the six-month period from January to June 2016 was the planet's warmest half-year on record, with an average temperature 1.3 °C (2.4 °F) warmer than the late nineteenth century [
6]. However, recent climate changes cannot be explained by natural causes alone. The concentrations of greenhouse gases, like carbon dioxide (CO
2), methane (CH
4) and nitrous oxide (N
2O) have all increased since 1750 due to human activity [
7]. According to the European Environment Agency (EEA) global average concentrations of various greenhouse gases in the atmosphere continue to increase while at the same time the concentrations of CO
2, which account for about three-fourths of total emissions, increased to 397 parts per million (ppm) in 2014—an increase of 119 ppm (43%) compared to pre-industrial levels (
Figure 1) [
8]. To halt climate change, global greenhouse gas emissions must be reduced significantly by taking actions that jointly address sustainable development and climate change [
9].
Reducing greenhouse gas emissions from the energy sector is a major challenge for climate policy as electricity generation is one of the major contributors to anthropogenic emissions [
11,
12]. Generating energy from renewable sources today is considered to be a feasible option and simultaneously an environmentally appealing one. Indeed, as there is no direct combustion, emissions are not usually taken. However, the absence of direct combustion is no guarantee for the absence of other indirect sources of emissions [
13]. Furthermore, the cost of most renewable energy technologies has declined and additional expected technical advances would result in further cost reductions [
14].
This paper assesses the investment cost, considering the environmental cost, of a small hydropower plant, which can be used when conducting a feasibility study so as to examine whether the development of SHP is a viable option. The environmental cost has been estimated by using the LCA methodology, considering specified boundary conditions. Determining economic and financial costs and benefits, as well as taking into account the environmental cost, are key issues for an adequate financial analysis. Furthermore, the LCA method can be used by policy makers in environmental management as it provides indicators of the sustainability of SHPs.
2. Literature Review
2.1. Environmental Considerations and Life Cycle Assessment
Continued emissions of greenhouse gases imply irreversible effects on the planet, which may include dry-season rainfall reductions in several regions, Arctic sea ice retreat, increases in heavy rainfall and flooding, permafrost melt, loss of glaciers and snowpack with attendant changes in water supply, increased intensity of hurricanes, etc. [
15]. The Intergovernmental Panel on Climate Change (IPCC) points out that limiting climate change requires substantial and sustained reductions in greenhouse gas emissions which, together with adaptation, can reduce climate change risks [
16].
On the basis of an increasing body of evidence, the EU’s Environment Council already agreed in 1996 to limit global average surface temperature rise to below 2 °C (3.6 °F) above pre-industrial levels to prevent the most severe impacts of climate change or dangerous human interference with the climate system [
17]. The objectives of the EU’s energy strategy have been revealed in three documents: the
2020 Energy Strategy—to reduce greenhouse gas emissions by 20%, to increase the share of renewable energy to 20% and to make a 20% improvement in energy efficiency [
18], the
2030 Energy Strategy—a 40% cut in greenhouse gas emissions compared to the 1990 levels, at least a 27% share of renewable energy consumption, at least 27% energy savings compared with the business-as-usual scenario [
19], and the
2050 Energy strategy—a long-term goal of reducing greenhouse gas emissions by 80–95% when compared to the 1990 levels by 2050 [
20].
In the International Energy Outlook 2016 (IEO 2016) reference case, it is highlighted that world net electricity generation will have increased 69% by 2040, from 21.6 trillion kilowatt hours (kWh) in 2012 to 25.8 trillion kWh in 2020 and 36.5 trillion kWh in 2040 [
21]. Greenhouse gas emissions from the energy sector represent roughly two-thirds of all anthropogenic greenhouse-gas emissions and CO
2 emissions from the sector have risen over the past century to even higher levels [
22]. Due to ongoing concerns regarding climate change, new and clean energy generation capacity has to be built and renewable energy sources must be integrated into the current energy network [
23]. On the other hand, the economic view is an essential part of renewable energy deployment and its progress, as the uncertain and variable characteristics of RES have an impact on risk assessment when making an investment [
24,
25]. Furthermore, with the increasing public consciousness about environmental issues, the process of designing renewable energy systems requires the alleviation of environmental problems as a prerequisite [
26]. A method that is usually used to identify the environmental impacts and to determine the environmental criteria for sustainability assessment is LCA [
27], a well-established environmental management tool [
28,
29], useful for sustainable decision making [
30,
31,
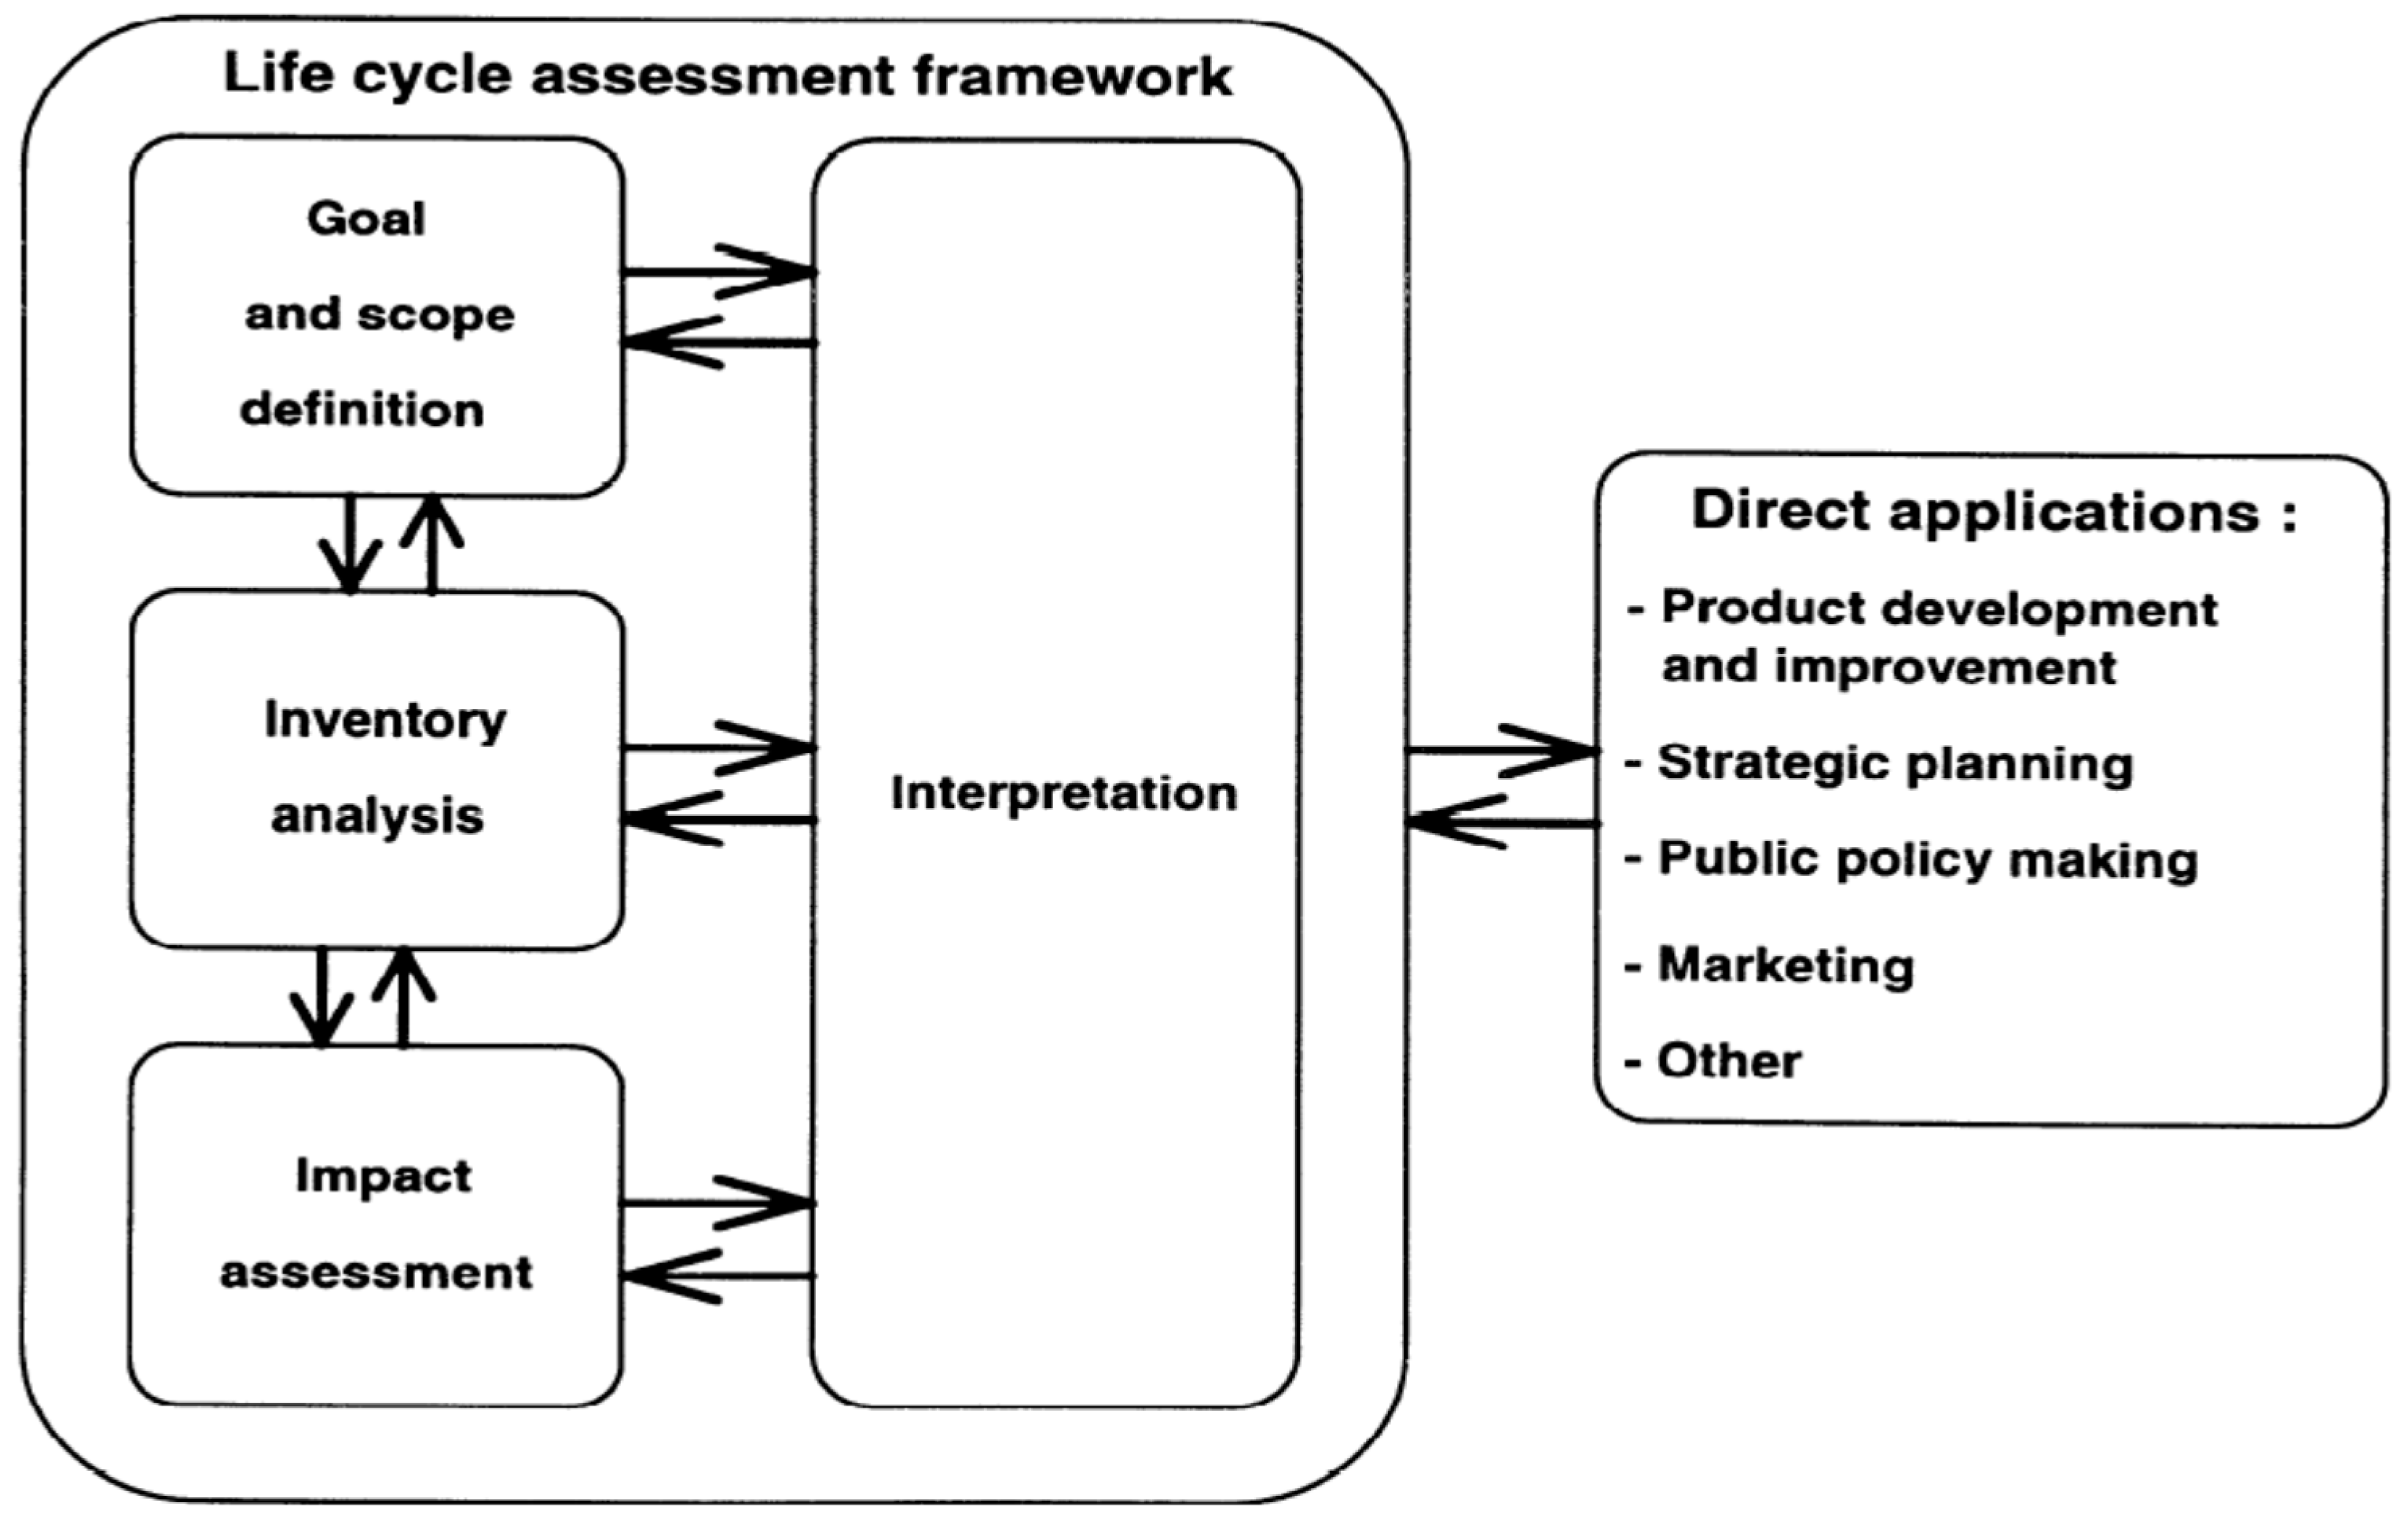
32]. The increasing interest of the general public in the environmental quality has led to the identification and qualification not only of the energy and the materials used for products and production processes but also of the wastes released to the environment, so as to evaluate and implement opportunities to affect environmental improvements [
33,
34,
35]. The LCA framework is illustrated in
Figure 2.
In general the LCA method can be applied to evaluate the impact of renewable energy electric power plants on the environment and will allow producers to make better decisions pertaining to environmental protection [
37,
38,
39]. Also, in literature there are studies that evaluate the environmental impacts regarding hydropower projects by using LCA [
40,
41,
42].
2.2. Power Output of a SHP
Basically, the relationship among power, water flow and the head water is stated below. The amount of power generated when
Q cumecs of water are allowed to fall through a head difference of
H metres is given by [
43,
44]:
where
P = Output (kW);
Q = Flow rate (cubic metres per second);
H = Water Head, (metres); η = Comprehensive Efficiency of Turbine-Generator Unit.
The annual energy generation of a hydropower plant is obtained from [
45]:
where
E = Energy generation (kWh/year);
P = Installed capacity (kW);
t = Operating hours in a year.
2.3. Basic Components of a SHP
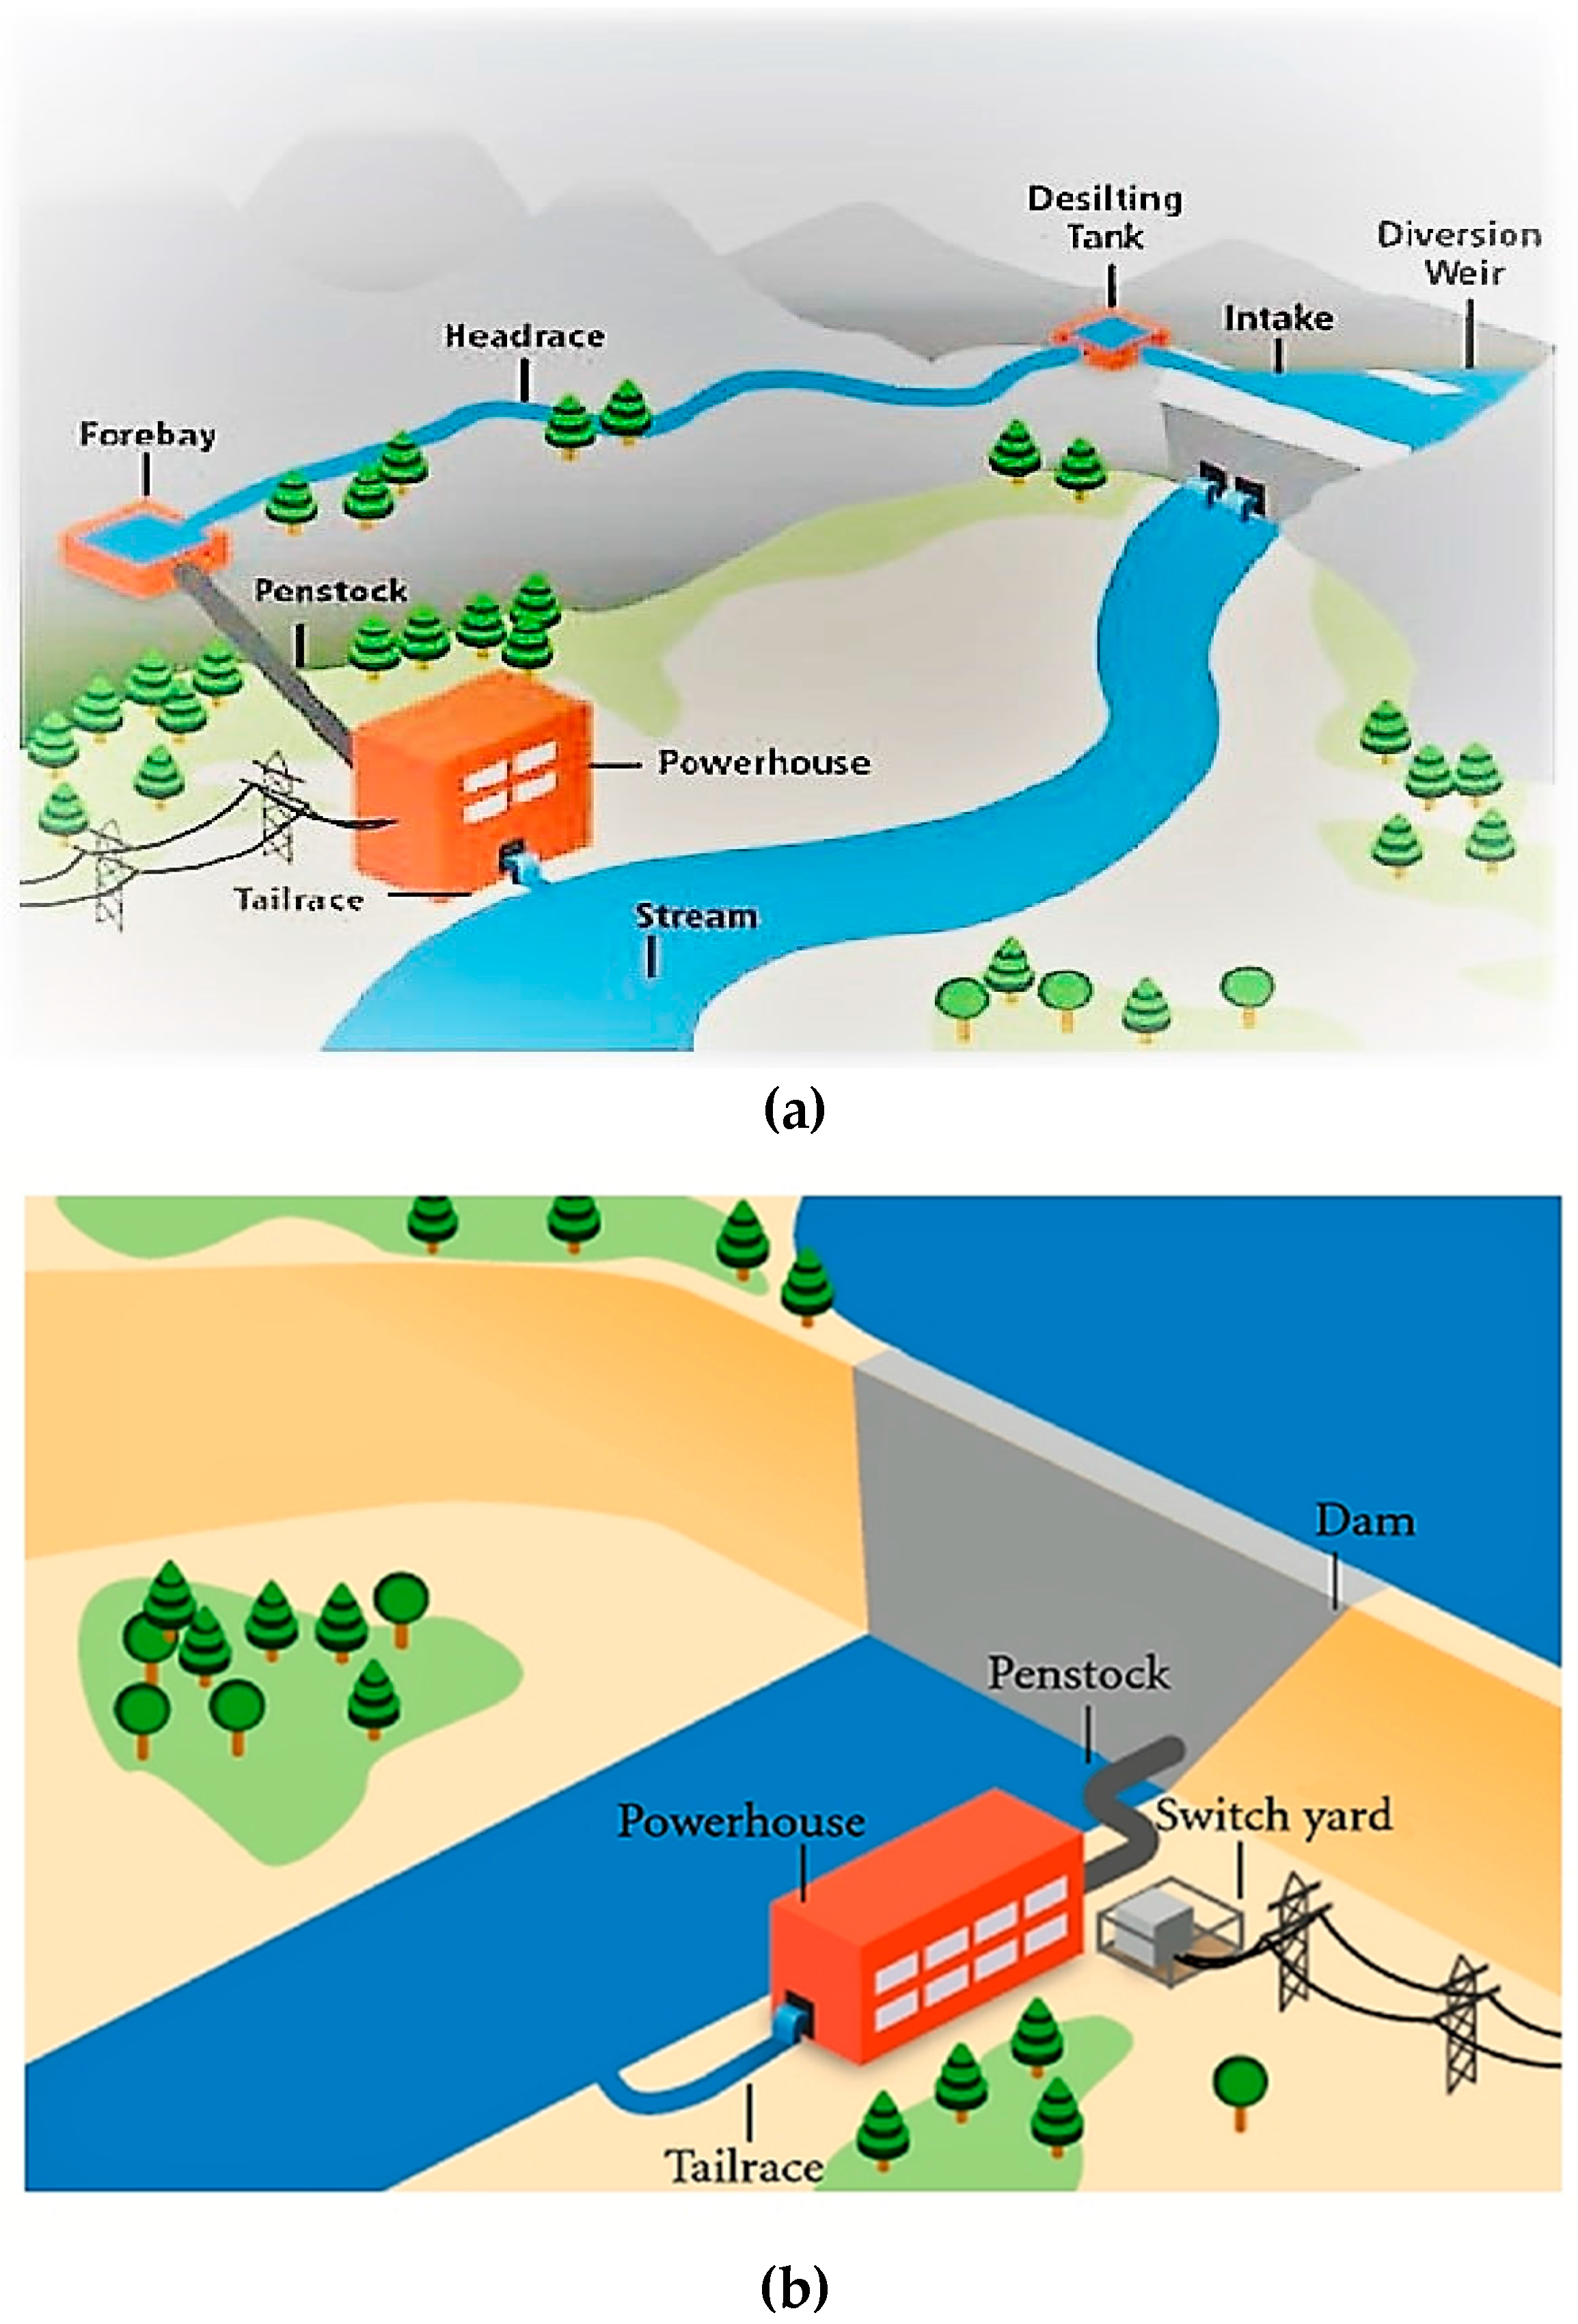
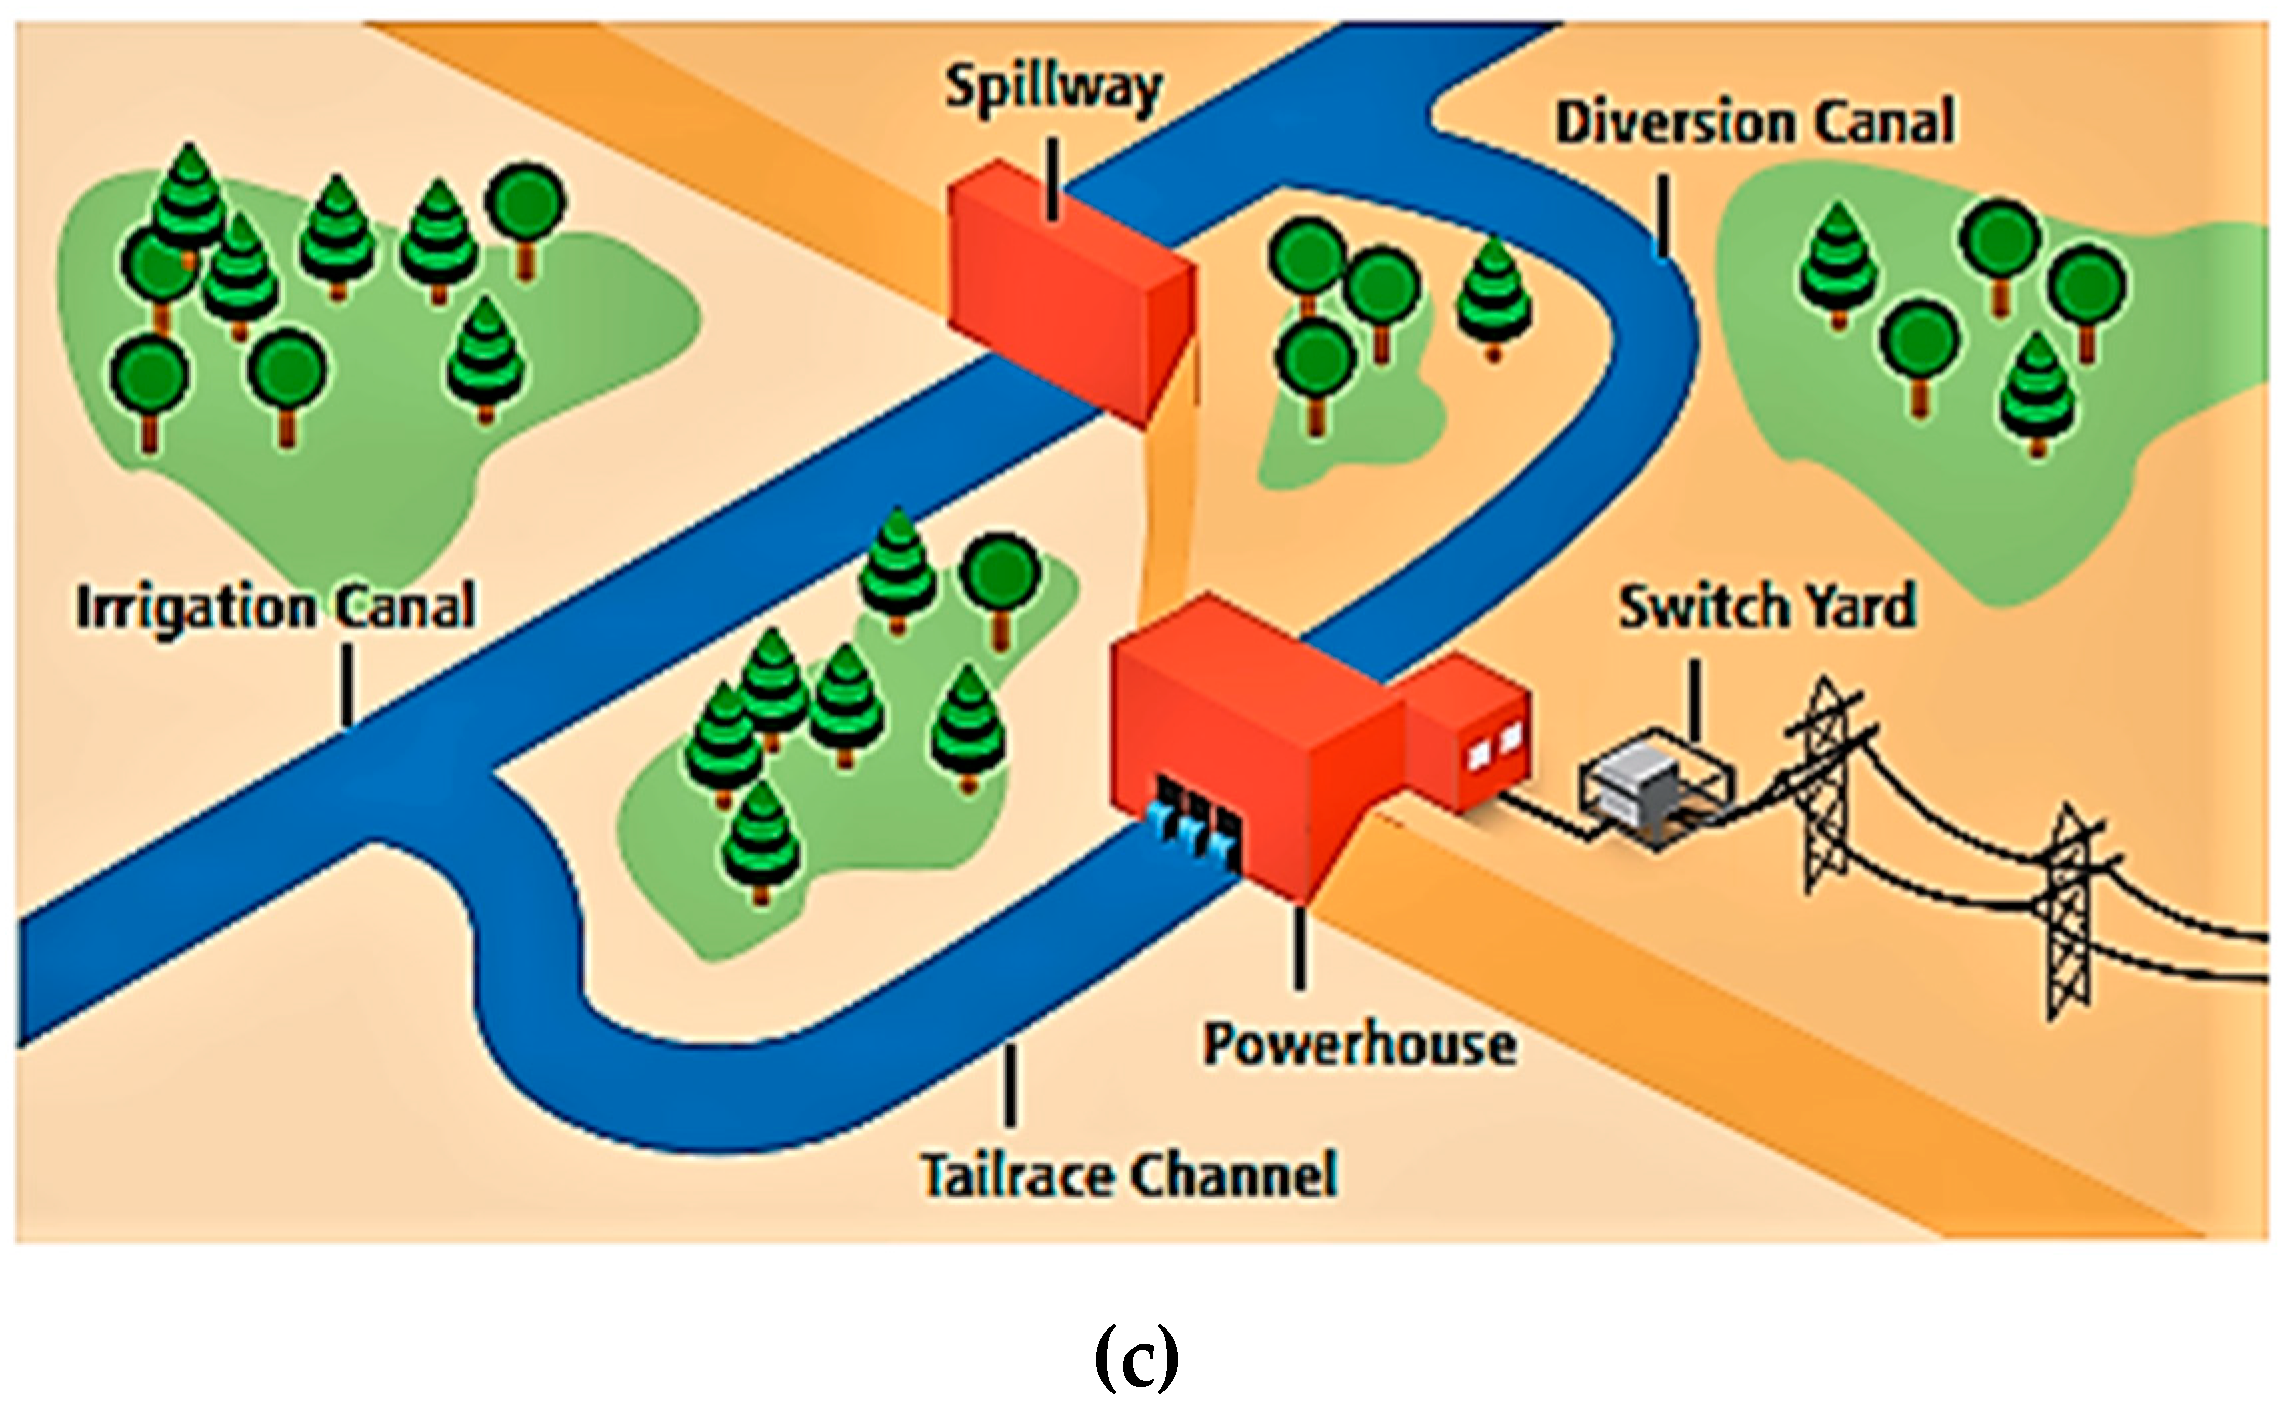
SHPs can be classified as: (i) run-of-river (RoR) schemes; (ii) schemes with the powerhouse located at the base of a dam or (iii) schemes integrated on a canal or in a water supply pipe (
Figure 3) [
46]. In run-of-river type schemes (where no or a very small storage reservoir is needed), part of the water flow is taken from the stream/river by diverting it through an intake weir. The water passes through a desilting tank before descending to the turbine. In medium or high-head installations, water is carried to the forebay by a canal. In low-head installations, generally, water enters the turbine directly from the weir. A pressure pipe, known as a penstock, conveys the water from the forebay to the turbine. All installations need to have a valve or gate at the top of the penstock to control the flow [
47]. As in the utilization of other renewable energy sources, RoR plants also have an effect on the natural environment [
48].
The basic components of the run-of-river small hydropower project can be broadly classified as: (i) civil works (diversion weir and intake, desilting chamber, power channel including head race channel, forebay and spillway, penstock, powerhouse building, tail race channel) and (ii) electromechanical equipment (turbines with governing systems and generators with excitation systems, switch gears, control and protection equipment) [
50].
When developing a SHP project the premier requirements to consider are its technical specifications and the financial viability [
51]. Apart from the economic criteria the decision is made by factors including the environmental, cultural and physical characteristics of the site as well as the availability of technological and engineering solutions [
52]. The environmental impacts of a SHP are dependent on the hydropower plant purpose and the location on the river section, with the most important factor of environmental impacts to be the works of civil engineering [
37,
53]. In addition, the cost which could directly influence the project feasibility, must be considered in order to mitigate the environmental impact. Apart from the physical sizes of civil works, the cost of the electro-mechanical equipment implies a high percentage of a small hydropower plant budget [
54]. Concerning the electro-mechanical equipment the choice of the right turbine is essential as the potential energy of water is converted into mechanical energy in the turbine. Depending on the site characteristics, different turbine types with different operating range and performance characteristics are available (
Table 1) and can be divided into impulse (Pelton, Turgo, cross-flow) and reaction turbines (Francis, Kaplan and propeller). The final choice between one and more units or between one type of turbine and another will be the result of an iterative calculation taking into account the investment costs and the yearly production [
55,
56]. When selecting the suitable turbine (taking into account the characteristic of the place) the flow and the head variation acceptance of various types of turbines are of great importance.
2.4. Operating SHPs in Greece
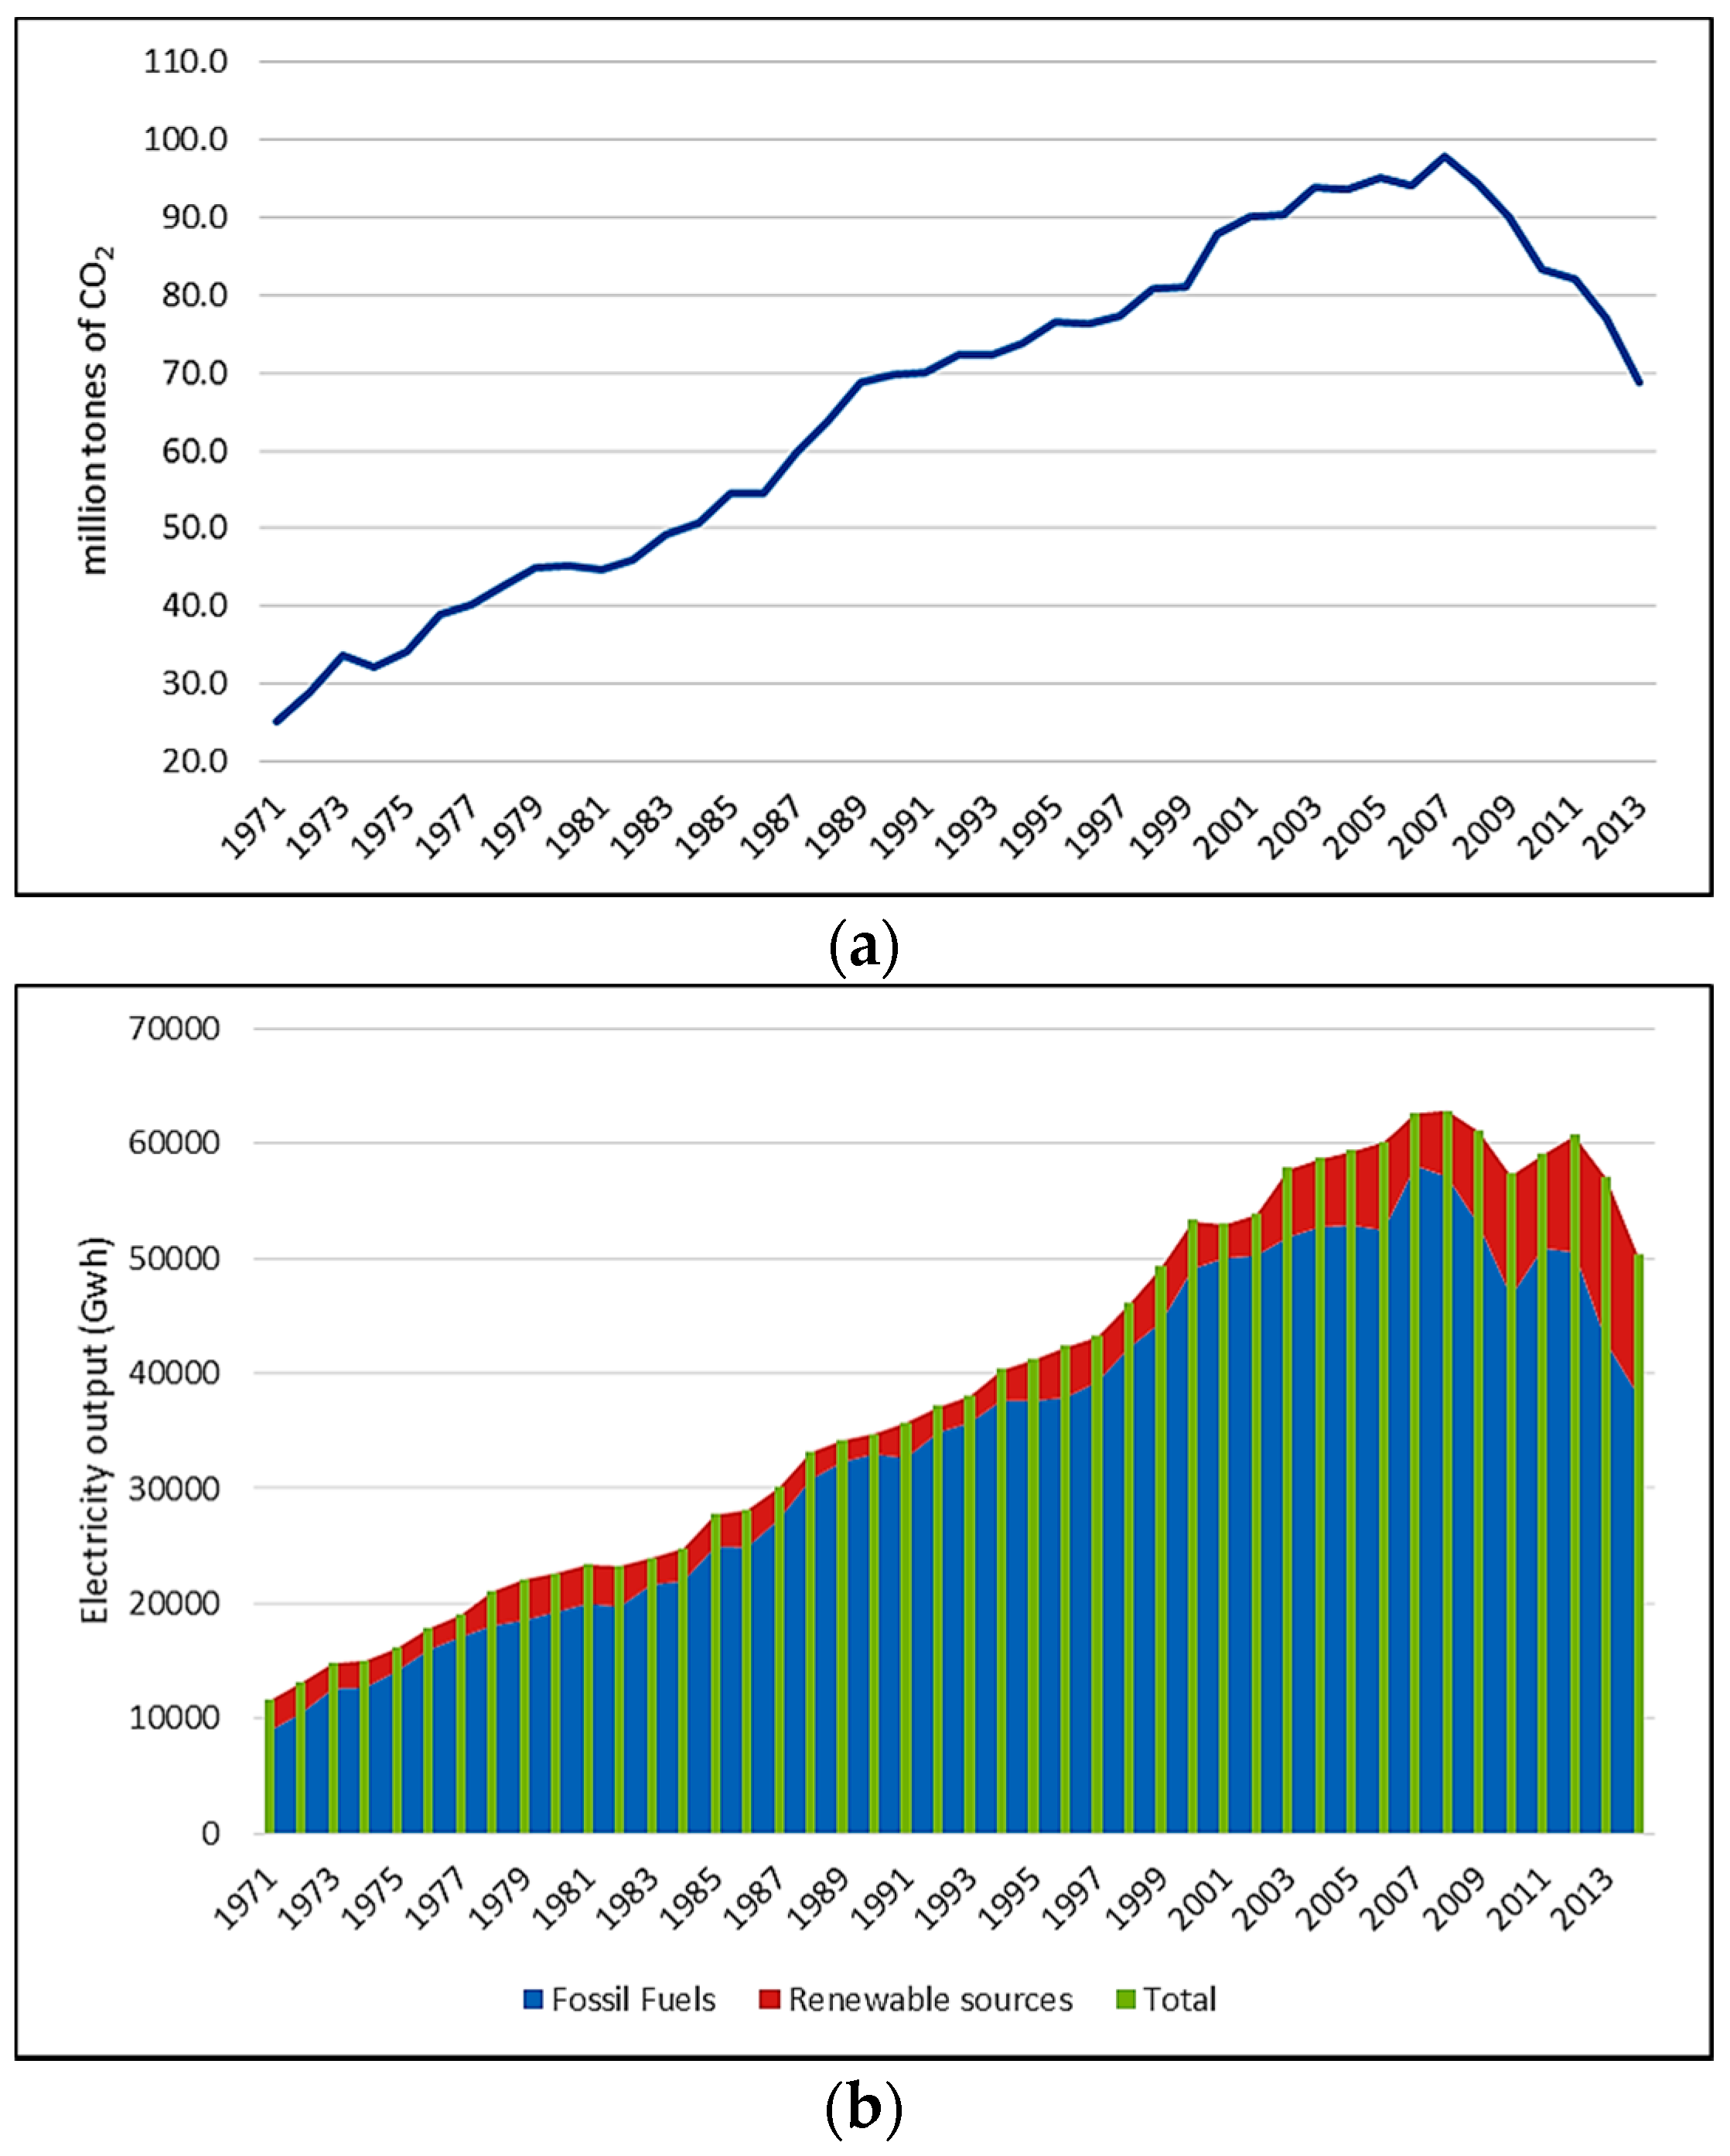
In Greece there has been a reduction in CO
2 emissions from fuel combustion (68.9 Mt CO
2, −1% when compared to the 1990 emissions), reflecting mainly the decline in economic activity. Moreover, 25% of electricity in 2013 was produced from renewable sources (
Figure 4) [
57]. However, the energy dependency, which shows the extent to which an economy relies upon imports in order to meet its energy needs, is very high [
58]. Therefore, it is necessary to exploit domestic energy sources, especially renewable energy sources, as their potential is high [
59]. Small hydropower plants are of particular interest to Greece as the potential of small hydropower capacity according to UNIDO and ICSHP [
60] is 2000 MW.
Although till today there is no general agreement on the definition of a small hydropower plant (SHP), a project that generates 10 MW or less is generally becoming the most widely accepted one [
61,
62,
63]. The first World Small Hydropower Development Report 2013 [
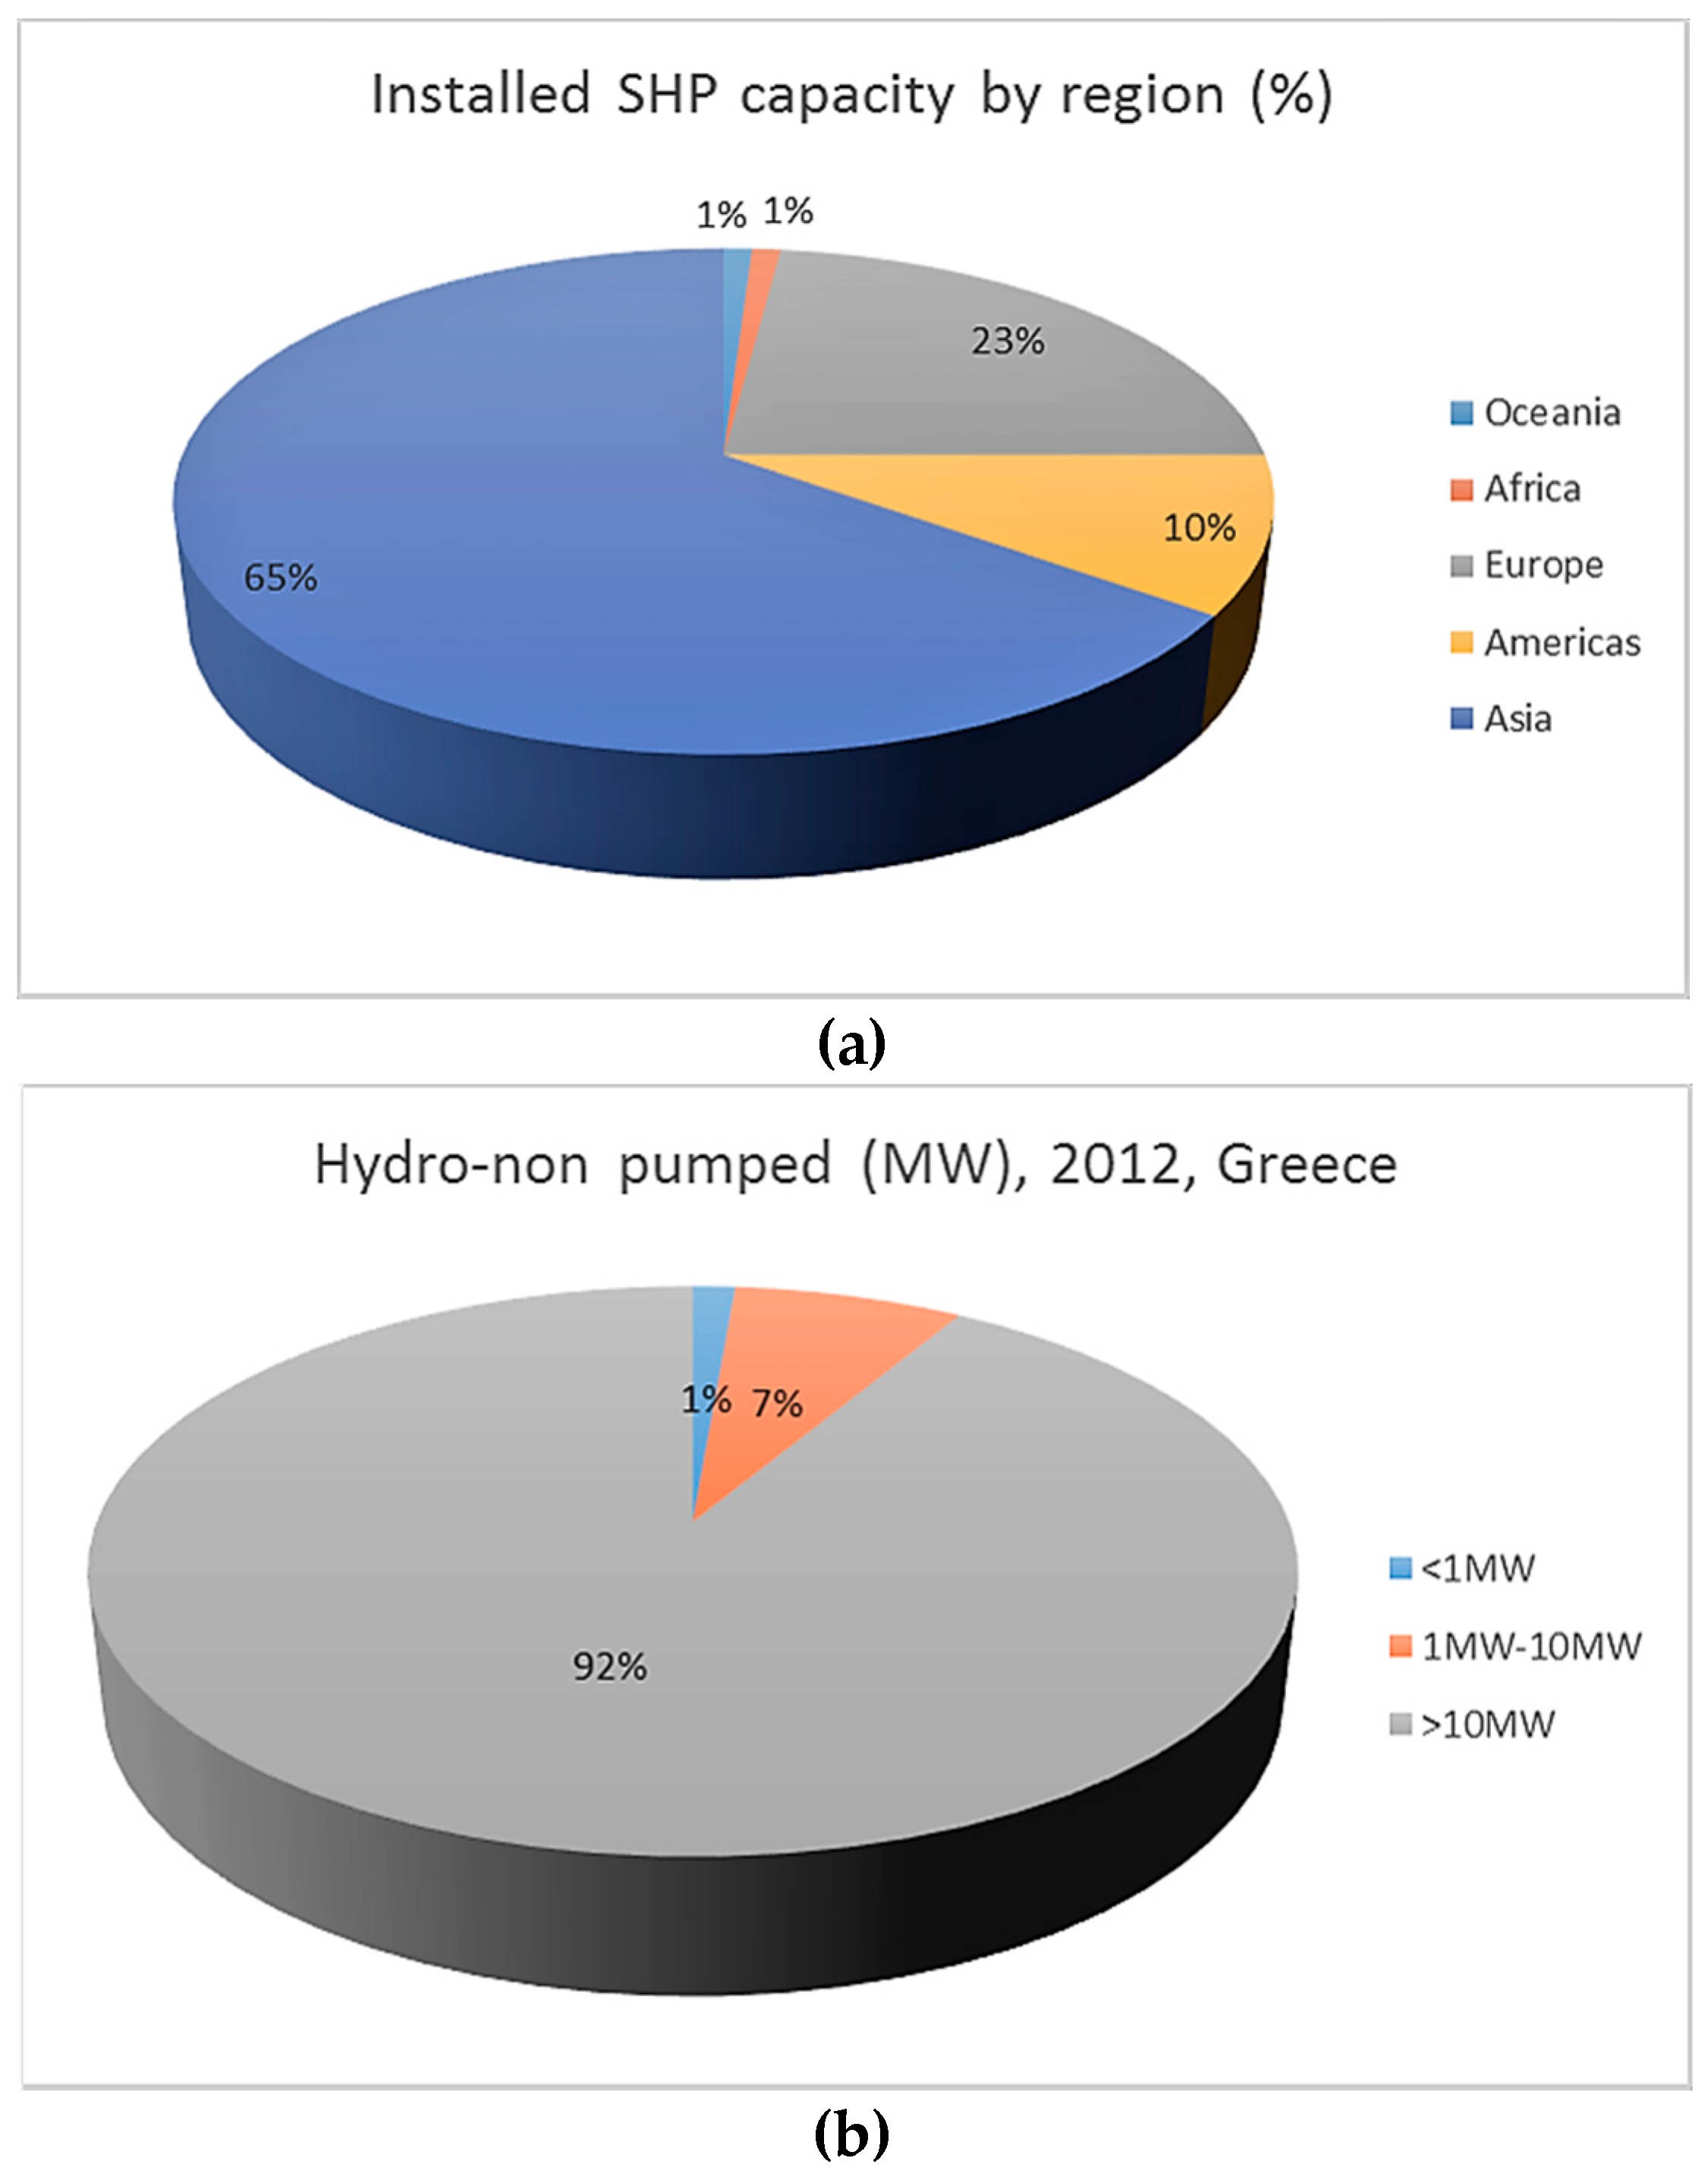
64], points out that small hydropower plants with a capacity of 10 MW, exist in 148 countries (
Figure 5) or territories worldwide, that the hydropower potential globally is approximated at almost 173 GW, and that the installed small hydropower capacity (up to 10 MW) was estimated to be 75 GW in 2011/2012. In 2010, Greece had 98 small hydropower plants and a total installed capacity of 196 MW, producing 753 GWh of electricity. By 2020, the aim is to have 175 plants with a total installed capacity of 350 MW (1148 GWh) [
64].
SHP installations are a financially attractive and an environmentally friendly solution contributing remarkably to the solution of the energy demand problem in Greece. A properly designed SHP should provide considerable profits replacing heavily polluting lignite and imported oil. In Greece, the support scheme for small hydro plants till 31 December 2015 was that of Feed-In-Tariffs (FIT) which was set at 87.85 €/MWh. As of 1 January 2016 the support scheme has been based on a mechanism of Operating Aid on the basis of a Differential Compensation Price (Sliding Premium). The Reference Value (RV), on the basis of which the Operating Aid will be calculated monthly in the form of Sliding Premium is 100 €/MWh for water power exploited in micro hydroelectric power plants with an installed capacity of ≤3 MWe and 97 €/MWh when the installed capacity ranges from 3 to 15 MWe [
65].
It is worth mentioning that energy services, including renewables, must be examined in the light of assessing the impacts on the environment and human health associated with the energy production. LCA is a tool that can be used in order to estimate potential environmental burdens [
66,
67]. When planning to operate a SHP, basic issues must considered so as to develop a sustainable power plant. It is generally agreed that SHPs are environment friendly constructions with limited environmental impacts and small effects on water bodies. There are also benefits related to reduced safety risks associated with small dams, and lesser population displacement or land use issues [
68]. Unlike traditional large-scale hydropower, small-scale and micro-hydropower systems rarely require dams, reducing technology’s environmental impacts [
69]. Perhaps the most important site-specific parameters of any particular site are
P,
H, and
Q, or estimates of potential power available, head, and flow [
70]. The best sites have a reliable water supply year-round and a large vertical drop in a short distance [
71].
3. Methodology
3.1. A Case Study of a SHP in the Region of Evrytania, Greece
The project is scheduled to be constructed at the Trikerioti River, in the regional unit of Evrytania-Greece. In the study area the natural environment consists mainly of agricultural areas. There is no air pollution because movements by means of transport are limited. There is no cultural or historic environment in this region. Adequate head and flow are necessary requirements for hydro generation, consequently site selection is conditioned by the existence of both requirements [
72]. The type of the plant is a ROR SHP with installed capacity 3 MW and project life 50 years. The hydroelectric station is a two-storey building constructed mainly of concrete. Its total size is about 160 m
2. The substation will be built at a distance from the main station with dimensions 6 × 6. The capacity of hydropower generation is expected ≈15 GWh annually.
Table 2 presents the dimensions and the main characteristics of the SHP in study [
73].
The SHP in the study consists of the following basic parts: (i) a barrier that stops the flow of the river leaving a small passage for the fish; (ii) a channel constructed so as to regulate the water supply that enters the installation; (iii) input gates regulating how much of the water bypasses and flows into the system; (iv) a short water pipe leading the water to the turbine and the generator; (v) a water turbine connected to a generator; (vi) an escape channel through which the water returns to the river.
The main parts of the work of a civil engineer are to: (i) create a river diversion project to build upstream and downstream barriers against overflowing; (ii) construct the body of the dam that will have fish passages stepped to the seamless movement in both directions; (iii) build a power plant project for housing the units and control panels; (iv) build a project substation configuration with the appropriate space next to the installation of the power plant to install the M/S lift and a connection to the local grid; (v) construct an access road to the dam and the power station.
3.2. Modelling the LCA of the Small Hydro Plant
3.2.1. Goal and Scope Definition and Functional Unit
SHP plants do not evidently produce greenhouse gas emissions during routine operation, so the energy generation from SHP is considered a clean way to generate electricity. Therefore, the environmental impacts associated with these plants have not been thoroughly explored [
74] However, like other renewable energy technologies, SHP requires a substantial initial investment of construction materials, transportation fuels, and electric generation equipment, as well as maintenance costs, which are indirectly related to fossil energy consumption and environmental pollution [
37].
The goal and scope definition is a guide that helps to ensure the consistency of the LCA study. The goal of an LCA entails the deliberate application, the reasons for the study and the audience which we actually address. Concerning this study, the goal is to assess the environmental impacts of the SHP using a Screening LCA. A Screening LCA is a simplified LCA method aimed at the identification of environmental hotspots or processes where emissions of particular interest occur in the life cycle of a product or process [
75]. It must be mentioned that for a more comprehensive assessment of the environmental impacts of the SHP in consideration, a complete LCA study is necessary. The environmental impact was assessed based on a function unit defined as 1 kg of components (concrete, aggregates and steel) used for the construction of the plant and for the major machinery and equipment. In order to take into account the whole geographical area, the study was expanded to include the transportation of the recycled materials back to the plant. The results of the input-output of each stage were analyzed and the environmental impact assessment was created by using the principle of conservation of mass. Particular attention was also given to the consumption of energy resources [
73].
3.2.2. System Description and Boundary
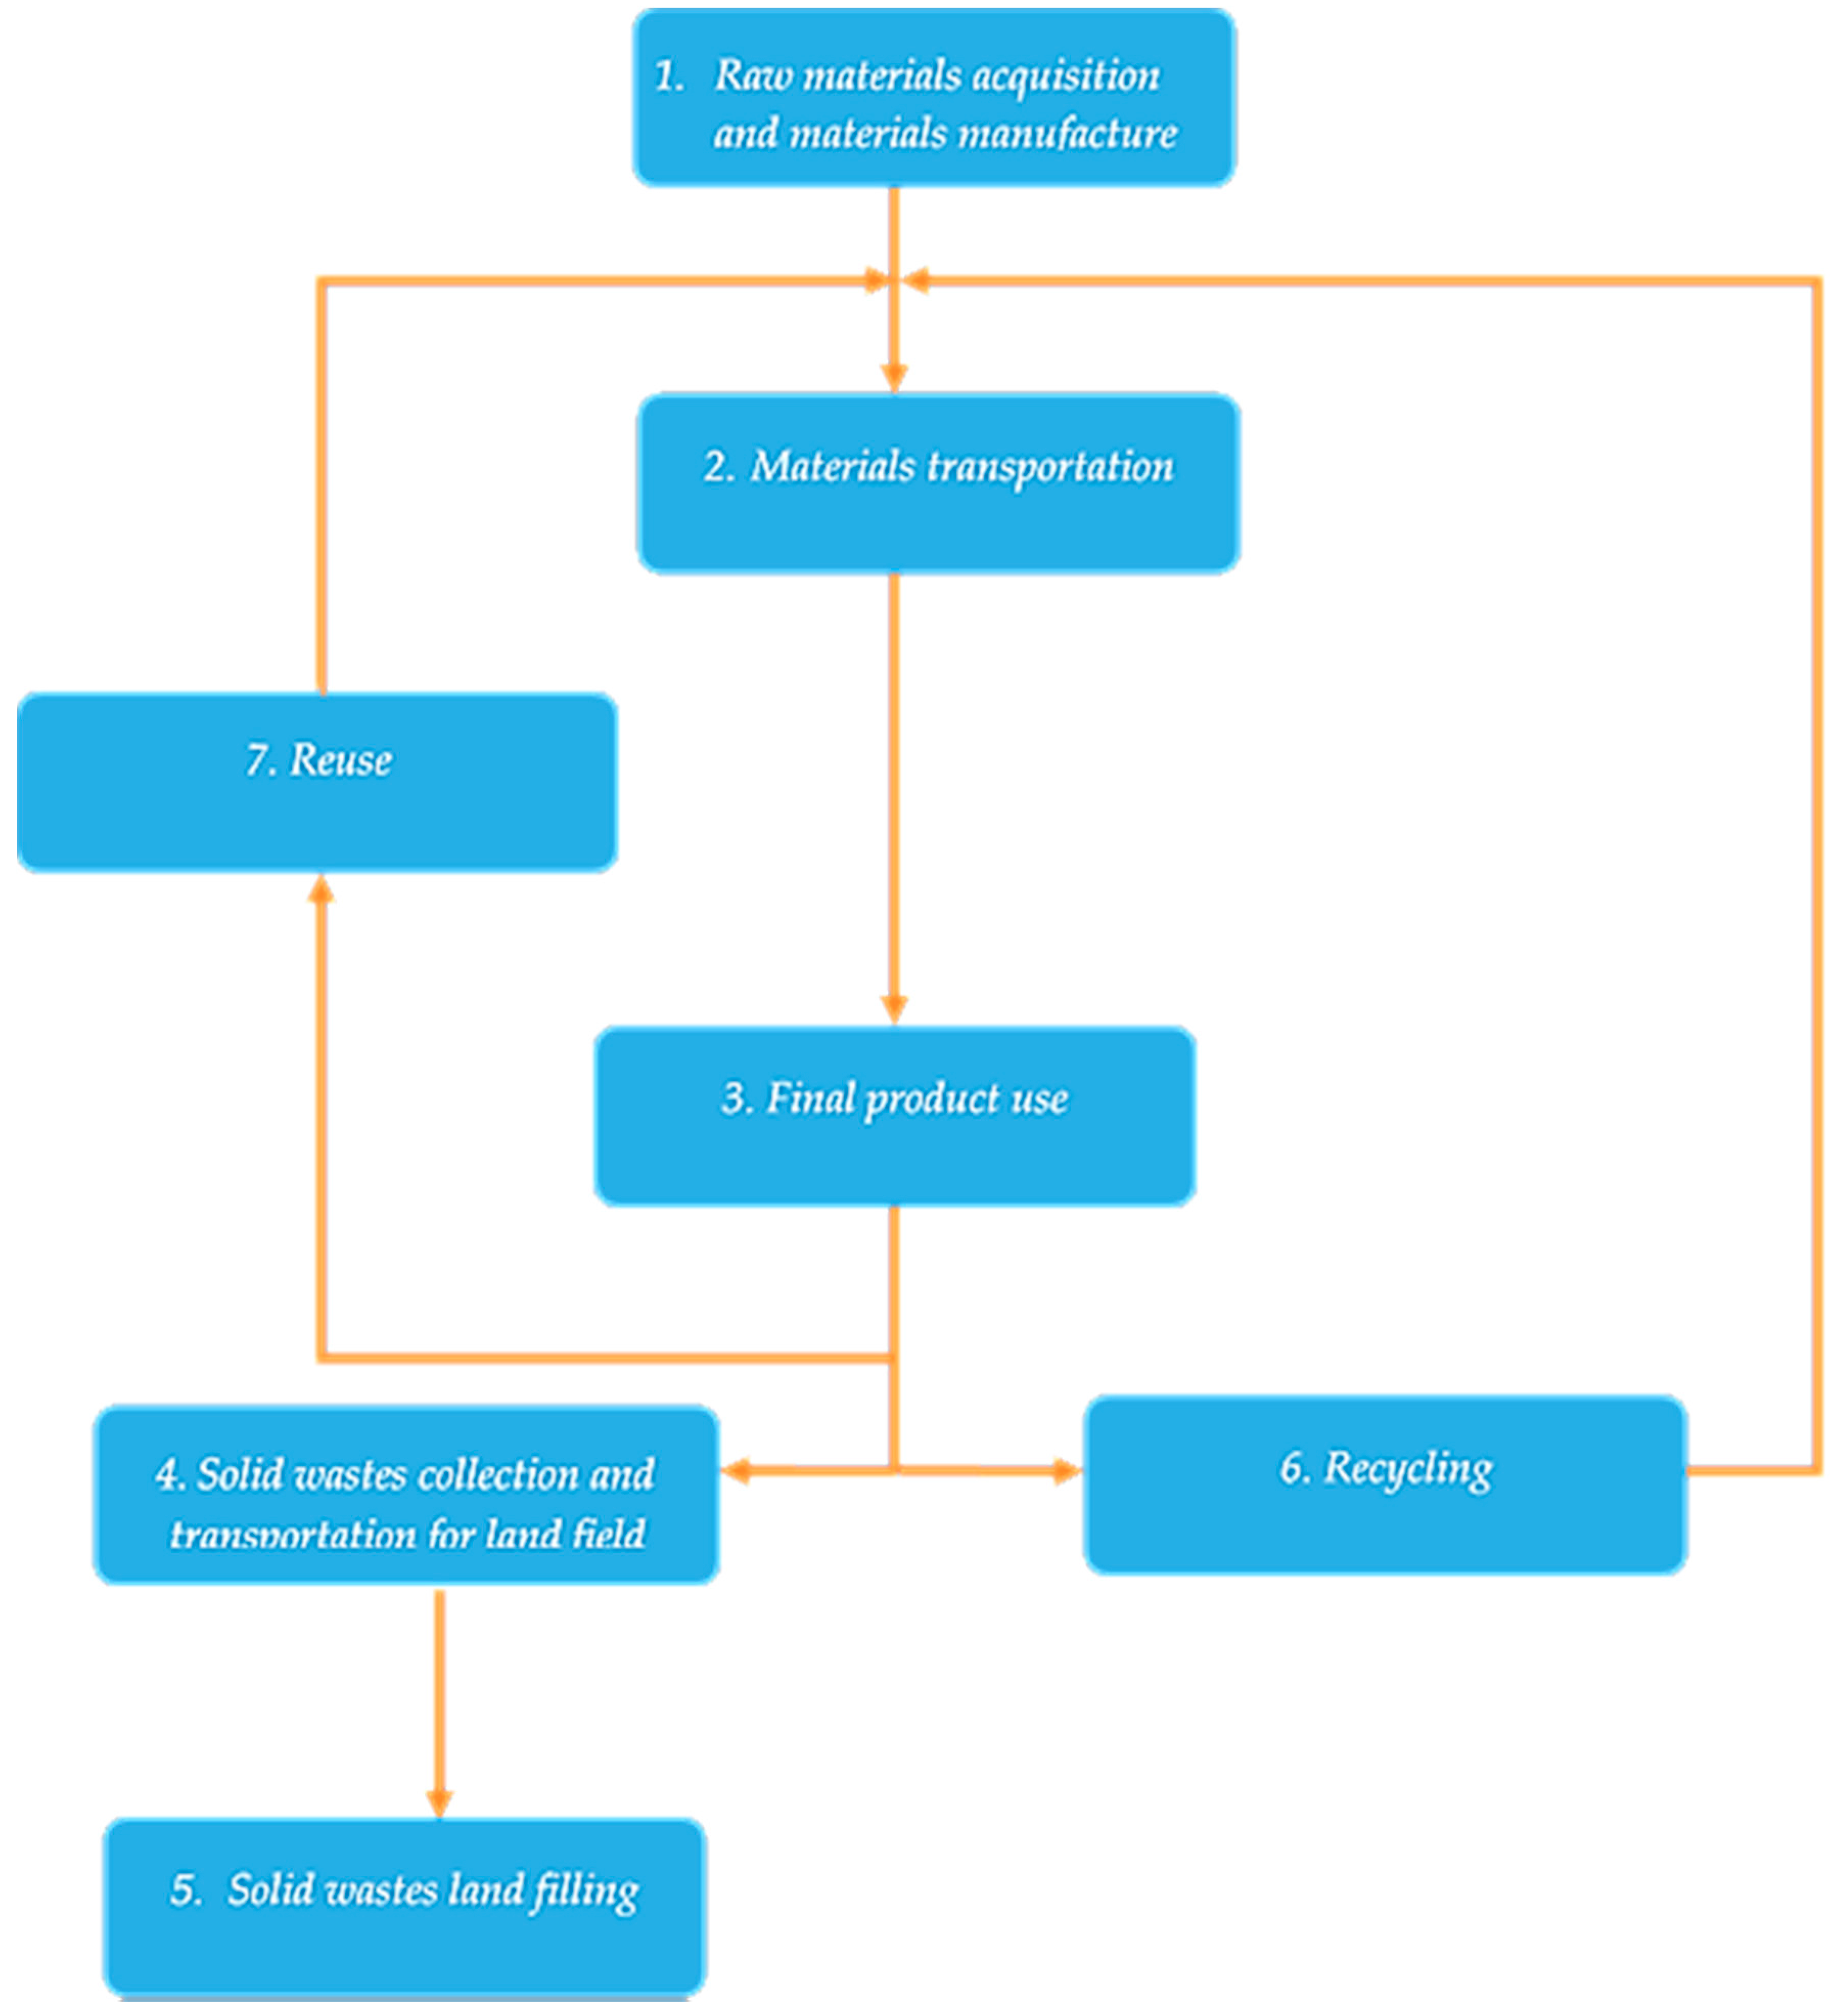
The life cycle system of the present case study consists of seven subsystems. The stages that comprise the LCI system, are: (1) raw materials acquisition and material manufacture; (2) material transportation; (3) final product use; (4) solid waste collection and transportation for to the landfill; (5) solid waste landfilling; (6) recycling; (7) reuse. These are presented in
Figure 6.
The next step is the construction of the mathematical model. This model is necessary for calculating the total energy and resource use as well as the total environmental releases from the overall system. This step consists of summing the energy, raw materials and various emission values that result from the energy and material flows, for each stage of the product's life cycle. The model, which defines numerically the relationships of the individual subsystems to each other during the production of the final product, has been developed and analyzed in detail in a previous study [
76].
The data inventory compiled for this LCA study consists of data taken from Biska and Oikonomou [
77] and Chen et al. [
78] as far as concrete is concerned. As for aggregates and steel, data has been taken from WRAP [
35] and from World Steel Association [
79] as well as ELCD [
80] respectively. Regarding landfills, data has been taken from the Swiss Centre for Life Cycle Inventories [
81] and as for transportation, it has been taken from OECD [
82]. Following the Life Cycle Inventory (LCI) is the construction of the mathematical model. This model is necessary for calculating the total energy and resource use as well as the total environmental releases from the overall system. The mathematical model of this analysis takes into account the degree of re-use and/or recycling so that the mass flow at all stages of the lifecycle from extraction until final use could be calculated. The parameters relating to these degrees are identified as:
The specific parameters for the three materials are (i) concrete: f = 0%, a = 23% and k = 5%; (ii) steel: f = 0%, a = 100% and k = 100%; (iii) aggregates: f = 5%, a = 30% and k = 5%.
3.3. Feasibility Appraisal of the Small Hydro-Power Plant
The costs of the project are divided into two categories: investment and annual costs. Investment costs of a small hydroelectric plant include [
83]:
Civil engineering Cost (for the SHP under consideration: study, excavations before dams, pipeline drain, excavations and concrete for dam-water inlet-desilter-fish entrance, station building production (excavations, concrete, mansory, architectural), substation (excavations concrete architectural, formation of the external environment),
Electromechanical equipment Costs (in the SHP under consideration: 2 pc. KAPLAN S-turbine electronic-hydraulic turbines, governor elastic coupling gearbox 428/750 rpm synchronous—generator 750 rpm 1 pc electrical equipment, transport, erection and taking-into-operation, and)
Cost of network connectivity, which is determined by the administrator of electricity
For assessing the total investment cost, it is necessary to take into account costs as the purchase of land, paperwork and other miscellaneous costs. Moreover, one could consider that the environmental cost in monetary valuations reflects the magnitude the value of environmental effects. It must be mentioned that monetary valuations can help decision makers but they cannot provide easy answers to difficult decisions.
4. Results and Discussion
The mathematical model which estimates the energy and emissions of the overall system for concrete, steel and aggregates is constructed by using the energy and mass balances at the seven subsystems, by taking into account the degrees of re-use and/or recycling for the three materials, and additionally by getting the assignment of the individual subsystems according to
Figure 5.
Upon completion of the analysis, some of the results that have been derived using the mathematical model and the collected data, are presented by each life cycle stage in
Table 3,
Table 4 and
Table 5. More precisely, the energy consumption, the atmospheric emissions of carbon dioxide (CO
2), sulfur dioxide (SO
2), phosphate, ethene (ethylene), non-methane volatile organic compounds (NMVOC), nitrogen oxides (NO
x) and ppm are analyzed in these Tables. Relevant life cycle inventory data comes from sources like reports, country specific databases, papers, articles journals etc. [
35,
77,
78,
79,
80,
81,
82].
Using the main equations for the tree materials, the LCA results are given in the following tables (
Table 3,
Table 4 and
Table 5). More specifically, in these tables are presented the energy and atmospheric emissions at every life cycle stage, whereas the estimations of the energy and emissions of the overall system using the mathematical model are given in the row identified as Total. These total individual estimations, will be used subsequently for the estimation of the life cycle air pollutants emission factors of the investigated system.
According to the results of this analysis, it is easy to rank the relative contribution of each life cycle stage to the total environmental impacts and subsequently to evaluate opportunities to reduce them. It must be pointed out that for a deeper analysis, an application of a life cycle impact assessment methodology is required. However, even without the application of an impact assessment procedure, the benefit is that the result of the inventory phase is very detailed and it is not affected by the uncertainties introduced in impact assessment. Moreover, in spite of the drawbacks of the methodology (mainly data gaps, differences in the way data was collected, confidentiality of data and absence of national databases, defining system boundaries, difficulties in assessment and interpretation of results, and the cost of the technique), LCA can be included in a decision-making process concerning either environmental management schemes or the feasibility of a project considering the environmental cost.
The approach of external costs will be used in order to estimate the environmental impact in terms of economic value. Estimates of future economic damages resulting from atmospheric pollution have an important impact on policy decisions being made today. Reducing airborne emissions and protecting ourselves from those impacts will be costly, but a failure to address these impacts would be even more expensive and would affect the quality of life (QLF) as environmental aspects are vital for improving human life quality [
84,
85]. The quantification of external costs is based on the ‘impact pathway’ methodology which has been developed in the series of ExternE projects, and has been further improved within NEEDS (a project using ExternE methodology) and other related projects. The impacts covered by the methods used for external cost assessment within NEEDS are Human Health, Loss of Biodiversity, Crop Yield and Material Damage [
86,
87,
88,
89]
Table 6 shows the aggregated data for Life cycle air pollutants emission factors of SHP in study, concerning the three main construction materials. As for the unit damage costs used for quantifying externalities from airborne pollutants and GHG, they are summarised in
Table 7.
Table 8 presents external cost estimates for typical average configurations, and it must be mentioned that it is not a detailed external cost representation.
The environmental cost is estimated at ≈164,000 €. This cost is derived when data from
Table 6 and
Table 7 is combined. Subsequently, the environmental cost must added to the investment cost, if one wants to take more sustainable decisions.
The investment cost consists of costs related to preparatory productive costs, handling paperwork, equipment manufacturers, service equipment and civil works. The estimated total cost is broken down as follows (
Table 9). At first, is broken down the estimated investment cost and then the estimated total cost is broken down when the environmental cost is included. In this way, it is clearly displayed in what percentage the environmental cost constitutes the total cost. The investment cost for the construction of the hydro power plant is estimated at 3,715,800 € and the total cost taking into account the environmental cost is estimated at 3,879,819 €
The estimation of total cost is only a parameter concerning the validity of the SHP. A further economic analysis is a presupposition when considering the costs and uncertainties of SHP. What is more, forecasts, for cash flow and revenue income, must be estimated as accurately as possible. The main criteria for financial evaluation of SHP projects are: performance period capital (payback period), net present value, internal rate of return, return on investment.
5. Conclusions
Nowadays there is a growing awareness of the need to take action against climate change. To this end, it is considered necessary to limit greenhouse gas emissions, especially from the power sector. Consequently we are forced to produce electricity using renewable energy sources which are less polluting, compared to the non-renewable ones. Hydropower is a way of producing electricity using moving water. Small-scale hydropower can be used for generating electricity in isolated or mountainous hinterland regions. The important factors for the development of a SHP scheme are the flow of water and the height of fall of water (head). Although SHPs do not evidently produce greenhouse gas emissions, they require resources which are indirectly related to fossil energy consumption and environmental pollution in order to be constructed and to operate. A method for assessing environmental impacts is LCA. The most important application of LCA is the analysis of the contribution of the substances to the overall environmental load, so as to prioritise improvements on products and processes.
As far as this study is concerned, it has to be noted that an application of an LCA method at a more detailed level, and not a screening one, is needed for a more comprehensive assessment of the environmental impacts in spite of the fact that even then there will be, to a certain extent, weak points, unavoidable in this kind of analyses. There are aspects of the Life Cycle approach that still need to be worked out. These arbitrary aspects involve problems, e.g., in defining functional units, in allocating environmental burdens, in multi-product processes, in using average marginal energy emissions data etc. Thus, decision makers, when performing LCAs, represent the problem situation on the basis of the purpose of the study. Furthermore, there are debates on evaluation and weighting methods. However, despite critiques and recommendations, it does not mean that this method cannot be improved by eliminating as many of these weaknesses that affect the results of an LCA as possible.
The paper considered the problem of assessing the environmental cost of a SHP by using the approach of external cost. The external cost was derived from the combination of Life Cycle Air pollutants emission factors for the three main construction components (concrete, steel, aggregates) as well as from the unit damage costs of air pollutants concerning Health, Biodiversity, Crop Yield, Material Damage and Climate Change. The external cost was estimated to play a non-negligible part in the total investment cost that can affect the feasibility of the scheme. Complete estimation of all GHG emissions and their potential impacts should be considered in a more detailed assessment of the overall environmental compatibility. Furthermore, regarding the reliability of the study findings, the application of the methodology for estimating external costs of a SHP, can be used as a tool for environmental and energy policies.
Although LCA is a tool in need of improvement, this could be the subject of further discussion and research. Also, more applications of the method on renewable energy sources will better demonstrate its benefits and drawbacks through additional practice.


