
Optimal Charging Schedule Planning and Economic Analysis for Electric Bus Charging Stations


Department of Electrical Engineering, Cheng Shiu University, Kaohsiung 83347, Taiwan
*
Author to whom correspondence should be addressed.
Energies 2017, 10(4), 483; https://doi.org/10.3390/en10040483
Submission received: 16 February 2017
/
Revised: 20 March 2017
/
Accepted: 30 March 2017
/
Published: 5 April 2017
(This article belongs to the Special Issue Advances in Electric Vehicles and Plug-in Hybrid Vehicles 2017)
Abstract
:The battery capacity of electric buses (EB) used for public transportation is greater than that of electric cars, and the charging power is also several times greater than that used in electric cars; this can result in high energy consumption and negatively impact power distribution networks. This paper proposes a framework to determine the optimal contracted power capacity and charging schedule of an EB charging station in such a way that energy costs can be reduced. A mathematical model of controlled charging, which includes the capacity and energy charges of the station, was developed to minimize costs. The constraints of the model include the charging characteristics of an EB and the operational guidelines of the bus company. A practical EB charging station was used to verify the proposed model. The financial viability of this EB charging station is also studied in this paper. The economic analysis model for this charging station considers investment and operational costs, and the operational revenue. Sensitivity analyses with respect to some key parameters are also performed in this paper. Based on actual operational routes and EB charging schemes, test results indicate that the EB charging station investment is feasible, and the planning model proposed can be used to determine optimal station power capacity and minimize energy costs.
1. Introduction
While electricity from power plants is a tightly regulated source, electric vehicles (EVs) could bring more transportation-related emissions under stricter regulation. With emission caps in place for key pollutants, displacement of gasoline or diesel in favor of electricity will reduce overall emissions. Regional public transportation offers a good opportunity for the introduction of battery-powered vehicles. In order to reduce greenhouse gas emissions and improve air quality, 10,000 electric buses (EBs) are planned to be in operation in the next decade in Taiwan.
EBs are characterized by fixed running routes, fixed charging sites, near-identical charging capacity and a carbon-reducing means of transport worthy of extensive popularization. However, configuring an overall EB system is challenging; this would include possible battery recharge and exchange concepts, choice of battery technology, battery sizing, positioning and dimensioning of charging and exchange stations, and the respective bus line’s characteristics and topography [1].
The energy consumed in charging an EB is several times that of charging an electric car for private use. The electrical energy consumption and the impact on the power system are greater. Therefore, to accommodate transportation electrification, the energy costs of charging stations and their impact on the distribution network should be well planned. The impact on power grids of charging EVs, including the use of smart charging methods to reduce energy costs and guarantee system security and integration with renewable energy, is discussed in [2,3,4,5,6,7,8,9,10,11,12,13,14]. While these analytical techniques presented and reviewed [2,3,4,5,6,7,8,9,10,11,12,13,14] could be extended to include EB charging, there are presently only a few studies which discuss the planning of EB charging stations and their impact on the distribution network.
In [15], the authors present optimal planning of EV charging stations with the use of capacitors to maintain voltage and improve the amount of power loss in electrical distribution networks. Simultaneous optimal planning of charging stations and distributed generation is presented in [16] by the same authors. Investment costs, system reliability, power loss, voltage profile and CO2 emission issues are considered in an objective function. The financial viability of investing in EV charging stations located in the parking lots of commercial/industrial workplaces is proposed in [17]. Level II charging installations are examined and the internal rate of return and the net present value method are used to measure the investment’s profitability.
The authors of [18] focus on the design optimization of the plug-in hybrid electric vehicle (PHEV) charging station with battery storage units, and examine the charging trend of PHEVs. An optimized operation for the battery storage schedule and a strategy of power trading in order to minimize the costs of the charging stations were proposed. An algorithm for optimally managing a large number of PHEVs (e.g., 3000) charging at a municipal parking station was presented in [19]. A mathematical framework for maximizing the average state-of-charge at the next step was established in this paper. A decision model to implement direct load control on battery-charging processes at EV charging points located in parking areas is presented in [20]. The objective function maximizes the net energy supplied to batteries while simultaneously minimizing the global energy cost. The use of an EB charging station, and its impact on the power grid, was studied in [21]. In order to improve power load characteristics and increase power sales, a consumption pattern of routine night-time charging, coupled with day use to balance the peaks and valleys of power use, was considered. The possibility of using energy storage systems to balance peak power demands using fast charging stations, as well as using such storage to optimize renewable energy sources, was investigated in [22].
As an EB charging station will consume large amounts of energy, to achieve a high return on investment it must be properly planned according to the operating guidelines of the bus company. The electricity bill will include both basic charges and energy charge. This paper proposes a controlled charging method to minimize the energy costs of an EB charging station. This model uses the charging power at each time interval and the contracted capacity as state variables, and considers the constraints of the bus company’s operational policies and station-contracted capacity. This paper also examines the financial viability of investing in EB charging stations. An economic model considering subsidies from the government, investment costs, operational costs and revenues is proposed. An actual EB charging station is studied to demonstrate the effectiveness of the proposed method.
Due to the high charging power of EVs and EBs, system security concerning the integration of EVs and EBs is drawing a lot of attention. Therefore, most of the published papers focus on the impact analyses of them on the distribution network. They consider the objective functions concerning the operation at the system level, such as grid loss minimization [12], network security [7,11], and power market participation [23]. Few papers address the planning and operation of a charging station. To avoid EV charging during the peak hours, utilities can use a time-of-use pricing scheme to shift the charging time to the off-peak period. Therefore, it is necessary to present a planning model for the charging station to follow the time of use pricing scheme. Through the proposed model, the charging station not only can minimize the energy cost but also help the utilities mitigate the charging impacts on the distribution system.
The organization of the paper is as follows. A description of the studied EB charging station is provided in Section 2. Problem formulation and solution methods are described in Section 3. Section 4 introduces the economic analysis model for this charging station. Test results are offered in Section 5. Finally, concluding remarks are given.
2. Description of the EB Charging Station
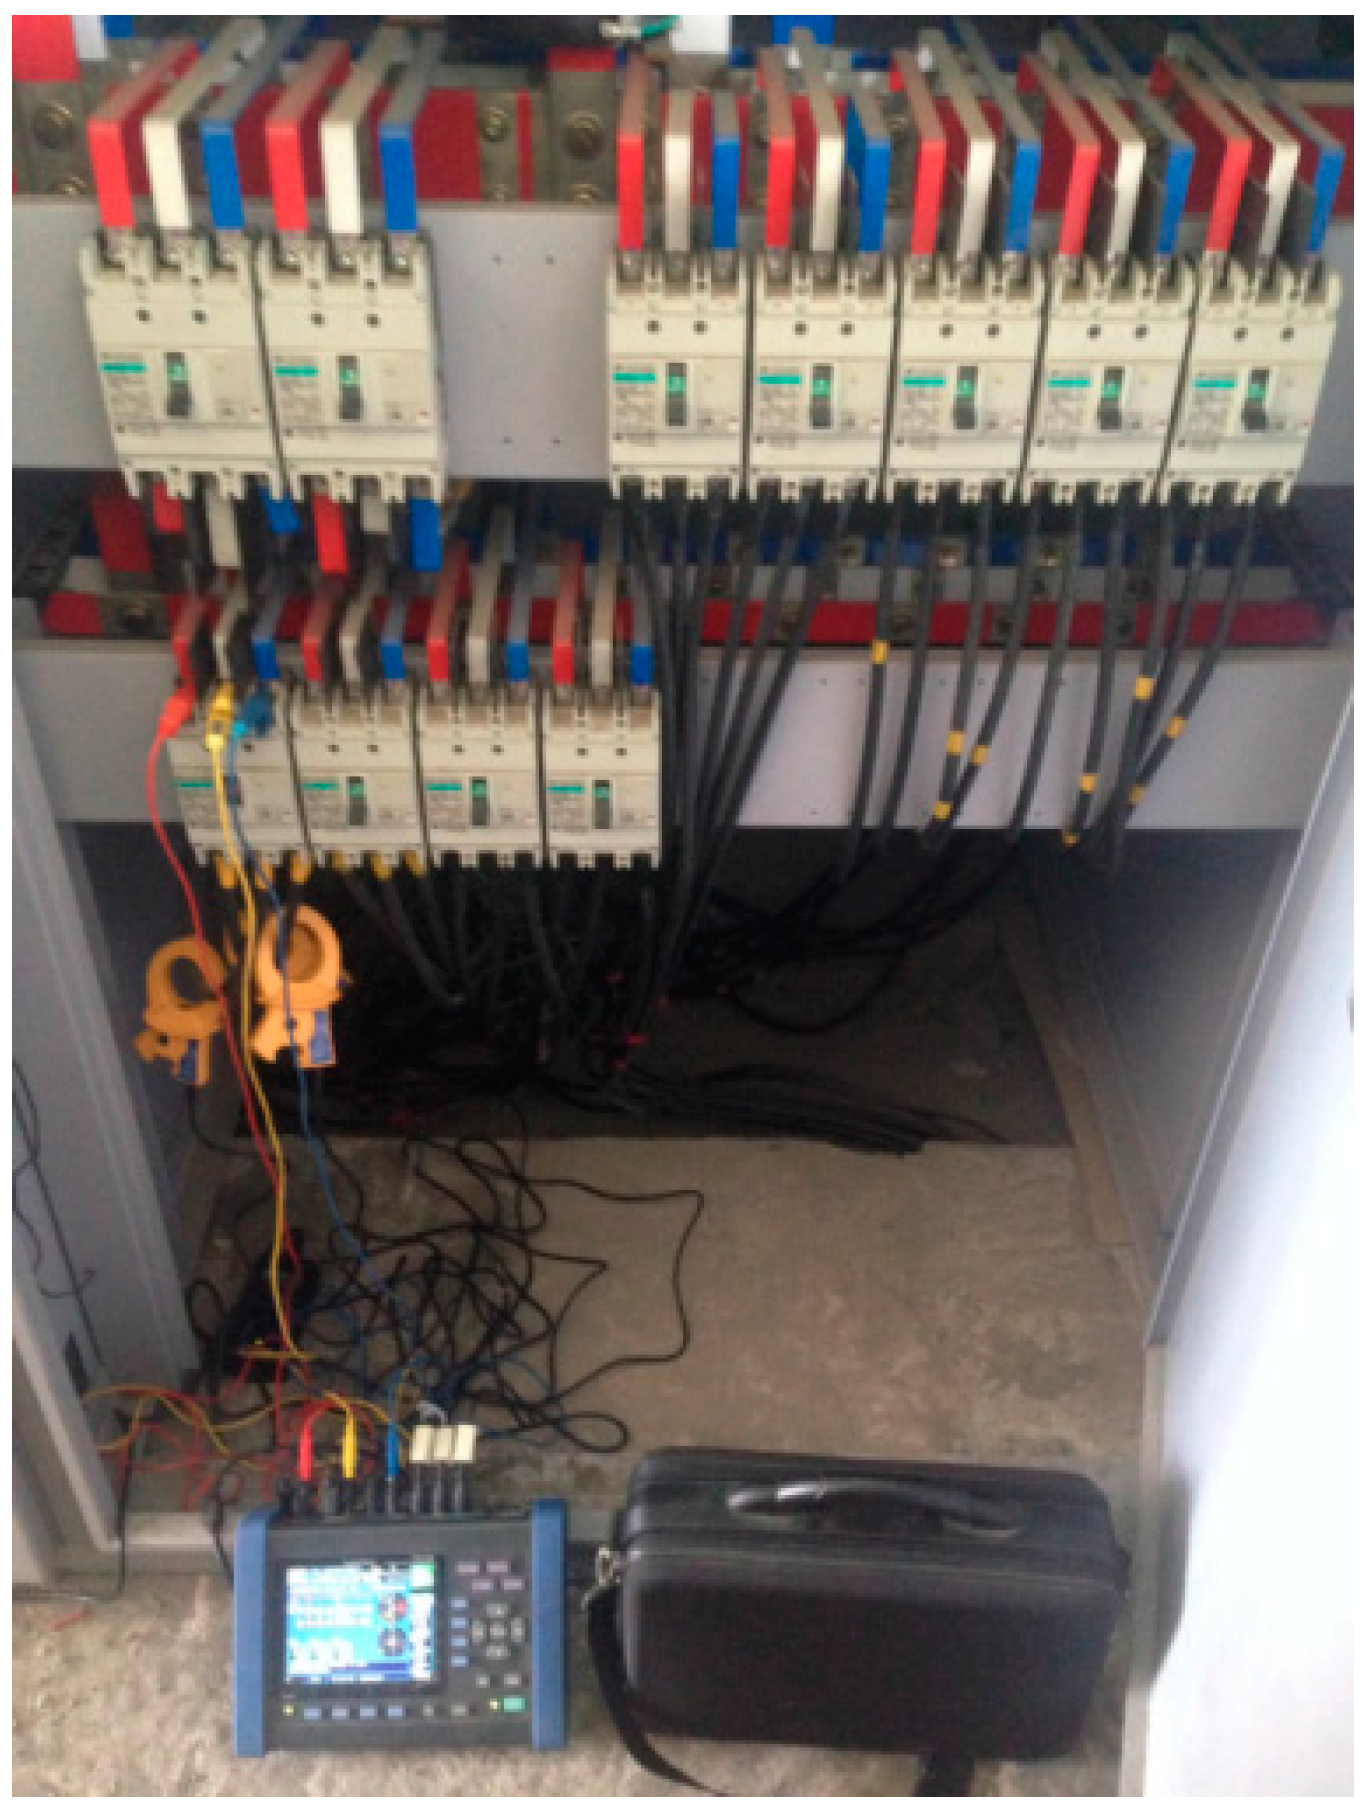
In the actual EB system studied, an EB is able to seat 23 persons at most. At present, there are ten EBs providing transport service between the Qishan township and Kaohsiung City. The battery capacity is 250 kWh. The AC power source for EB charging is 380 V, and this is subsequently converted into 300 to 450 V DC. The current rating of the charger is 120 A and the rated output power is 50 kW. Charging current is controllable. Figure 1 shows the wiring of the charging station. Figure 2 shows the measured three-phase charging power during the period of operation.
The EB charging station operates from 6:00 a.m. to 11:40 p.m. The EB route takes 160 min to complete one transport service, consisting of two round-trips between the Qishan Township and Kaohsiung City. The first departure is at 6:00 a.m. and the last trip returns to Qishan Station at 11:40 p.m. At present, the ten EBs are not charged immediately after service, but wait until the off-peak time (after 10:30 p.m.). Currently, the service is supplemented by diesel buses. In the long run, it is planned to have EBs take over all services. It is estimated that if EBs are used for all scheduled services, seven EBs will need to be charged during the service period in order to make another trip. An EB battery charging scheme is proposed to help the bus company reduce the EB operation cost by controlling the charging time and current required to provide the service. A network impact study will highlight the added value of the proposed charging scheme.
3. Problem Formulation and Solution Method
The Taiwan Power Company uses a time of use pricing scheme to stimulate the EV and EB charging during the off-peak hours and flatten the load profile. An optimal EB charging station planning model based on the time of use pricing scheme is proposed in this section. Issues about the integration of renewable energy and implementation of the proposed model in the field are also addressed here.
3.1. Optimal EB Charging Station Planning Model
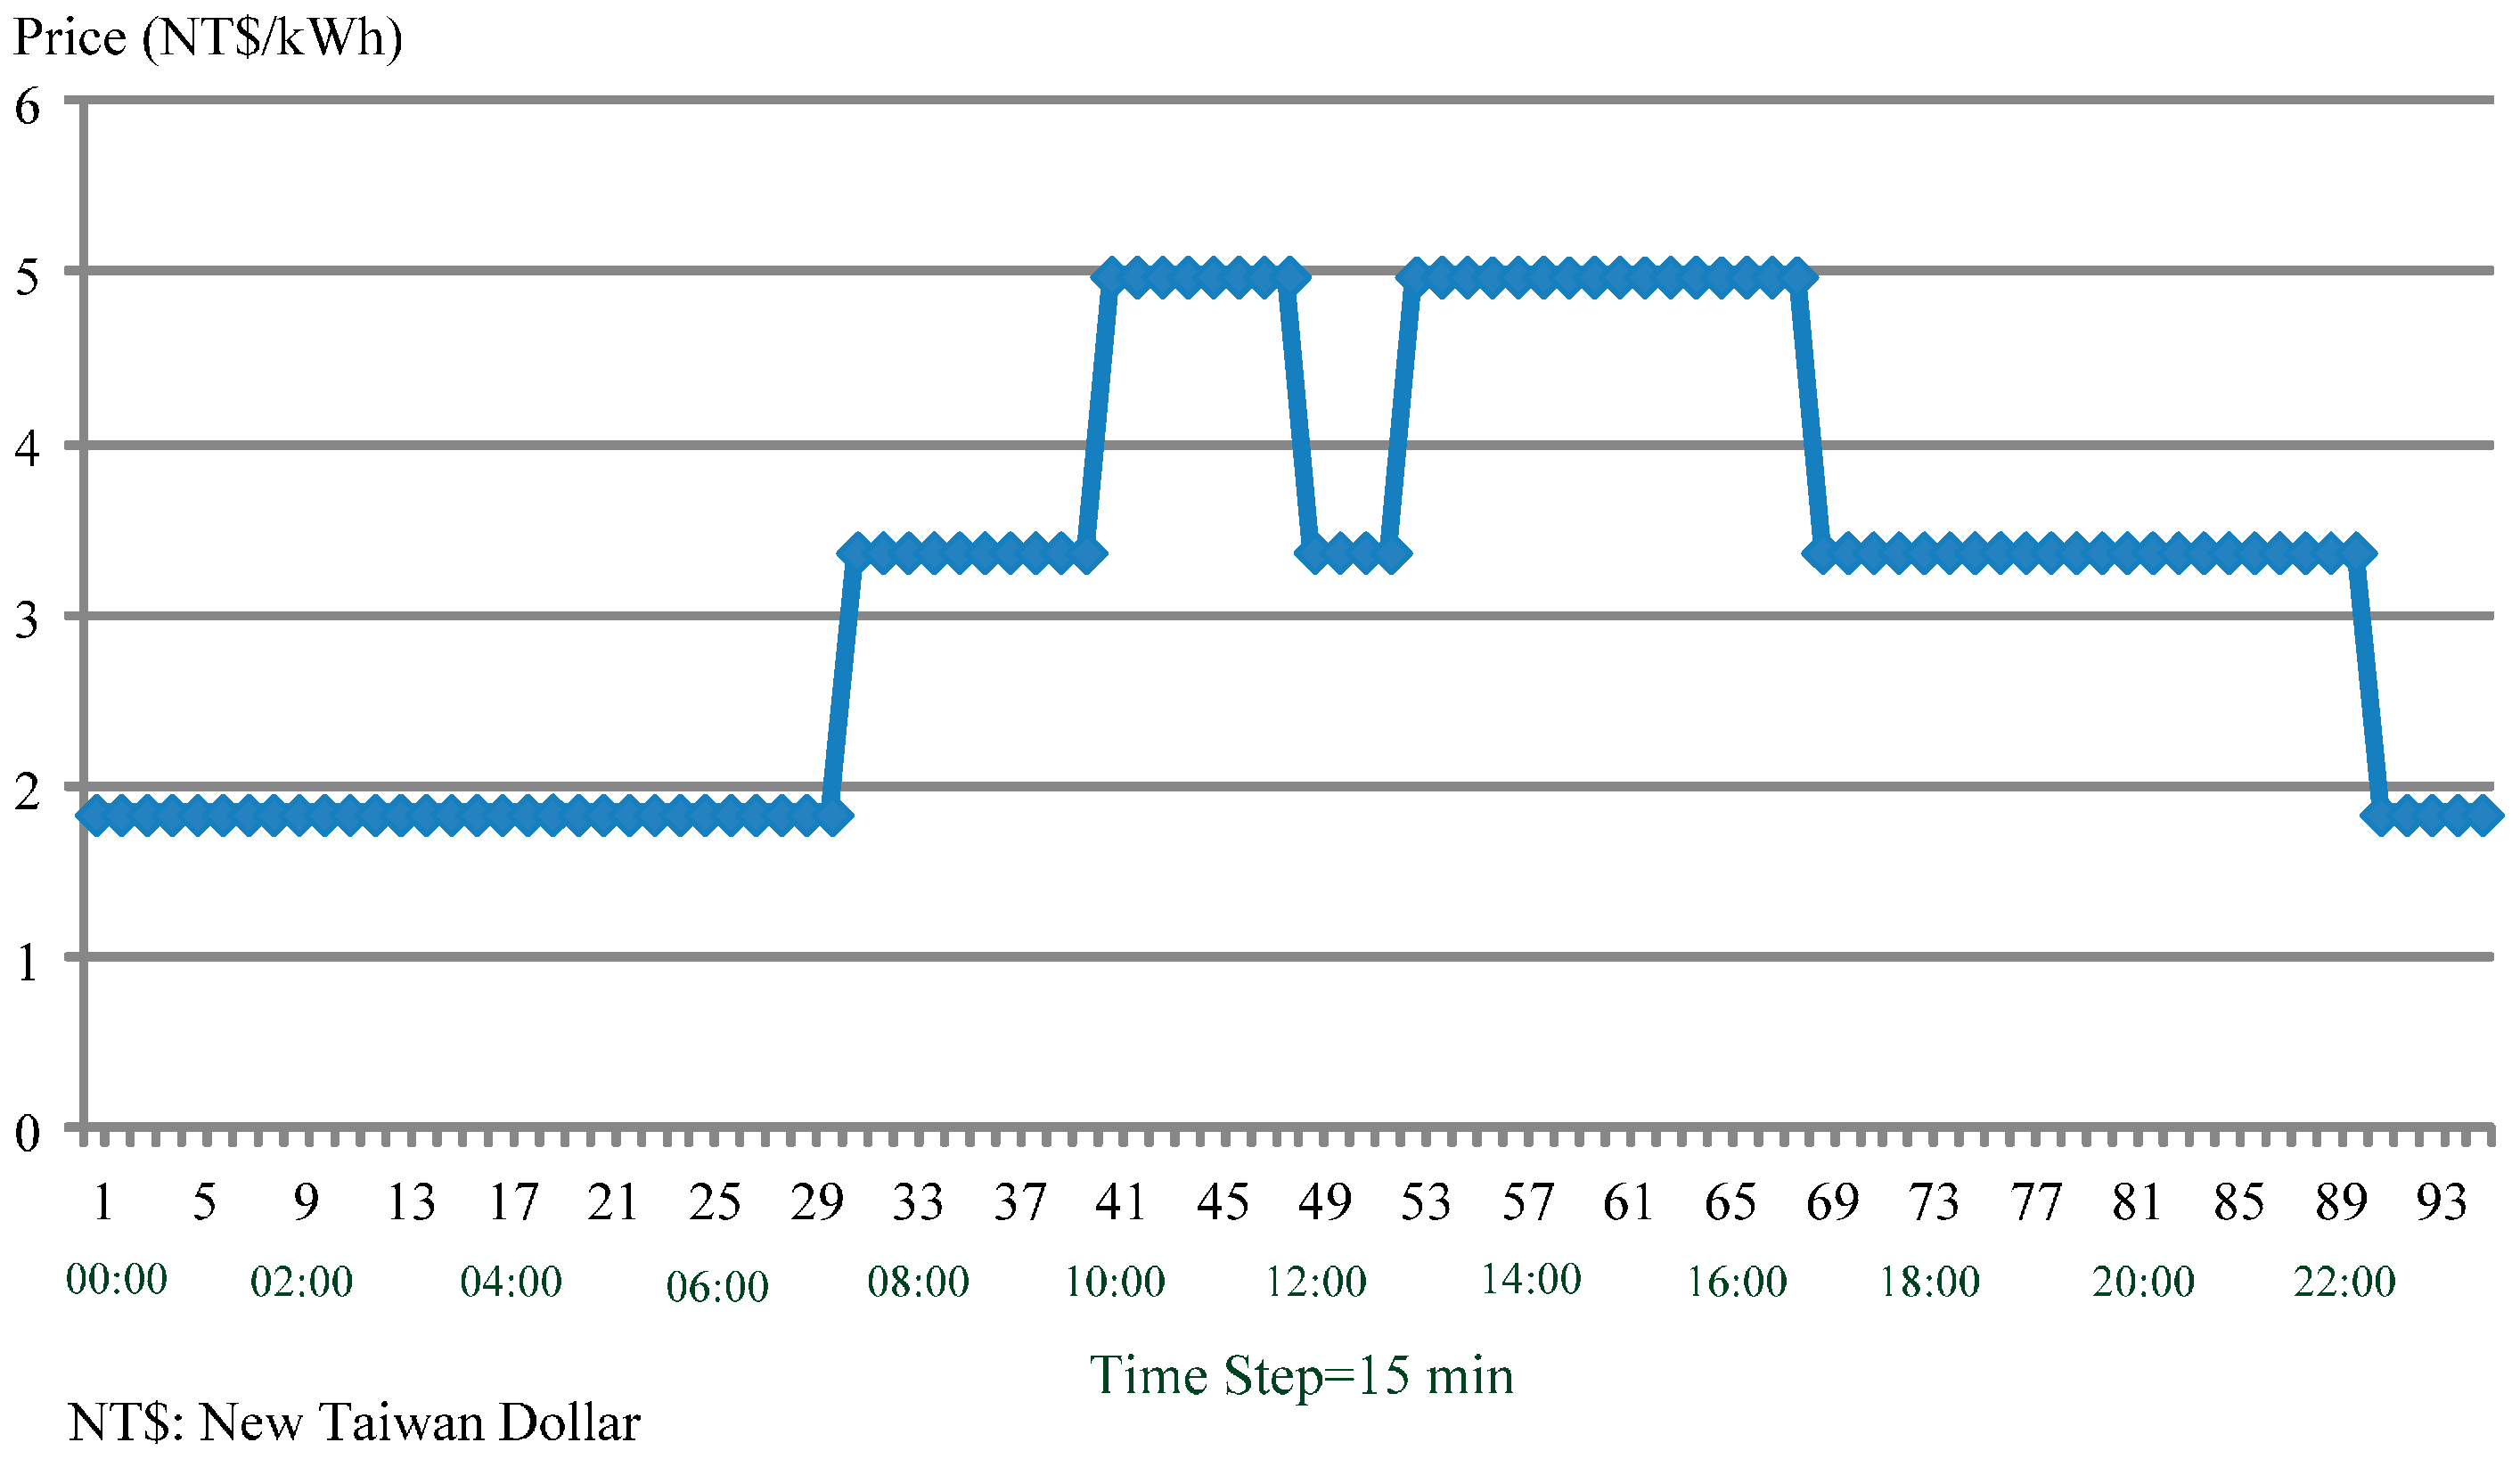
A 3-stage time-of-use (TOU) rate schedule shown in Figure 3 is available from the utility company. The monthly bill includes the basic capacity charge and energy charge. The basic capacity charge expressed in Equation (1) is based on the contracted capacities from the power company. A detailed description about the contracted capacities is shown in Appendix A. As shown in Equation (2), the energy charge is calculated by multiplying the power consumption of the charging station during each time interval by the electric rate of the interval. The mathematical model, as proposed in this paper, uses the charging power of an EB during each time interval, and the usual contracted capacity, half-peak contracted capacity, and off-peak contracted capacity, as variables. The objective function minimizes the sum of the basic capacity charge and energy charge. The constraints enable the EB to complete the charging process before performing transport service according to the operating guidelines of the bus company, while avoiding power consumption exceeding the contracted capacity during each time interval. The problem formulation is shown in Equation (3). As the contracted capacity of Taiwan Power Co., Ltd. is calculated based on 15 min, the model uses 15 min as the time unit. Although the proposed model is built based on the time of use pricing scheme performed in Taiwan, it can be modified to the other pricing scheme by changing the electricity price at each time interval in Equation (2).
where CP, CH, and CO are the usual, half-peak and off-peak contracted capacities that cost CPP, CHP, and COP (NT$) per kW, respectively.
where is the charging power of bus i at time t, and PP, HP, and OP are the electricity price of every 1 kWh at peak, half-peak, and off-peak periods, respectively. DayNo is the number of days of a billing cycle. , and are peak, half-peak, and off-peak hours, respectively, as defined in Table 1. The contracted capacities CP, CH, and CO and the charging power of each bus i at time t are the state variables to be determined.
The optimization problem solved is as follows:
where is the charging power of bus i at time t, Ai and Li are the start charging time and leaving time of bus i, effi is the efficiency of charging pole i, and ChgCapi is the electric energy (kWh) that bus i must have in order to complete a route transport service.
The first constraint of Equation (3) is to ensure that each EB has sufficient energy to provide high quality services. Constraints 2~4 are to avoid power consumption exceeding the contracted capacity at each time interval.
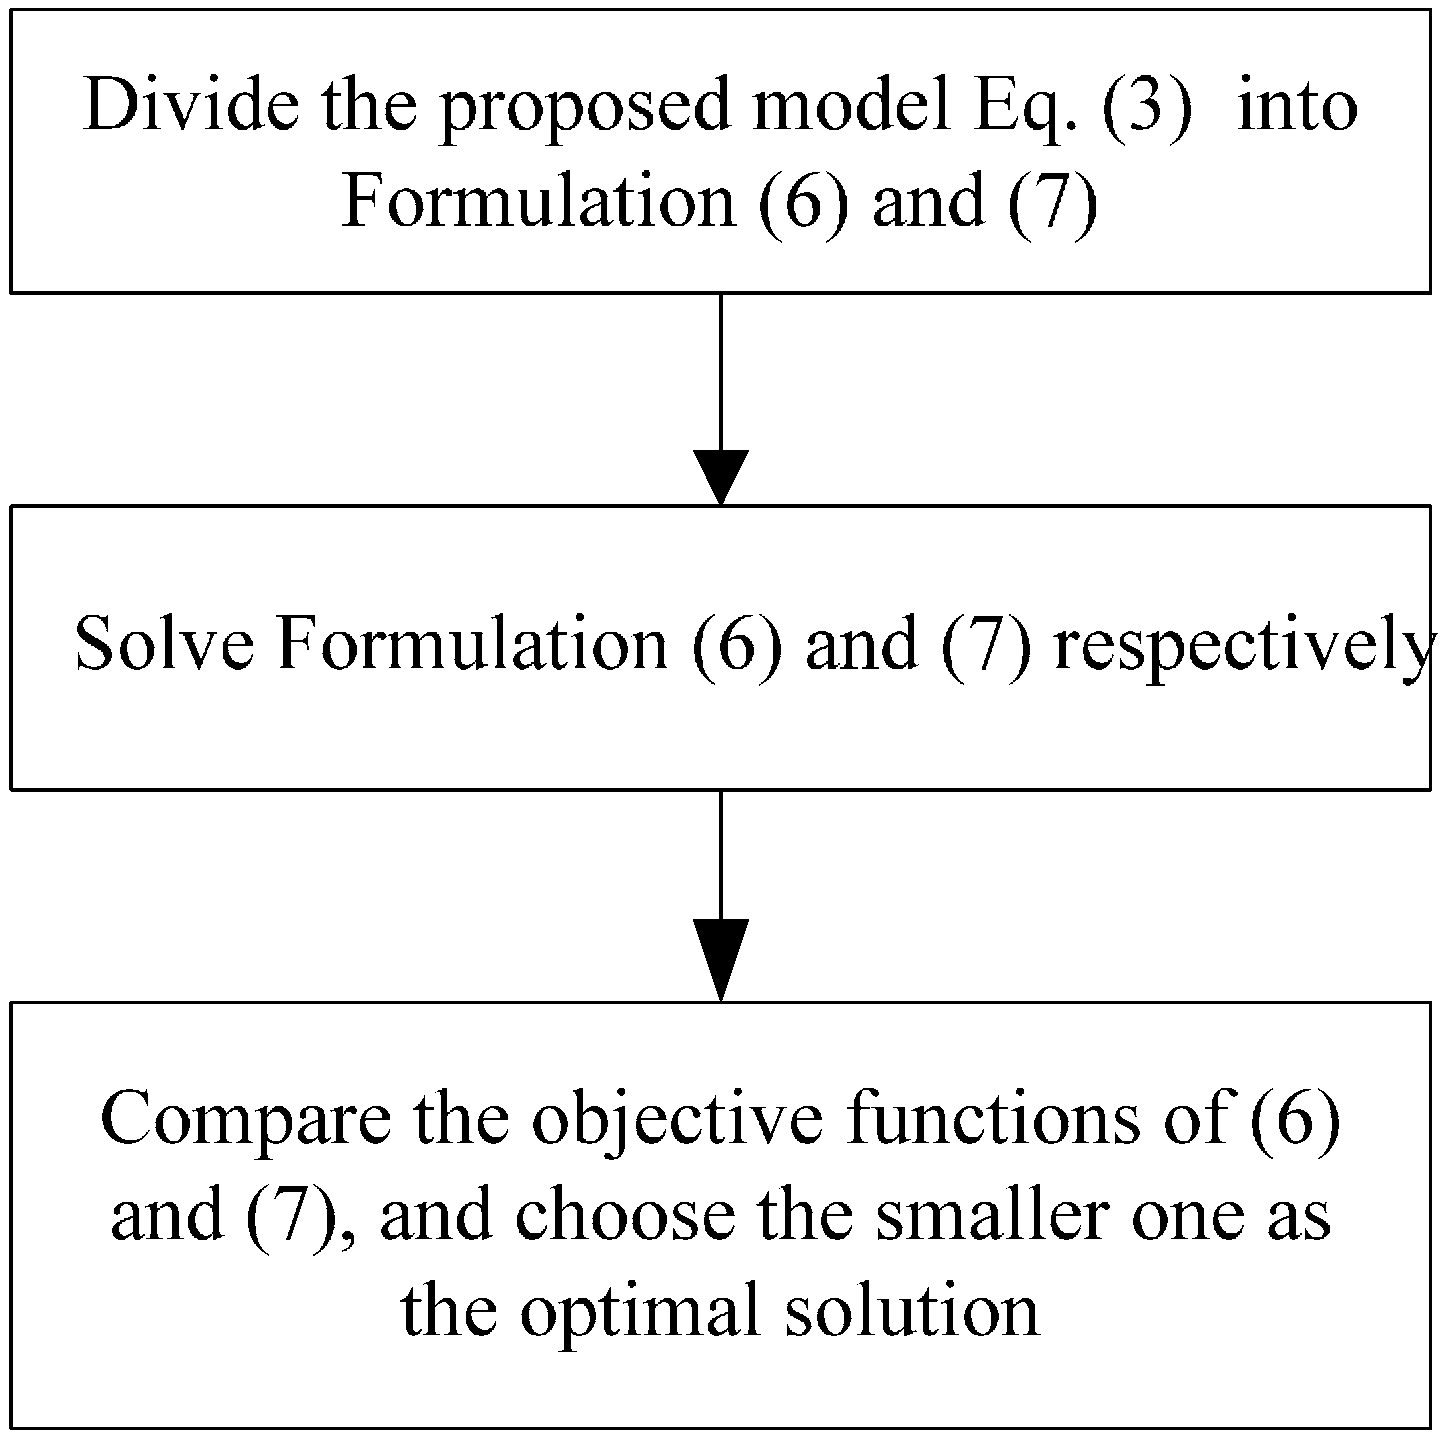
The third term of the basic capacity charge in Equation (1) is to encourage users to use electricity during off-peak hours as much as possible. If the contracted capacity in the off-peak time interval does not exceed half the sum of the usual contracted capacity and half-peak contracted capacity, it is free of charge, i.e., if CO-(CP + CH)/2 0, then the basic capacity charge = CPP*CP + CHP*CH. On the other hand, if CO-(CP + CH)/2 > 0, then the basic capacity charge = CPP*CP + CHP*CH + COP*(CO-(CP + CH)/2); only the part exceeding half the sum of the usual contracted capacity and half-peak contracted capacity is charged. Figure 4 shows the solving procedure to deal with this particular condition. Two sub-problems (6) and (7) are formulated and solved respectively. Formulation (6) optimizes the energy cost under the constraint of CO-(CP + CH)/2 0. Thus, the basic capacity charge = CPP*CP + CHP*CH, and the constraint of CO-(CP + CH)/2 0 is added to Formulation (6). Formulation (7) minimizes the energy cost considering the constraint of CO-(CP + CH)/2 > 0. Therefore, the basic capacity charge = CPP*CP + CHP*CH + COP*(CO-(CP + CH)/2), and the constraint of CO-(CP + CH)/2 > 0 is added to Formulation (7). By comparing the objective functions of (6) and (7), the smaller one is chosen as the optimal solution.
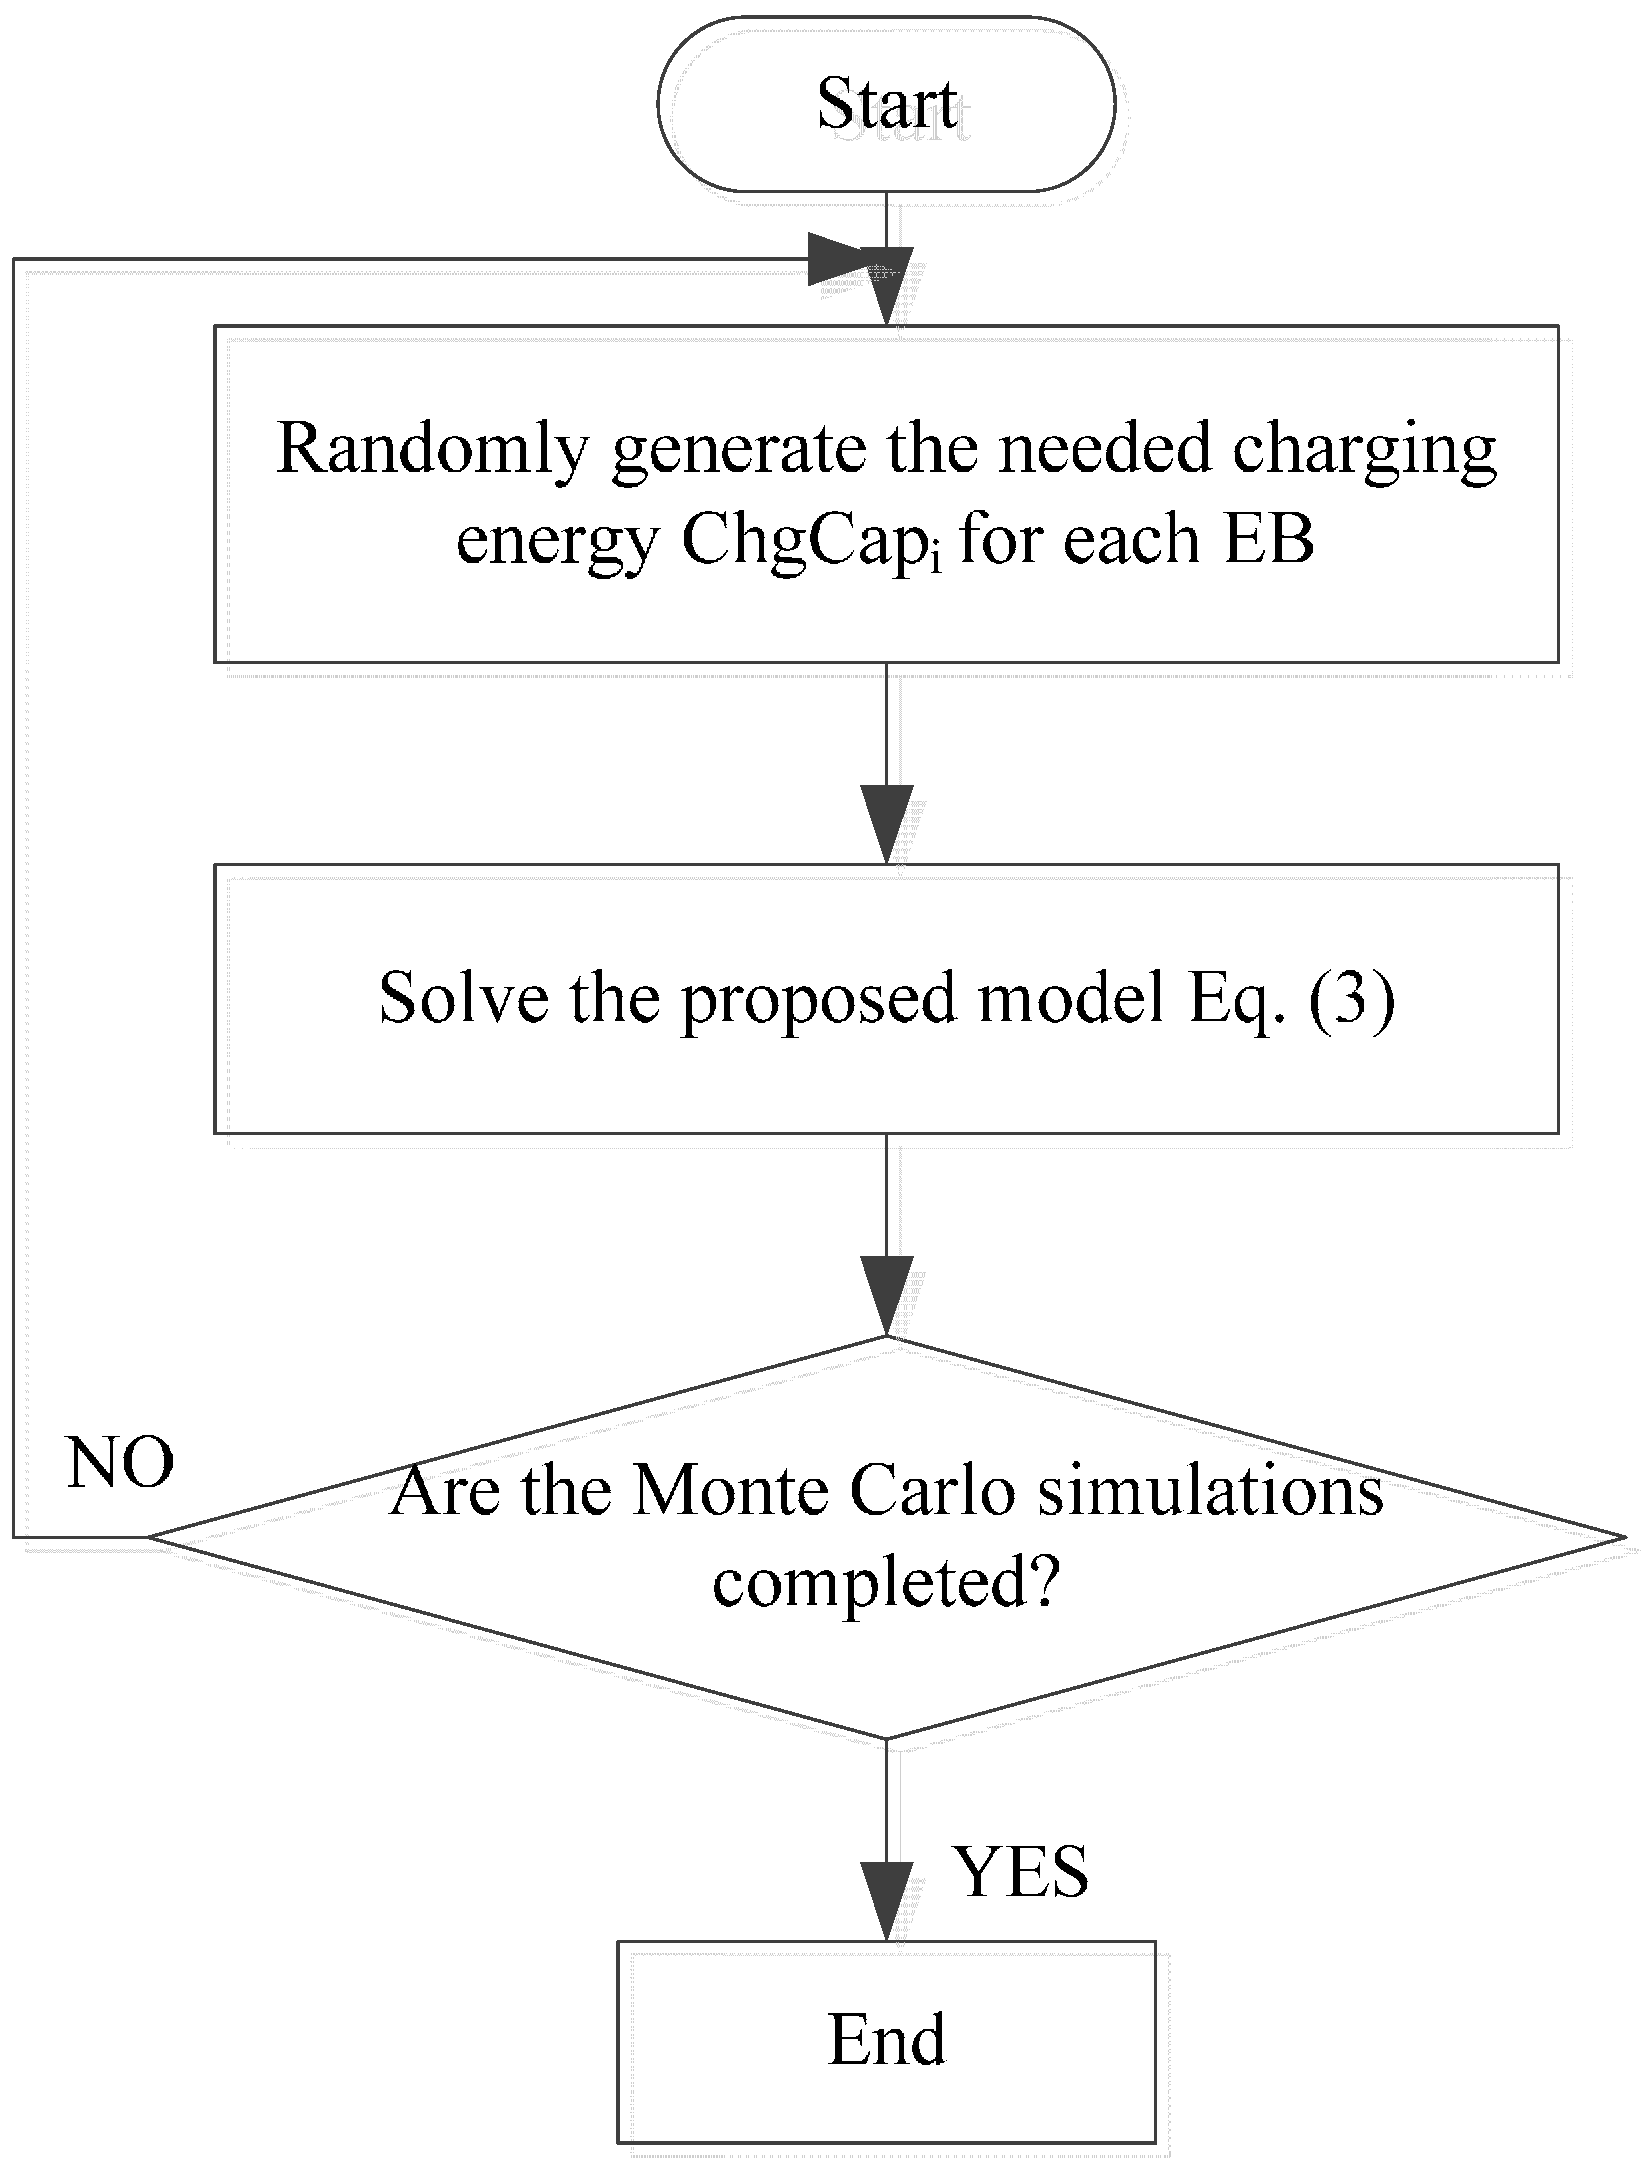
Due to driving habits, battery performance, the desired battery state of charge (SOC) etc., the ChgCapi may change for each transport service. Based on the current SOC and the desired SOC, we can calculate the needed charging energy ChgCapi in Equation (3), and maintain the battery SOC to work in the desired range. According to recorded battery-charging data, a normal distribution, as shown in Equation (8), is used to model the ChgCapi. The mean value and standard deviation are 168 kWh and 13 kWh, respectively. The Monte Carlo Simulation is used to address the uncertainty of ChgCapi. In each Monte Carlo simulation, a number between 0 and 1 is generated by a random number generator for each EB to determine the needed charging energy ChgCapi. Figure 5 shows the proposed stochastic approach, which is described as follows.
where and are the mean value and standard deviation, respectively.
- 1
- The randomness of the needed EBs’ charging power is simulated based on Gaussian distributions with the mean values and standard deviations determined.
- 2
- The solving procedure proposed in Figure 4 for the proposed model is used, as expressed in Equation (3).
- 3
- Steps 1–2 are repeated until a predefined iteration number is reached. The coefficient of variance is often used as the stopping rule in the sampling. An alternative is to use a pre-specified number as the stopping rule. When the simulation process ends, the coefficient of variance is checked [24]. This paper adopts the coefficient of (standard deviation)/(mean value) being smaller than 0.01 as the criterion for convergence when the Monte Carlo simulation is completed.
3.2. Integration of the Renewable Energy
Due to the global energy crisis and environmental pollution, it is becoming a trend to integrate renewable energy into the power grid. The renewable energy can also be integrated into the proposed model as shown in Equation (9). A wind energy integration case is demonstrated in the test results section.
where RenewEng revenue is the revenue obtained by the renewable energy as shown in Equation (10), and is the output of renewable generation at time t.
3.3. Implementation of the Proposed Model in the Field
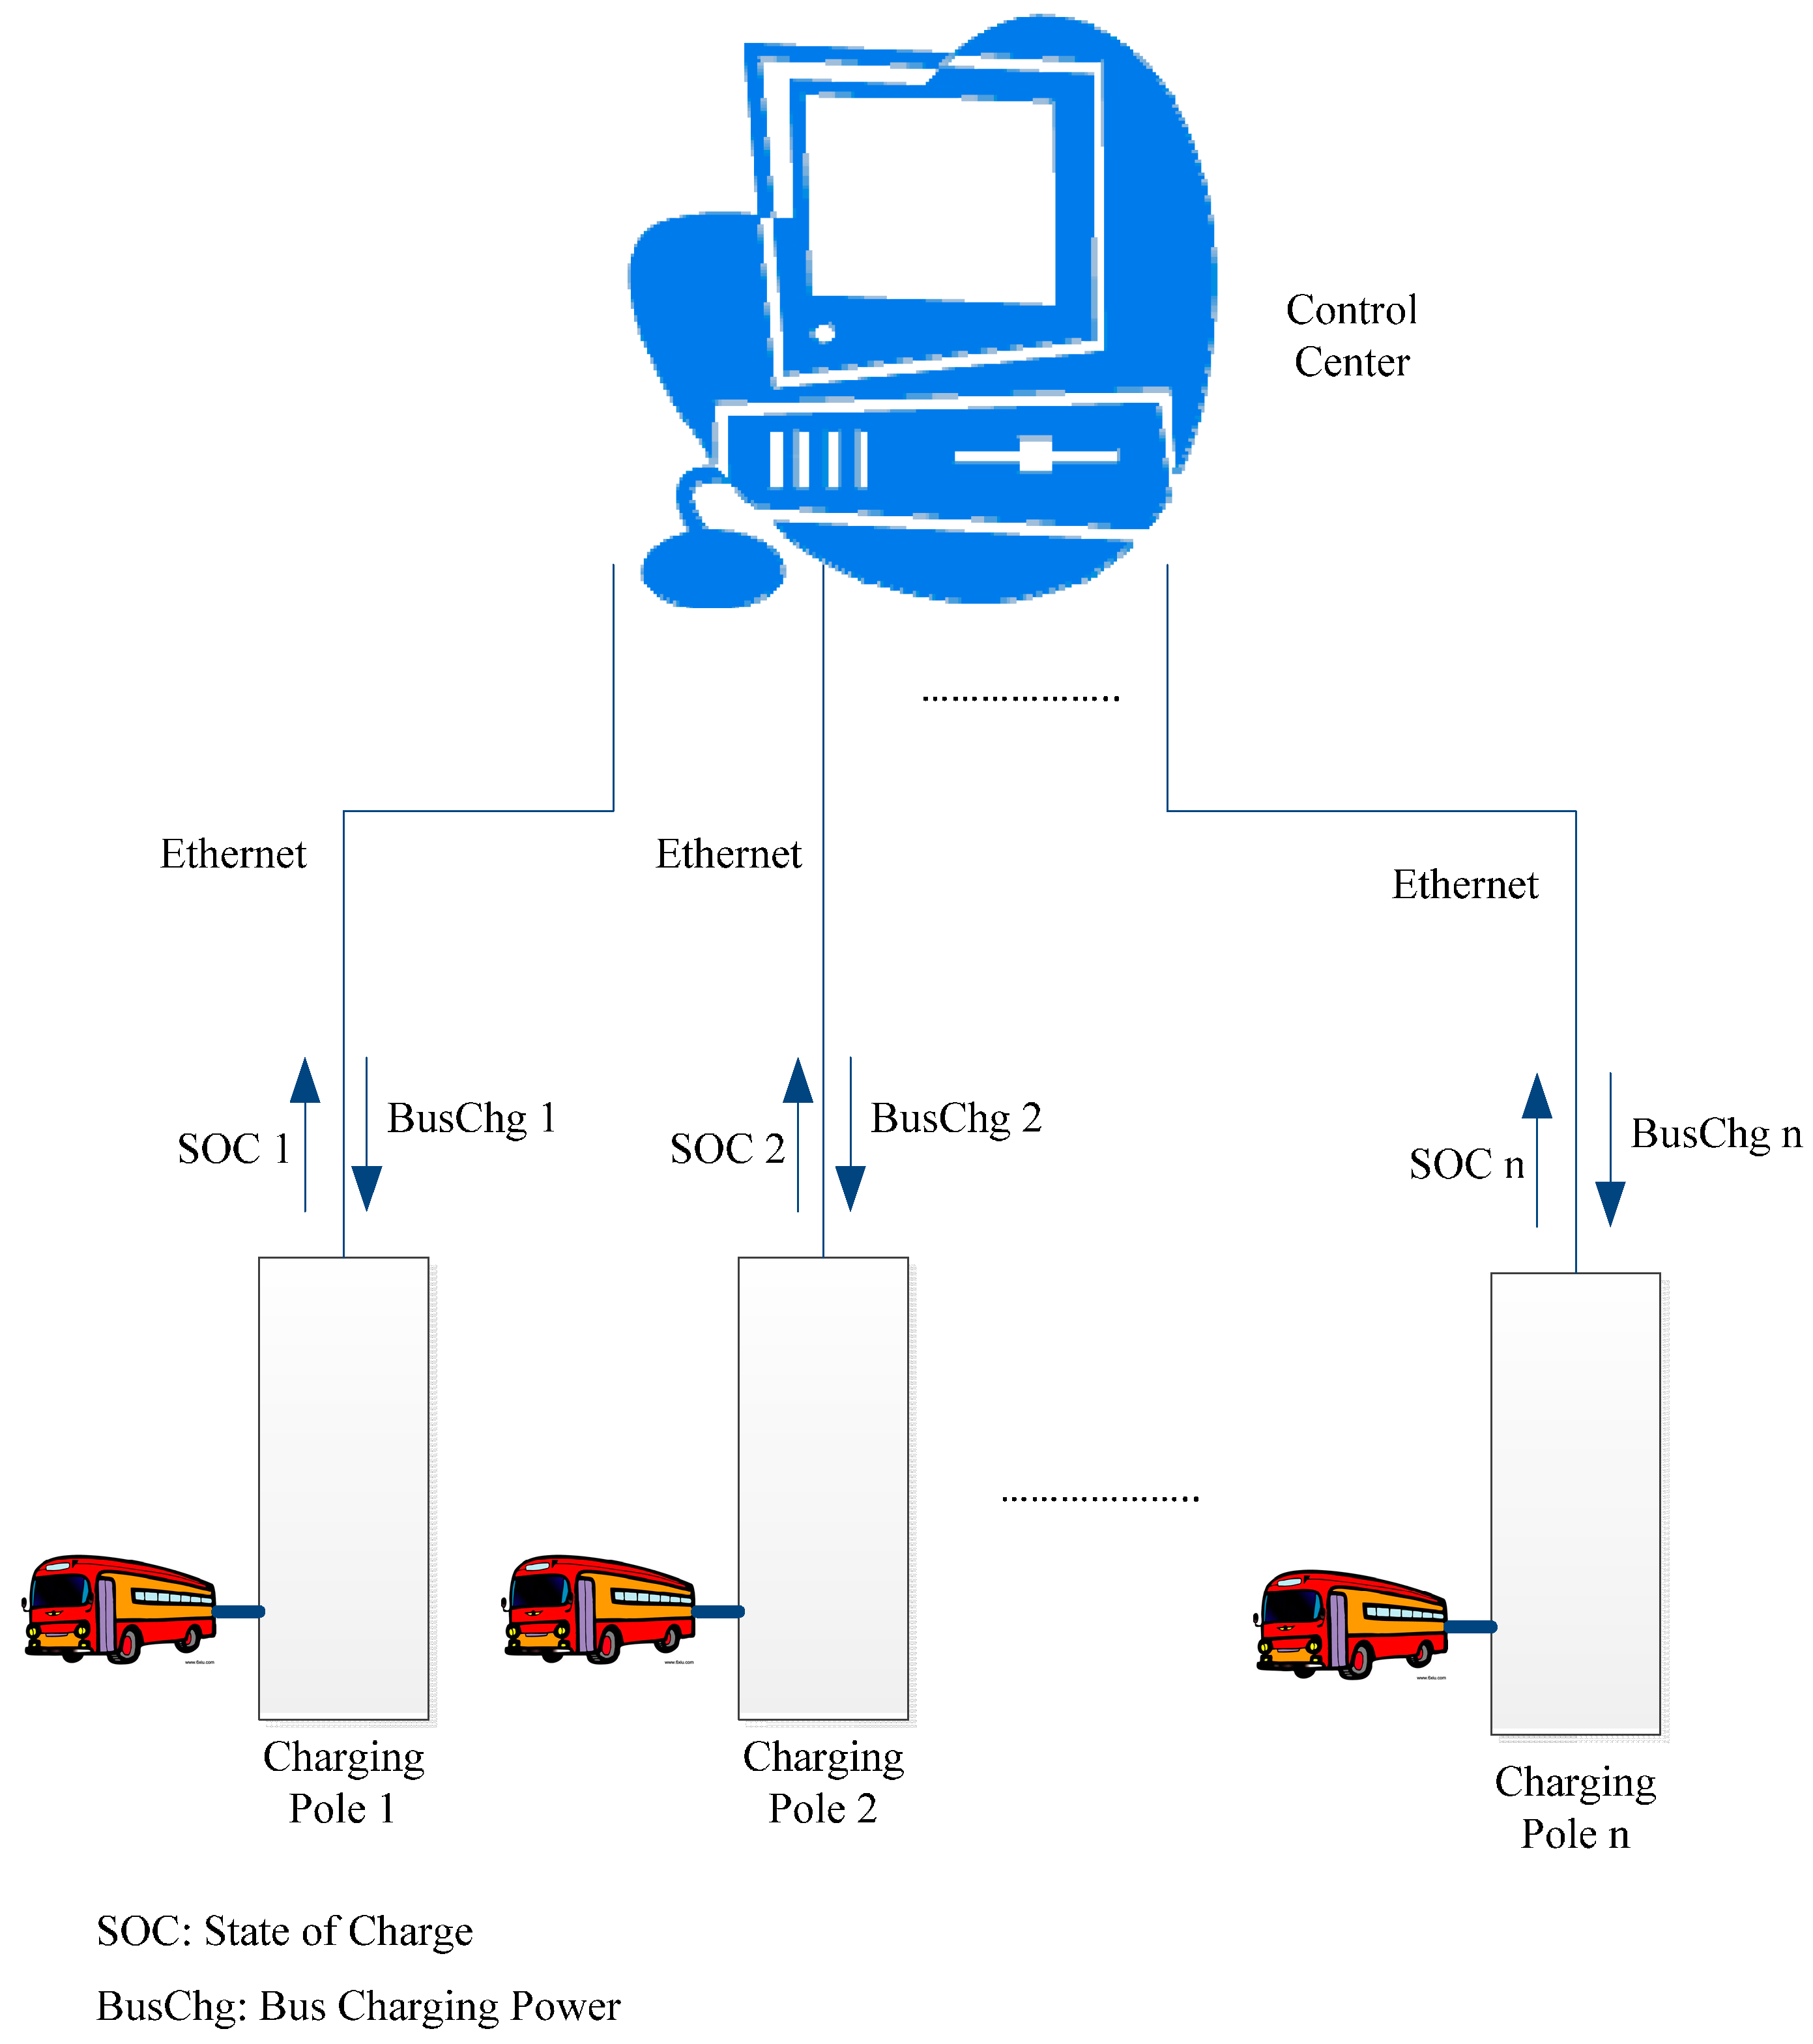
The proposed model can be implemented in the field as shown in Figure 6. If an EB charging service information platform is established, data of battery SOC and charging demand available in the battery management system can be obtained. Considering the charging pole with the Ethernet communication interface, data of all EBs can be sent to the control center. The control center executes the proposed model, and sends the charging power signals to each EB to minimize the energy cost of the charging station.
4. Economic Analysis of the Charging Station
An economic analysis of the EB charging station is studied in this paper. In order to help improve air quality, the government in Taiwan offers financial support to the bus companies to encourage them to replace diesel buses with EBs. These subsidies include the purchase of EBs and the construction of the EB charging station. The cost of one EB is NT$6,500,000, and the government support is NT$5,200,000. The investment required to build the EB charging station is NT$36,701,000; the subsidy is NT$17,249,000.
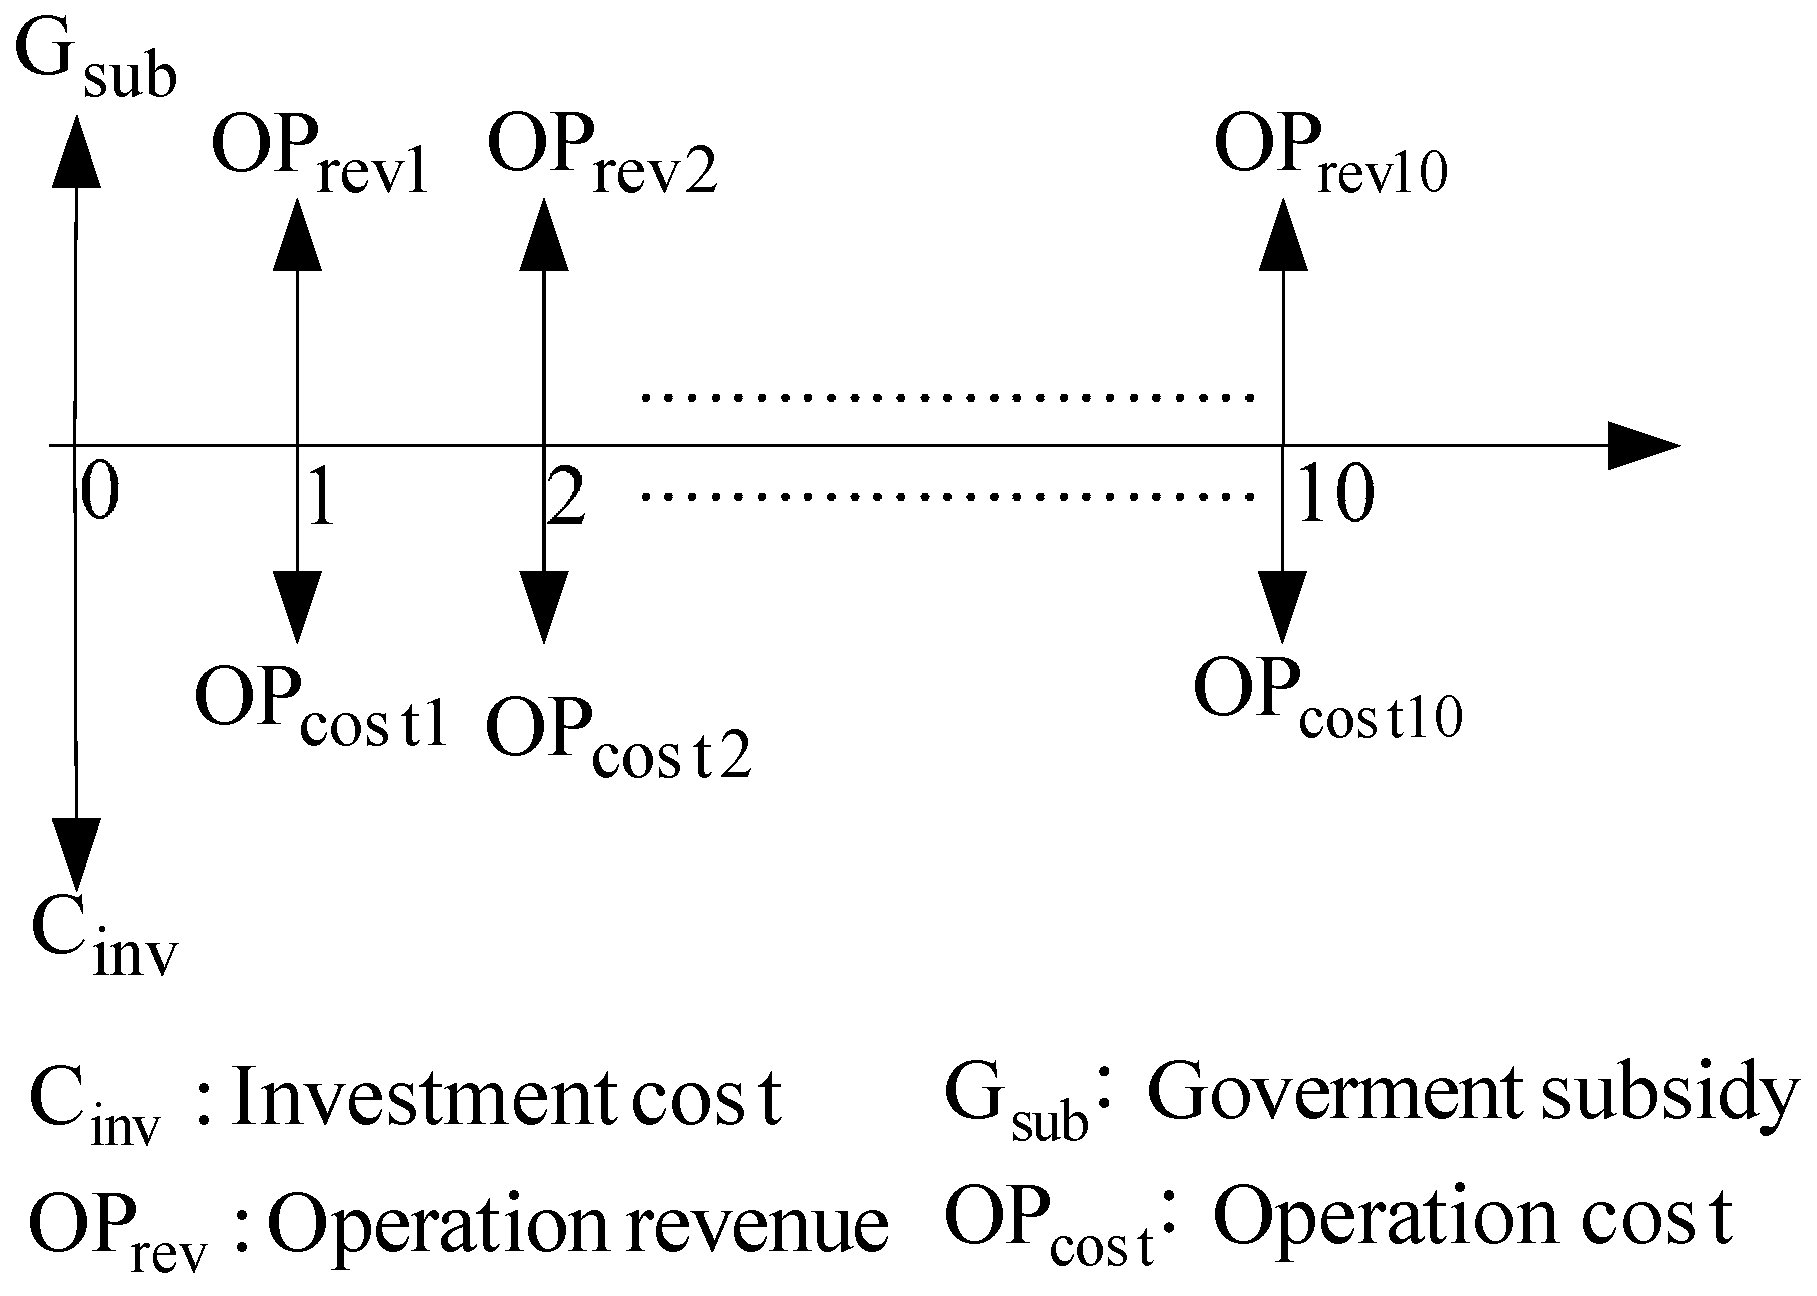
The bus company rents the EB batteries instead of buying them. The leasing fee for each EB is NT$43,000 per month. Other costs include personnel expenses, energy costs and maintenance costs for the operation of the EB station. The cash flow for this economic analysis is shown in Figure 7, with a detailed description given below.
- Investment costs (Cinv): The investment cost includes the purchase of 10 EBs and construction of the EB charging station.
- Operational cost (OPcost): The operational cost includes the personnel expense, battery leasing fee, energy cost and maintenance cost.
- Operation revenue (OPrev): The operation revenue is the customer traffic service charge.
The present value method shown in Equation (11) is used to perform the economic analysis of the EB station. Sensitivity analyses for some key parameters are discussed in the test results section.
where d is the discount rate, and N is the life cycle.
5. Test Results
There are 10 EBs performing transport services in this charging station. According to the guidelines of the bus company, seven EBs perform two transport services and three EBs perform one transport service during the service period, with the transport service of diesel buses completely replaced with electric buses. Charging time intervals of the 10 EBs are shown in Table 2. The charging time interval for an EB is between the end time of one transport service and the start time of the next service. During the charging time intervals, the EB must finish the charging process in order to continue the next transport service. In the controlled charging mode, the problem shown in Equation (3) is used to determine the optimum contracted capacities and charging schedule. In the uncontrolled charging mode, the rated charging power (50 kW) at the beginning of the charging time interval is used. In the tests, CPP, CHP and COP are NT$223.6/kW, NT$166.9/kW and NT$44.7/kW per month, respectively. PP, HP and OP are NT$4.98/kWh, NT$3.37/kWh and NT$1.84 NT$/kWh, respectively. Charging efficiency is assumed equal to 95%.
5.1. Optimal Power Consumption Planning for Charging Station
According to recorded battery data, a normal distribution, as shown in (8), is used to model the needed charging energy of an EB completing one transport service. The mean value and standard deviation are 168 kWh and 13 kWh, respectively. Summaries of 1000 iterations’ results are described in Table 3. The average values of energy costs in one month for controlled and uncontrolled charging methods are NT$288,925 and NT$322,594, respectively. The case of controlled charging would only stipulate 119 kW for average usual contracted capacity, and 117 kW for average off-peak contracted capacity, whereas the uncontrolled charge shall stipulate 250 kW for average usual contracted capacity and 250 kW for average off-peak contracted capacity.
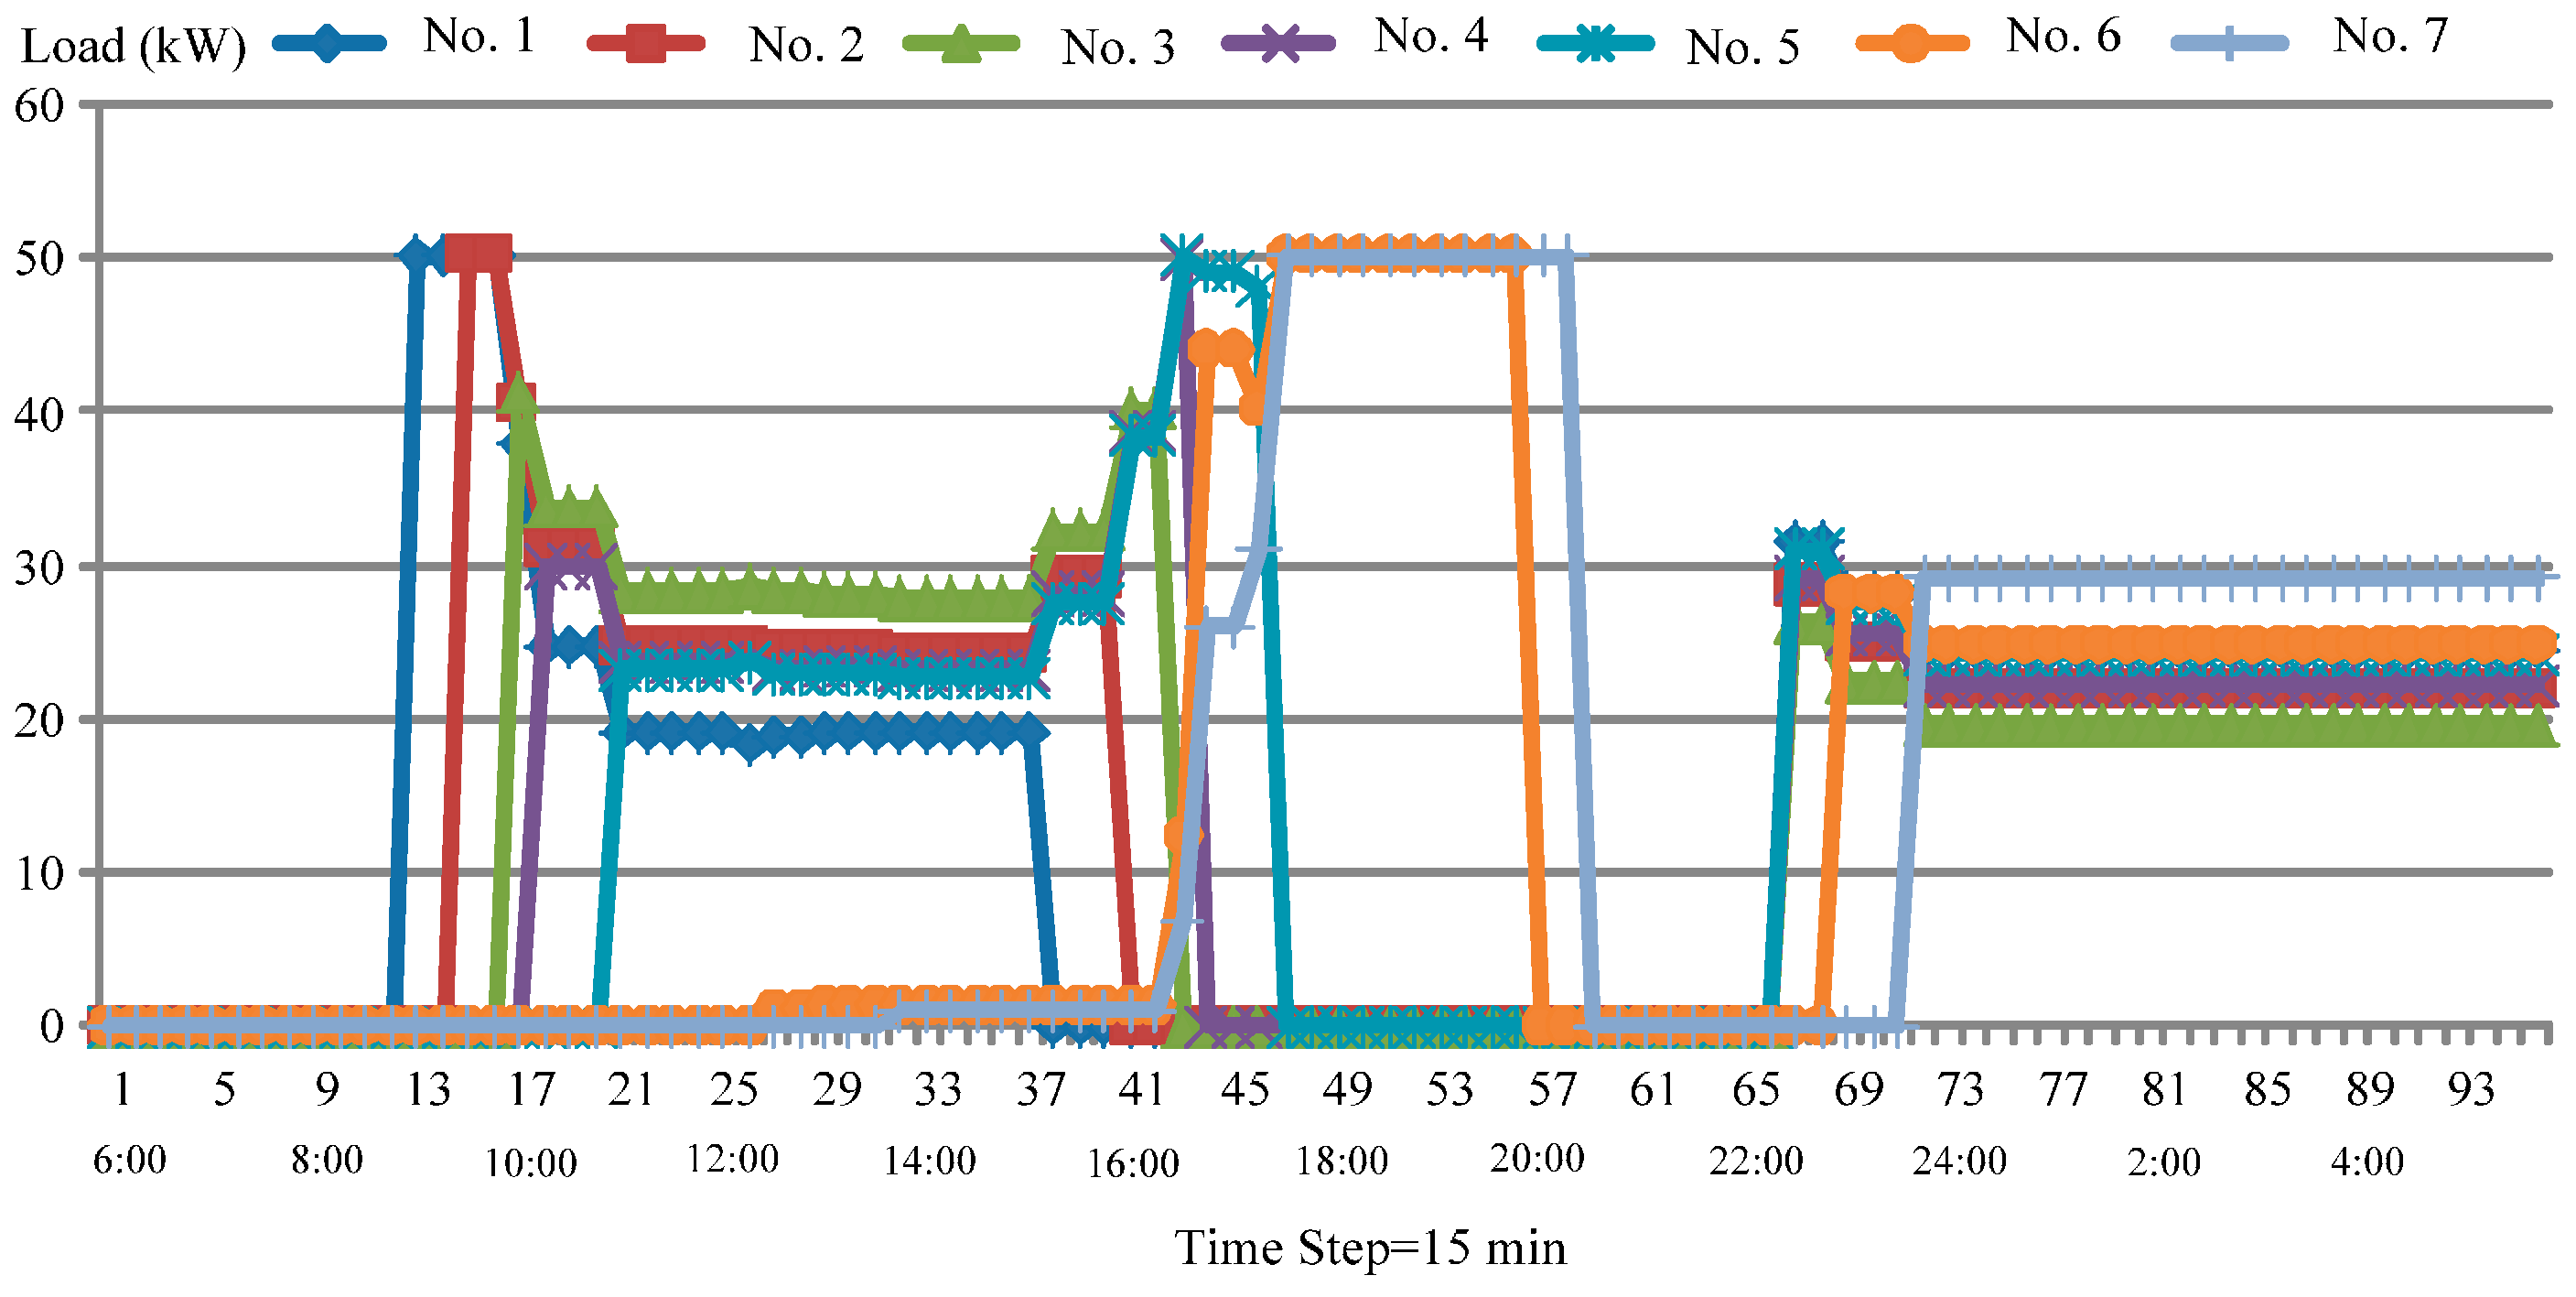
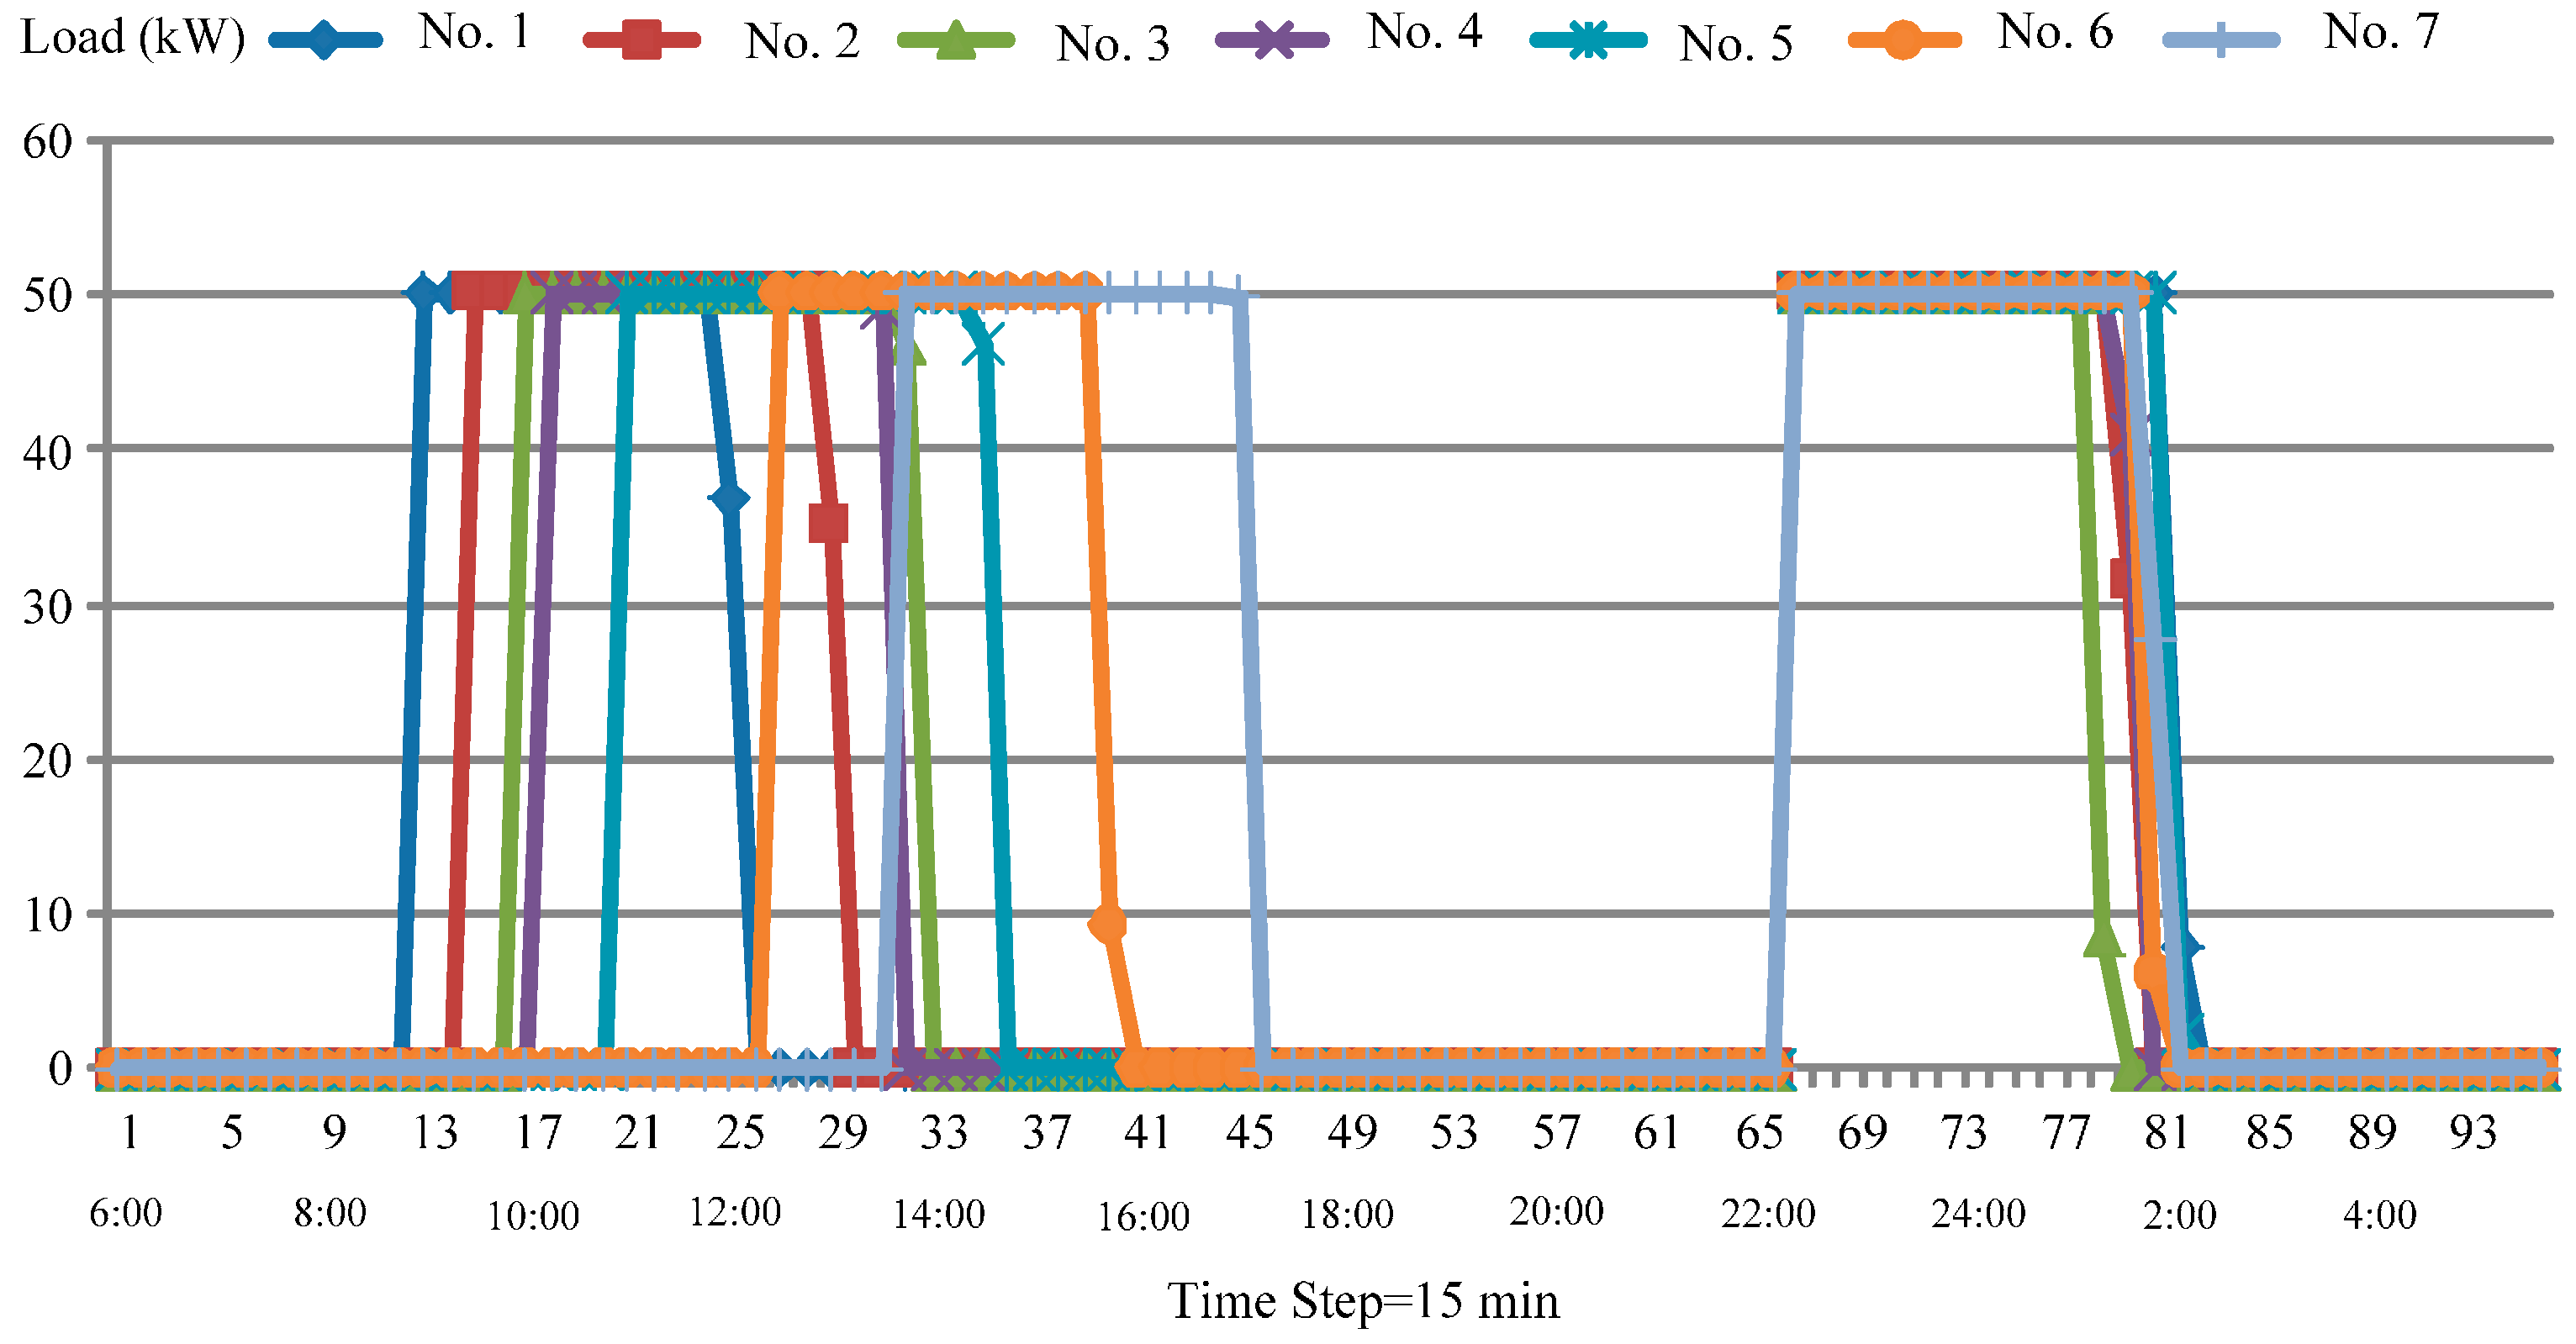
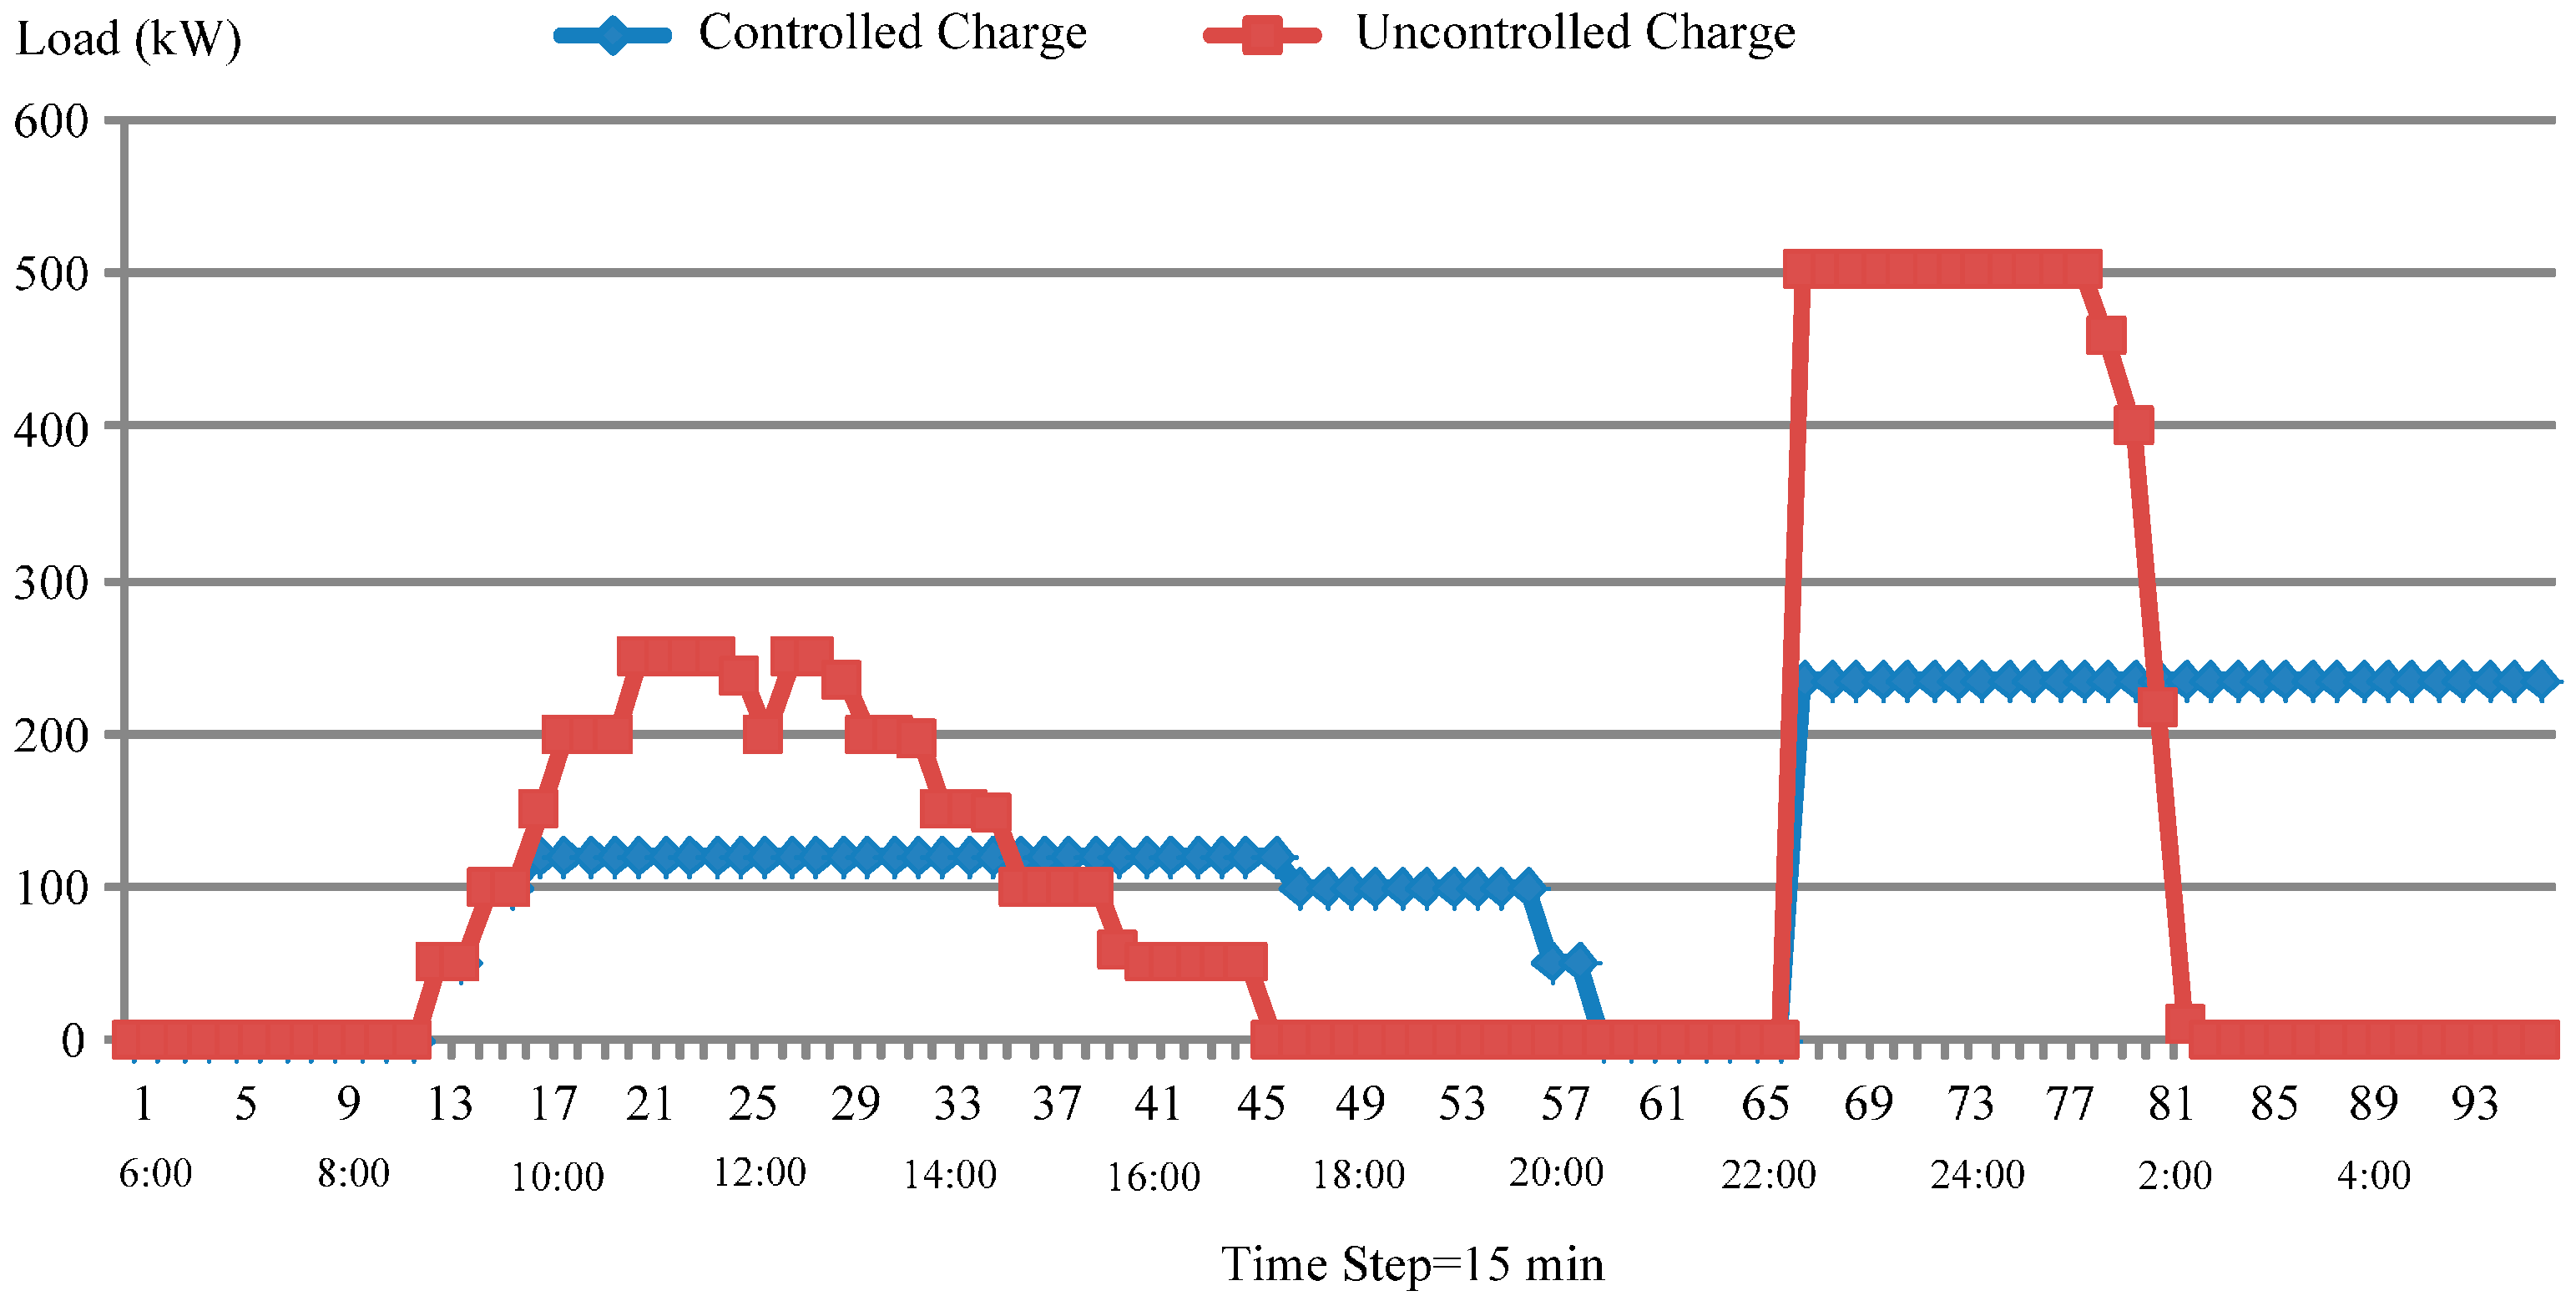
Test results of one of these 1000 iterations are discussed below. Figure 8 and Figure 9 show the controlled and uncontrolled charging schedules of vehicles 1~7, which shall be charged twice. The contracted capacity price and electricity price during a peak time interval are higher than they are at a half-peak time interval. Therefore, a controlled charge avoids charging in the peak time interval as is possible, and flattens the load profile to minimize energy costs. Figure 10 shows the charging station load profiles. The controlled charge reduces and flattens the charging station load peak, as much as possible, thus reducing energy costs. The purpose of the time of use pricing scheme is to shift the charging time to the off-peak period. If too much load is transferred, the pricing rate can be readjusted in each time period to flatten the load profile.
5.2. Integration of the Wind Generation
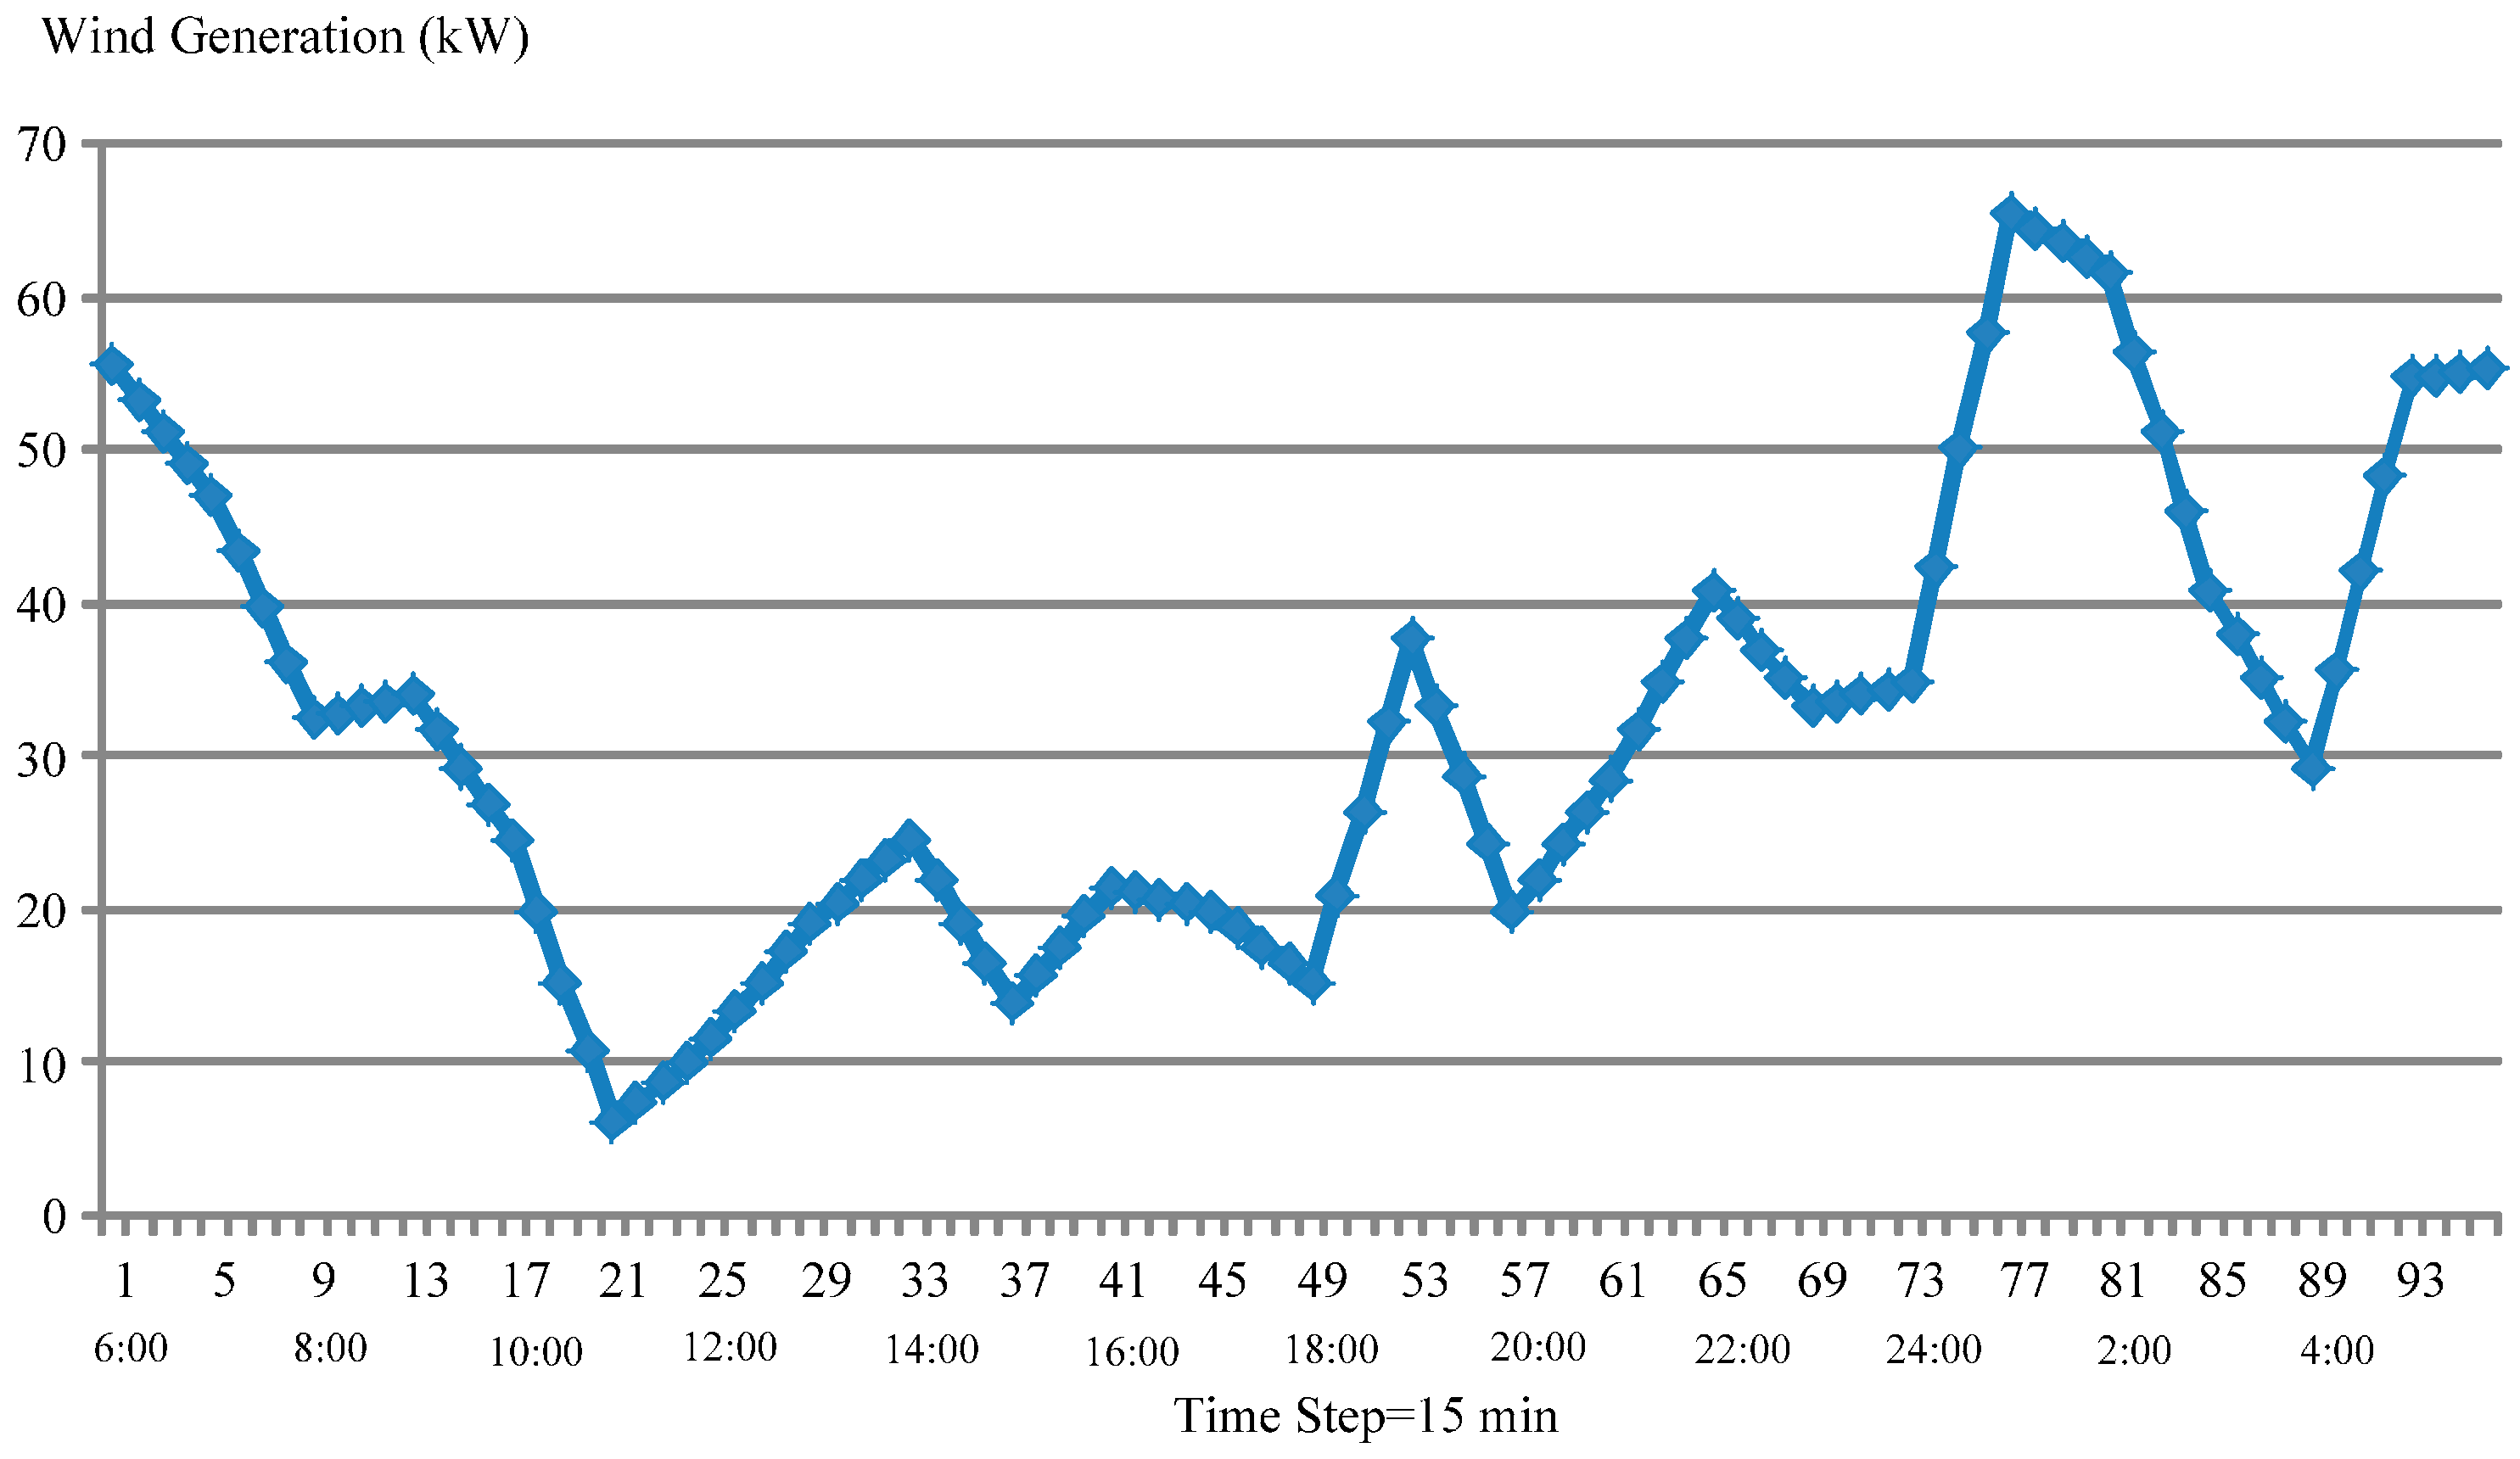
A rated 100 kW wind generation unit is integrated into the charging station. Figure 11 shows the wind generation profile. Table 4 shows the planning results for the controlled and uncontrolled charging methods considering the integration of this wind generation unit. Because the wind generation provides part of the charging load, the contracted capacities and the energy costs for the controlled and uncontrolled charging methods are both reduced. The average values of energy costs in one month for controlled and uncontrolled charging methods are NT$219,950 and NT$265,630, respectively. With the integration of the wind generation, all of these contracted capacities are smaller than those without the wind generation, as shown in Table 3. The case of controlled charging would only stipulate 102 kW for average usual contracted capacity, and 88 kW for average off-peak contracted capacity, whereas, the uncontrolled charge shall stipulate 244 kW for average usual contracted capacity and 223 kW for average off-peak contracted capacity.
5.3. Economic Analysis of the Charging Station
This paper considers the investment cost, financial support from the government, operational cost and operation revenue to perform an economic analysis of this charging station. The energy costs for the controlled and uncontrolled charging for one month are described in previous paragraphs. The ticket price charge is NT$108 per person, and the average number of customers for each trip is 21. This will lead to an operation revenue of NT$56,291,760 per year. The personnel expenses, leasing fee for batteries, maintenance cost and operation revenue for one year of this charging station are shown in Table 5. The investment cost and financial support from the government are described in Section 4.
The present value method shown in Equation (11) is used to perform this financial analysis. The lifecycle of an EB is 10 years. Table 6 shows the present values for the controlled and uncontrolled charging during 10 years. The difference between these two charging methods is NT$4,735,000, and this project is feasible for the bus company.
5.4. Sensitivity Analyses
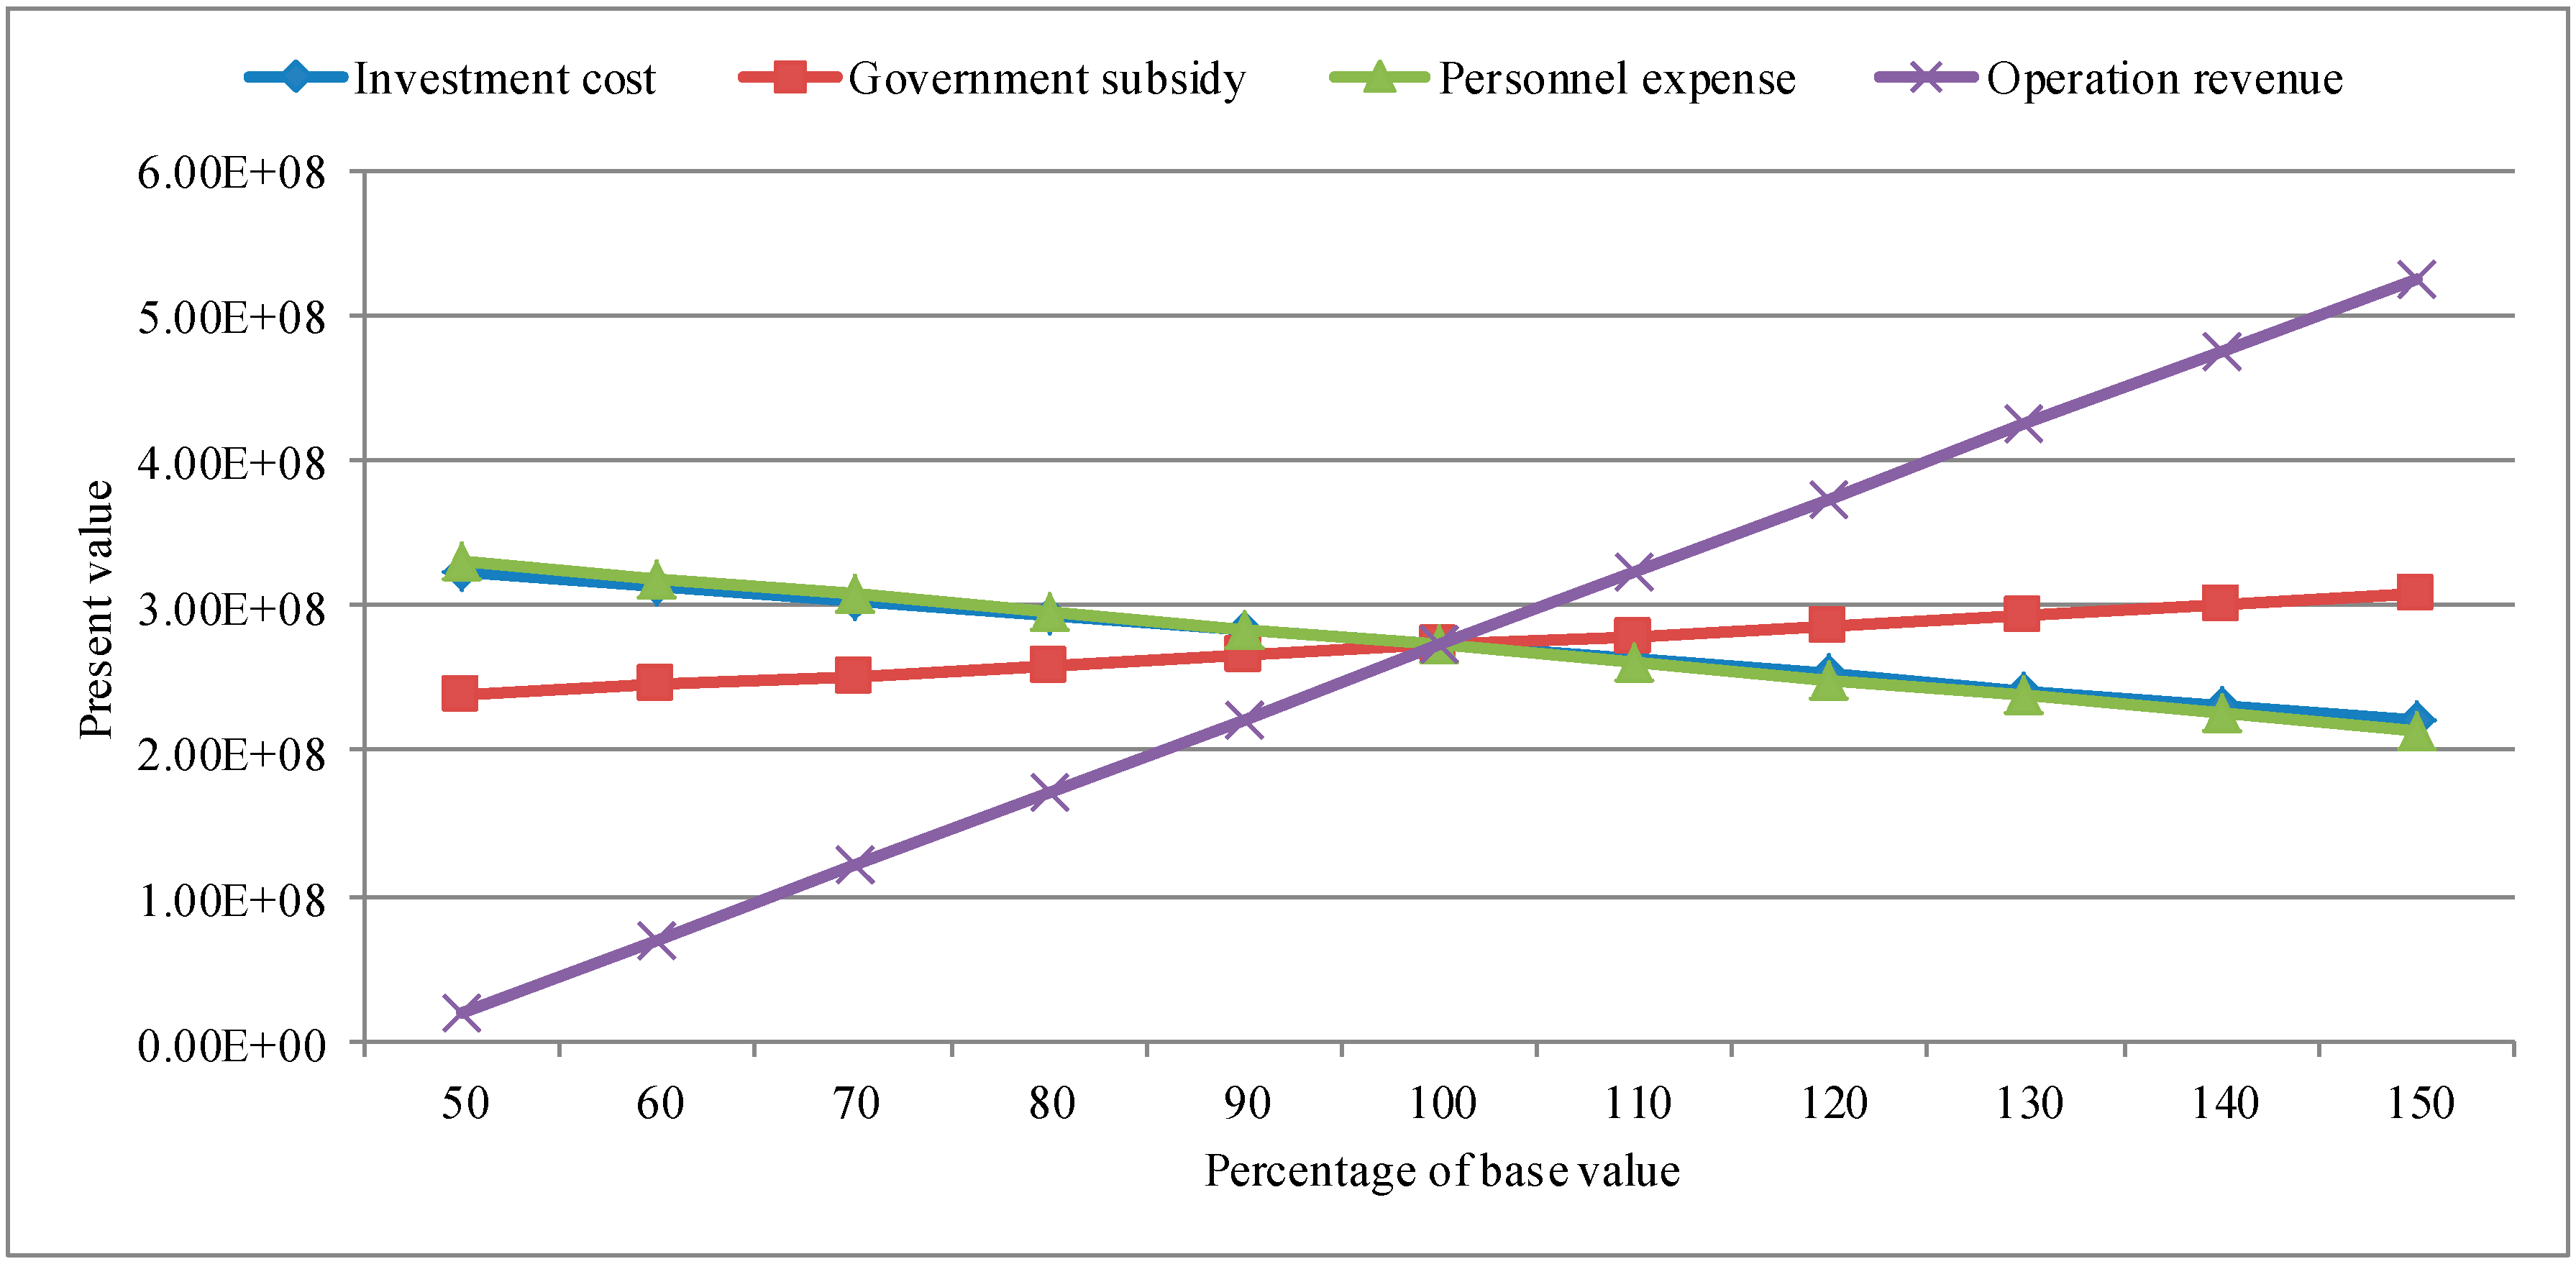
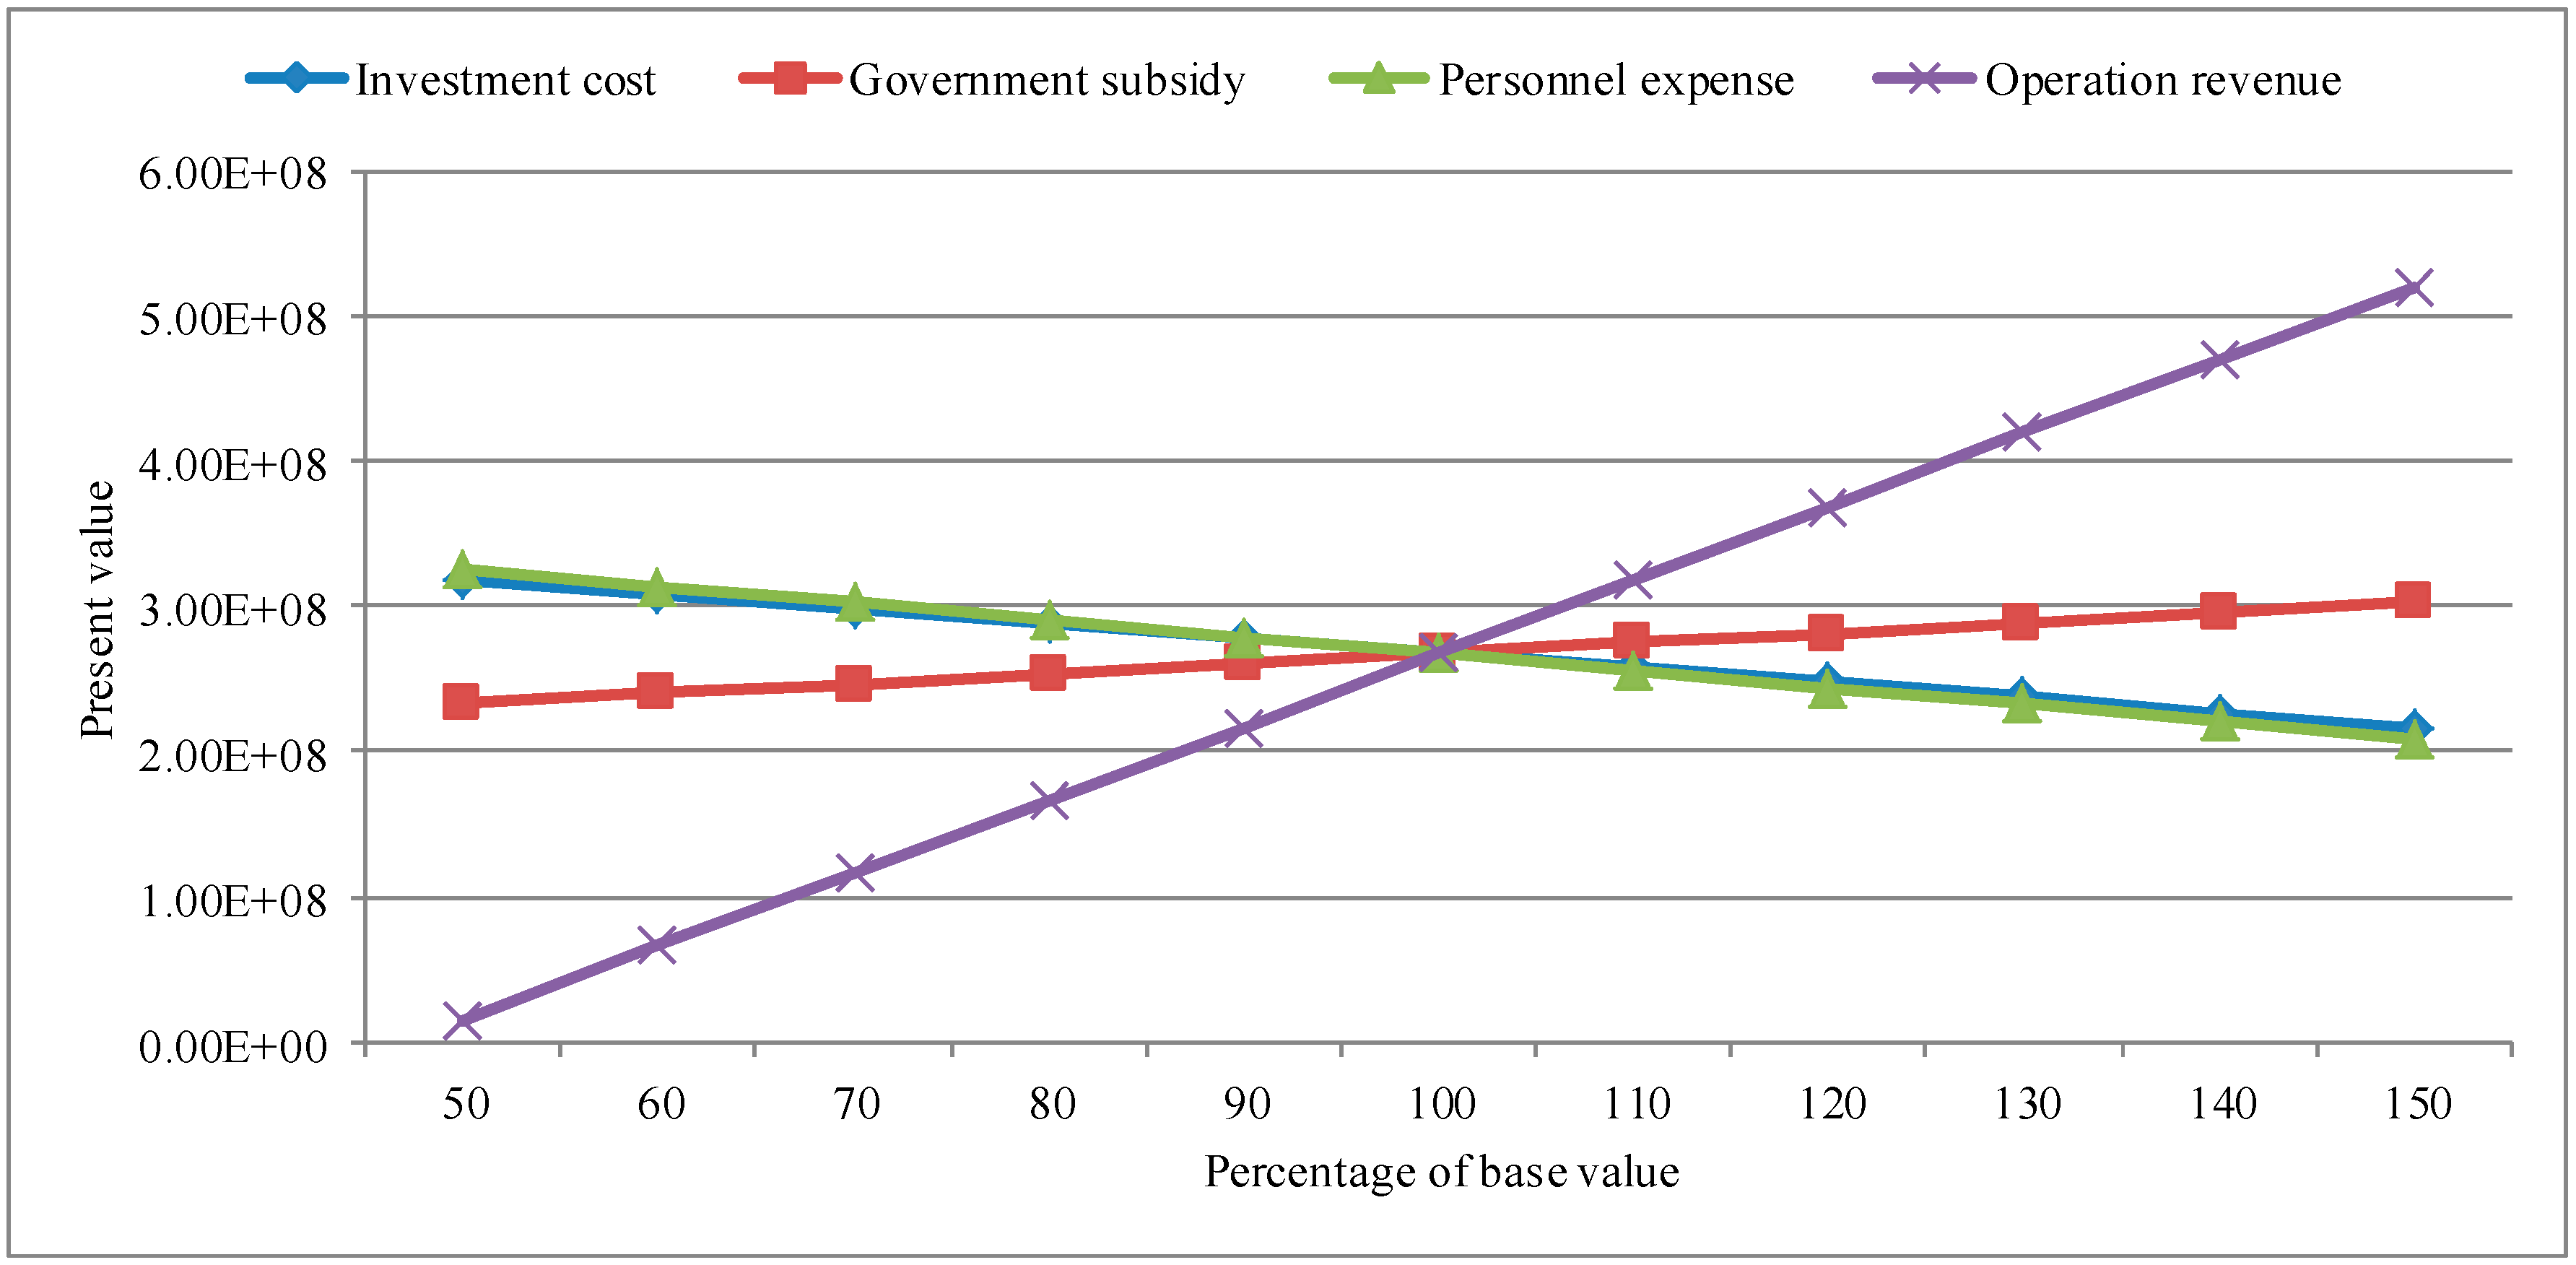
In order to handle uncertainties of this project, sensitivity analyses are performed with respect to four key parameters: the investment cost, government subsidy, personnel expense, and operation revenue. All these parameters are changed from 50% to 150% of their current base values respectively. Figure 12 and Figure 13 show the sensitivity analyses results of the controlled charge and uncontrolled charge respectively. These results show that the parameter of operation revenue (traffic service charge) is the most sensitive factor. Equation (12) is the present value deviation rate for the controlled and uncontrolled charge. Table 7 shows the detailed sensitivity analysis results of the operation revenue parameter. When the ticket price is 50% of the current price, the present value for the controlled charge is only NT$19,792,900. However, the present value will rise to NT$525,438,000 when the ticket price is 150% of the current price. Table 7 also shows when the ticket price is lower; the present value deviation rate for the controlled and uncontrolled charge incurs a larger value. This means that the controlled charge is more important when the competition forces the bus company to lower the service charge. Detailed sensitivity results of the investment cost, government subsidy, and personnel expense parameters are also demonstrated in Table 8, Table 9 and Table 10. The controlled charge has a greater impact on the present value deviation rate when the investment cost or personnel expense increases, or the government subsidy decreases. These results are useful for the bus company to face the future competitive challenge.
6. Conclusions
An EB charging station consumes large amounts of power; hence, it is essential to arrange the charging schedules properly to minimize the energy cost. In the past, the contracted capacities were estimated by experience and the EBs usually began charging immediately after completing the transport service. These behaviors resulted in higher energy costs. A mathematical model used to minimize the energy cost by determining optimal charging schedules and contracted capacities while considering the operational guidelines of a bus company is presented herein. This paper takes a practical charging station as an example to verify the performance of the proposed model. Test results show that the controlled charging model can sharply reduce the EB charging station energy costs. In order to ensure the feasibility of investing in EB charging stations, an economic analysis model is proposed for the EB charging station project. Test results indicate that this project is beneficial for the bus company. Sensitivity analyses suggest that the parameter of operation revenue is the most significant factor. These analytic results are useful for bus companies to operate charging stations.
Acknowledgments
The authors gratefully acknowledge the technical and financial supports for this work from Ministry of Science Technology of Taiwan and Taiwan Power Company under contract NSC 102-2221-E-230-010.
Author Contributions
Rong-Ceng Leou proposed the analytic model and wrote the paper. Jeng-Jiun Hung helped measure and analyze the field data.
Conflicts of Interest
The authors declare no conflict of interest.
Appendix A
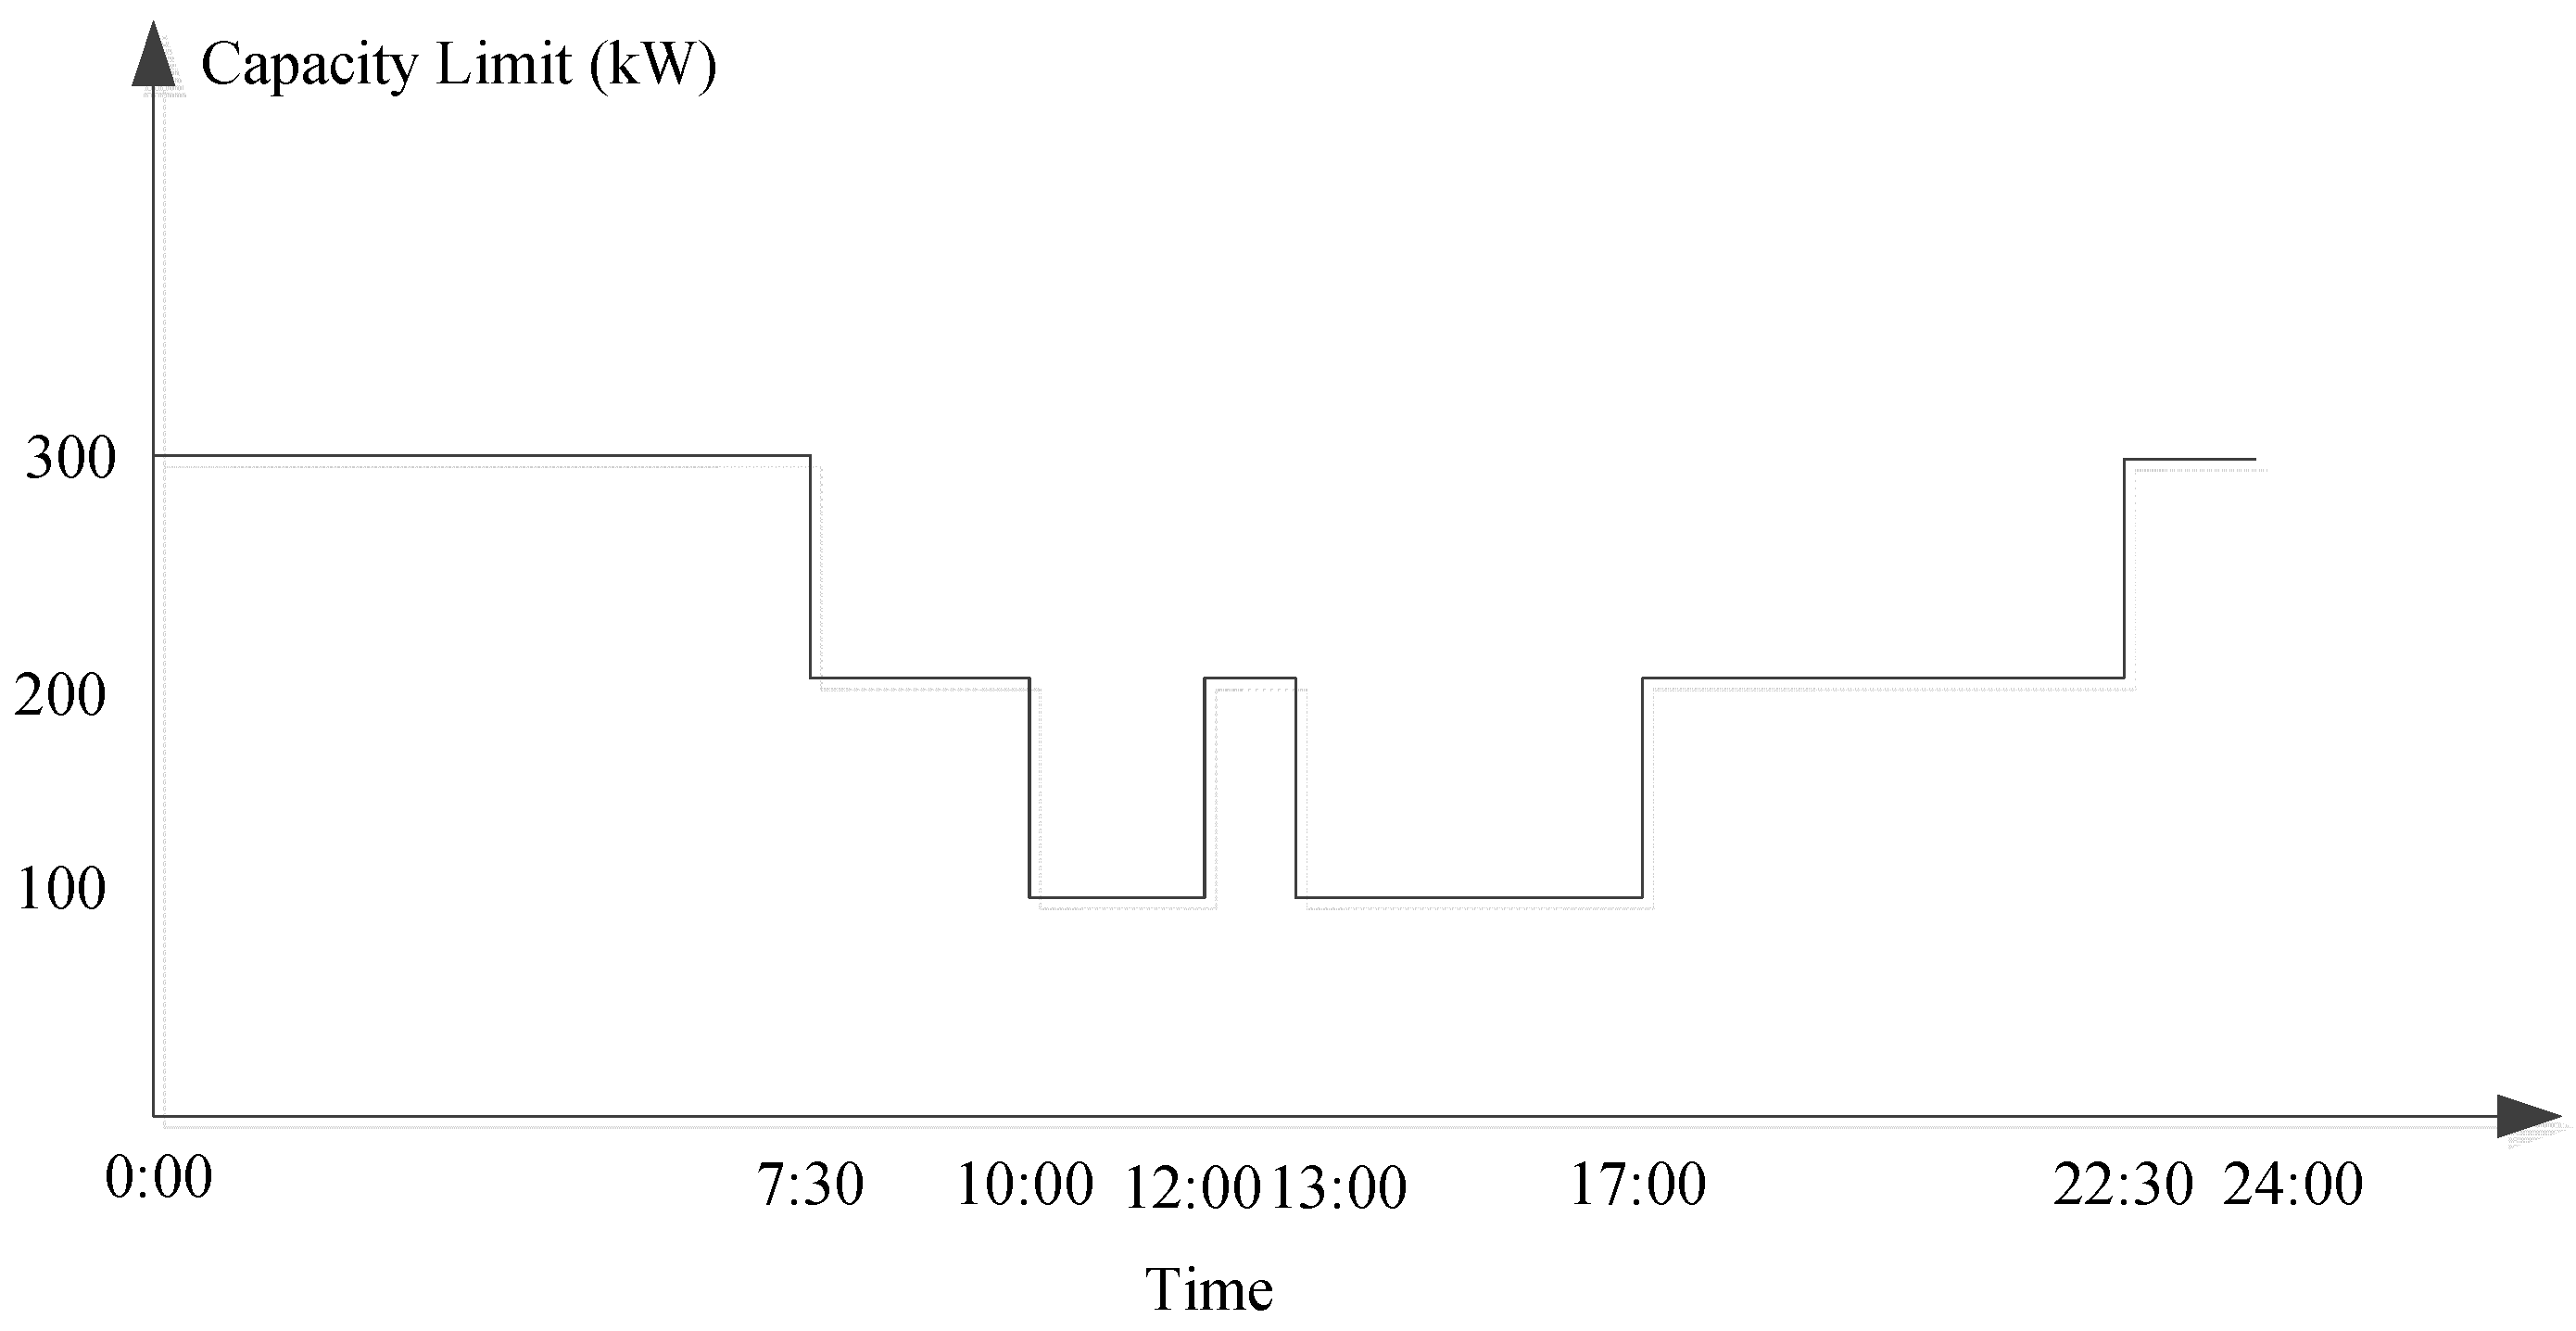
The basic capacity charge is based on the contracted capacities. The large electricity users sign three types of contracted capacities with the Taiwan Power Company, i.e., the usual contracted capacity, half-peak contracted capacity, and off-peak contracted capacity. The usual contracted capacity has the most expense, but it can be used in all the time intervals. The off-peak contracted capacity has the least expense, while it just can be used in the off-peak time period. The half-peak contracted capacity just can be used in the half-peak time period. The usual, half-peak, and off-peak contracted capacities are charged with NT$223.6/kW, NT$166.9/kW and NT$44.7/kW per month, respectively, in the Taiwan Power Company. The time interval between 12:00 and 13:00 belongs to the half-peak time period, because it is the rest time at noon. If a charging station signs the usual contracted capacity 100 kW, half-peak contracted capacity 100 kW, and off-peak contracted capacity 100 kW with the power company, the capacity limit for this charging station is shown in Figure A1. The capacity limits for the peak, half-peak and off-peak time periods are 100 kW, 200 kW, and 300 kW respectively. According to Equation (1), the basic capacity charge is 223.6 × 100 + 166.9 × 100 + 44.7 × 0 = NT$39,050 per month.
Figure A1.
Capacity limit at each time interval for the usual contracted capacity 100 kW, half-peak contracted capacity 100 kW, and off-peak contracted capacity 100 kW.
Figure A1.
Capacity limit at each time interval for the usual contracted capacity 100 kW, half-peak contracted capacity 100 kW, and off-peak contracted capacity 100 kW.

References
- Sinhuber, P.; Rohlfs, W.; Sauer, D.U. Conceptional Considerations for Electrification of Public City Bus. In Proceedings of the Emobility—Electrical Power Train, Leipzig, Germany, 8–9 November 2010; pp. 1–5. [Google Scholar]
- Hadley, S.W. Impact of Plug-In Hybrid Vehicles on the Electric Grid; Oak Ridge National Laboratory: Oak Ridge, TN, USA, 2006. [Google Scholar]
- Lopes, J.A.P.; Soares, F.J.; Almeida, P.M.R. Integration of Electric Vehicles in the Electric Power System. Proc. IEEE 2011, 99, 168–183. [Google Scholar] [CrossRef]
- Srinivasaraghavan, S.; Khaligh, A. Time Management-Deterministic Scheduling of a Fleet of Plug-in Hybrid Vehicles for Distributed Generation. IEEE Power Energy Mag. 2011, 9, 46–53. [Google Scholar] [CrossRef]
- Dow, L.; Marshall, M.; Xu, L.; Aguero, J.R.; Willis, H.L. A Novel Approach for Evaluating the Impact of Electric Vehicles on the Power Distribution System. In Proceedings of the IEEE PES General Meeting, Minneapolis, MN, USA, 25–29 July 2010; pp. 1–6. [Google Scholar]
- Liu, R.; Dow, L.; Liu, E. A Survey of PEV Impacts on Electric Utilities. In Proceedings of the IEEE PES Innovative Smart Grid Technologies, Anaheim, CA, USA, 17–19 January 2011; pp. 1–8. [Google Scholar]
- Foster, J.M.; Trevino, G.; Kuss, M.; Caramanis, M.C. Plug-In Electric Vehicle and Voltage Support for Distributed Solar: Theory and Application. IEEE Syst. J. 2013, 7, 881–888. [Google Scholar] [CrossRef]
- Cao, C.; Wang, L.; Chen, B. Mitigation of the Impact of High Plug-in Electric Vehicle Penetration on Residential Distribution Grid Using Smart Charging Strategies. Energies 2016, 9, 1024. [Google Scholar] [CrossRef]
- Green, R.C.; Wang, L.; Alam, M. The Impact of Plug-in Hybrid Electric Vehicles on Distribution Networks: A Review and Outlook. In Proceedings of the IEEE PES General Meeting, Minneapolis, MN, USA, 25–29 July 2010; pp. 1–8. [Google Scholar]
- Richardson, D.B. Electric vehicles and the electric grid: A review of modeling approaches, impacts, and renewable energy integration. Renew. Sustain. Energy Rev. 2013, 19, 247–254. [Google Scholar] [CrossRef]
- Al-Awami, A.T.; Sortomme, E.; Akhtar, G.M.A.; Faddel, S. A Voltage-Based Controller for an Electric-Vehicle Charger. IEEE Trans. Veh. Technol. 2016, 65, 4185–4196. [Google Scholar] [CrossRef]
- Nyns, K.C.; Haesen, E.; Driesen, J. The Impact of Charging Plug-in Hybrid Electric Vehicle on a Residential Distribution Grid. IEEE Trans. Power Syst. 2010, 25, 371–380. [Google Scholar] [CrossRef]
- Fernández, L.P.; Román, T.G.S.; Cossent, R.; Domingo, C.M.; Frías, P. Assessment of the Impact of Plug-in Electric Vehicles on Distribution Networks. IEEE Trans. Power Syst. 2011, 26, 206–213. [Google Scholar] [CrossRef]
- Leou, R.C.; Su, C.L.; Lu, C.N. Stochastic Analyses of Electric Vehicle Charging Impacts on Distribution Network. IEEE Trans. Power Syst. 2014, 29, 1055–1063. [Google Scholar] [CrossRef]
- Pazouki, S.; Mohsenzadeh, A.; Haghifam, M.R.; Ardalan, S. Simultaneous Allocation of Charging Stations and Capacitors in Distribution Networks Improving Voltage and Power Loss. Can. J. Electr. Comput. Eng. 2015, 38, 100–105. [Google Scholar] [CrossRef]
- Pazouki, S.; Mohsenzadeh, A.; Ardalan, S.; Haghifam, M.R. Simultaneous Planning of PEV Charging Stations and DGs Considering Financial, Technical, and Environmental Effects. Can. J. Electr. Comput. Eng. 2015, 38, 235–245. [Google Scholar] [CrossRef]
- Vagropoulos, S.I.; Kleidaras, A.P.; Bakirtzis, A.G. Financial Viability of Investments on Electric Vehicle Charging Stations in Workplaces with Parking Lots under Flat Rate Retail Tariff Schemes. In Proceedings of the 49th International Universities Power Engineering Conference (UPEC), Cluj-Napoca, Romania, 2–5 September 2014; pp. 1–6. [Google Scholar]
- Huang, F.; Sarikprueck, P.; Cheng, Y.; Lee, W.J. Design Optimization of PHEV Charging Station. In Proceedings of the Industrial & Commercial Power Systems Technical Conference, Louisville, KY, USA, 20–24 May 2012; pp. 1–7. [Google Scholar]
- Su, W.; Chow, M.Y. Performance Evaluation of an EDA-Based Large-Scale Plug-In Hybrid Electric Vehicle Charging Algorithm. IEEE Trans. Smart Grid 2012, 3, 308–315. [Google Scholar] [CrossRef]
- Martín, P.S.; Sánchez, G.; España, G.M. Direct Load Control Decision Model for Aggregated EV Charging Points. IEEE Trans. Power Syst. 2012, 27, 1577–1584. [Google Scholar] [CrossRef]
- Wang, Z.; Liu, P. Analysis on Storage Power of Electric Vehicle Charging Station. In Proceedings of the Power and Energy Engineering Conference, Chengdu, China, 28–31 March 2010; pp. 1–4. [Google Scholar]
- Mauri, G.; Valsecchi, A. The Role of Fast Charging Stations for Electric Vehicles in the Integration and Optimization of Distribution Grid with Renewable Energy Source. In Proceedings of the Integration of Renewables into the Distribution Grid (CIRED 2012), Lisbon, Portugal, 29–30 May 2012; pp. 1–4. [Google Scholar]
- Vagropoulos, S.I.; Bakirtzis, A.G. Optimal Bidding Strategy for Electric Vehicle Aggregators in Electricity Markets. IEEE Trans. Power Syst. 2013, 2, 4031–4041. [Google Scholar] [CrossRef]
- Billinton, R.; Li, W. Reliability Assessment of Electrical Power Systems Using Monte Carlo Methods; Plenum Press: New York, NY, USA, 1994. [Google Scholar]
Figure 1.
Actual wiring diagram of the charging station.

Figure 2.
The measured three-phase charging power.

Figure 3.
Time-of-use rate schedule.

Figure 4.
Solving procedure.

Figure 5.
Flow diagram of the proposed stochastic simulation.

Figure 6.
Implementation of the proposed model in the field.

Figure 7.
Cash flow for the EB charging station.

Figure 8.
Charging schedule of controlled charge of buses 1~7 for this iteration.

Figure 9.
Charging schedule of uncontrolled charge of buses 1~7 for this iteration.

Figure 10.
Charging station load profile for this iteration.

Figure 11.
The wind generation profile.

Figure 12.
Sensitivity analyses of the controlled charge.

Figure 13.
Sensitivity analyses of the uncontrolled charge.


Table 1.
Time intervals of applicable rate schedule.
| Peak | Half-Peak | Off-Peak |
|---|---|---|
| 10:00~12:00 13:00~17:00 | 07:30~10:00 12:00~13:00 17:00~22:30 | 22:30~24:00 00:00~07:30 |
Table 2.
EB charging time intervals.
| Vehicle No. | The First Charging-Time Interval | The Second Charging-Time Interval |
|---|---|---|
| 1 | 09:00~15:15 | 22:30~05:45 |
| 2 | 09:30~16:00 | 22:30~05:45 |
| 3 | 10:00~16:15 | 22:30~05:45 |
| 4 | 10:15~16:45 | 22:30~05:45 |
| 5 | 11:00~17:15 | 22:30~05:45 |
| 6 | 12:30~19:45 | 23:00~05:45 |
| 7 | 13:45~20:30 | 23:45~05:45 |
| 8~10 | 22:30~05:45 | --- |
Table 3.
Controlled charge and uncontrolled charge planning results for 1000 iterations.
| Controlled Charge | Uncontrolled Charge | |
|---|---|---|
| The average value of energy cost in one month (NT$) | 288,925 | 322,594 |
| The average value of usual contracted capacity (kW) | 119 | 250 |
| The average value of half-peak contracted capacity (kW) | 0 | 0 |
| The average value of off-peak contracted capacity (kW) | 117 | 250 |
1 USD = 31 NT$.
Table 4.
Controlled charge and uncontrolled charge planning considering the integration of wind generation.
Table 4.
Controlled charge and uncontrolled charge planning considering the integration of wind generation.
| Controlled Charge | Uncontrolled Charge | |
|---|---|---|
| The average value of energy cost in one month (NT$) | 219,950 | 265,630 |
| The average value of usual contracted capacity (kW) | 102 | 244 |
| The average value of half-peak contracted capacity (kW) | 0 | 0 |
| The average value of off-peak contracted capacity (kW) | 88 | 223 |
Table 5.
Economic analysis parameters for the charging station.
| Personnel Expense (NT$/year) | Leasing Fee (NT$/year) | Maintenance Cost (NT$/year) | Operation Revenue (NT$/year) |
|---|---|---|---|
| 12,935,000 | 5,160,000 | 500,000 | 56,291,760 |
Table 6.
Economic analysis results for the EB charging station.
| Controlled Charge | Uncontrolled Charge | |
|---|---|---|
| Present value | 272,616,000 | 267,881,000 |
Table 7.
Detailed sensitivity results of the operation revenue parameter.
| Percentage of the Current Operation Revenue (%) | Present Value of the Controlled Charge (NT$) | Present Value of the Uncontrolled Charge (NT$) | (%) |
|---|---|---|---|
| 50 | 19,792,900 | 15,058,300 | 31.44 |
| 60 | 70,357,400 | 65,622,800 | 7.21 |
| 70 | 120,922,000 | 116,187,000 | 4.07 |
| 80 | 171,487,000 | 166,752,000 | 2.84 |
| 90 | 222,051,000 | 217,316,000 | 2.18 |
| 100 | 272,616,000 | 267,881,000 | 1.77 |
| 110 | 323,180,000 | 318,446,000 | 1.49 |
| 120 | 373,745,000 | 369,010,000 | 1.28 |
| 130 | 424,309,000 | 419,575,000 | 1.13 |
| 140 | 474,874,000 | 470,139,000 | 1.01 |
| 150 | 525,438,000 | 520,704,000 | 0.91 |
Table 8.
Detailed sensitivity results of the investment cost parameter.
| Percentage of the Current Investment Costs (%) | Present Value of the Controlled Charge (NT$) | Present Value of the Uncontrolled Charge (NT$) | (%) |
|---|---|---|---|
| 50 | 323,466,000 | 318,732,000 | 1.49 |
| 60 | 313,296,000 | 308,561,000 | 1.53 |
| 70 | 303,126,000 | 298,391,000 | 1.59 |
| 80 | 292,956,000 | 288,221,000 | 1.64 |
| 90 | 282,786,000 | 278,051,000 | 1.70 |
| 100 | 272,616,000 | 267,881,000 | 1.77 |
| 110 | 262,446,000 | 257,711,000 | 1.84 |
| 120 | 252,275,000 | 247,541,000 | 1.91 |
| 130 | 242,105,000 | 237,371,000 | 1.99 |
| 140 | 231,935,000 | 227,201,000 | 2.08 |
| 150 | 221,765,000 | 217,031,000 | 2.18 |
Table 9.
Detailed sensitivity results of the government subsidy parameter.
| Percentage of the Current Government Subsidy (%) | Present Value of the Controlled Charge (NT$) | Present Value of the Uncontrolled Charge (NT$) | (%) |
|---|---|---|---|
| 50 | 237,991,000 | 233,257,000 | 2.03 |
| 60 | 244,916,000 | 240,181,000 | 1.97 |
| 70 | 251,841,000 | 247,106,000 | 1.92 |
| 80 | 258,766,000 | 254,031,000 | 1.86 |
| 90 | 265,691,000 | 260,956,000 | 1.81 |
| 100 | 272,616,000 | 267,881,000 | 1.77 |
| 110 | 279,541,000 | 274,806,000 | 1.72 |
| 120 | 286,465,000 | 281,731,000 | 1.68 |
| 130 | 293,390,000 | 288,656,000 | 1.64 |
| 140 | 300,315,000 | 295,581,000 | 1.60 |
| 150 | 307,240,000 | 302,506,000 | 1.57 |
Table 10.
Detailed sensitivity results of the personnel expense parameter.
| Percentage of the Current Personnel Expenses (%) | Present Value of the Controlled Charge (NT$) | Present Value of the Uncontrolled Charge (NT$) | (%) |
|---|---|---|---|
| 50 | 330,710,000 | 325,976,000 | 1.45 |
| 60 | 319,092,000 | 314,357,000 | 1.51 |
| 70 | 307,473,000 | 302,738,000 | 1.56 |
| 80 | 295,854,000 | 291,119,000 | 1.63 |
| 90 | 284,235,000 | 279,500,000 | 1.69 |
| 100 | 272,616,000 | 267,881,000 | 1.77 |
| 110 | 260,997,000 | 256,262,000 | 1.85 |
| 120 | 249,378,000 | 244,643,000 | 1.94 |
| 130 | 237,759,000 | 233,024,000 | 2.03 |
| 140 | 226,140,000 | 221,405,000 | 2.14 |
| 150 | 214,521,000 | 209,786,000 | 2.26 |
© 2017 by the authors. Licensee MDPI, Basel, Switzerland. This article is an open access article distributed under the terms and conditions of the Creative Commons Attribution (CC BY) license (http://creativecommons.org/licenses/by/4.0/).
Share and Cite
MDPI and ACS Style
Leou, R.-C.; Hung, J.-J. Optimal Charging Schedule Planning and Economic Analysis for Electric Bus Charging Stations. Energies 2017, 10, 483. https://doi.org/10.3390/en10040483
AMA Style
Leou R-C, Hung J-J. Optimal Charging Schedule Planning and Economic Analysis for Electric Bus Charging Stations. Energies. 2017; 10(4):483. https://doi.org/10.3390/en10040483
Chicago/Turabian StyleLeou, Rong-Ceng, and Jeng-Jiun Hung. 2017. "Optimal Charging Schedule Planning and Economic Analysis for Electric Bus Charging Stations" Energies 10, no. 4: 483. https://doi.org/10.3390/en10040483
Note that from the first issue of 2016, this journal uses article numbers instead of page numbers. See further details here.