
In Situ Stress Measurement Techniques on Li-ion Battery Electrodes: A Review


1
Collaborative Innovation Center for Electric Vehicles in Beijing, National Engineering Laboratory for Electric Vehicles, School of Mechanical Engineering, Beijing Institute of Technology, Beijing 100081, China
2
Center for Advanced Life Cycle Engineering (CALCE), University of Maryland, College Park, MD 20742, USA
*
Author to whom correspondence should be addressed.
Energies 2017, 10(5), 591; https://doi.org/10.3390/en10050591
Submission received: 16 March 2017
/
Revised: 16 April 2017
/
Accepted: 19 April 2017
/
Published: 27 April 2017
(This article belongs to the Special Issue Advances in Electric Vehicles and Plug-in Hybrid Vehicles 2017)
Abstract
:Li-ion batteries experience mechanical stress evolution due in part to Li intercalation into and de-intercalation out of the electrodes, ultimately resulting in performance degradation. In situ measurements of electrode stress can be used to analyze stress generation factors, verify mechanical deformation models, and validate degradation mechanisms. They can also be embedded in Li-ion battery management systems when stress sensors are either implanted in electrodes or attached on battery surfaces. This paper reviews in situ measurement methods of electrode stress based on optical principles, including digital image correlation, curvature measurement, and fiber optical sensors. Their experimental setups, principles, and applications are described and contrasted. This literature review summarizes the current status of these stress measurement methods for battery electrodes and discusses recent developments and trends.
1. Introduction
Li-ion batteries are used to power electrified vehicles due to their high energy density, high power density, environmental friendliness, and low cost. In China, there were 146,720 new registrations for battery electric cars in 2015 [1]. These Li-ion battery-powered vehicles were supported by financial subsidies from the central government. However, these onboard batteries can suffer performance degradation from harsh working conditions [2]. The possible failure modes related to electrode stresses might be particle fracture and electrode porosity reduction, which can reduce capacity and power. During the lithiation and delithiation of Li-ion batteries, the induced mechanical stress generated by versatile factors is a multifaceted complex issue. One of its most important causes is rooted in the inhomogeneous electrode stress accumulation.
Under electrochemical cycling, electrode stresses are indirectly reflected either by the dimensional change or by the surface pressure of a whole battery because both cathode and anode are integrated with the separator, electrolyte, and current collectors inside a battery case. The variable thickness of a battery is commonly used to represent its dimensional change, the measurement of which can be obtained by using a linear voltage displacement transformer (LVDT) [3,4,5], a dilatometer [6], a thickness gauge [7], or X-ray observation [8]. In order to obtain three-dimensional changes of a cycling Li-ion battery, Leung et al. [9] presented the application of three-dimensional digital image correlation for real-time displacement and strain analysis of a pouch-type battery. The electrode active materials [3,10], state of charge (SOC) [4], operating temperature [5], electrolyte formulation [6], and design and construction [7,11] all affect battery expansion and contraction. In the micro aspects of the electrode deformation, the mechanical stress and strain correlate with the electrochemical effect. The graphite-electrode stress and strain can be differently influenced by diffusion of lithium ions [12]. In the Si-lithium systems, the electrode stress can also affect the chemical potential change [13,14]. And the compressive stress can impede electrode lithiation to cause an extra over-potential [15]. In the macro aspects, battery swelling has a significant effect on battery cycle lives, as shown by an experiment conducted by measuring the surface pressure of pouch-type batteries [16].
Composite electrode stress must be directly measured inside a cycling cell for the following reasons. First, the thickness changes and surface pressure of a whole battery cannot reliably characterize the evolution of electrode stress because they result from interaction among the cathode, anode, separator, electrolyte, current collector, and case. Second, it is helpful to understand the mechanism of battery performance degradation caused by the electrode stress. Third, electrode stress growth factors can be discriminated for battery design and optimization. Lastly, electrode stress measurements are vital for the validation of battery stress models and thus for a reliable battery package design that is protected from fast performance degradation.
A key aspect of developing in situ invasive techniques is to investigate the battery lifespan and the underlying degradation stemming from the electrode stress evolution and to construct a promising battery management system based on verified mechanical deformation model and degradation mechanisms for the mitigation of safety concerns of Li-ion batteries by non-electrochemistry approaches.
Until now, there have been no reviews of in situ measurement techniques for electrode stress. The objective of the paper is to make a survey of these methods, with a focus on electrode active materials that are commercially used for Li-ion batteries in electric vehicles. The three main methods used for in situ measurements of electrode stress and strain include digital image correlation (DIC), curvature measurement method (CMM), and fiber optical sensor (FOS). The advantages and disadvantages of each method are shown in Table 1. In the following subsections, each of these measurement methods is described, analyzed, and assessed.
2. Digital Image Correlation
The DIC is a non-contacting optical technique to acquire, store, and process digital images of an object for measurements of full field shape and deformation, based on the minimization of the gray value difference between two small subsets from an unloaded template to a loaded image [17]. This computer-vision-based measurement approach was first introduced to measure surface displacements of an aluminum specimen reported in 1982 [18]. The DIC method has been widely used in mechanical engineering, civil engineering, materials science, electronic packaging, biomedical, and automation.
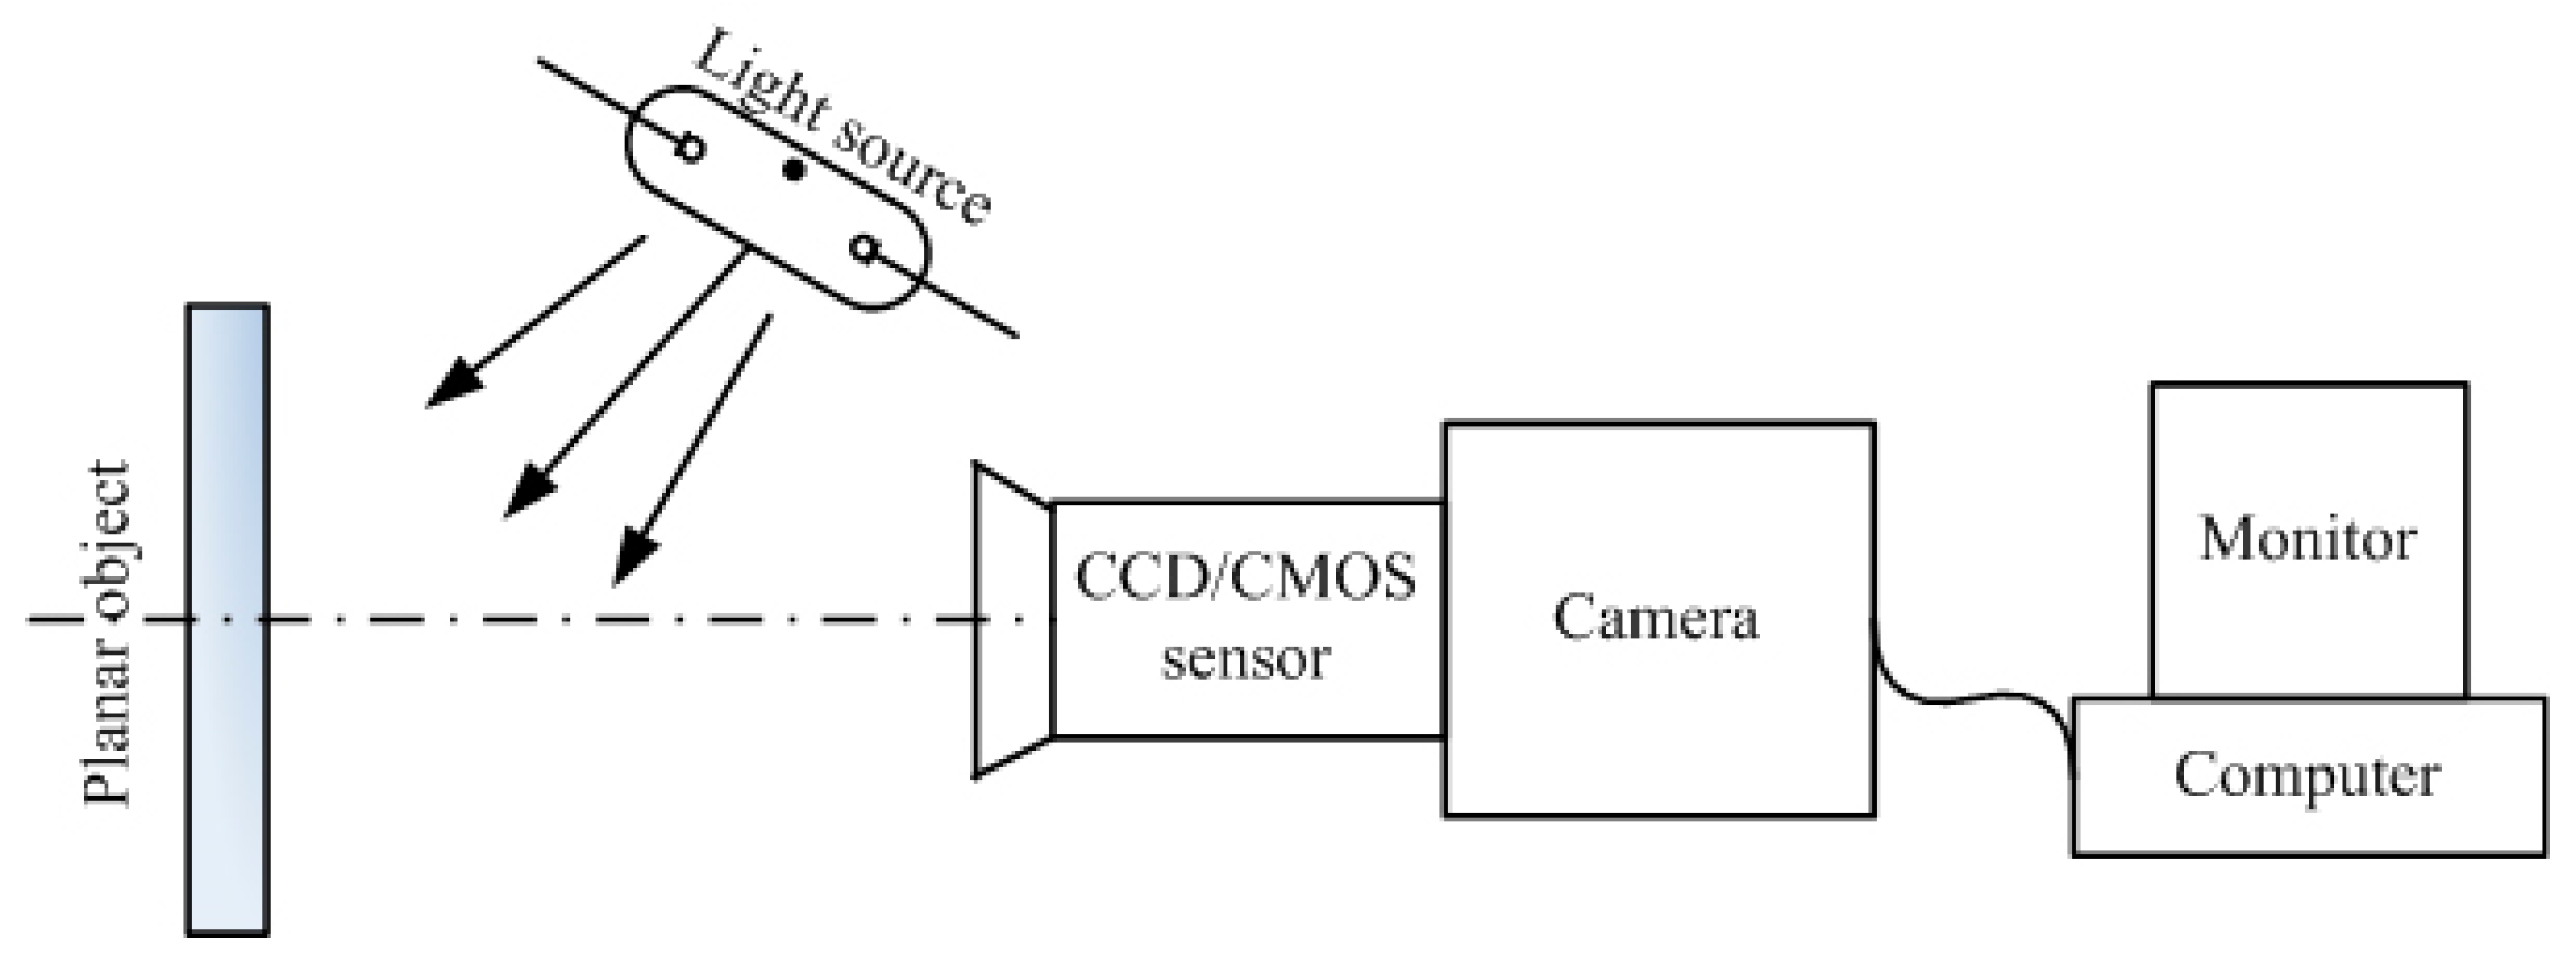
For deformation measurements of a plane, the 2D-DIC system is often used due to its simple experimental setup. The measurement system generally includes a planar object, one light source, one camera, and one computer, as shown in Figure 1. Illuminated by either a man-made white light or natural light, the object surface in random gray intensity distribution is observed to capture the deformed information. The camera digitally records the undeformed and deformed surface images, which are matched and numerically computed to obtain information about the expected deformation. High-quality cameras can measure the surface deformations of a material at an accuracy of ±0.01 pixels and a point-to-point accuracy of ±100 με for the in-plane strains through the DIC technique [17,19].
The DIC method’s performance depends heavily on the quality and numerical computation of the collected image. For the high-quality images recorded before and after deformation, the object specimen should be planar, parallel to either the charge-coupled device (CCD) or complementary metal-oxide-semiconductor (CMOS) camera, and deformed in plane. Once the high-quality digital images are captured, the numerical computation algorithm will be applied for object deformation calculation. With the assumption that pixels inside a subset have the same light intensity distribution in the two images before and after deformation, the DIC approach has three basic steps. First, virtual meshing is used to form subsets in the undeformed image. Second, correlation criterion should be determined for matching the two images before and after deformation. Third, the similarity of the undeformed and deformed subsets is evaluated using the predefined correlation criterion. The accuracy improvement and error analysis of the 2D-DIC method for strain measurement can be found in the review literature [19].
An experimental cell with a glass window needs to be specially made in order to use the DIC approach for investigating electrode deformation. Compared to commonly used solid materials such as steel, aluminum, and cement, it takes much more time to prepare the electrode specimen for this optical measurement technique for the following reasons. First, the spatial dimension between two electrode faces is generally less than 100 μm for observation. Second, the thin film electrode is in the order of microns. Third, a cell should be carefully fabricated to prevent short circuiting between electrodes because of the very short distance between them. Fourth, all cell parts should be dried in a heated chamber. Finally, a cell has to be assembled in an argon-filled glovebox for injected moisture-sensitive electrolyte.
Graphite electrode strain growth has been explored by using the DIC approach. Qi and Harris [20] first used the DIC technique to investigate the micro-structural strain in a graphite anode made from a commercial Li-ion battery during lithium intercalation in real time. Displacement vectors were first calculated and then converted to strain fields to map the lithiated graphite electrode at different SOC levels. Their results indicated that electrode stress evolution was non-uniform because the anode graphite close to the separator could be easily intercalated by lithium ions and the region near the electrode plate center could swell and others could contract. Moreover, electrode cracks can affect stress evolution because lithium ions enter electrodes from the cracks. Additionally, it is unreliable to calculate local strains of the anode graphite through the modulus of individual graphite crystallites because of electrode porosity and different modulus. After Qi and Harris’s experiment, graphite electrodes fabricated from graphite powder, carbon black, and binder were selected as the working electrodes to be observed for how the current collectors influence the electrode stress [21,22]. Meanwhile, the counter electrodes were simplified to Li-metal film instead of Li-metal oxides. On one hand, it was found that the deformation of current collector became a hurdle to precisely measure the lithiated graphite electrode strain. During lithiation and delithiation, the strain measurements of a free standing graphite electrode agreed with the predicted results [21]. On the other hand, a thick current collector made the strain change of the graphite electrode less than the thin [22].
Because of variable modulus related to the Li-ion concentration, the DIC technique cannot be used to directly measure electrode stresses, but can be employed to observe the strain evolution of a whole electrode. For a strain analysis of lithiated graphite electrodes by the DIC approach, image quality can be improved through the light source, electrode surface speckles, and camera resolution. Jones et al. [21] used both laser and speckle pattern to enhance image quality. A 532-nm laser beam was selected as the light source for photos used for strain analysis because laser light has better intensity, uniformity, and stability than natural light. To improve correlation of the graphite electrode speckle patterns, fluorescent silica nano-particles were synthesized and spin-coated onto the electrode surface. A high-resolution camera can also be used to take high-quality images. Chen et al. [22] used a more than 4-million-pixel scientific digital camera with a 10× long-distance lens to collect high-clarity images for strain analysis, the observed image size of which was reduced to 1 mm × 1 mm.
3. Curvature-Measurement Method
Stresses in electrode films deposited on substrates can be measured by optically observing the curvature of the substrate. This curvature-measurement method originates from an analytic solution to the stress investigation of metallic films deposited electrolytically by Stoney in 1909 [23]. Both the laser-beam-position detector (LBPD) [24,25,26,27,28,29] and multiple-optical-stress sensor (MOSS) [30,31,32,33,34,35,36,37,38] were developed to measure the film stress and have been applied for in-situ stress measurements of Li-ion battery electrodes.
3.1. Laser Beam Position Detector
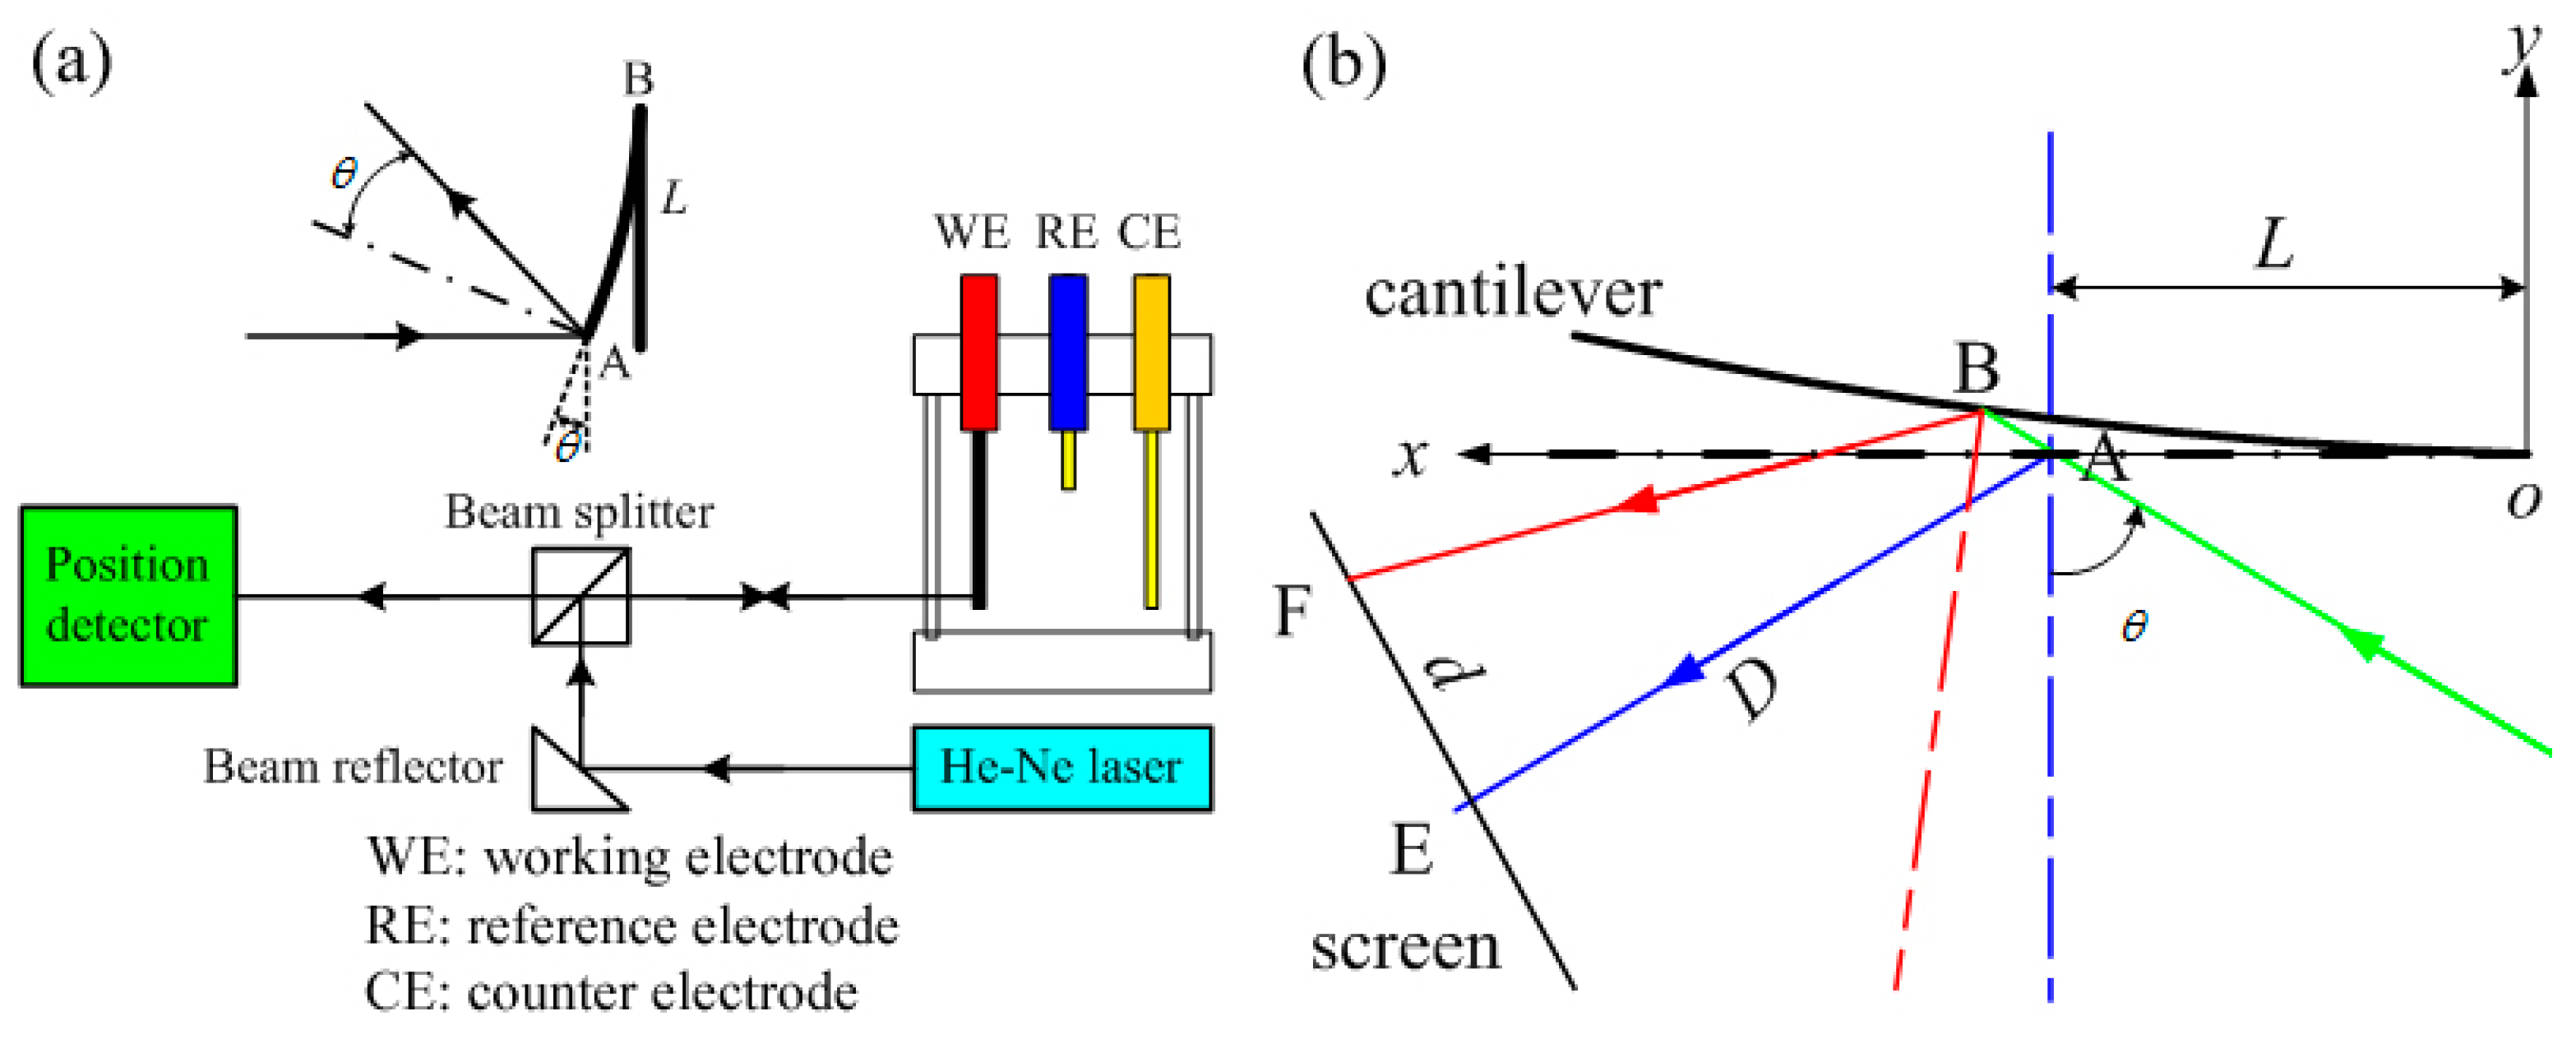
In 1989, Scarminio et al. [24] first built the LBPD as shown in Figure 2a based on the Stoney equation to measure the curvature evolution of a Pd electrode during a variety of electrochemical reactions. The He-Ne laser generator produces a laser beam striking on the beam reflector, the reflective beam of which strikes on the beam splitter. In the beam splitter, the laser beam is split into two beams, one for the incident beam striking on the position detector, and the other for the incident beam striking on the lower end of the thin-film working electrode. The reflective beam on the terminal passes through the beam splitter and also strikes on the position detector. These two incident beams have different positions on the detector and make it output a difference signal that is linearly proportional to the deflection angle θ. By the Stoney equation, the stress evolution of a thin-film working electrode in electrochemical reactions can be obtained as follows:
where Es and vs denote the Young’s modulus and Poisson’s ratio of the substrate respectively. df and ds denote the thickness of the film and substrate, respectively. σκ denotes the deformation stress of the thin-film electrode. Rκ denotes the curvature radius of the film expressed as follows:
where L denotes the distance between the measurement position and fixed terminal (the length of a sample electrode), and θ denotes the deflection angle to record deformation of the thin-film electrode.
However, the deflection angle can be measured only if an incident beam strikes on the free terminal of a cantilever in Equation (2). Assuming that the deflection is much smaller than the cantilever length, Moulard et al. [25] provided a simple solution to the curvature at any position of a cantilever. The schematic used to calculate the curvature of a cantilever is shown in Figure 2b. An incident beam strikes on the flat cantilever as denoted by position A, and its reflection strikes on the screen as denoted by position E. This incidence strikes on the bending cantilever denoted by position B, and its reflection strikes on the screen denoted by position F. The curvature radius of the bending cantilever can be expressed as:
where D denotes the distance between points A and E, and d denotes the distance between points B and F.
The He-Ne laser beam is commonly used in the LBPD technique due to its low cost, easy operation, spatial coherence, and long coherence length. When stress on a film electrode is explored, one terminal of the electrode needs to be held mechanically, and the other is relaxed. Moreover, this film electrode must be bonded with a mirror substrate for laser reflection that is adaptive to evolution of this substrate curvature. The ~175 μm thickness of the substrate should be much less than that of the film electrode so as to respond to an average deformation of the bonded film electrode. Separators may not be necessary for experimental Li-ion cells because the working electrodes bend freely with a big gap between electrodes. A low-cost CCD camera is also needed to record movements of this reflection beam, the displacement of which indicates average strain and stress on the film electrode.
The LBPD technique has been employed to investigate the influence of electrode materials, lithium concentration, phase transition, and SEI formation on stress generation and evolution. Rosolen and Decker [26] used a laser-beam detector to study the influence of active grain morphology on electrode stress in three types of film carbon electrodes when Li-ions intercalated and de-intercalated in a three-electrode cell sealed in a rectangular solid optical box, the reference and counter electrodes of which were Li metal. Different stress evolution was found for three carbon electrodes with different active grain shapes. Chung and Kim [27] observed the phase transition of the LiMn2O4 electrode through in situ measurements of electrode strain during voltammetry or galvanostatic cycles in the 4 V range. During electrochemical cycling, Pyun et al. [28] observed the stress generation of the film LiCoO2 electrode during Li-ion transport in a three-electrode cell. Moreover, the relationship between the stress increment and SOC resulted from the galvanostatic intermittent titration discharge that approximated the relationship between the electrode potential step and SOC. The surface stress of the film electrode can also be generated by SEI formation. Tavassol et al. [29] developed two types of experimental cells fabricated with electrode materials of Au and Li metal soaked in different electrolytes for validation of the residual tensile stress resulting from the SEI layer formation. Their results showed that the SEI oligomer formed from the carbonate had an effect on electrode stress evolution.
3.2. Multi-Beam Optical Stress Sensor
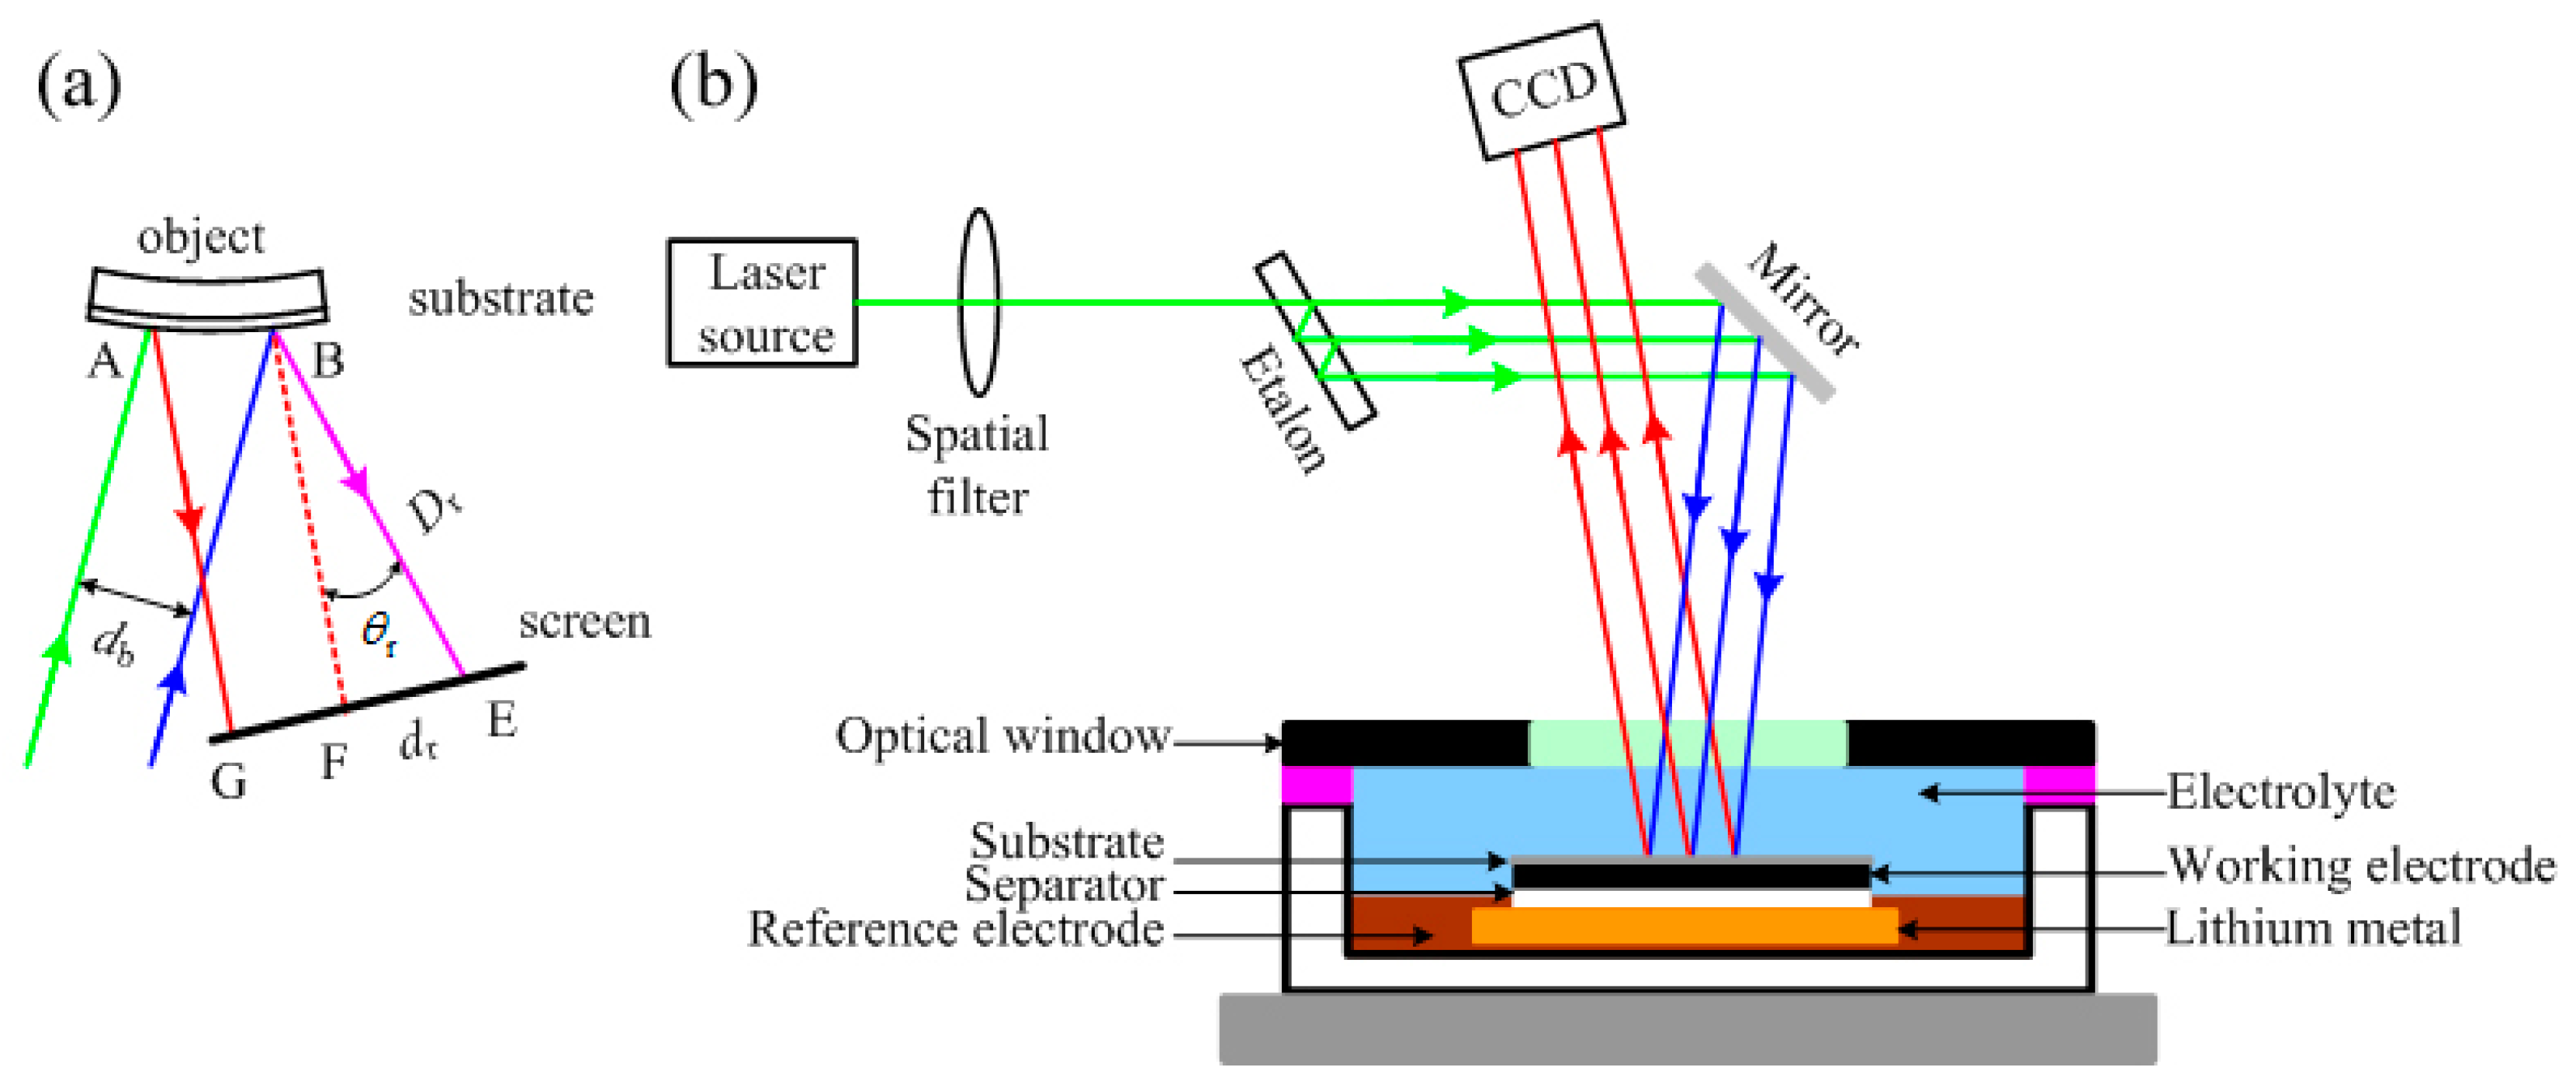
Due to the LBPD technique’s sensitivity to the mechanical vibration of the specimen, Chason and Sheldon [30] presented a multi-beam method to obtain the film stress on the basis of the Stoney theory as illustrated in Figure 3a. If two beams strike on different positions of the substrate or film, the distance between their reflections will change with the varying curvature of the specimen. The curvature radius is related to this distance and calculated by:
where dr is a variable distance between the two reflections, db denotes the distance between the two incident beams, and Dr represents the distance between the beam detector and the incident beam spot on the specimen. θr denotes the deflection angle between the two reflection beams in Figure 3a.
When there are more than two beams used for Equation (4), the distances between the adjacent beams can be averaged to reduce calculation errors. The multi-beam technique can be employed to measure the stress evolution of a film object, called the MOSS, the experiment schematic of which is usually applied for measurements of electrode stress as shown in Figure 3b. The etalon is an optical element with highly reflective and parallel faces, through which a linear array of multi-beams is formed. These multi-beams striking on the specimen are parallel and have nearly uniform intensity. The corresponding reflective beams are imaged on the CCD detector. This detector converts the light signals to electric signals acquired by a computer. The stress accuracy of a specimen is dependent on the beam spacing. Generally, the tested film electrode is placed horizontally, the bonded substrate of which is on the top level to reflect the incident laser beam. For the in situ cathode stress measurement by the MOSS, the cell specimen usually consists of the working electrode (cathode), lithium foil electrode, separator, and electrolyte. An optical window allows the laser beam pass-through to detect the cathode stress changes.
The MOSS method was first used to observe stress evolution in Si anodes during electrochemical lithiation and delithiation, by which mechanical dissipation, modulus, and electrical potential of the Si anode can be estimated [13,31,32]. During lithiation, the mechanical dissipation in a Si-film electrode is comparable to the polarization loss [31]. The elastic modulus of the Si anode is not a constant, but a function of Li concentration [32], and the ratio of potential change to stress change was measured to be in the range of 100–125 mV/GPa so that the existence of stress-potential dependence in a lithiated-Si system was demonstrated [13].
Except for Si electrodes, the MOSS technique has been used to study the influence of grain orientation, wetting process, lithium concentration, C-rates, and SEI formation on the graphite-based anode and cathode stresses. Mukhopadhyay et al. [33,34] used the in situ optical approach to analyze stress growth of the graphite film electrode affected by its graphitized axis orientation in a cell design. Sethuraman et al. [35] and Nadimpalli et al. [36], respectively, studied stress evolution of a dry graphite anode or nickel cobalt manganese (NMC) cathode soaked with electrolytes. Electrode stress can be not only induced by Li-ion concentration, but also be influenced by the discharge or charge rate used [35]. Through stress growth of different thickness electrodes, Mukhopadhyay et al. [37] thought the irreversible stress of graphite electrode was primarily associated with the SEI layer formation in the first cycle, which was also validated by a coated material technique [38].
4. Fiber Optic Sensor
Because special optical windows are made on cells, large volume, and high cost, it is difficult to use the DIC and curvature measurements to probe electrode stresses for the battery management system in electric vehicles. Except for the commonly used resistance-strain sensors, fiber optical sensors can potentially be integrated with cells to monitor electrode stresses in commercial Li-ion batteries.
Since the first fiber Bragg grating (FBG) sensors were invented in 1989 [39], they have been widely used for measurements of strain and temperature in many fields such as civil engineering [40], composite materials [41], power systems [42], and satellites [43]. The FBG sensors are light-weight and small; there is no electrical power at the sensing points; and the sensors are immune to electromagnetic interference (EMI). FBG sensors have two additional advantages over other fiber optical sensing schemes. One is an inherent self-referencing capability—the grating encodes an absolute wavelength to be reflected to the light detector without dependence on total light levels, losses in the connecting fibers, and couplers or source power. The other is the distributed sensing capability—each FBG sensor is assigned a different slice of the available source spectrum to conduct wavelength division multiplexing in an optical fiber sensing network.
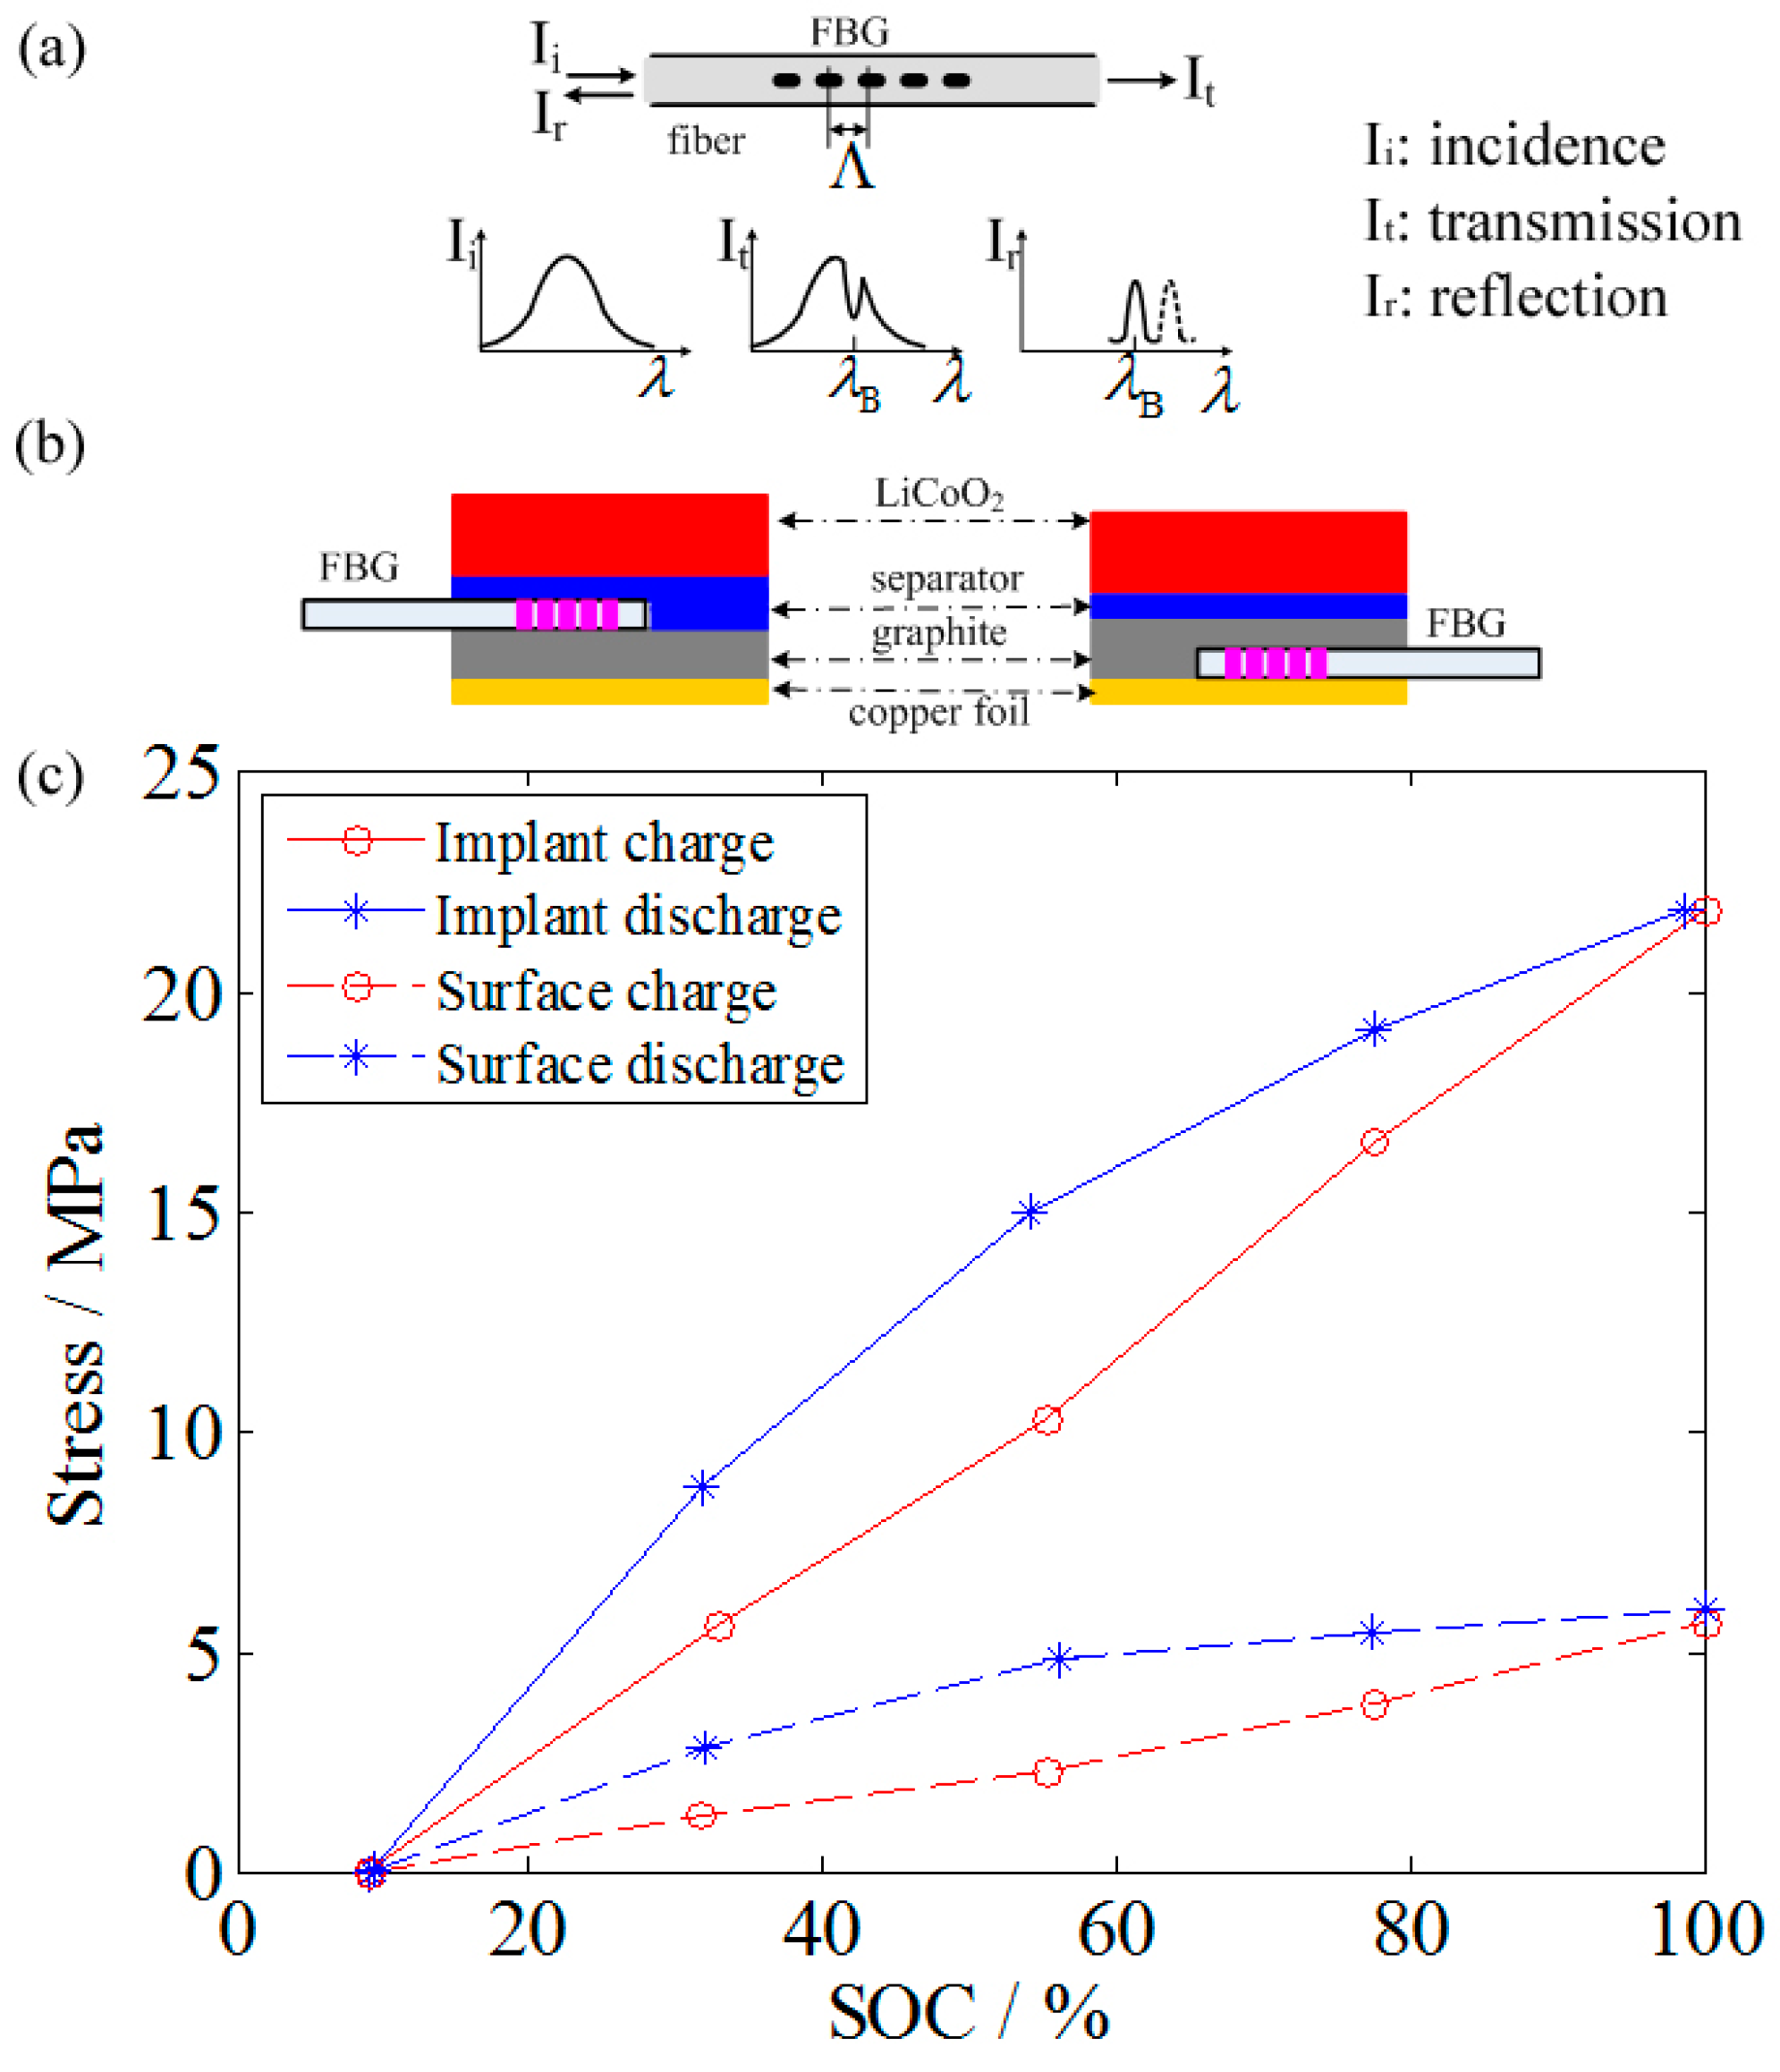
An FBG sensor is imprinted with a specific light wavelength and can be embedded in the core of a fiber as shown in Figure 4a [44]. When an incident light passes through the FBG sensor, one narrow-band light is reflected at the Bragg wavelength, the other wavelengths get transmitted through the grating. The wavelength of maximum reflectivity is proportional to the grating period and to the effective refractive index.
where λB denotes the Bragg wavelength, Λ denotes the effective refractive index of the optical fiber, and neff denotes the period of the FBG.
The Bragg wavelength is affected by both strain and temperature, the shift of which can be detected by the light detector. Due to the physical elongation of the FBG sensor and the change of refractive index caused by photo-elastic effects, the strain is induced in the FBG sensor. The corresponding change of the Bragg wavelength can be expressed as:
where ε is the longitudinal strain on the FBG and is the effective photo-elastic coefficient of the fiber core material.
where and are the Pockel’s coefficients of the strain optic tensor, and μ is the Poisson’s ratio.
The second measurand influence of interest on the FBG is the temperature dependence of the Bragg wavelength due to two main effects: the change of the index of refraction of the optical fiber caused by temperature and the thermal expansion of the fiber. The shift in the Bragg wavelength due to temperature change can be expressed as:
where ΔT is the change in temperature located at the FBG sensor, α denotes the thermal expansion, and ζ denotes the thermo-optic coefficient.
Measurement of the stress evolution of Li-ion battery electrodes has been performed on Li-ion batteries using FBG sensors. Bae et al. [45] made an FBG sensor attached or built into the graphite anode of a lithium cobalt oxide Li-ion cell to directly detect dimensional changes as shown in Figure 4b. Peak shifting or splitting at the Bragg wavelength was observed with the FBG sensors attached to or implanted within the battery anode at the fully charged state (100% SOC). Monotonic peak shifting occurred for the attached FBG sensor, whereas more complex shape changes with two split peaks occurred for the implanted FBG sensor. The reason was that the attached FBG sensor was loaded by the axial strain from swelling or contraction of the anode electrode, and the implanted sensor was entirely surrounded by graphite particles and affected simultaneously by accumulated longitudinal as well as transverse strains due to the swelling or shrinkage of the anode electrode.
The shift in the Bragg peak wavelength worked as a function of SOC [45]. More noticeable wavelength shifting in both attached and implanted FBG sensors was observed at the end of the SOC steps; this phenomenon corresponded to the larger volume change in graphite material when Li-ions were completely intercalated or de-intercalated. Additionally, both FBG sensors showed similar peak wavelength behavior, whereas the implanted FBG sensor had better detection sensitivity because it showed three times larger peak shifting (about 390 pm) compared to the attached FBG sensor (about 110 pm) at 100% SOC. Based on Hooke’s law and the physical parameters of the FBG sensors, the stresses at 50% and 100% SOC on the FBG sensors were calculated to be 2.2 MPa and 6.0 MPa for the attached type and 10 MPa and 22 MPa for the implanted type as shown in Figure 4c, respectively.
Although the stress values collected by the attached FBG sensor are at most one-quarter of that seen in the implanted FBG sensor in Figure 4c, similar stress evolution trends are present for these two FBG sensors. Therefore, the attached FBG sensor may characterize the electrode stress evolution. Compared to the implanted FBG sensor, the attached FBG sensor hardly affects battery performance, is more easily integrated with batteries, and is less expensive. In addition, testing should be conducted on optimal FBG sensor placement for electrode stress evolution monitoring. If the FBG sensor is embedded or attached to an electrode, the impact of the sensor on battery degradation needs to be evaluated.
5. Factors That Influence Electrode Stress Generation
Electrode stresses can be affected by many factors such as electrode materials, lithium concentration, grain phase transformation, solid electrolyte interface, metal dendrites, current collector, temperature, C-rates, cycles, and external force. Using the above-stated measurement techniques (Section 2, Section 3 and Section 4), the influence that factors have on electrode stress growth has been investigated, as shown in Table 2, and relevant data as shown in Table 3.
5.1. Electrode Materials
In most used electrode materials for commercial Li-ion batteries, Li-metal compounds (e.g., LiCoO2, LiFePO4, LiMn2O4, and three compounds (NMC and NCA (nickel cobalt aluminum)) are used as cathode materials, and either carbon or Li4Ti5O12 is used as anode materials. These electrode materials exhibit different volume changes upon lithium (de)intercalation, relevant data of which can be found in the literature [47]. When lithiated, carbon can yield a maximum volume change by 12.8% and Li4Ti5O12 has no shape variation in current electrode materials for commercial Li-ion batteries. When delithiated, in volume some cathode materials expand, for examples, 1.9% for LiCoO2 and 2.44% for NMC, and some contract, for examples, 7.3%, 6.6%, and 1.16% for LiMn2O4, LiFePO4, and NCA. Volume change indicates electrode stress variation.
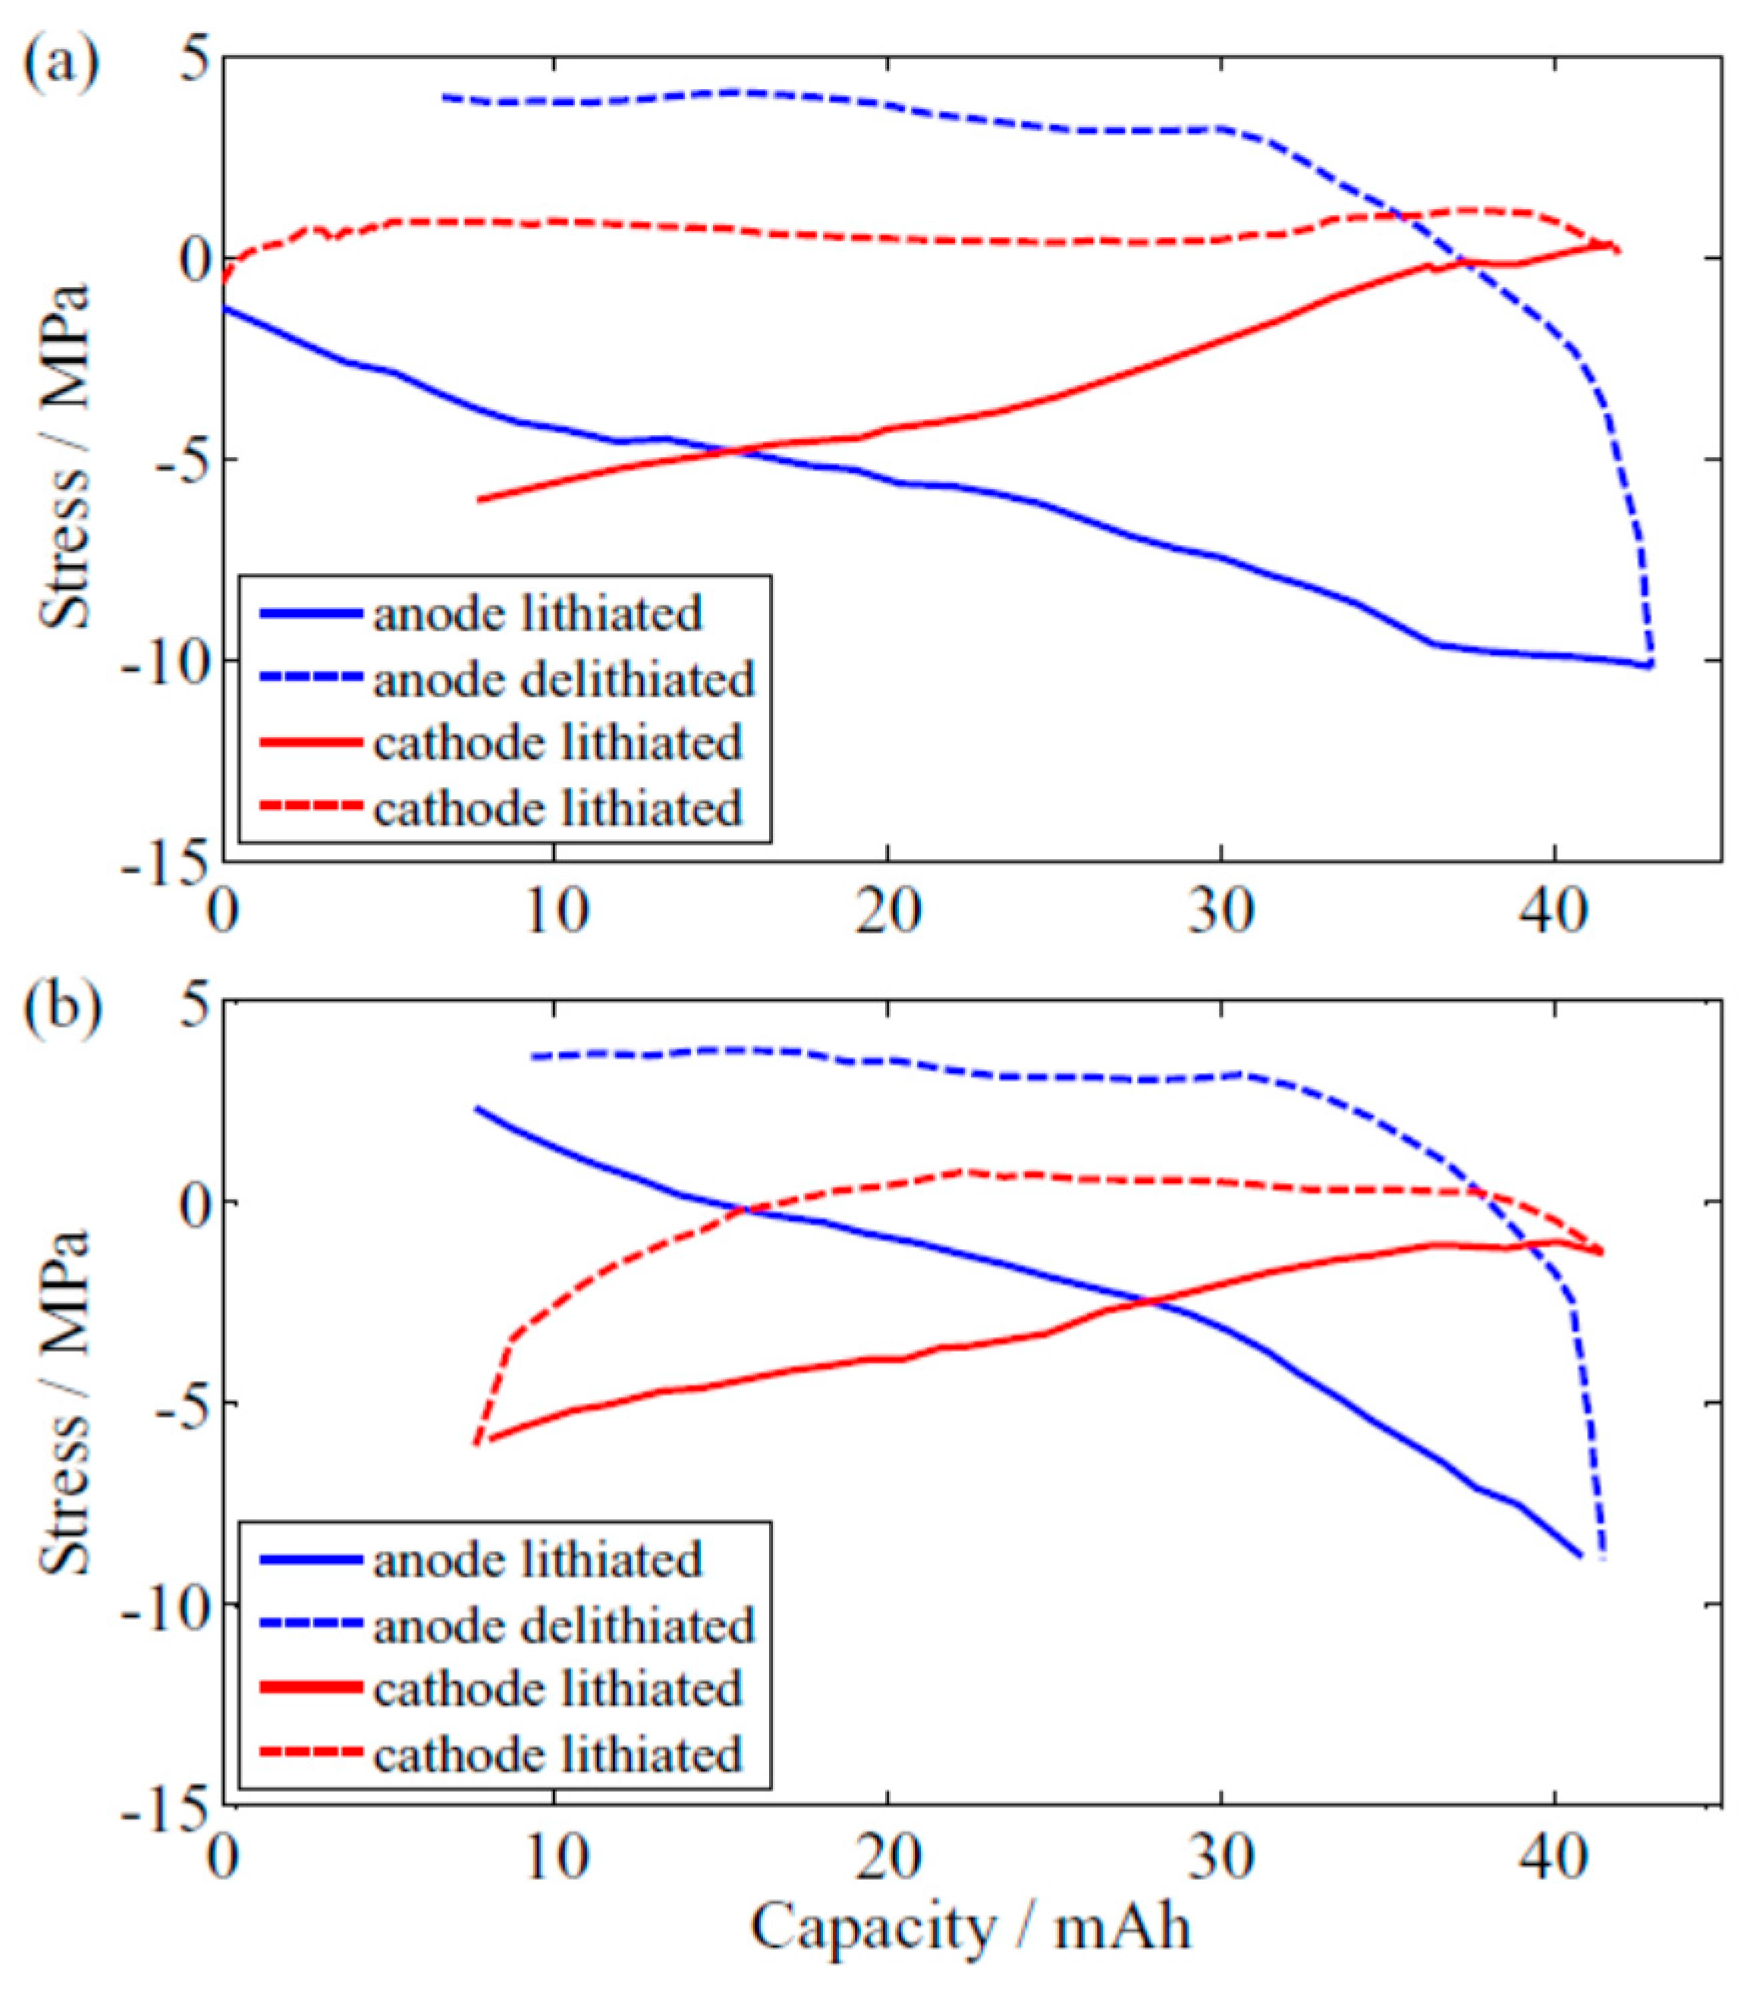
Stress evolution of composite electrodes results from lithium (de)intercalation. During the lithiation process in the first and second electrochemical cycles, either the graphite anode or NMC cathode can experience a compressive stress that increases with lithium concentration as shown in Figure 5 [36]. When the graphite anode is delithiated, its compressive stress has a tendency to decrease and change as a tensile stress. However, there is no clear evolution tendency of cathode stress during the delithiation process. Either way, the induced electrode stress is non-monotonous and non-linear, which is related to electrode constitution, microstructure, shape, dimension, and processing technique under the same operation conditions. It also can be seen that both the anode and cathode stresses are non-complementary during either lithiation or delithiation periods. In other words, the induced stress values of the lithiated anode and delithiated cathode are not equal and their directions are not yet completely opposite, and vice versa.
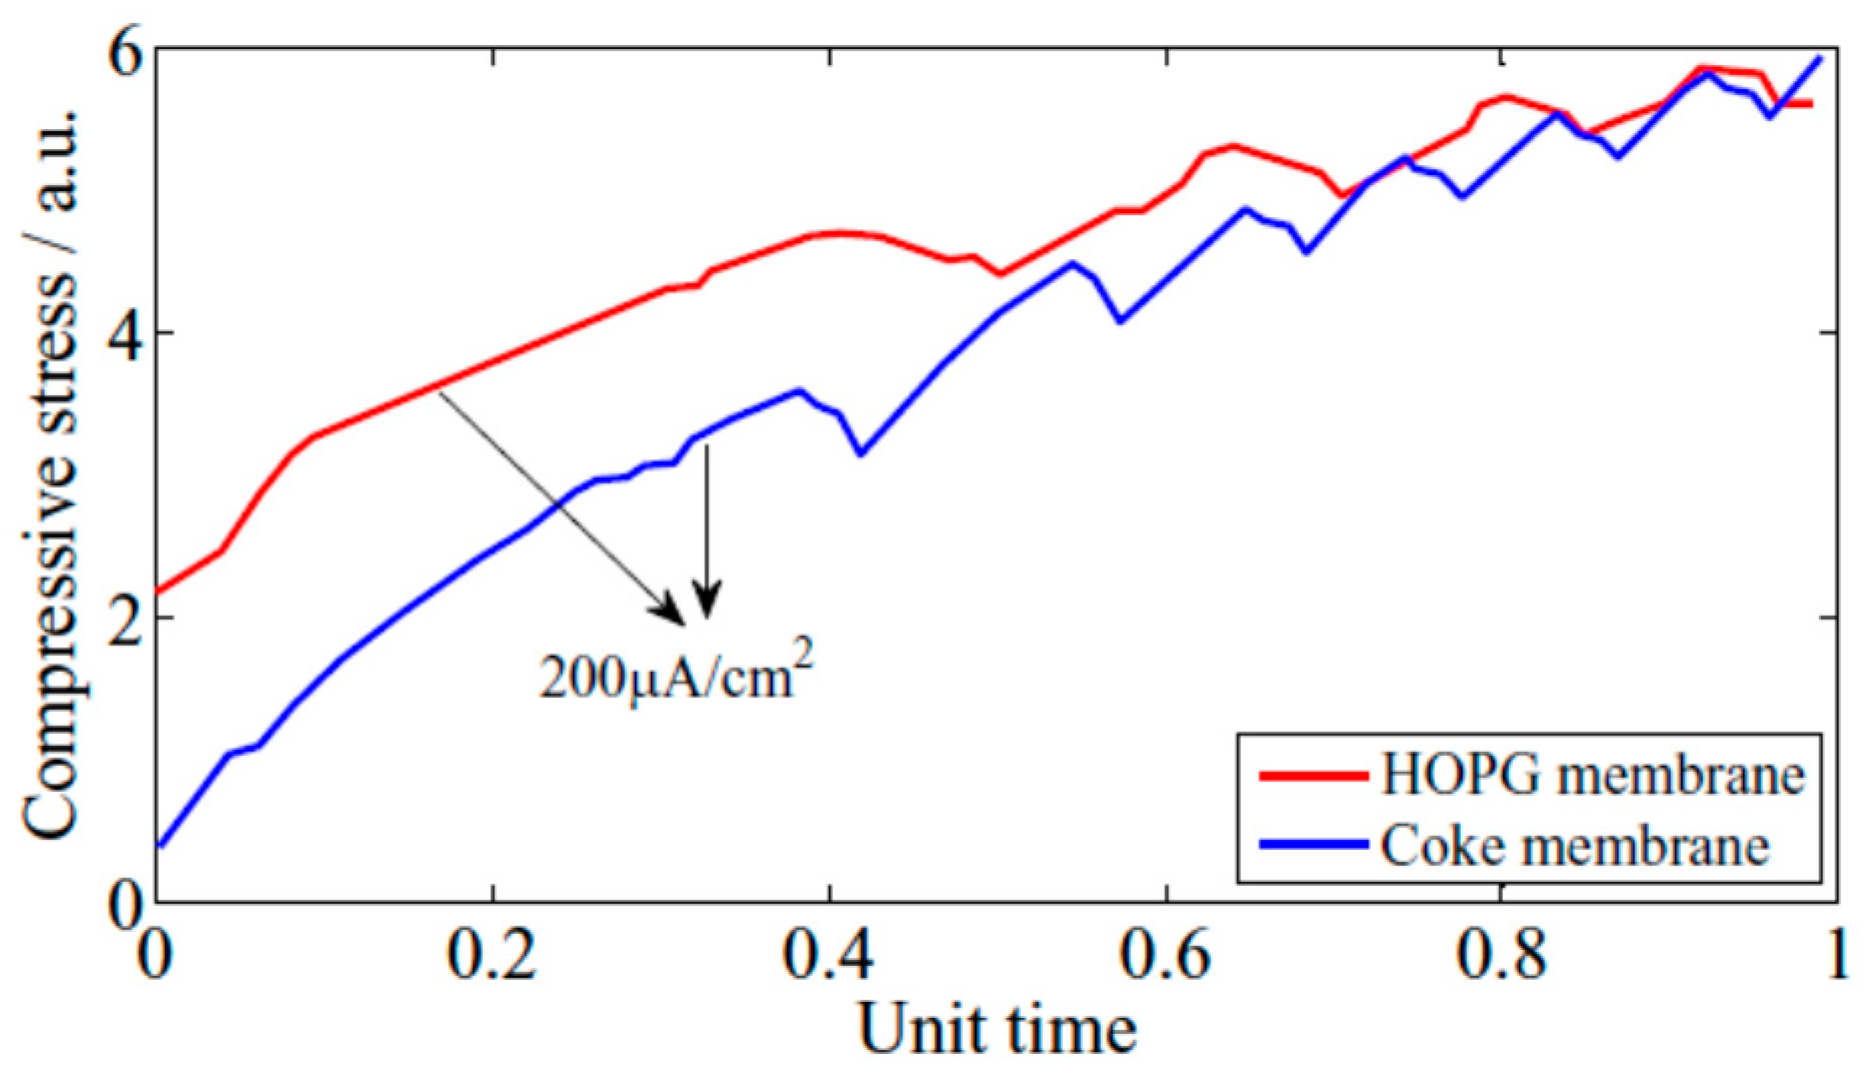
Active grain morphologies such as grain shape and orientation affect electrode stress generation and evolution. Rosolen and Decker [26] studied the characterization of the strain sources in two types of highly oriented pyrolytic graphite (HOPG) and coke membrane electrodes. The scanning electron microscopy (SEM) images of carbon electrodes showed that the HOPG electrode grain was highly crystalline, and the coke electrode had a wrinkled surface. Every working electrode was integrated in a three-electrode cell, the reference and counter electrodes of which were lithium metal. By in situ measurements of electrode stresses, the electrode deformation was irreversible and increased with the number of galvanostatic cycles during different periods as shown in Figure 6. Charged at the same current density of 200 uA/cm2, two membrane electrodes generated their own start-stresses about 2.1 a.u. for the HOPG electrode and 0.4 a.u. for the coke electrode, respectively. Then, there were increasing irreversible stresses on both of the membrane electrodes had with time. The HOPG electrode experienced bigger irreversible stress values than the coke electrode. With time increasing, the irreversible stress values of the coke electrode are close to that of the HOPG electrode. Both the HOPG and coke electrodes exhibit their own stress generation and evolution, which can originate from different volumetric change of active grains induced by lithium-ion intercalation and de-intercalation. Porosity is one of the most important factors to change electrode volume. By comparison of SEM pictures in the literature [26], the porosity of the HOPG electrode was smaller than that of the coke electrode.
Due to lithium diffusion-induced stress, fractures can occur on the active grain surface [48]. By the morphologies of LiCoO2 particles from commercial Li-ion batteries, Malave et al. [49] built an electro-mechanical model to show the maximum stress at approximately midway during a 1C discharge. The maximum stress was tensile to increase and tended to be concentrated near protrusion or notch on the particle surface, which likely cracked the particles.
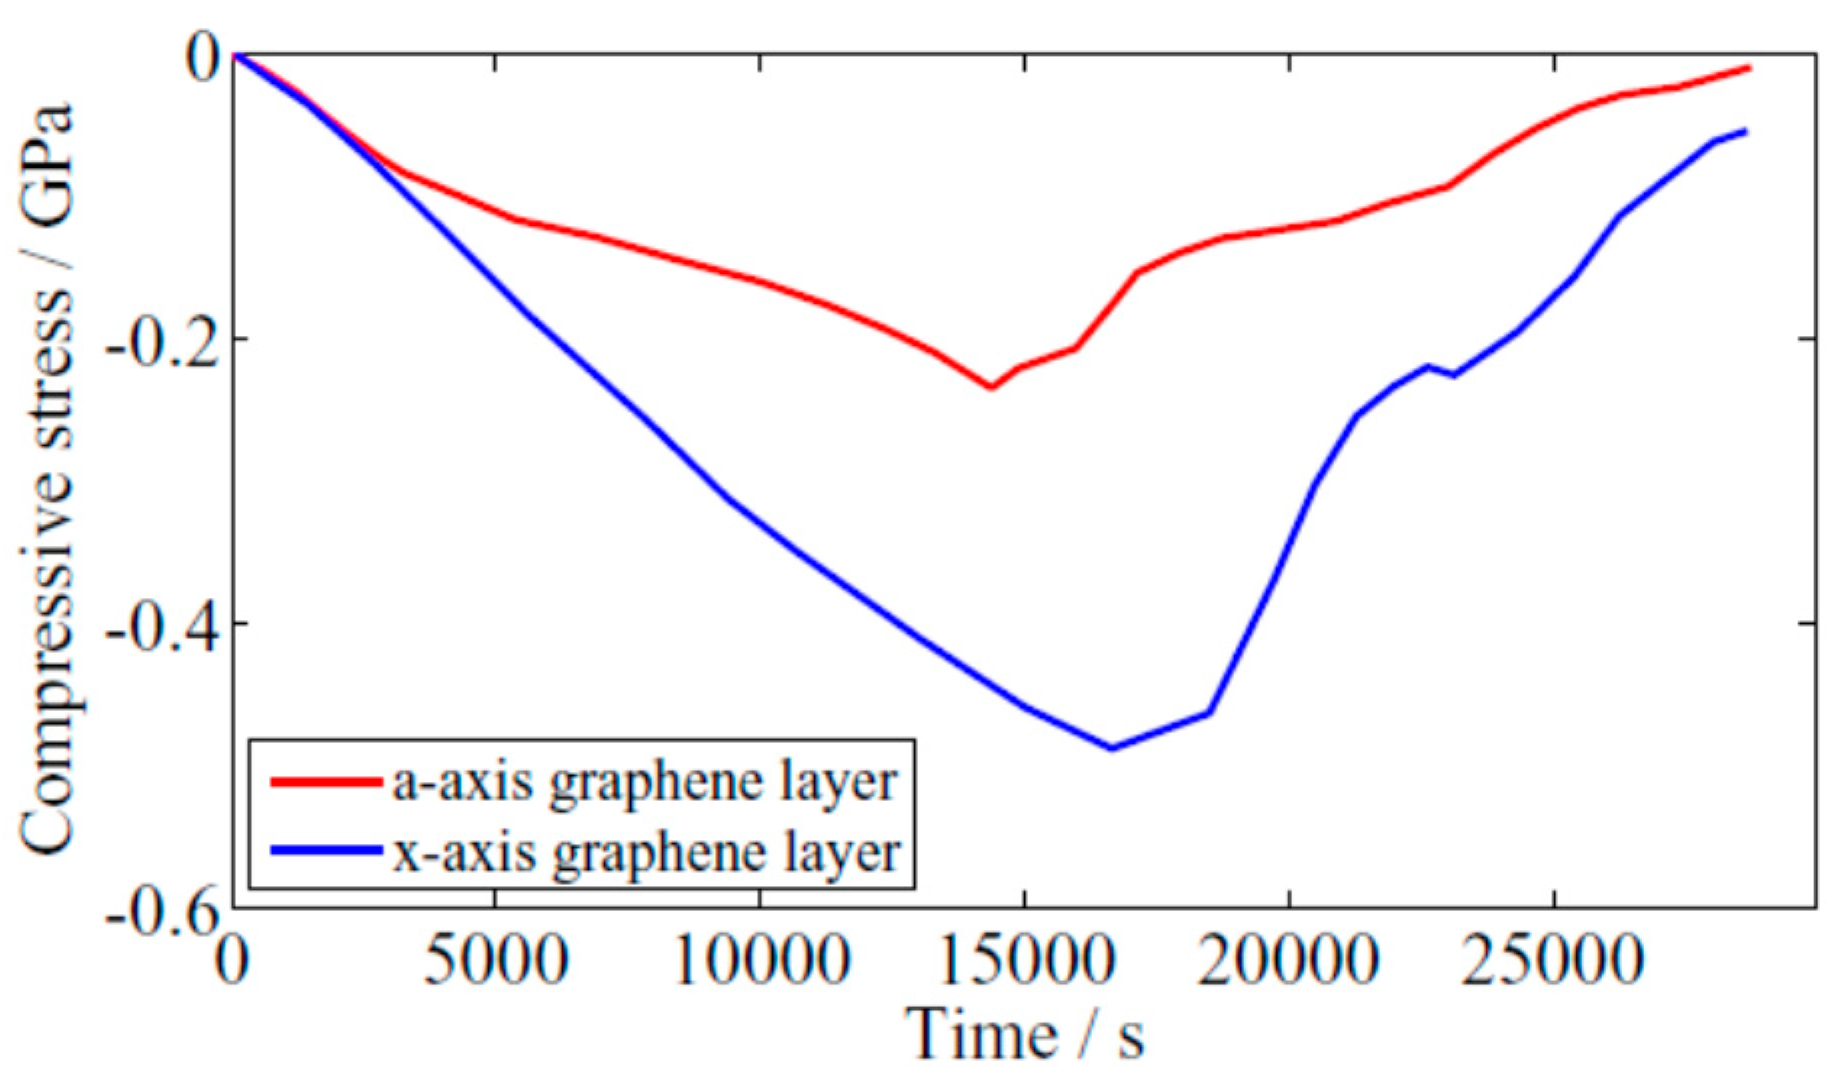
Active grain axis orientation was shown to affect electrode stress generation and evolution (Figure 7). The a-axis graphene layer electrode generated a smaller stress change than the c-axis graphene layer electrode corresponding to the 0.2 C-rate, about 250 MPa for the former [34], and 400 MPa for the latter [33]. Moreover, the a-axis graphene layer carbon film electrode had isotropic in-plane stress behavior via spin-coating. However, the c-axis graphene layer carbon film electrode evolved significant anisotropic stress via bar-coating due to different stress increments dependent on the MOSS spots array. When the MOSS spots array was perpendicular to the lateral direction of the grapheme planes, the induced stress changes were beyond 400 MPa. When the MOSS spots array was parallel to the lateral direction of the grapheme planes, the stress changes were 50 MPa at most. In addition, the absolute stresses measured in the a-axis and c-axis directions during lithium-ion intercalation and de-intercalation were relatively lower than the predicted values for pure graphite in the literature, likely reflecting the randomly formed graphite particle and atom-scale disorder.
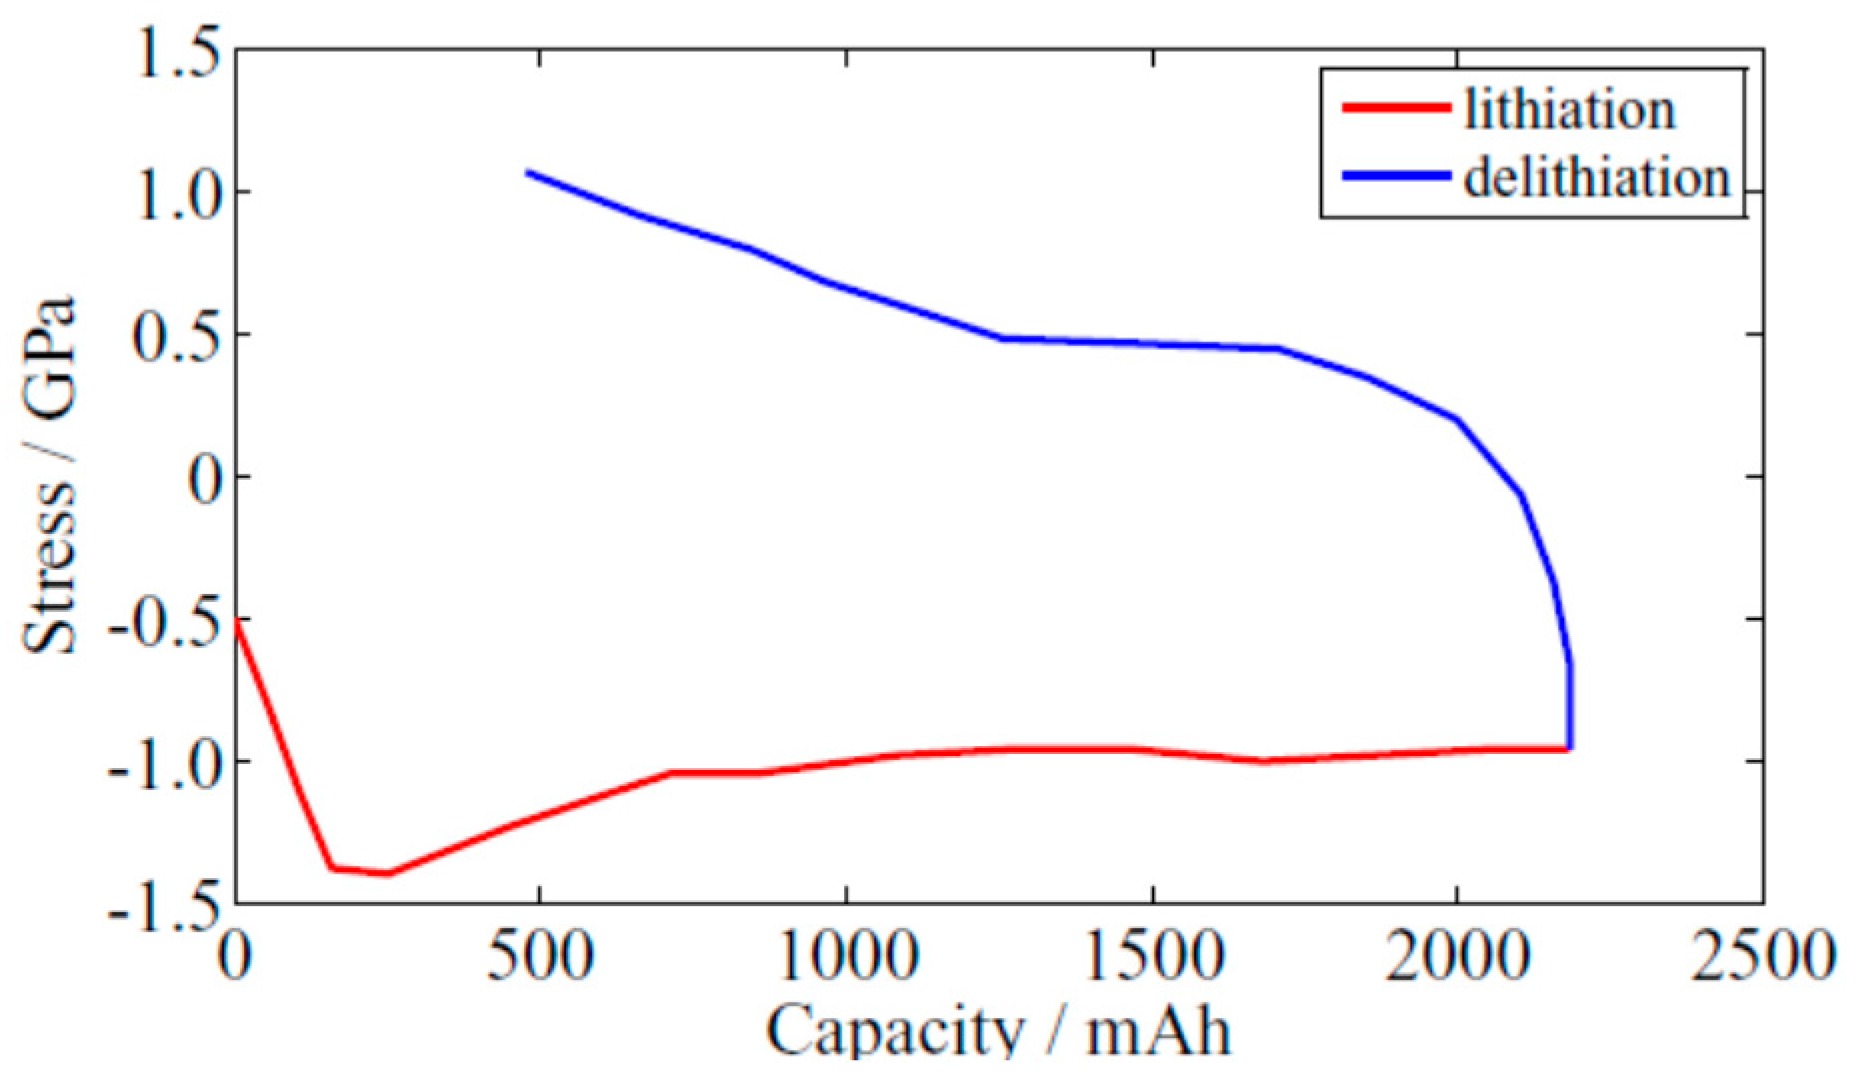
The Si electride has its own difussion-induced stress evolution during lithation and delithation. Nadimpalli et al. [46] observed the stress evolution in an amorphous Si film electrode by the MOSS technique. Removal of the electrocapillary effect and SEI effect, the stress reponse of the first cycle of the Si film electrode nonlinearly behaves as a function of capacity as shown in Figure 8. In the lithiation process, the stress linearly increases to a peak value of −1.48 GPa at 150 mAh/g and drops to −1 GPa at 700 mAh/g. After this, the stress becomes small changes. In the delithiation process, the stress fast tends to a stable tensile value of about 0.4 GPa and increases to about 1 GPa at 500 mAh/g. If the SEI layer effect was considered, the peak stress value can reach −1.75 GPa [13]. Their studies also showed that the Si film surface became rough in the initial cycles, then generated flaws in the following cycles, and finally flagmentated into islands with electrochemical cycle increasing.
5.2. Current Collectors
During electrochemical discharging and charging, the thickness of copper current collectors affected the deformation of the composite graphite electrodes. The mixture of graphite and binder coated each side of the copper-foil current collector. The copper foil was deformed by the graphite electrode deformation, the curling and uncurling of which makes it difficult to measure electrode strain.
Without the constraints of a current collector, the strain of a free-standing graphite composite electrode was observed by the DIC technique [21]. On average, the unconstrained graphite composite electrode expands 1.41% during lithium intercalation and contracts 1.33% during de-intercalation. The thickness of the copper collectors has been verified to have an influence on the strain of the bonded electrode by the DIC approach [22]. Because the film substrate is less rigid than the disk substrate, the graphite electrode resting on the 16-μm copper foil of the current collector produced over twice as much bi-axial strain as that for the comparable electrode resting on the 635-μm-thick copper disks under the same cycling conditions.
5.3. Lithium Concentration, Cycles, and C-rates
When an electrode is intercalated by lithium ions, electrode mass and lithium concentration increase. The lithium (de)intercalation can induce electrode stress evolution with lithium concentration change.
In one electrochemical cycle, electrode stress evolves nonlinearly and asymmetrically as shown in Figure 5, the hysteresis can be found, the loop size of which is variable with electrochemical cycles. Encircled by own lithium intercalation and de-intercalation stress-capacity curves, the anode loop is about 343 kPa∙Ah, and the cathode loop is about 131 kPa∙Ah in the first electrochemical cycle as shown in Figure 5a. However, the electrode loop is significantly reduced in the second electrochemical cycle as shown in Figure 5b, about 54% for the anode, and 28% for the cathode. One of the most important factors is that the SEI layer formation consumes plenty of lithium inside a cell in the first electrochemical cycle.
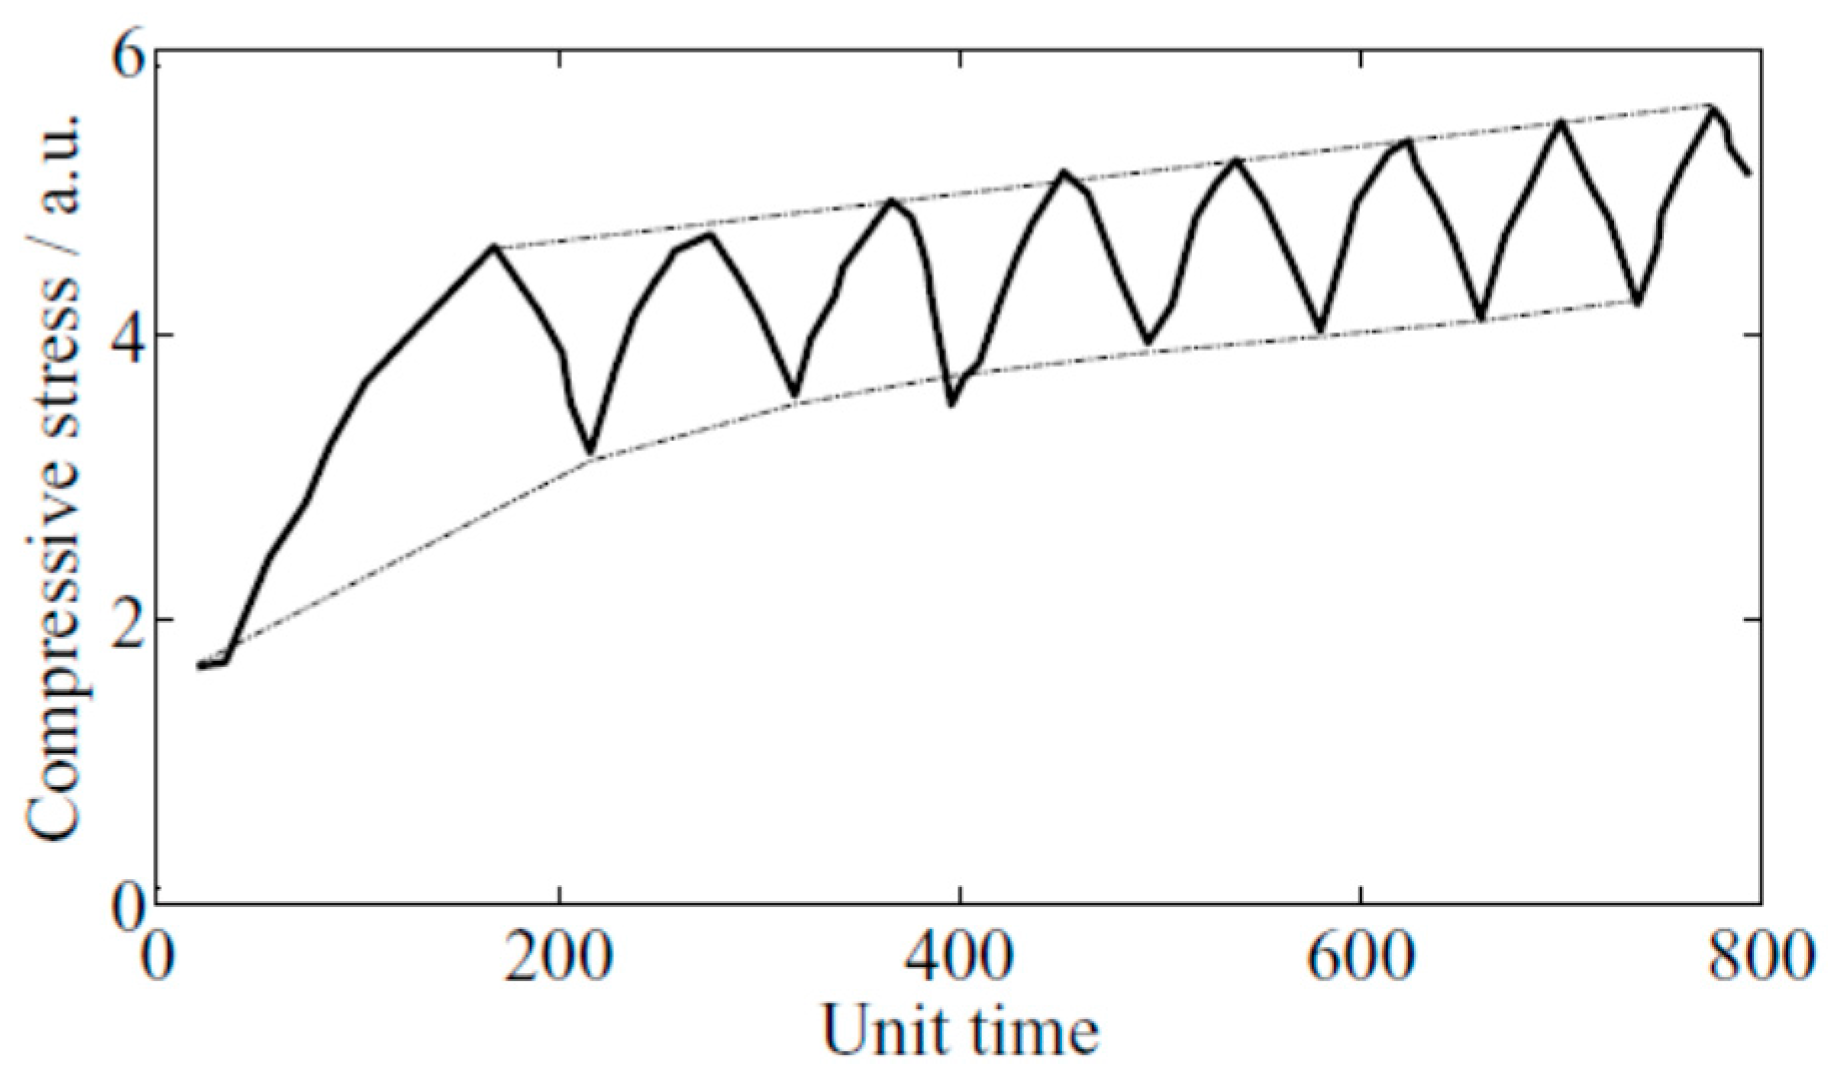
As the number of galvanostatic cycles increases, there can be a continual increase in the irreversible stress within one electrode. In the first 7–8 discharge/charge cycles, both the peaks and valleys of the graphite electrode stress increase continuously as shown in Figure 9 [26]. At the end of the seventh discharge process, the remnant stress increases 2.41% compared to the previous cycle and 60.45% compared to the start value. At the end of the eighth charge process, the peak stress increases 1.52% compared to the previous cycle and 17.24% compared to the start value. Using the DIC approach, both graphite and carbon nanotube electrodes have a similar increase of the remnant strain as the former [22]. In general, to achieve the same potential charge at the end of each cycle, larger electrode deformations are required as the observed cycle number grows.
The surface expansion of a Li-ion cell is affected by the discharge/charge rate used, as shown by researchers using a 5-Ah NMC cathode battery [50]. The battery swelling results from electrode expansion during electrochemical cycling. However, high charge rates appear to have negative effects on the stress evolution of a graphite electrode because a higher C-rate charges a cell to the upward-limited voltage at a lower capacity. At the same charge capacity of 100 mAh∙g−1, there were different compressive stresses for three C-rates, about 5.5 MPa for 1C, 4.0 MPa for 3C, and 3.0 MPa for 5C, respectively [35].
Although Si can be lithiated by a specific charge of 3579 mAh∙g−1 [51], Si electrodes are far inferior in cycling stability compared to graphite electrodes due to a large volume expansion up to 285% after 10 electrochemical cycles [52]. In order to improve specific capacities of Li-ion batteries, researchers have studied deformation of carbon/Si mixed electrodes [53,54]. The lithiated graphite/Si mixed composite electrode produces an irreversible height change of close to 2% after the first cycle [54]. However, mixed with the same binder, the graphite composite electrode does less than one half of the irreversible height change.
5.4. Phase Transformation
When one factor of the laser beam deflection is investigated in a specified cell, other factors should be excluded or ignored through their working conditions and physical phenomena. For the investigation of the phase transition of a cathode material, the influence of the temperature, SEI formation, and lithium concentration change on the electrode stress should be either eliminated or reduced to a minimum.
The strain of phase transition of the LiMn2O4 electrode was screened using voltammetry and galvanostatic electrochemical cycles [27]. The environment temperature was set constant at 25 °C to eliminate the temperature effect while applying a ~0.3 mA working current. Under non-abusive working conditions, the SEI layer formation and dissolution at the electrode surface could be ignored for each cycle starting from the second cycle. The volume change in the electrode can be affected by both the lithium concentration and the electrode’s phase transition. The volume change due to lithium concentration is expected to be proportional to the amount of Li-ions intercalated into the electrode. However, the volume change due to phase transformation is expected to be somewhat sharp in the differential strain curve at the point of phase transition from cubic to tetragonal phase, whose lattice parameters suddenly have a jump. The differential strain curve peaks of the LiMn2O4 electrode were observed to occur around 3.90–3.95 V for the phase transition.
5.5. Solid Electrolyte Interface
The SEI layer is formed in the first electrochemical cycling and can grow in thickness during subsequent cycles [37,55]. The SEI layer growth has a strong effect on cell performance so it is helpful for battery development and maintenance if the mechanical dynamics of the SEI layer can be sensed in real time. Some researchers attempted to use the curvature measurement techniques to examine the electrochemical dynamics process through stress analysis of graphite film electrodes such as the formation of the SEI layer [29,37,38].
A primary cause of the irreversible stress during electrochemical cycles is the SEI layer formation on the surface of the graphite electrode. Mukhopadhyay et al. [37] used the MOSS technique to measure the stress evolution of the chemical vapor deposition (CVD) graphite electrode. Their results showed that significant irreversible stresses developed in the first cycle, and then decreased with the increasing number of cycles. In the first cycle, the actual stress thickness was almost independent of three thicknesses of the CVD graphite films so that the irreversible stress should be a surface phenomenon associated with the formation of the SEI layer. Also, the variation of the irreversible stress with the number of cycles follows very closely the variation of the irreversible capacity with cycle number. Because the atomic layer deposition (ALD) of Al2O3 can mitigate the formation of the SEI layer, Tokranov et al. [38] used both the composite graphite electrode coated by the ALD of alumina and an untreated electrode to investigate the influence of the SEI formation on the stress evolution. The in situ measurements further validated that the large stress produced in the first cycle was clearly associated with the formation of the SEI layer. However, the two comparable graphite electrodes had different thicknesses, which could affect the stress evolution.
SEI growth depends on the electrode material, electrolyte, and cycling history. Using two types of electrolyte injected in the same electrode materials to make two Li-ion cells, Tavassol et al. [29] investigated electrode stress generation and evolution caused by the SEI formation. Both Au and Li metal were used for the electrode materials, by which two cells were respectively fabricated with either one electrolyte solution formed by 1 M LiClO4 in propylene carbonate (PC) and 1:1 volume ratio of ethylene carbonate, dimethylene carbonate (EC:DMC), or the other formed by 1 M lithium tetrafluoroborate in n-butylmethylimidazolium tetrafluoroborate (LiBF4 BMIM BF4).
For the LiClO4 PC Li-ion cell, the residual tensile stress was observed during the first few cycles. However, there was no residual stress found during the electrochemical cycles for the LiBF4 BMIM BF4 cell. The root cause is because the electrolyte LiClO4 PC was so unstable that it formed SEI oligomers on the Au surface during the electrochemical cycling. And the ionic liquid LiBF4 BMIM BF4 is resistant to reductive events at potentials approaching Li bulk alloy formation on the Au surface so that there is no oligomeric species on the Au surface produced by the electrolyte LiBF4 BMIM BF4. By this observation, the SEI film can cause the residual tensile stress in the first few cycles [29].
The stress generated by SEI formation still needs to be explored because SEI formation and stress evolution could interact. On the one hand, electrode stress growth during cell cycling could have a significant influence on the performance and cycle life of graphite film electrodes. On the other hand, the stress changes could result in mechanical disintegration and instability of the SEI layer, which can further consume irreversible lithium.
5.6. Electrode Wetting and Separator
Stress can be generated in composite electrodes when a dry anode or cathode is dipped in electrolyte, the evolution of which is measured by the MOSS technique [35,36]. This wetting stress comes from solvent absorption, which can be affected by electrode constitution, binder swelling, porosity, and separator deformation. Both the composite electrodes of massive artificial graphite (MAG (massive artificial graphite)-10) or NMC chemistry soaked in different electrolytes experienced compressive stress evolution as an exponential function of time; however, the time required to reach a stable stress state differs—the MAG-10 required more than 120 min, and the NMC chemistry electrode required approximately 60 min. Both of them had similar saturation values close to −1.25 MPa [35].
The deformation of the polymer separator can also affect the stress generation of the electrode. The separator can be thermal-shrinkage and expand with an electrolyte. A commercial polyethylene (PE)-polypropylene (PP)-mixed polymeric separator, the Celgard 2325, contracts significantly by from 1.5% at 50 °C to 6% at 90 °C in the machine direction [56]. At a high temperature 140 °C for 0.5 h, a pristine PE separator shrinks by 94% [57]. The separator dilates when it is exposed to an electrolyte solution [58]. The separator’s swelling is a result of the penetration of solvent molecules between polymer chains. In order to eliminate the effect of separator deformation on electrode stress generation, Sethuraman et al. [35] completely soaked the separator through a micro-pipette circled along its periphery for absorbing electrolyte before the graphite electrode was soaked. Hence, any stresses observed could be attributed to the polyvinylidene fluoride (PVDF) binder swelling. In the experiment, the PVDF films absorbed carbonate vapor with a change in thicknesses of up to 20%, and the stiffness of the PVDF was significantly decreased by contact with the diethyl carbonate (DEC), which indicates that the PVDF binder immersed in electrolyte solution is easily deformed [59]. The effects of electrode microstructure need to be further investigated.
5.7. Other Factors
Although the availability of published data from in situ electrode stress/strain measurements is limited, factors that influence electrode stress generation also include the effects due to thermal expansion/contraction [60,61,62] and gas generation originated from electrochemical decomposition of electrolyte solvents by the SEI layer formation, high temperature operation, and overcharge [63,64,65]. The winding process of electrodes is the important production technique for Li-ion battery fabrication [66], which can also cause electrode stress generation from external forces and body forces.
Cathode materials can generate thermal expansion. MuKai et al. [60] validated that lithium manganese oxide spinels had average coefficients of volumetric thermal expansion by the maximum value of 2.39 × 10⁻⁵ K−1 with X-ray diffraction measurements performed in the temperature range from 100 to 400 K. Because of thermal expansion of cathode, anode, and separator in a cell, Oh and Epureanu [61] found a 5Ah NMC cathode Li-ion cell swelling linearly in the through plane from 25 to 45 °C. Stress generation of a NMC cathode battery stack caused by temperature has been measured by Mohan et al. [62], who found the bulky force at the battery stack surface increase with temperature rising from −5 to 45 °C at the same SOC level.
6. Conclusions
This paper presented a survey of in situ measurement approaches of electrode stress and strain for Li-ion batteries. Both DIC and curvature measurements can be used in labs to monitor electrode stress or strain evolution. Fiber optical sensors are better at monitoring mechanical performance, degradation, and safety of commercial Li-ion batteries employed in battery management systems. However, the orientation of fiber optical sensors needs to be tested for further evaluation of electrode stress.
By using in situ measurement methods, electrode stress can be generated or affected when electrode physical chemistry is changed, such as force, mass, morphology, constitution, particle lattice, and ion diffusion. For example, lithium intercalation changes electrode mass and constitution, the SEI layer mainly changes electrode mass and morphology, grain phase transition changes electrode particle lattice, and charging C-rates affect lithium diffusion inside an electrode. Current collectors can change sufferance force and thus alter electrode stress. There are still some factors to be investigated by in situ measurements for electrode stress growth. Temperature changes the inner energy of electrode materials. Like the SEI layer, metal dendrites can also change electrode mass and morphology. Particle dislocation can change morphology. In addition, external loads, inertial forces, and gas generation by side reaction can directly apply physical forces on electrodes.
The effects of temperature and life cycle on electrodes need to be explored. Compared to both DIC and curvature-measurement methods, it is more convenient to use the fiber optical sensor technique to validate temperature effects on electrode stress or strain only if one tested cell is placed in a chamber. In the future, life cycles that have an influence on stress evolution of an electrode should be tested and validated to build the relationship between state-of-health and cell degradation. Moreover, if a micro-stress sensor was integrated into any commercial cell in some day, the micro-dynamics state of a cell could be tracked by big data computation so that battery health management was effectively developed for transportation or energy storage applications.
Acknowledgments
This work presented herein was funded by the National Natural Science Foundation of China (Project No. 51677006).
Author Contributions
Ximing Cheng collected and organize the literatures and write the review article. Michael Pecht edited the article language and guide me organize the paper.
Conflicts of Interest
The authors declare no conflict of interest.
References
- Global EV Outlook 2016 Beyond One Million Electric Cars; International Energy Agency: Paris, France; Available online: http://www.iea.rog/statistics (accessed on 17 June 2016).
- Hendricks, C.; Williard, N.; Mathew, S.; Pecht, M. A failure modes, mechanisms, and effects analysis (FMMEA) of lithium-ion batteries. J. Power Sources 2015, 297, 113–120. [Google Scholar] [CrossRef]
- Barker, J. In-situ measurement of the thickness changes associated with cycling of prismatic lithium ion batteries based on LiMn2O4 and LiCoO2. Electrochim. Acta 1999, 45, 235–242. [Google Scholar] [CrossRef]
- Fu, R.; Xiao, M.; Choe, S.Y. Modeling, validation and analysis of mechanical stress generation and dimension changes of a type high power Li-ion battery. J. Power Sources 2013, 224, 211–224. [Google Scholar] [CrossRef]
- Oh, K.Y.; Epureanu, B.I. A novel thermal swelling model for a rechargeable lithium-ion battery cell. J. Power Sources 2016, 303, 86–96. [Google Scholar] [CrossRef]
- Ohzuku, T.; Matoba, N.; Sawai, K. Direct evidence on anomalous expansion of graphite-negative electrodes on first charge by dilatometr. J. Power Sources 2001, 97–98, 73–77. [Google Scholar] [CrossRef]
- Lee, J.H.; Lee, H.M.; Ahn, S. Battery dimensional changes occurring during charge/discharge cycles—thin rectangular lithium ion and polymer cells. J. Power Sources 2003, 119–121, 833–837. [Google Scholar] [CrossRef]
- Wang, X.; Sone, Y.; Kuwajima, S. In situ investigation of the volume change in Li-ion cell with charging and discharging: Satellite power applications. J. Electrochem. Soc. 2004, 151, A273–A280. [Google Scholar] [CrossRef]
- Leung, P.K.; Moreno, C.; Masters, I.; Hazra, S.; Conde, B.; Mohamed, M.R.; Dashwood, R.J.; Bhagat, R. Real-time displacement and strain mappings of lithium-ion batteries using three-dimensional digital image correlation. J. Power Sources 2014, 271, 82–86. [Google Scholar] [CrossRef]
- Majima, M.; Ujiie, T.; Yagasaki, E.; Inazawa, S.; Miyazaki, K. Design and characteristics of large-scale lithium ion battery. J. Power Sources 1999, 81–82, 877–881. [Google Scholar] [CrossRef]
- Tran, H.Y.; Täubert, C.; Wohlfahrt-Mehrens, M. Influence of the technical process parameters on structural, mechanical and electrochemical properties of LiNi0.8Co0.15Al0.05O2 based electrodes—A review. Prog. Solid State Chem. 2014, 42, 118–127. [Google Scholar] [CrossRef]
- Tavassol, H.; Jones, E.M.C.; Sottos, N.R.; Gewirth, A.A. Electrochemical stiffness in lithium-ion batteries. Nat. Mater. 2016, 15, 1182–1187. [Google Scholar] [CrossRef] [PubMed]
- Sethuraman, V.A.; Srinivasan, V.; Bower, A.F.; Guduru, P.R. In Situ measurements of stress-potential coupling in lithiated silicon. J. Electrochem. Soc. 2010, 157, 1253–1261. [Google Scholar] [CrossRef]
- Bower, A.F.; Guduru, P.R.; Sethuraman, V.A. A finite strain model of stress, diffusion, plastic flow, and electrochemical reactions in a lithium-ion half-cell. J. Mech. Phys. Solids 2011, 59, 804–828. [Google Scholar] [CrossRef]
- Lu, B.; Song, Y.; Zhang, Q.; Pan, J.; Cheng, Y.T.; Zhang, J. Voltage hysteresis of lithium ion batteries caused by mechanical stress. Phys. Chem. Chem. Phys. 2016, 18, 4721–4727. [Google Scholar] [CrossRef] [PubMed]
- Cannarella, J.; Arnold, C.B. Stress evolution and capacity fade in constrained lithium-ion cells. J. Power Sources 2014, 245, 745–751. [Google Scholar] [CrossRef]
- Sutton, M.A.; Orteu, J.; Schreier, H.W. Image Correlation for Shape, Motion and Deformation Measurements: Basic Concepts, Theory and Applications; Springer: New York, NY, USA, 2009; pp. 81–118. [Google Scholar]
- Peters, W.H.; Ranson, W.F. Digital imaging techniques in experimental stress analysis. Opt. Eng. 1982, 21, 427–431. [Google Scholar] [CrossRef]
- Bing, P.; Qian, K.; Xie, H.; Asundi, A. Two-dimensional digital image correlation for in-plane displacement and strain measurement: A review. Meas. Sci. Technol. 2009, 20, 062001. [Google Scholar]
- Qi, Y.; Harris, S.J. In situ observation of strains during lithiation of a graphite electrode. J. Electrochem. Soc. 2010, 157, 741–747. [Google Scholar] [CrossRef]
- Jones, E.M.C.; Silberstein, M.N.; White, S.R.; Sottos, N.R. In Situ Measurements of Strains in Composite Battery Electrodes during Electrochemical Cycling. Exp. Mech. 2014, 54, 971–985. [Google Scholar] [CrossRef]
- Chen, J.; Thapa, A.K.; Berfield, T.A. In-situ characterization of strain in lithium battery working electrodes. J. Power Sources 2014, 271, 406–413. [Google Scholar] [CrossRef]
- Stoney, G.G. The tension of metallic films deposited by electrolysis. Proc. R. Soc. Lond. Ser. A 1908, 82, 172–175. [Google Scholar] [CrossRef]
- Scarminio, J.; Sahu, S.N.; Decker, F. In situ measurements of the stress changes in thin-film electrodes. J. Phys. E Sci. Instrum. 1989, 22, 755–757. [Google Scholar] [CrossRef]
- Moulard, G.; Contoux, G.; Motyl, G.; Gardet, G.; Courbon, M. Improvement of the cantilever beam technique for stress measurement during the physical vapor deposition process. J. Vac. Sci. Technol. 1998, 16, 736–742. [Google Scholar] [CrossRef]
- Rosolen, J.M.; Decker, F. Stress in carbon film electrodes during Li electrochemical intercalation. J. Electrochem. Soc. 1996, 143, 2417–2421. [Google Scholar] [CrossRef]
- Chung, K.Y.; Kim, K.B. Investigation of structural fatigue in spinel electrodes using in situ laser probe beam deflection technique. J. Electrochem. Soc. 2002, 149, 79–85. [Google Scholar] [CrossRef]
- Pyun, S.; Go, J.; Jang, T. An investigation of intercalation-induced stresses generated during lithium transport through Li1−δCoO2 film electrode using a laser beam deflection method. Electrochim. Acta 2004, 49, 4477–4486. [Google Scholar] [CrossRef]
- Tavassol, H.; Chan, M.K.Y.; Catarello, M.G.; Greeley, J.; Cahill, D.G.; Gewirth, A.A. Surface coverage and SEI induced electrochemical surface stress changes during Li deposition in a model system for Li-Ion battery anodes. J. Electrochem. Soc. 2013, 160, 888–896. [Google Scholar] [CrossRef]
- Chason, E.; Sheldon, B.W. Monitoring stress in thin films during processing. Surf. Eng. 2003, 19, 387–391. [Google Scholar] [CrossRef]
- Sethuramana, V.A.; Chonb, M.J.; Shimshakb, M.; Srinivasana, V.; Gudurub, P.R. In situ measurements of stress evolution in silicon thin films during electrochemical lithiation and delithiation. J. Power Sources 2010, 195, 5062–5066. [Google Scholar] [CrossRef]
- Sethuraman, V.A.; Chon, M.J.; Shimshak, M.; Winkle, N.V.; Guduru, P.R. In situ measurement of biaxial modulus of Si anode for Li-ion batteries. Electrochem. Commun. 2010, 12, 1614–1617. [Google Scholar] [CrossRef]
- Mukhopadhyay, A.; Guo, F.; Tokranov, A.; Xiao, X.; Hurt, R.H.; Sheldon, B.W. Engineering of graphene layer orientation to attain high rate capability and anisotropic properties in Li-ion battery electrodes. Adv. Funct. Mater. 2013, 23, 2397–2404. [Google Scholar] [CrossRef]
- Mukhopadhyay, A.; Tokranov, A.; Sena, K.; Xiao, X.; Sheldon, B.W. Thin film graphite electrodes with low stress generation during Li-intercalation. Carbon 2011, 49, 2742–2749. [Google Scholar] [CrossRef]
- Sethuraman, V.A.; Winkle, N.V.; Abrahamb, D.P.; Bower, A.F.; Guduru, P.R. Real-time stress measurements in lithium-ion battery negative-electrodes. J. Power Sources 2012, 206, 334–342. [Google Scholar] [CrossRef]
- Nadimpalli, S.P.V.; Sethuraman, V.A.; Abraham, D.P.; Bower, A.F.; Guduru, P.R. Stress evolution in lithium-ion composite electrodes during electrochemical cycling and resulting internal pressures on the cell casing. J. Electrochem. Soc. 2015, 162, 2656–2663. [Google Scholar] [CrossRef]
- Mukhopadhyay, A.; Tokranov, A.; Xiao, X.; Sheldon, B.W. Stress development due to surface processes in graphite electrodes for Li-ion batteries: A first report. Electrochim. Acta 2012, 66, 28–37. [Google Scholar] [CrossRef]
- Tokranov, A.; Sheldon, B.W.; Lu, P.; Xiao, X.; Mukhopadhyay, A. The origin of stress in the solid electrolyte interphase on carbon electrodes for Li ion batteries. J. Electrochem. Soc. 2014, 161, 58–65. [Google Scholar] [CrossRef]
- Meltz, G.; Morey, W.W.; Glenn, W.H. Formation of Bragg gratings in optical fibers by a transverse holographic method. Opt. Lett. 1989, 14, 823–825. [Google Scholar] [CrossRef] [PubMed]
- Majumder, M.; Gangopadhyay, T.K.; Chakraborty, A.K.; Dasgupta, K.; Bhattacharya, D.K. Fiber Bragg gratings in structural health monitoring—Present status and applications. Sens. Actuators 2008, 147, 150–164. [Google Scholar] [CrossRef]
- Kinet, D.; Mégret, P.; Goossen, K.W.; Qiu, L.; Heider, D.; Caucheteur, C. Fiber Bragg grating sensors toward structural health monitoring in composite materials: Challenges and solutions. Sensors 2014, 14, 7394–7419. [Google Scholar] [CrossRef] [PubMed]
- Orr, P.; Fusiek, G.; Niewczas, P.; Booth, C.D.; Dyśko, A.; Kawano, F.; Nishida, T.; Beaumont, P. Distributed photonic instrumentation for power system protection and control. IEEE Trans. Instrum. Meas. 2015, 64, 19–26. [Google Scholar] [CrossRef]
- Paris, C. Vibration tests on the preloaded LARES satellite and separation system. Aerosp. Sci. Technol. 2015, 42, 470–476. [Google Scholar] [CrossRef]
- Du, W.; Taoa, X.M.; Tam, H.Y.; Choy, C.L. Fundamentals and applications of optical fiber Bragg grating sensors to textile structural composites. Compos. Struct. 1998, 42, 217–229. [Google Scholar] [CrossRef]
- Bae, C.; Manandhar, A.; Kiesel, P.; Raghavan, A. Monitoring the strain evolution of lithium-ion battery electrodes using an optical fiber Bragg Grating sensor. Energy Technol. 2016, 4, 851–855. [Google Scholar] [CrossRef]
- Nadimpalli, S.P.V.; Sethuraman, V.A.; Bucci, G.; Srinibasan, V.; Bower, A.F.; Guduru, P.R. On Plastic deformation and fracture in Si films during electrochemical lithiation/delithiation cycling. J. Electrochem. Soc. 2013, 160, 1885–1893. [Google Scholar] [CrossRef]
- Woodford, W.H.; Carter, W.C.; Chiang, Y. Design criteria for electrochemical shock resistant battery electrodes. Energy Environ. Sci. 2012, 5, 8014–8024. [Google Scholar] [CrossRef]
- Wang, H.; Jang, Y.; Huang, B.; Sadoway, D.R.; Chiang, Y. TEM Study of electrochemical cycling-induced damage and disorder in LiCoO2 cathodes for rechargeable lithium batteries. J. Electrochem. Soc. 1999, 146, 473–480. [Google Scholar] [CrossRef]
- Malave, V.; Berger, J.R.; Zhu, H.; Kee, R.J. A computational model of the mechanical behavior within reconstructed LixCoO2 Li-ion battery cathode particles. Electrochim. Acta 2014, 130, 707–717. [Google Scholar] [CrossRef]
- Oh, K.; Siegel, J.B.; Secondo, L.; Kim, S.; Samad, N.A.; Qin, J.; Anderson, D.; Garikipati, K.; Knobloch, A.; Epureanu, B.I.; et al. Rate dependence of swelling in lithium-ion cells. J. Power Sources 2014, 267, 197–202. [Google Scholar] [CrossRef]
- Obrovac, M.N.; Christensen, L. Structural changes in silicon anodes during lithium insertion/extraction. Electrochem. Solid State Lett. 2004, 7, 93–96. [Google Scholar] [CrossRef]
- Becker, C.R.; Prokes, S.M.; Love, C.T. Enhanced lithiation cycle stability of ALD-coated confined a‑Si microstructures determined using in situ AFM. ACS Appl. Mater. Interfaces 2016, 8, 530–537. [Google Scholar] [CrossRef] [PubMed]
- Hwang, S.S.; Cho, C.G.; Kim, H. Polymer microsphere embedded Si/graphite composite anode material for lithium rechargeable battery. Electrochim. Acta 2010, 55, 3236–3239. [Google Scholar] [CrossRef]
- Gomez-Camer, J.L.; Bünzli, C.; Hantel, M.M.; Poux, T.; Novak, P. On the correlation between electrode expansion and cycling stability of graphite/Si electrodes for Li-ion batteries. Carbon 2016, 105, 42–51. [Google Scholar] [CrossRef]
- Castaing, R.; Moreau, P.; Reynier, Y.; Schleich, D.; Larbi, S.J.S.; Guyomard, D.; Dupré, N. NMR quantitative analysis of solid electrolyte interphase on aged Li-ion battery electrodes. Electrochim. Acta 2015, 155, 391–395. [Google Scholar] [CrossRef]
- Chen, J.; Yan, Y.; Sun, T.; Qi, Y.; Li, X. Probing the roles of polymeric separators in lithium-ion battery capacity fade at elevated temperatures. J. Electrochem. Soc. 2014, 161, 1241–1246. [Google Scholar] [CrossRef]
- Jeong, H.; Hong, S.; Lee, S. Effect of microporous structure on thermal shrinkage and electrochemical performance of Al2O3/poly (vinylidene fluoride-hexafluoropropylene) composite separators for lithium-ion batteries. J. Membr. Sci. 2010, 364, 177–182. [Google Scholar] [CrossRef]
- Gor, G.Y.; Cannarella, J.; Leng, C.Z.; Vishnyakov, A.; Arnold, C.B. Swelling and softening of lithium-ion battery separators in electrolyte solvents. J. Power Sources 2015, 294, 167–172. [Google Scholar] [CrossRef]
- Magasinski, A.; Zdyrko, B.; Kovalenko, I.; Hertzberg, B.; Burtovyy, R.; Huebner, C.F.; Fuller, T.F.; Luzinov, I.; Yushin, G. Toward efficient binders for Li-ion battery Si-based anodes: Polyacrylicacid. Appl. Mater. Interfaces 2010, 2, 3004–3010. [Google Scholar] [CrossRef] [PubMed]
- Mukai, K.; Kishida, Y.; Nozaki, H.; Dohmae, K. Thermal expansion in lithium manganese oxide spinels Li[LixMn2−x]O4 with 0 ≤ x ≤ 1/3. J. Power Sources 2013, 224, 230–235. [Google Scholar] [CrossRef]
- Oh, K.; Epureanu, B.I. Characterization and modeling of the thermal mechanics of lithium-ion battery cells. Appl. Energy 2016, 178, 633–646. [Google Scholar] [CrossRef]
- Mohan, S.; Kim, Y.; Siegel, J.B.; Samad, N.A.; Stefanopoulou, A.G. A phenomenological model of bulk force in a Li-ion battery pack and its application to state of charge estimation. J. Electrochem. Soc. 2014, 161, 2222–2231. [Google Scholar] [CrossRef]
- Teng, X.; Zhan, C.; Bai, Y.; Ma, L.; Liu, Q.; Wu, C.; Wu, F.; Yang, Y.; Lu, J.; Amine, K. In situ analysis of gas generation in lithium-ion batteries with different carbonate-based electrolytes. ACS Appl. Mater. Interfaces 2015, 7, 22751–22755. [Google Scholar] [CrossRef] [PubMed]
- Fell, C.R.; Sun, L.; Hallac, P.B.; Metz, B.; Sisk, B. Investigation of the gas generation in lithium titanate anode based lithium ion batteries. J. Electrochem. Soc. 2015, 162, 1916–1920. [Google Scholar] [CrossRef]
- Kong, W.; Li, H.; Huang, X.; Chen, L. Gas evolution behaviors for several cathode materials in lithium-ion batteries. J. Power Sources 2005, 142, 285–291. [Google Scholar] [CrossRef]
- Yoshio, M.; Brodd, R.J.; Kozawa, A. Lithium-Ion Batteries Science and Technologies; Springer: New York, NY, USA, 2008; p. 181. [Google Scholar]
Figure 1.
Experimental system for the 2D-DIC. DIC: digital image correlation; CCD: charge-coupled device; and CMOS: complementary metal-oxide-semiconductor.
Figure 1.
Experimental system for the 2D-DIC. DIC: digital image correlation; CCD: charge-coupled device; and CMOS: complementary metal-oxide-semiconductor.

Figure 2.
Block diagram of in situ stress measurements for a film object: (a) a thin-film electrode [24]; and (b) a cantilever [25].

Figure 3.
Schematic representation of MOSS technique: (a) laser beams on the substrate of an object [30]; and (b) typical experimental setup [31,32].

Figure 4.
Responses of a fiber Bragg grating (FBG) sensor: (a) optical responses [44]; (b) location schematics of attached or implanted sensor [45]; and (c) in situ stress responses [45].

Figure 5.
Electrode stress evolution at: (a) first cycle; and (b) second cycle [36].
Figure 5.
Electrode stress evolution at: (a) first cycle; and (b) second cycle [36].

Figure 6.
Stress evolution of three carbon electrodes during galvanostatic cycles at room temperature in different periods: 3000 s and 25,000 s for highly oriented pyrolytic graphite (HOPG) and coke membrane electrodes, respectively [26].
Figure 6.
Stress evolution of three carbon electrodes during galvanostatic cycles at room temperature in different periods: 3000 s and 25,000 s for highly oriented pyrolytic graphite (HOPG) and coke membrane electrodes, respectively [26].


Figure 8.
Stress responses of the 100nm Si film electrode [49].
Figure 8.
Stress responses of the 100nm Si film electrode [49].

Figure 9.
Stress evolution of graphite electrode during galvanostatic cycles at 15 μA/cm2 [26].
Figure 9.
Stress evolution of graphite electrode during galvanostatic cycles at 15 μA/cm2 [26].


Table 1.
Assessment of in situ stress measurement methods for Li-ion battery electrodes. LBPD: laser-beam-probe detector; MOSS: multi-optical-stress sensor; and SEI: solid electrolyte interface.
Table 1.
Assessment of in situ stress measurement methods for Li-ion battery electrodes. LBPD: laser-beam-probe detector; MOSS: multi-optical-stress sensor; and SEI: solid electrolyte interface.
| Method | Advantages | Disadvantages |
|---|---|---|
| Digital image correlation (basics [17,18,19] and applications [20,21,22]) | Clearly collects strain evolution of a whole electrode; Low-cost instruments and equipment. | Complicated preparation of an experimental cell with an observation window; High-cost numerical computation; Difficult measurements for electrode stress; Not used for battery management systems of commercial cells. |
| Curvature measurements (basics and applications of the LBPD [23,24,25,26,27,28,29] and basics and applications of the MOSS [30,31,32,33,34,35,36,37,38]) | Globally acquires stress evolution of a whole electrode; Easy data process; Potentially used to differentiate stress factors such as ion concentration, SEIgrowth, and temperature. | Complicated preparation of an experimental cell with an observation window; High-cost instruments and equipment; Only used for average stress computation of a whole electrode; Not used for battery management systems of commercial cells. |
| Fiber optical sensor (basics [39,40,41,42,43,44] and applications [45]) | Acquires local stress evolution of one electrode; Low-cost instruments and equipments; Easy data process; Potentially used for battery management systems of commercial cells. | Cell performance affected by implanted sensors. |
Table 2.
Investigation of influences on electrode stress generation and evolution. NMC: nickel cobalt manganese.
Table 2.
Investigation of influences on electrode stress generation and evolution. NMC: nickel cobalt manganese.
| Stress Factors | Electrode Chemistry | In Situ Measurement Techniques |
|---|---|---|
| Electrode materials | Carbon | DIC [20,21,22] |
| Carbon | LBPD [26], MOSS [33,34] | |
| NMC | MOSS [36] | |
| Si | MOSS [13,46] | |
| Wetting process | Carbon | MOSS [35,36] |
| NMC | MOSS [36] | |
| Lithium concentration | Carbon | DIC [20,21,22], LBPD [26], MOSS [36], FBG [45] |
| LiCoO2 | LBPD [28] | |
| NMC | MOSS [35] | |
| C-rates | Carbon | MOSS [35] |
| Phase transformation | LiMn2O4 | LBPD [27] |
| SEI layer | Carbon | MOSS [38,39] |
| Gold | LBPD [29] |
Table 3.
Stress measurement data of composite electrodes for experimental Li-ion batteries.
| Lithiated Electrode | Counter Electrode | Maximum Stress Change/MPa | Initial Stress/MPa | Test Conditions @ Room Temperature |
|---|---|---|---|---|
| c-axis graphite | Li metal | −450 | 0 | 0.2C [33] |
| a-axis graphite | Li metal | −250 | 0 | 0.2C [34] |
| graphite | Li metal | −3.5 | −2.0 | 1C @ 100 mAh∙g−1 [35] |
| graphite | Li metal | −2.0 | −2.0 | 3C @ 100 mAh∙g−1 [35] |
| graphite | Li metal | −1.0 | −2.0 | 5C @ 100 mAh∙g−1 [35] |
| graphite | Li metal | −1.25 | 0 | Wetting [30] |
| graphite | NMC | −10 | 0 | first cycle, 0.05C [35] |
| NMC | graphite | −6 | 0 | first cycle, 0.05C [36] |
| NMC | graphite | −1.25 | 0 | wetting [36] |
| Si | Li metal | −1480 | −500 | 150 mAh∙g−1 [46] |
© 2017 by the authors. Licensee MDPI, Basel, Switzerland. This article is an open access article distributed under the terms and conditions of the Creative Commons Attribution (CC BY) license (http://creativecommons.org/licenses/by/4.0/).
Share and Cite
MDPI and ACS Style
Cheng, X.; Pecht, M. In Situ Stress Measurement Techniques on Li-ion Battery Electrodes: A Review. Energies 2017, 10, 591. https://doi.org/10.3390/en10050591
AMA Style
Cheng X, Pecht M. In Situ Stress Measurement Techniques on Li-ion Battery Electrodes: A Review. Energies. 2017; 10(5):591. https://doi.org/10.3390/en10050591
Chicago/Turabian StyleCheng, Ximing, and Michael Pecht. 2017. "In Situ Stress Measurement Techniques on Li-ion Battery Electrodes: A Review" Energies 10, no. 5: 591. https://doi.org/10.3390/en10050591
Note that from the first issue of 2016, this journal uses article numbers instead of page numbers. See further details here.