
Strategic Choices of China’s New Energy Vehicle Industry: An Analysis Based on ANP and SWOT
by
Xiaojia Wang
1,2,*, 
Chenggong Li
1,
Jennifer Shang
3,
Changhui Yang
1,
Bingli Zhang
4 and
Xinsheng Ke
5 1
School of Management, Hefei University of Technology, Hefei 23009, China
2
Key Laboratory of Process Optimization and Intelligent Decision-Making (Ministry of Education), Hefei University of Technology, Hefei 23009, China
3
The Joseph M. Katz Graduate School of Business, University of Pittsburgh, Pittsburgh, PA 15260, USA
4
School of Traffic and Transportation Engineering, Hefei University of Technology, Hefei 23009, China
5
School of Economics and Management, Beijing Jiaotong University, Beijing 100044, China
*
Author to whom correspondence should be addressed.
Energies 2017, 10(4), 537; https://doi.org/10.3390/en10040537
Submission received: 15 January 2017
/
Revised: 6 April 2017
/
Accepted: 10 April 2017
/
Published: 16 April 2017
Abstract
:This goal of this paper is to provide a framework by which China should accelerate the development and production of new energy vehicles, which should effectively address current energy and environmental pressures, while promoting the sustainable development of the automotive industry, which is an urgent task. In addition, this paper provides guidelines that seek to transform China’s auto industry while developing a new economic growth point to gain an international competitive advantage with strategic initiatives. This study aims to provide an ANP-SWOT (Analytic Network Process and Strength-Weakness-Opportunity-Threat analysis) approach for an interdependency analysis and to prioritize the new energy automobile industry in China. Firstly, a SWOT model is used to analyze the internal and external factors surrounding the development of the new energy automobile industry in China. Secondly, four types of development strategies are proposed by means of the SWOT matrix according to the conclusions of the factor analysis. Finally, the ANP network structure is designed to measure the effects of influential sub-factors, and then to define a strategic plan for China’s new energy automobile industry. The results of this study show that the optimal short-term development strategy for China’s new energy automotive industry is to increase the construction of new energy vehicle-related facilities, while the best long-term development strategy is to use local advantages and resources, through cost control measures which increase competition within the local new energy automotive industry.
1. Introduction
In recent years, issues regarding the energy crisis and environmental pollution have become a matter of global concern. While increasing in scope, transportation energy consumption is one cause of environmental pollution and one of the main sources of global greenhouse gas emissions. In response to these issues, as well as the substantial variance between fuel supply and demand, the world’s major car manufacturers must accelerate the development and distribution of new energy vehicles. The IEA Center scenario forecast shows that by 2025, electric cars will grow to 30 million, in 2040 there will be more than 150 million, for a daily reduction of 1.3 million barrels of crude oil to reduce dependence on oil [1]. As a national strategy, production of energy-saving and new energy vehicles has become the mainstream approach to advancement within the international automotive industry [2].
New energy vehicles refer to the use of new power systems, completely or mainly rely on new energy-driven vehicles, including, pure electric vehicles, fuel cell electric vehicles and plug-in hybrid (including extended range) electric vehicles (PHEVs) [3] which combine the combustion engine of conventional vehicles and the electric motor of electric vehicles [4].
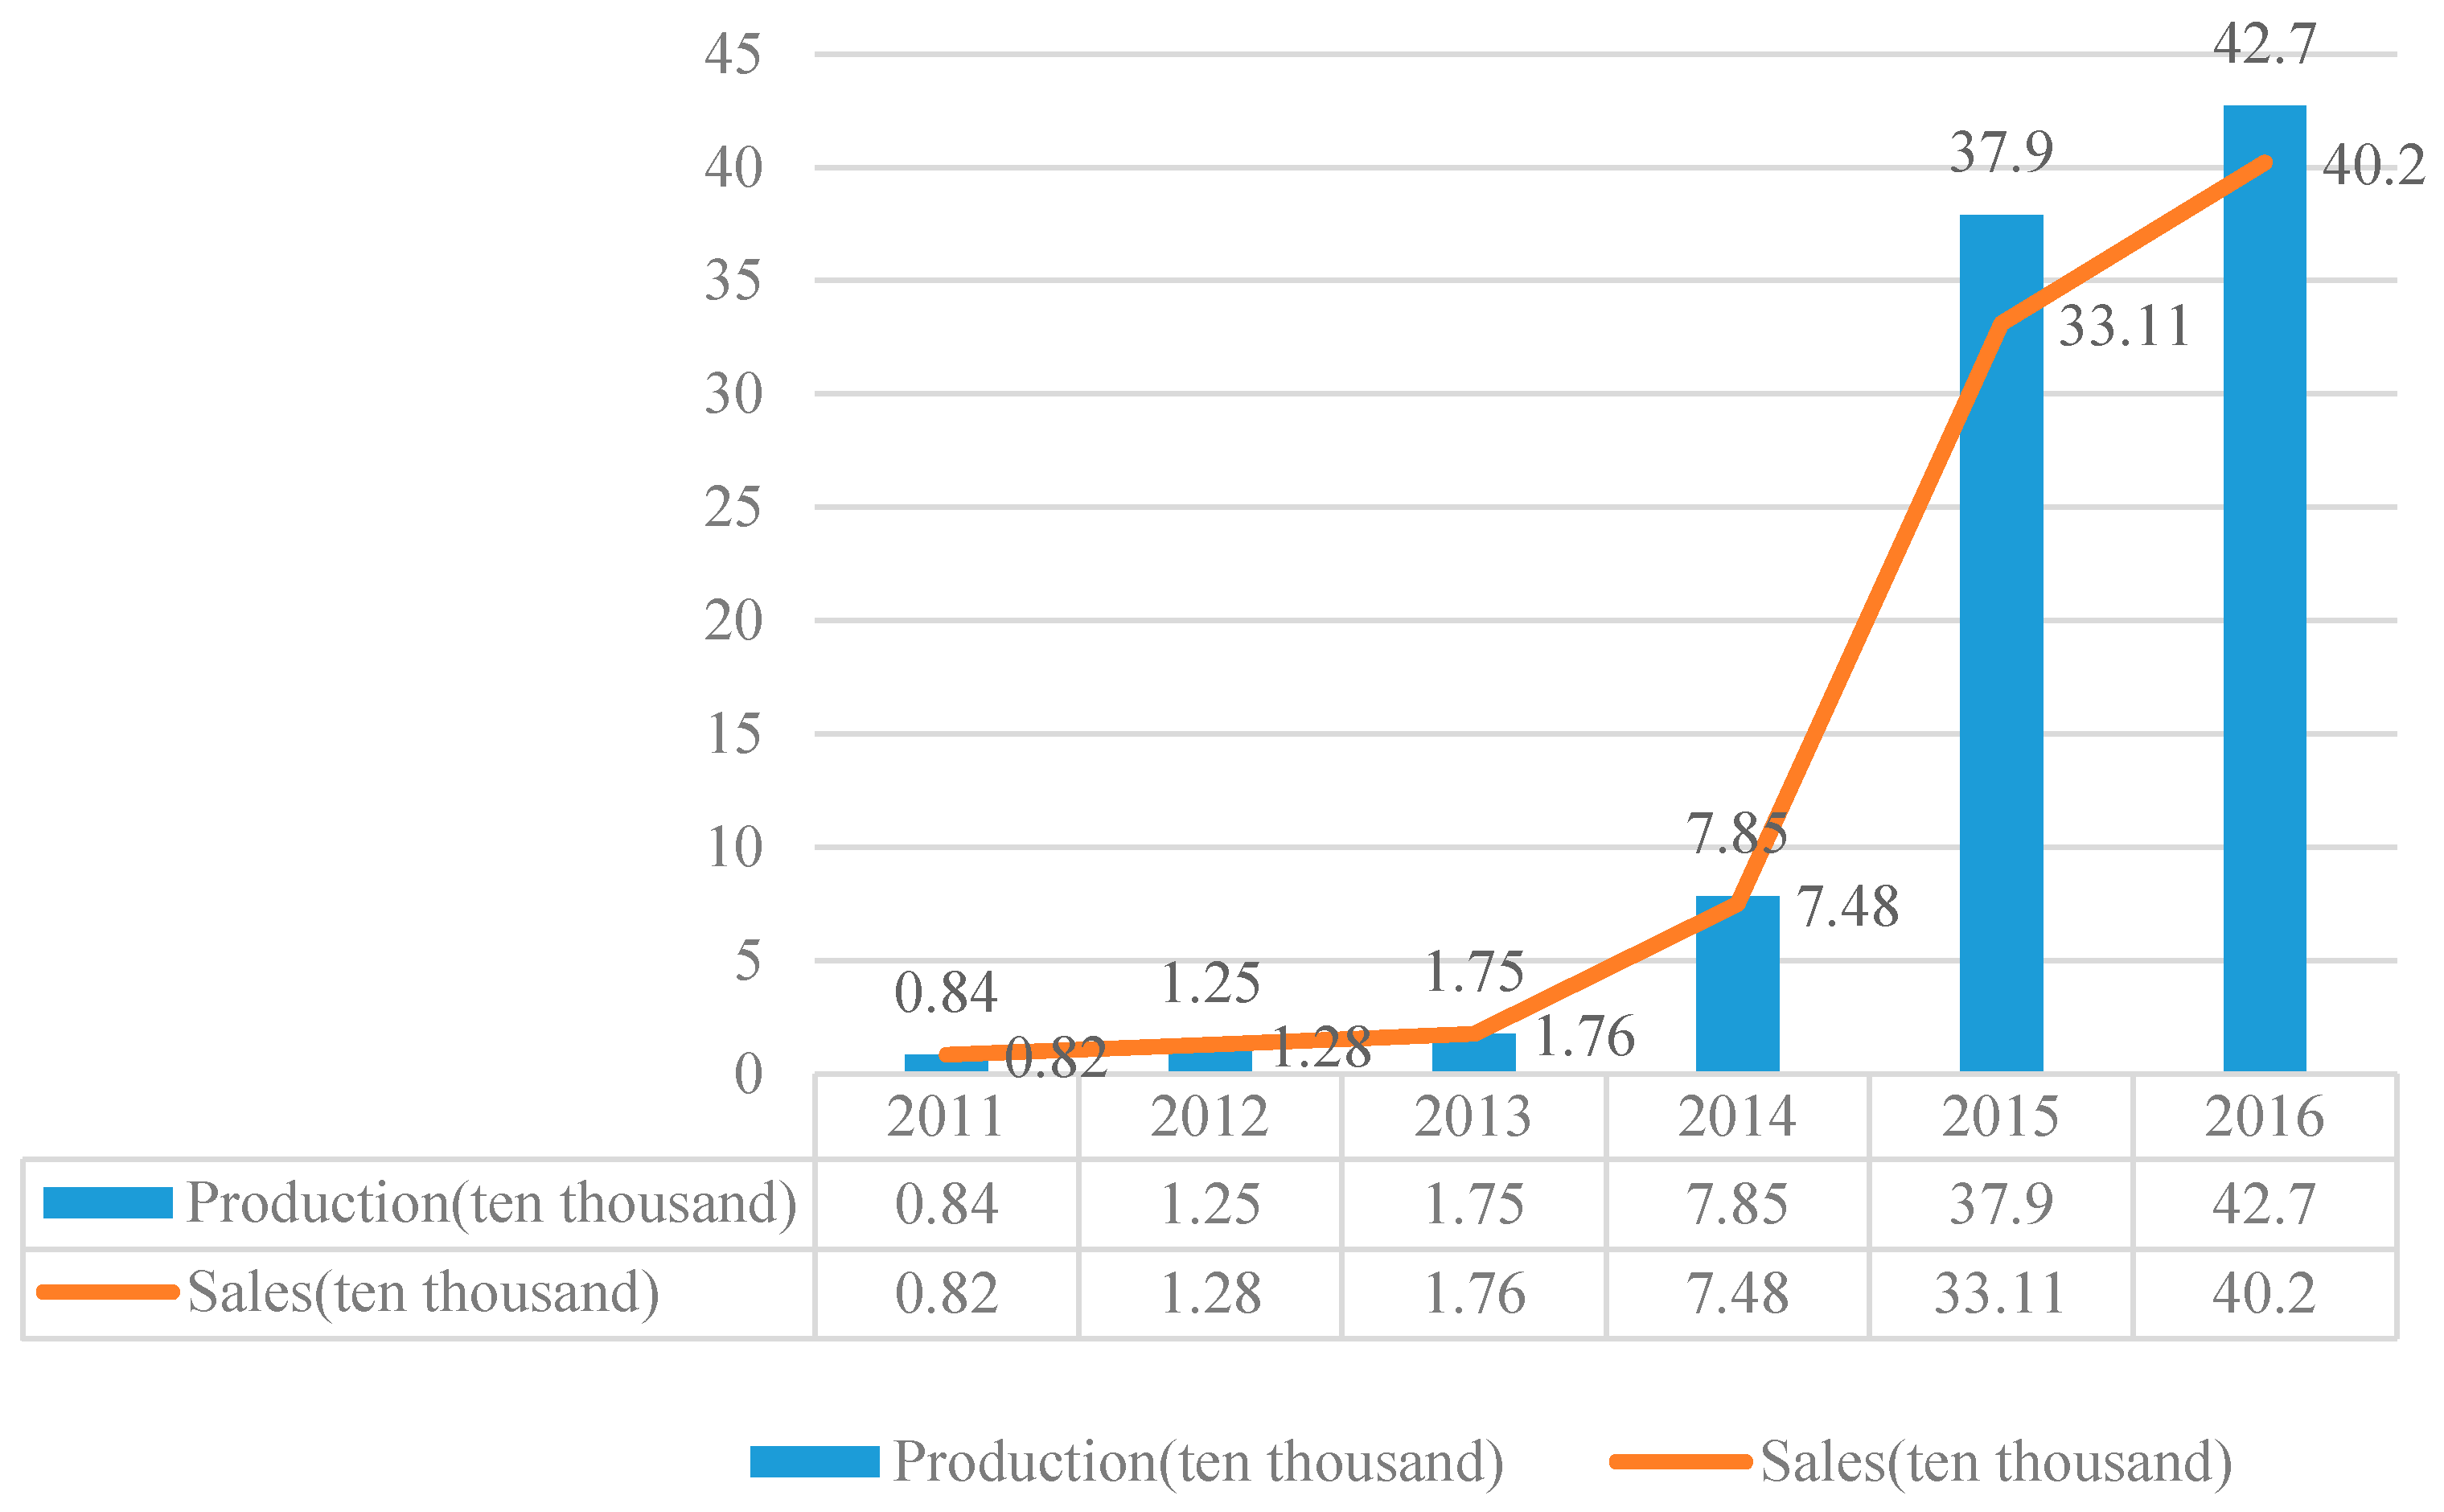
From the second half of 2013, the Chinese government began to vigorously promote the development of new energy industries, expanding the market for new energy vehicles with a gradual increase in production and sales volume. According to the China Association of Automobile Manufacturers, data shows that in 2011 China’s new energy vehicle production was 8368 units, an increase of 16.5% from the prior year. In 2012, China’s new energy vehicle production exceeded 10,000 units, with a 50% increase to a total of 12,552. In 2013, China’s new energy vehicle production reached 17,500 units, a 39.7% increase compared to 2012. In 2014, new energy vehicle production grew approximately 3.5 times to 78,499 units [5]. Research provided by the Ministry of Industry and Data shows that China’s total production of new energy vehicles in 2015 increased almost five times to 379,000 units [6]. In 2015, sales of new energy vehicles in the United States reached 12,304 units, an increase of approximately 400,000 units in total sales (Production and sales are shown in Figure 1). Regardless of whether sales are measured within a single year or as an aggregate amount over a certain period, China ranks first in the world with respect to new energy vehicle production.
Although China’s new energy automotive industry has made great progress in recent years, and the Government has developed various supporting policies [7], such new models, policies and regulations are not perfect, and more is required for the management of production and sales. There are still a variety of issues which affect China’s new energy automotive industry, such as the use of antiquated technology, obsolete ancillary equipment, indirect pollution of new energy vehicles, low safety performance, etc. [8].
New energy vehicles have become the international automotive industry development direction, and the next 10 years will usher in the global automotive industry transformation and upgrading of the important strategic opportunities. At present, China’s automobile production and sales scale has been ranked first in the world, is expected in the next period of time will continue to grow, we must seize the opportunity to accelerate the development of new energy vehicles industry, while optimizing the strategic choice of China’s new energy vehicle industry [9]. In this paper, the ANP-SWOT analysis is used to study the factors that influence the development of the new energy automobile industry in China and to provide guidelines which facilitate national strategic planning for this industry. This paper also seeks to recognize the sustainable development of the new energy automobile industry in China. We first use a SWOT analysis of the internal and external factors that influence China’s new energy automotive industry, which includes the advantages, disadvantages, opportunities and threats of industrial development, while examining 11 sub-influencing factors, and the combined effect of eight different aspects of development strategies (four short-term and four long-term). Because a SWOT analysis cannot directly prioritize influencing factors and development strategies, we incorporate the ANP analysis to measure the dependence on and relationship between internal and external factors, giving a weighted value to each influencing factor by means of a pairwise comparison. This approach provides long-term and short-term strategy using as coring method to determine the most favorable strategic plan for the development of China’s new energy automotive industry.
The structure of this paper is as follows: Section 2 discusses the basics of the SWOT analysis and introduces the concepts of the AHP and ANP methods; in Section 3, we build a SWOT-ANP model and discuss the best development strategy applied to China’s new energy automotive industry; and Section 4 discusses the main conclusions from our analysis.
2. Overview of Methods
2.1. The SWOT Analysis Method
As a systematic method, the SWOT analysis can help us to identify the internal and external environment, the advantages and disadvantages of the industry and opportunities and threats, to provide a basis for the development of an industrial development strategy. The SWOT analysis concept is accredited to United States Harvard Business School professor Andrews in 1971, and is based on a comprehensive consideration of internal and external environmental factors in the competitive strategy approach [10]. The most important step of the SWOT analysis is to identify the strengths, weaknesses, opportunities and threats of a particular industry, list them in a matrix based on a certain order, and then determine the SO (strengths-opportunities), ST (strengths-threats), WO (weakness-opportunities), WT (weakness-threats) strategic program [11]. This approach can help managers combine strengths and opportunities while minimizing the impact of vulnerabilities and threats to determine the optimal combination strategy [12].
2.2. AHP and ANP
Because of the broad application of a SWOT analysis, this method encounters several restrictions, including the inability to apply certain ranking criteria to strategies. Thus, one challenge of the SWOT analysis is measuring how to rank the determined strategies and factors. Multiple Attribute Decision Making (MADM) methods are used as a major tool for ranking alternatives in complex and multi-dimensional problems. These techniques consider various criteria and alternatives depending on the type of problems presented [13].
The Analytic Hierarchy Process (AHP) is a hierarchical weighted decision analysis method proposed by Saaty, a professor of the University of Pittsburgh in the early 1970s. It is the most widely used multiple attribute decision-making (MADM) method and combines qualitative analysis with quantitative analysis [14,15]. The AHP procedures are defined as follows:
- Hierarchy structure is defined in such a way that the goal is placed at the top of hierarchy, and the criteria and strategies attaining from SWOT analysis are placed in descending order.
- The global priorities of criteria, sub-criteria and alternatives are synthesized to identify using the eigenvalue method (EM). The EM is the solution of the eigenvalue problem:where is the largest or principle eigenvalue of the pairwise comparison matrix and is the corresponding principle eigenvector. The (Consistency Ratio) of matrix is used to check judgment inconsistencies. , where and is the maximal eigenvalue of . (Random Index) is an experimental value which depends on [14].
AHP, as an effective decision-making tool, is combined with other MADM methods to solve many complex decision-making problems. In some studies, AHP was combined with the SWOT analysis to optimize and evaluate program strategies [16,17,18,19].
Analytic Network Processes (ANP) is a new tool used to solve multi-criteria problems. It is a type of system decision analysis which combines qualitative and quantitative factors based on the Analytic Hierarchy Process (AHP) [20,21]. The hierarchical structure of the Analytic Hierarchy Process is formed using a top-down linear structure, whereas the ANP network structure is a nonlinear structure with factors placed in all directions [22]. ANP not only solves the issues that can be solved by AHP but also considers the interaction with and dependency on each influencing factor in decision-making [23]. In recent years, ANP has been combined with many other operations research methods to solve a variety of problems, such as:
The first step of ANP is structuring network hierarchy and recognizing factors, sub-factors and alternative strategies. This consists of a two-dimensional element-by-element matrix which adjusts the relative importance weights in individual pairwise comparison matrices to build a new overall super-matrix with the eigenvectors of the adjusted relative importance weights.
In this paper, the SWOT analysis for the new energy automotive industry does not consider the interdependence between factors and its relationship to feedback, so we use the ANP method to create a hierarchical structure for analysis and strategic evaluation. The basic steps for applying ANP in a SWOT analysis are as follows [28]:
- Step 1:
- Conduct a SWOT analysis to determine the criteria and sub-factors.
- Step 2:
- First, assume that there is no interaction between the factors. The importance level of the SWOT criteria should be measured by paired comparisons (). In this step, the AHP method is applied.
- Step 3:
- Under each criterion of SWOT, the constructors are compared in pairs to form a matrix ().
- Step 4:
- Calculate the interdependent SWOT factor weights () by multiplying by .
- Step 5:
- Rank the importance of each sub-factor in the SWOT analysis by pairwise comparisons to form a matrix ().
- Step 6:
- Determine the final weight () of each factor of SWOT by multiplying by .
- Step 7:
- Determine the relative importance of each alternative () by pairwise comparison.
- Step 8:
- Determine the weights for each alternative by multiplying by .
2.3. Integrating ANP and SWOT Analysis
Kurttila et al. first developed the SWOT-AHP method and successfully used this hybrid methodology to assess whether a Finnish farm should adopt certified forestry practices [29,30]. Because of the existing interdependency and dependency among all components of the SWOT analysis, it can be inferred that there is a necessity to apply the ANP method for the ranking of strategies, factors and sub-factors. Among the many applications which combine ANP and SWOT, we review some of the predominant research. Yüksel and Dagdeviren used the ANP method for the SWOT analysis of a textile firm [28]. The SWOT analysis was used to identify factors and strategies. Combining the ANP method to this analysis resulted in the identification of 14 factors and four types of strategies [31,32] through which the ceramic manufacturing industry could chose the best development strategy. In another study [33], a SWOT-ANP model was proposed for Iran’s scrap industry, and compared the results of AHP and ANP with the industry strategy selection.
2.4. Literature on New Energy Vehicles
Rather than focusing on industry strategy selection and optimization, most literature mainly focuses on the technology and development of new energy vehicles. Khaligh et al., presented a comprehensive topological survey of the currently available plug-in hybrid electric vehicles (PHEVs) with charging solutions [34]. Osawa and Nakano proposed a new optimization model considering the production-induced effects as well as environmental impacts [35]. The model is also applied to estimate the impacts on the portfolio of clean energy vehicles (CEVs) in 2030 in Japan. Liu et al. provide an overview of the Chinese new energy vehicle industry and discuss the role of state in the industry’s development [36]. Thus, as a development strategy for this industry has not been fully explored, we seek to analyze these factors in this paper.
The purpose of this paper is to combine the SWOT analysis and ANP method, based on various factors that affect the development of China’s new energy vehicle industry, assess the dependence and feedback relationships between such factors and to rank and optimize the scheme of development strategy within the new energy vehicle industry. Figure 2 presents the proposed framework.
3. Application of the Proposed Model
3.1. The Evaluation Criteria and Alternatives via SWOT
To more accurately and scientifically analyze the internal environment (strengths and weaknesses) and the external environment (opportunities and threats) of China’s new energy automotive industry, this paper builds an ANP-SWOT model to assess the development strategy of China’s new energy vehicle industry, and proposes Optimization options. We defer to experts within automotive-related areas such as the China Association of Automobile Manufacturers and the 2016 “New Energy Vehicles, Power Batteries and Key Materials Technology Summit” in this assessment.
The procedure to solve strategy selection problem is following: (1) 15 experts in China, who have extensive experiences in New Energy Vehicles, were invited to assist to identify 11 industry influencing factors and eight alternatives according to SWOT, The team of experts from Chery Automobile (three people), JAC (five people), China Association of Automobile Manufacturers (five people), Hefei University of Technology Automotive Institute (two people), the identification is based on two considerations: industry actual state and the existence; (2) 12 of these experts were further invited to assist to measure the weight through scoring survey. We collected experts’ suggestions and selected 11 influencing factors, which were what we discussed above, as criteria to evaluate leading industrial strategy selections; (3) consider the relationship between factors; (4) we used the ANP to calculate each alternative’s global weight and ultimately obtain the overall ranking of the strategies. Specific steps are as follows:
Step 1: Screening of influencing factors. Using a questionnaire survey (questions of the questionnaire shown in Appendix A), the expert team is evaluated and screened for the external (superiority, inferiority) and internal (opportunity, threat) impact factors relating to China’s new energy automobile industry.
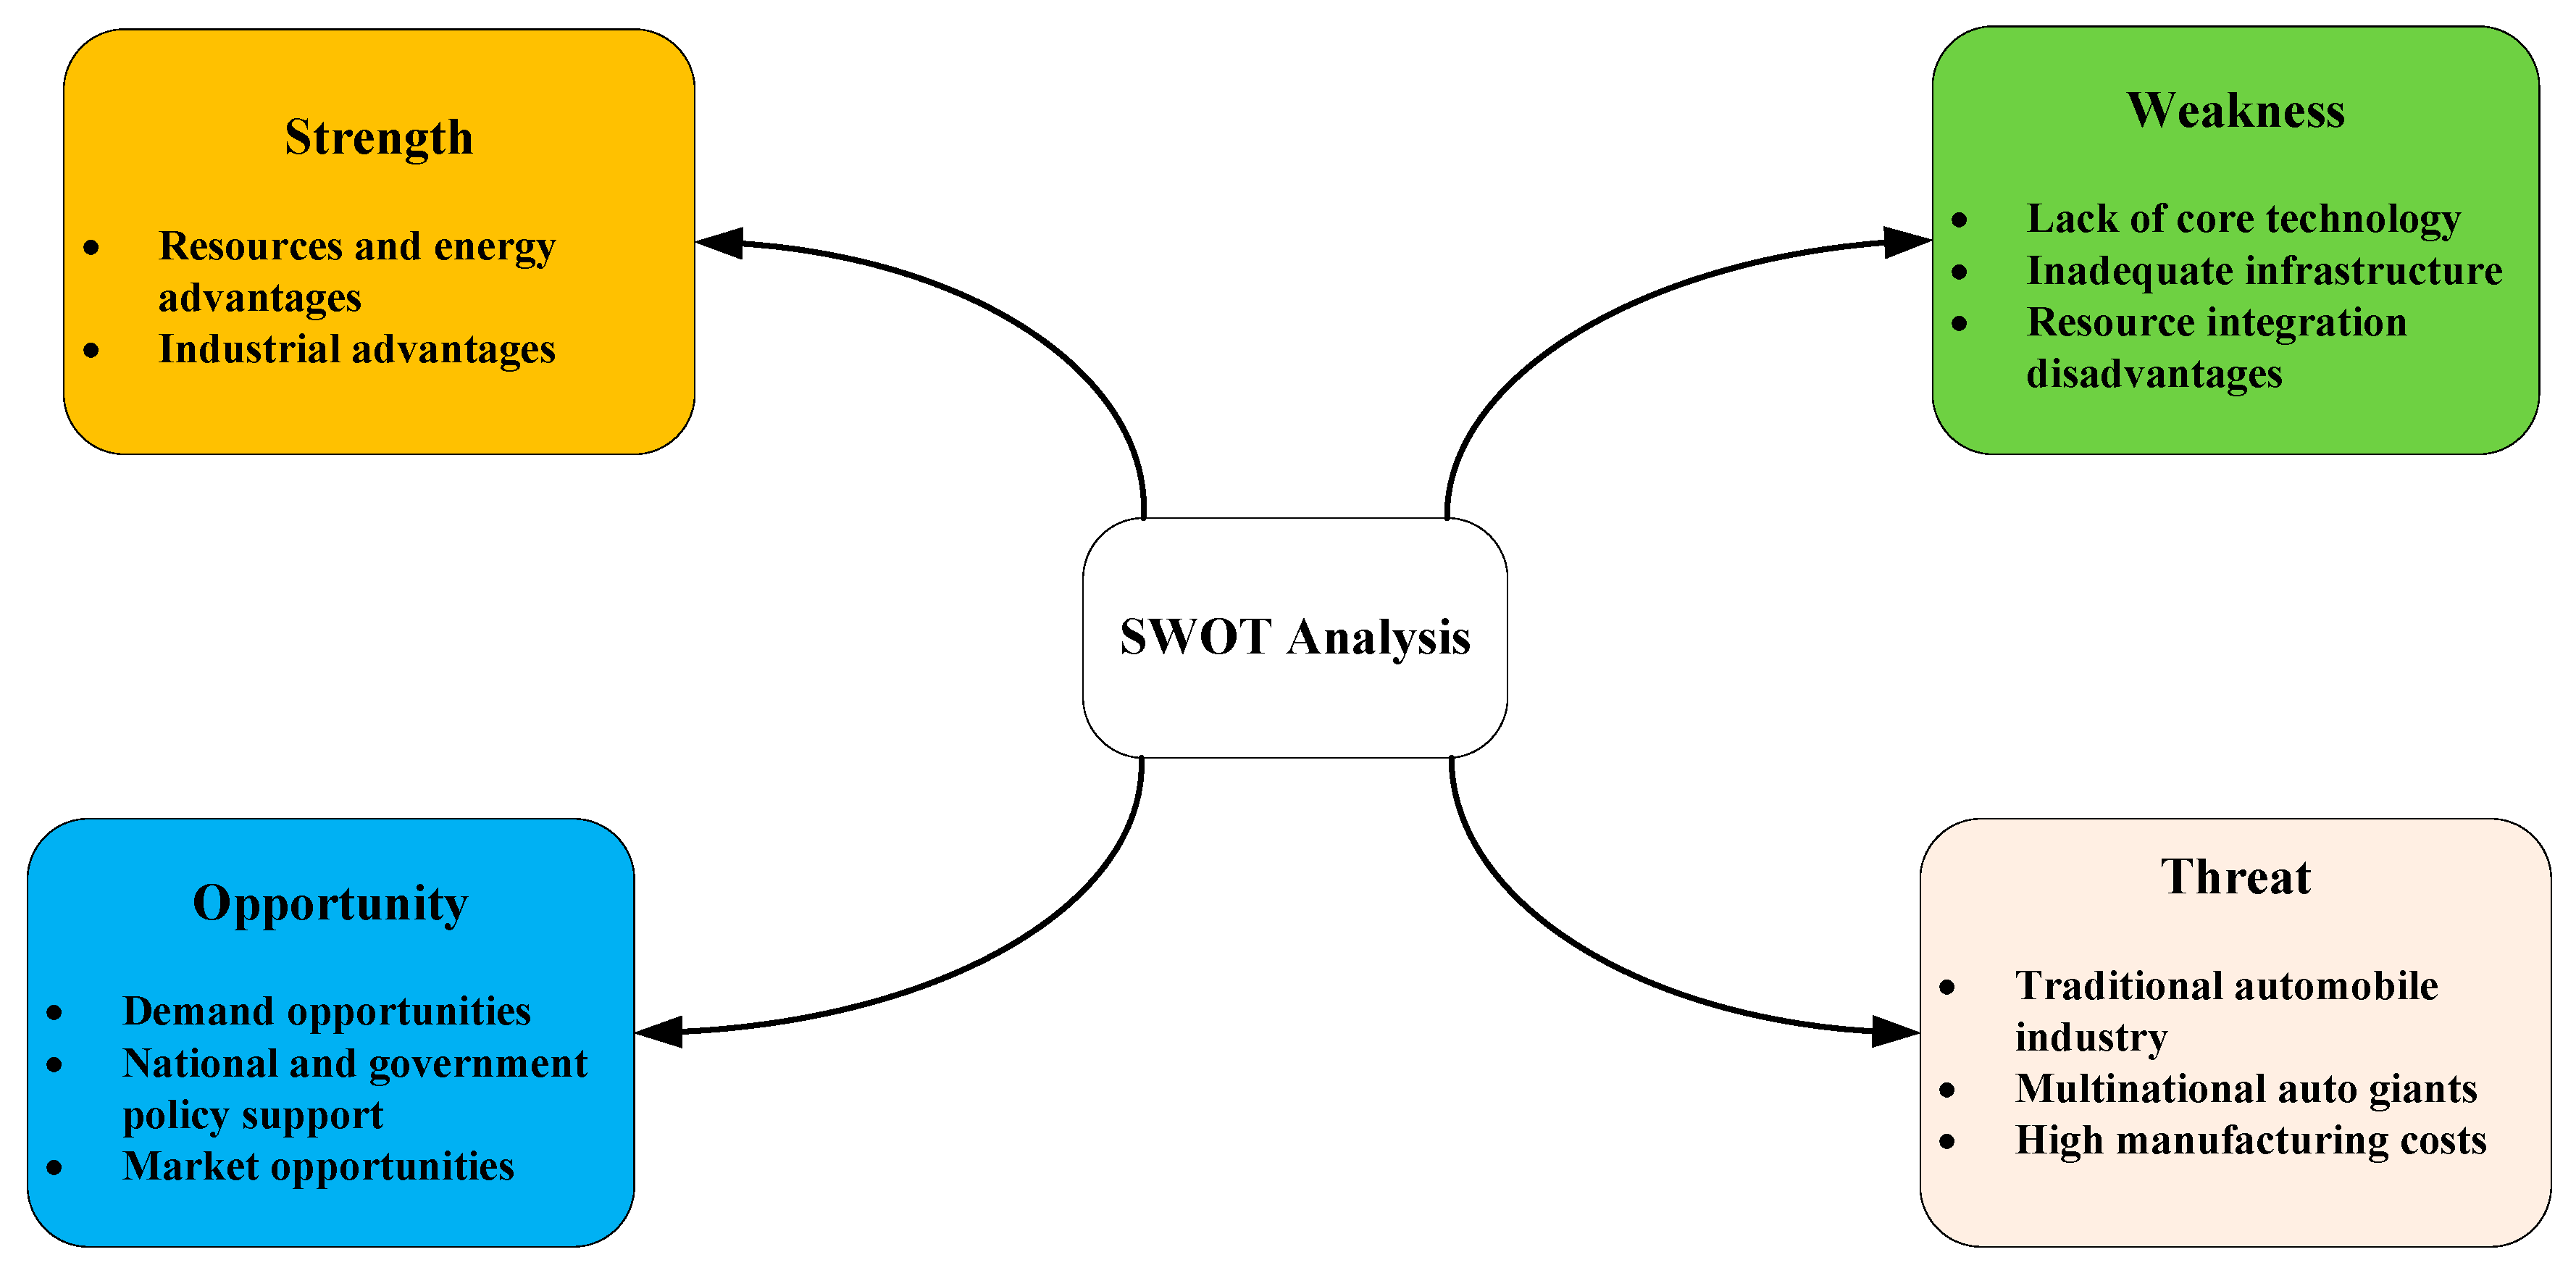
Step 2: Determination of strategic alternatives. A panel discussion which used a scoring method further defined 11 sub-influencing factors within China’s new energy automotive industry, as shown in Figure 3.
Simultaneously, four short-term and four long-term development strategies are presented using a combination of SO, ST, WO and WT.
Step 3: Design the network hierarchy. Identification of the ideal strategy for development of China’s new energy automobile industry is the overall objective of the model ANP evaluation and four SWOT factors, which include the internal and external factors as the basis for the standard layer, and the SWOT matrix strategy options as the basis for the program layer. The framework for the development of China’s new energy automotive industry is proposed as a hierarchical structure, as shown in Figure 4.
Step 4: Evaluate the importance of the influencing factor set. To achieve this, the expert group used a scale of 1–9 to rank and provide a weighted value of four pairs of influential factors (the questionnaire single form is designed for pairwise comparison (See Table 2)).
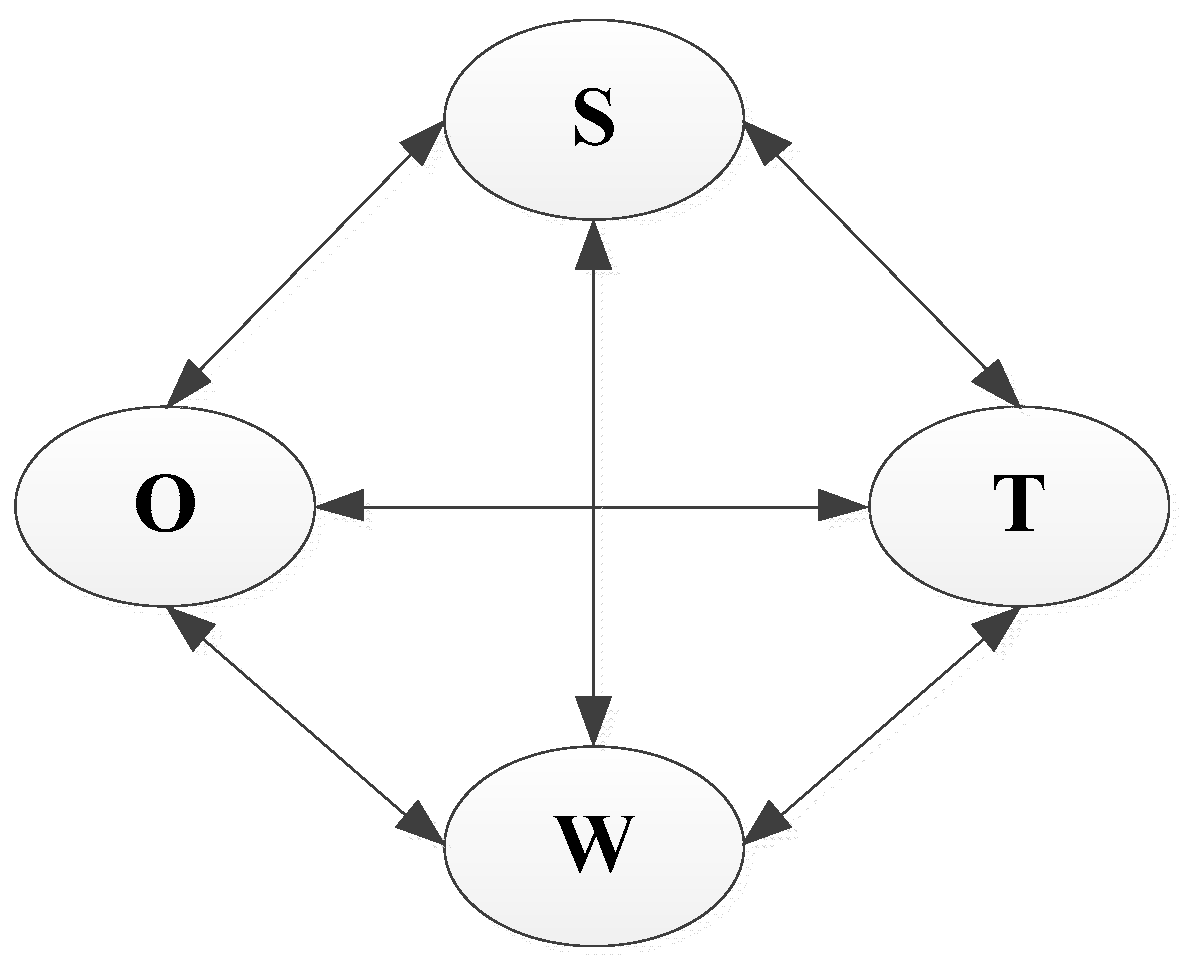
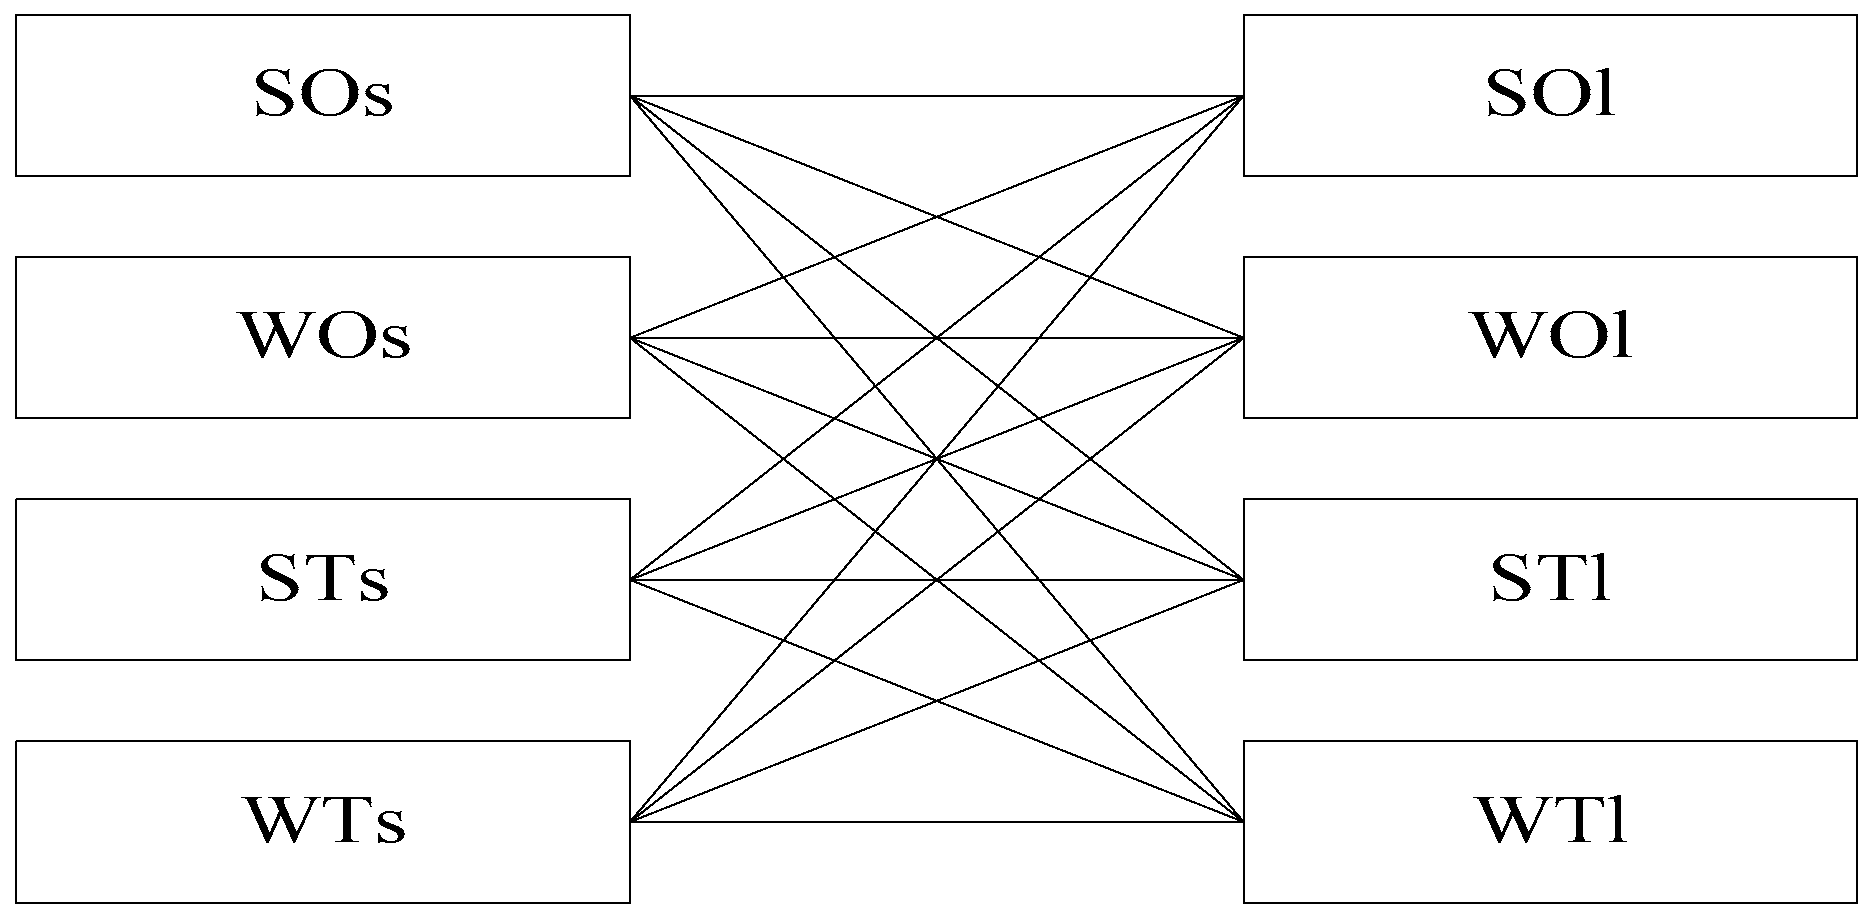
Taking into account the interplay between the criteria proposed by the panel and the dependencies (see Figure 5), we identified a correlation between influencing factors in the evaluation of strategic alternatives.
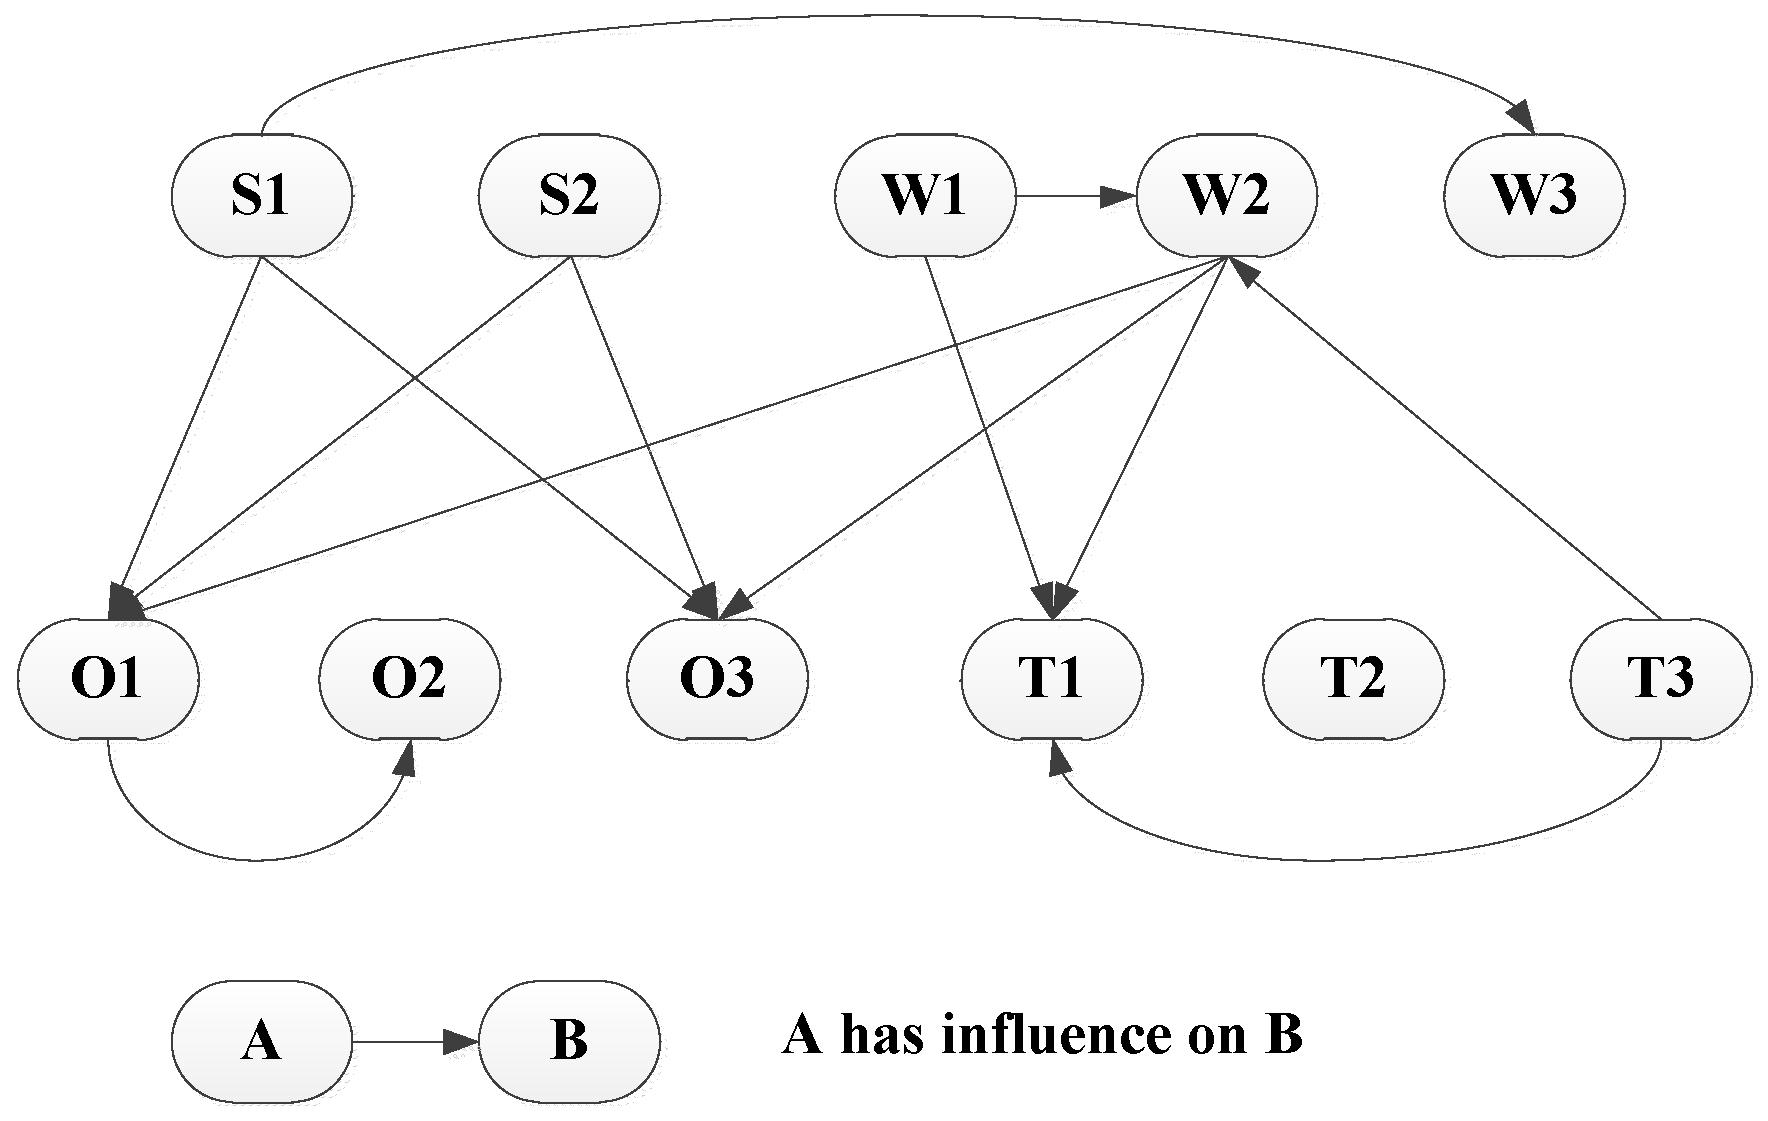
Step 5: Determine the relationship and importance of influencing factors. In this step, we first draw the relationship between internal and external factors, according to criteria determined by the expert team, as shown in Figure 6.
Next, the expert team evaluates the relative importance of influencing factors, taking into account the dependence and feedback relationships between the factors, as well as the absence of dependency and feedback relationships.
3.2. The SWOT Analysis and Strategy Formulation for the Development of China's New Energy Automobile Industry
3.2.1. Strength
Resources and Energy Advantages: In terms of natural resources advantages, China has a natural advantage, vast territory, rich in resources. The key components of new energy vehicles—batteries and motors and other raw materials required in China are extremely rich. Manganese, iron, vanadium, phosphorus, rare earth permanent magnet materials in China are rich resources. In addition, in the development of alternative fuel vehicles, alternative fuels are relatively adequate raw materials, such as coal resources in northwest China, natural gas resources in Sichuan, the central region of the rich biomass resources. In terms of energy advantages, China’s electricity is sufficient, the power installed capacity of 800 million kilowatts, for 4000–5000 million electric car charging. Electricity sources are very diverse and adequate, such as wind power, nuclear power and solar energy resource. These condition provide adequate resources and energy assurance for the development of new energy vehicles in China.
Industrial Advantages: In recent years, China’s electric bicycle and electric motorcycle industries have experienced a rapid development, which led to an advancement of core components such as batteries, drive motor and other related technologies. Presently, large-scale production and cost control measures have been established for these parts production systems. As such, a solid foundation has been created for new energy vehicles, which utilize similar technologies for power batteries, drive motor and other common technologies.
3.2.2. Weakness
The Key Technology is Weak, and the Core Technology is Insufficient: Compared with the world’s automobile industry, China has not had any breakthrough success with its core technology, which is still categorized at the “improved technology innovation” level. In addition, the independent innovation capability is weak in terms of battery, motor, electronic control and other core technologies which are still in need of more research and development.
Inadequate Infrastructure: At present, China’s facilities dedicated to new energy vehicles are relatively small and cannot support the demand for new energy automotive development, which is an important factor that impacts this industry.
Resource Integration Disadvantages: Although China has entered the new energy automotive industry, its fragmented enterprises lead to resource dispersion, in which China cannot form any short-term technical breakthrough. Low-level repetitive R&D occupies many resources. Research institutes and industry associations cannot participate in these studies. China struggles to find ways to integrate and optimize the allocation of resources.
3.2.3. Opportunity
Demand Opportunities: Rising oil prices, increasing motor vehicle pollution and other serious energy and emissions problems facilitate the need for new energy vehicle development.
National and Governmental Policy Support: The state is implementing policies which support the development of the new energy automotive industry. Local governments have also introduced relative local incentives to encourage local automobile companies to produce new energy vehicles.
Market Opportunities: Given China’s market diversification, the development potential for new energy vehicles is enormous. China’s economic development varies by region, with different income levels at various locations. These factors give rise to a diversified and differentiated demand, which will determine different prices, features and other needs, to accommodate such diverse consumer characteristics. The presence of specific consumer groups will influence the promotion of and need for new energy automotive products.
3.2.4. Threat
Traditional Automobile Industry: China’s traditional automobile industry is currently in a rapid growth period, in which the industry profit margins are high. As such, there is little incentive for automobile companies to produce new energy vehicles.
Multinational Auto Giants: Multinational automobile companies are in the mature phases of new energy vehicle development, with many having launched these products to achieve high-volume sales. Toyota, GM, Volkswagen and other auto giants have already established sales of new energy vehicles in China. One example of a successful new energy vehicle is the Toyota Prius hybrid which has achieved cumulative sales of more than 1.5 million worldwide. In contrast, China has not yet established any large-scale sales of new energy vehicles.
High Manufacturing Costs: Factors such as car pre-research funding and small-volume production increase the cost of new energy vehicles. Therefore, there is no price advantage to the production of these vehicles.
Based on the above SWOT analysis of China’s new energy automotive industry and the assessment provided by the expert team, there are four proposed strategies, namely the SO, WO, ST and WT strategies. In considering the best development strategy for the new energy automotive industry, it is important to consider the long-term sustainable development of the industry as well as the short-term strategy. New energy vehicles in China are still in the early stages of development and must go through a process that provides a realistic approach to each stage of the strategy, which is geared towards a long-term sustainable development process. Production needs must be fulfilled using short-term development strategies that play a crucial role in the ability of this industry to achieve and guarantee long-term sustainability. Throughout this paper these four types of strategies are divided into long-term and short-term strategies. Specific strategies are as follows:
Making use of the Chinese New Vehicle Industry’s strength and opportunity to develop its short-term and long-term strategy to enhance the Chinese New Vehicle Industry’s development:
- : The new energy industry market segments and the use of industrial advantages give priority to the development of a new market segment of the energy vehicles;
- : New energy vehicle policies support the use of resources, which actively develop core components.
Making use of the Chinese New Vehicle Industry’s opportunity and overcoming the weakness to develop its short-term and long-term strategy to enhance the Chinese New Vehicle Industry’s development:
- : Accelerate the construction of facilities dedicated to the production of new energy vehicles;
- : In accordance with national policy, integrate resources to focus on technology research and development.
Making use of the Chinese New Vehicle Industry’s strength and defend against its threat to develop its short-term and long-term strategy to enhance the Chinese New Vehicle Industry’s development:
- : Make full use of resources to increase scientific research;
- : Make use of local industry advantages, including cost control, etc., to enhance the competitiveness of the local new energy automotive industry.
Reducing the Chinese New Vehicle Industry’s weakness, avoid the threat to develop its short-term and long-term strategy to enhance the Chinese New Vehicle Industry’s development:
- : Increase the construction and investment infrastructure;
- : Formulate a technological innovation platform to strengthen research and development efforts. Strive to advance the core components, comparable to international standards of technology.
3.3. Analysis and Evaluation of Long-Term Development Strategies for China’s New Energy Auto Industry
In accordance with the evaluation of the four influencing factors of the new energy automobile industry in China, we first form a pair wise comparison matrix, and then calculate the weighted value of each factor to set and judge the consistency ratio (CR) of the matrix. Table 3 shows the SWOT factor comparison results.
The weighting matrix of the SWOT factor at this time:
Then, we assume that there are no dependencies and feedback relationships among the influencing factors. According to the scoring results of the expert team in step 5, the comparison matrix of the influence factors and the weighted values are shown in Table 4.
We then consider the SWOT internal dependency matrix with four factor sets as the criterion, as shown in Appendix B. We obtain a matrix:
The weight of the interdependent SWOT factor () is calculated by multiplying the dependency matrix () and the SWOT factor weight matrix ():
At this point, we can obtain the weighted value of the influencing factors using the hypothesis condition shown in Table 5.
The weight vector is:
The dependence and feedback relationship gives the internal and external factors and the correlation between the two pairs of the comparison matrix (see Appendix C). The resulting relative importance weights are used to produce the unweighted hyper-matrices (see Appendix C).
Here, we see the resulting 11 internal and external factors affecting the weight:
According to our survey results we see that the most influential factor in the development of the new energy automotive industry in China is the “National and government support (O2: 0.1777)”, where the state has developed various preferential policies and subsidies to develop the new energy automotive industry. China’s recent two years of increased development in this industry is attributed to these important achievements. This is consistent with the notion of Mazzucato (2013), who maintains that major innovations only occur with government support [37]. The second most influential factor is the “Demand opportunity (O1: 0.1185)”, while the dominant “Industrial advantages (S2: 0.1064)” factor has a greater impact on Chinas new energy automotive industry. “Inadequate infrastructure (W2: 0.1275)”, “Resource integration (W3: 0.0940)” and “Traditional automobile industry (T1: 0.0636)” factors are detrimental to the development of China’s new energy vehicle industry. Therefore, we should make the best use of China’s own energy, resource and industrial advantages, using a rational integration of resources and optimization strategy, and consider risk aversion to ensure a more comprehensive and safe development of China’s new energy automotive industry.
The following strategy options evaluate the development of China’s new energy automotive industry. First, four long-term development strategies are evaluated with each influencing factor as a criterion. See Appendix D for details. Thus we can get the weighted matrix of each factor under the ANP analysis for each long-term development program (as shown in Table 6).
The weighted matrix of the alternatives under each influencing factor provides various weights to alternatives:
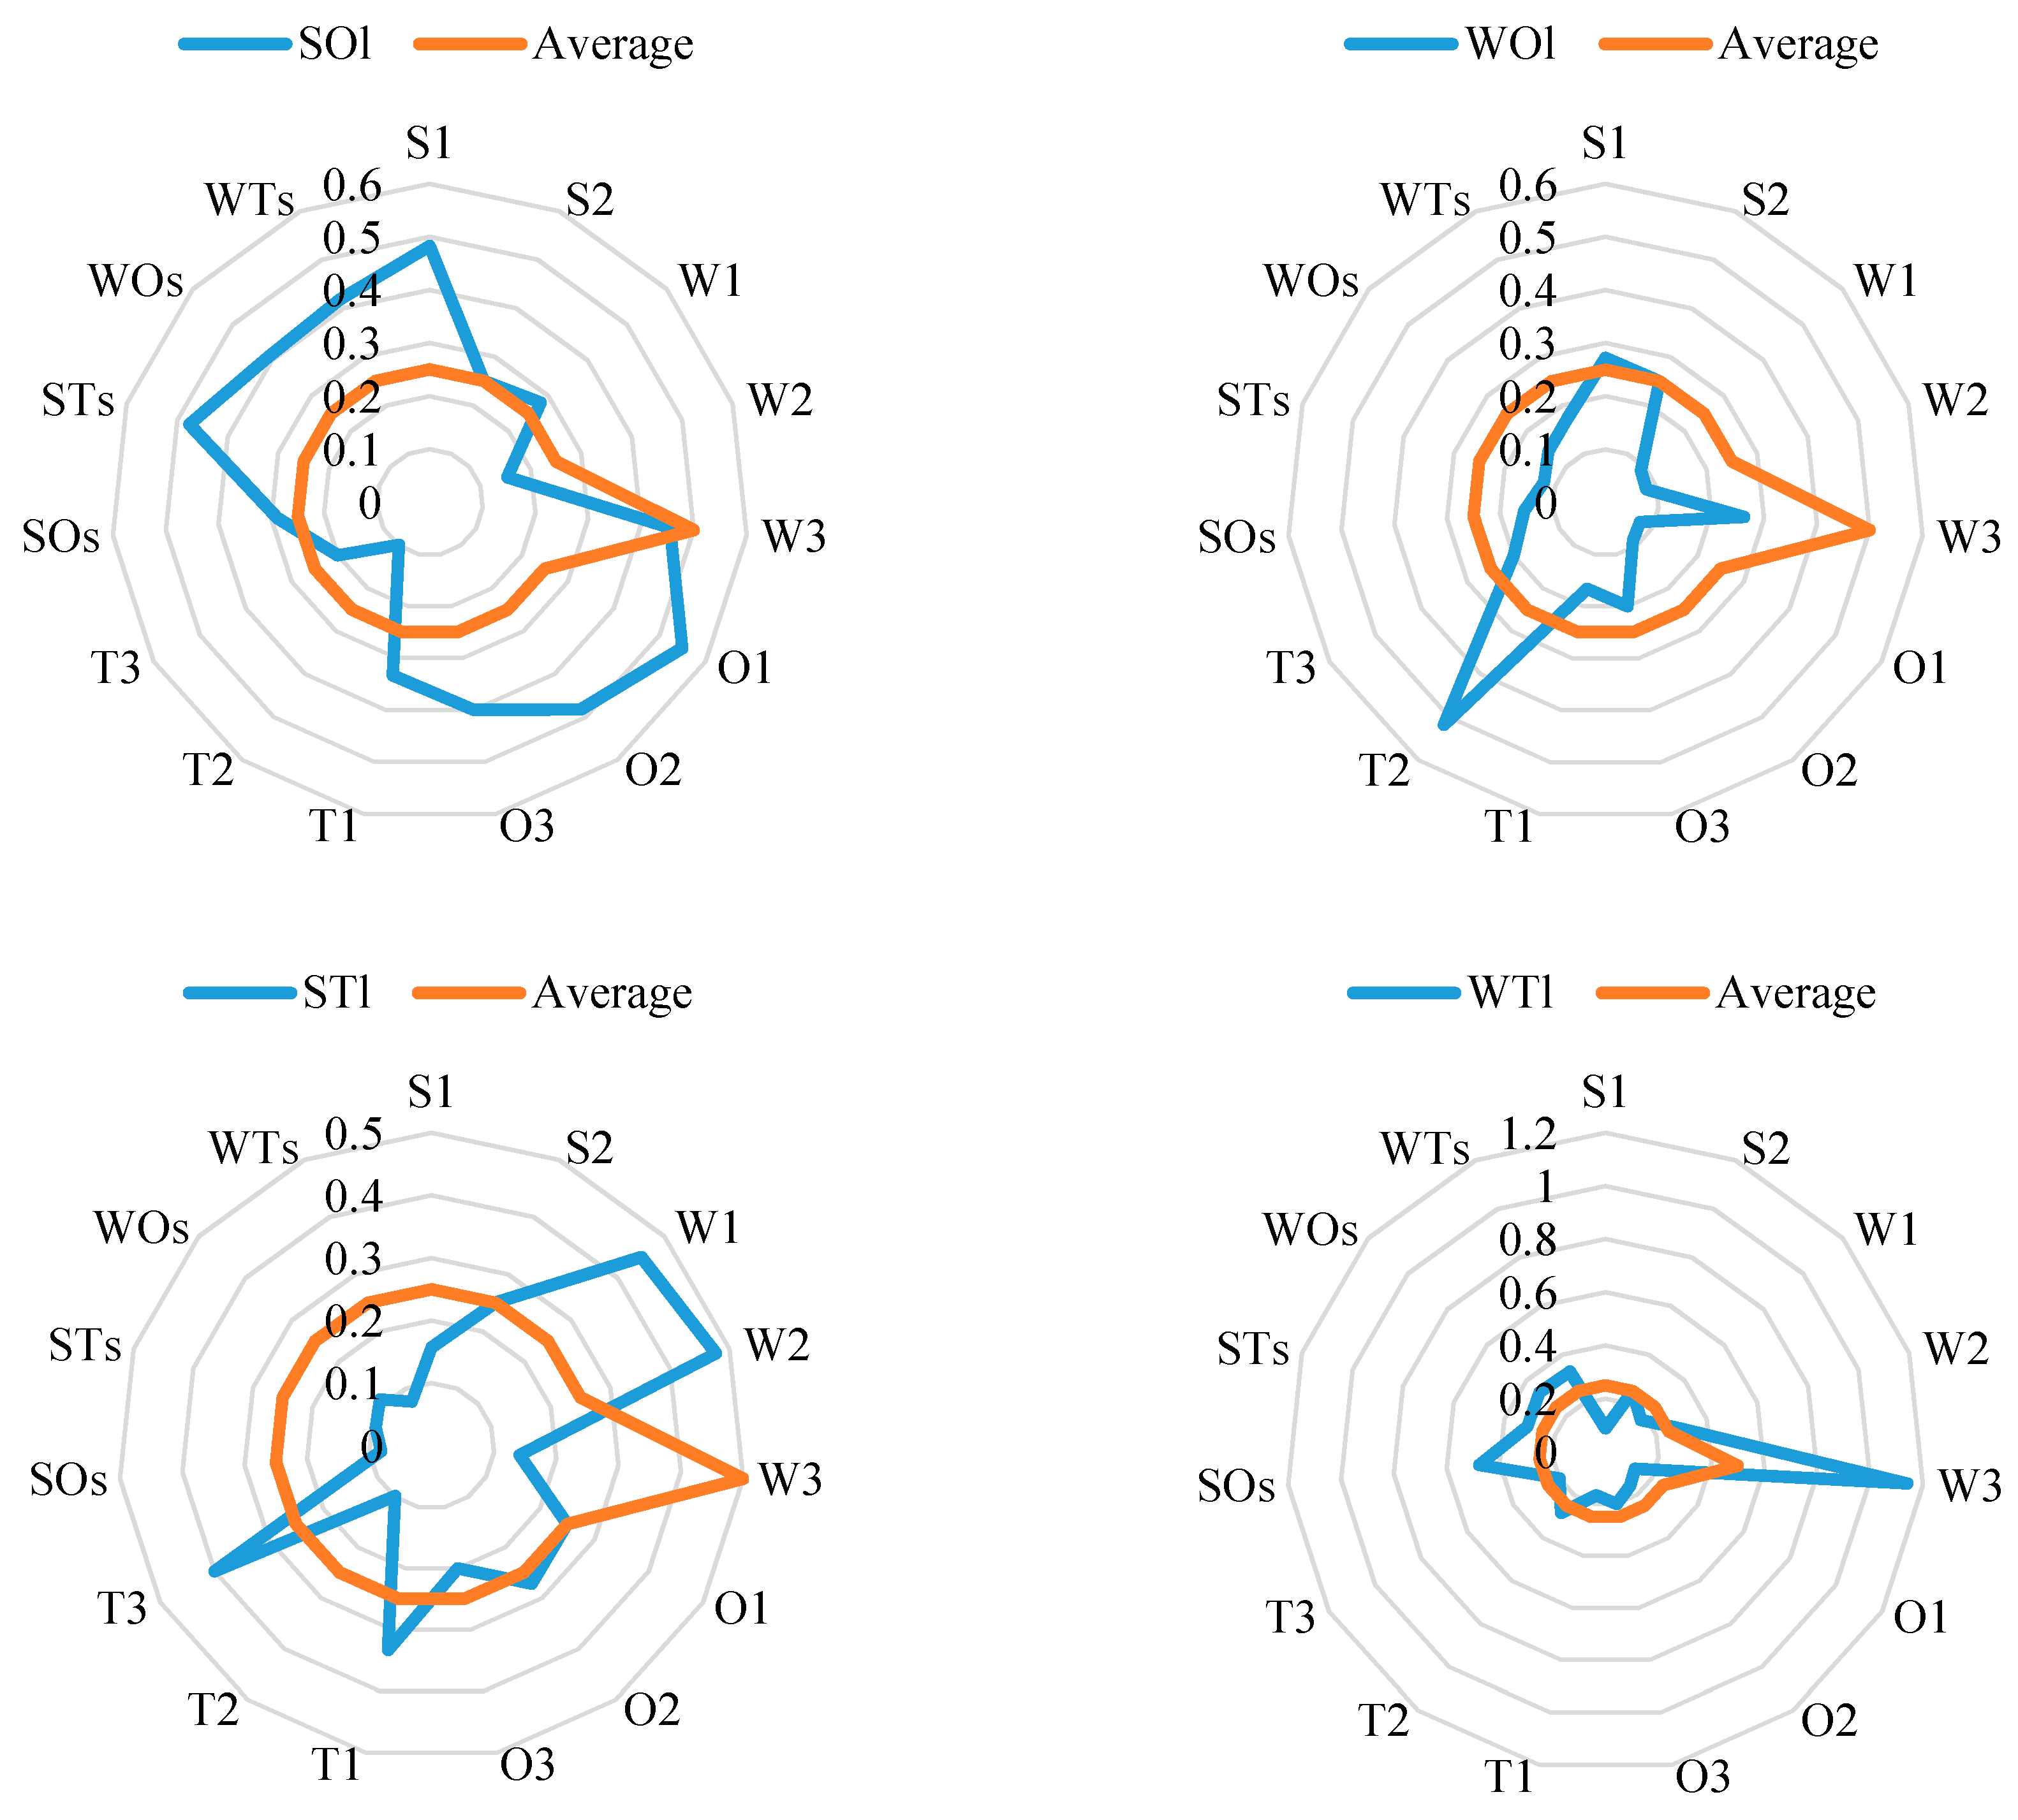
The weight and final ranking of China’s new energy vehicle industry long-term development strategy, as shown in Table 7.
In Table 7, which shows the final weighted value and ranking of the strategy, it is evident that the use of local advantages enhance the competitiveness of the industry through cost control, and serves as the best long-term development strategy. Creation of core competences is fundamental to the advancement of the new energy automotive industry. A quote which applies to the overall importance of future development is, “To forge iron, one must be strong”. The use of new energy vehicles in China will help to enhance competitiveness within the international automotive industry. The results of the strategic comparison are shown in Figure 7.
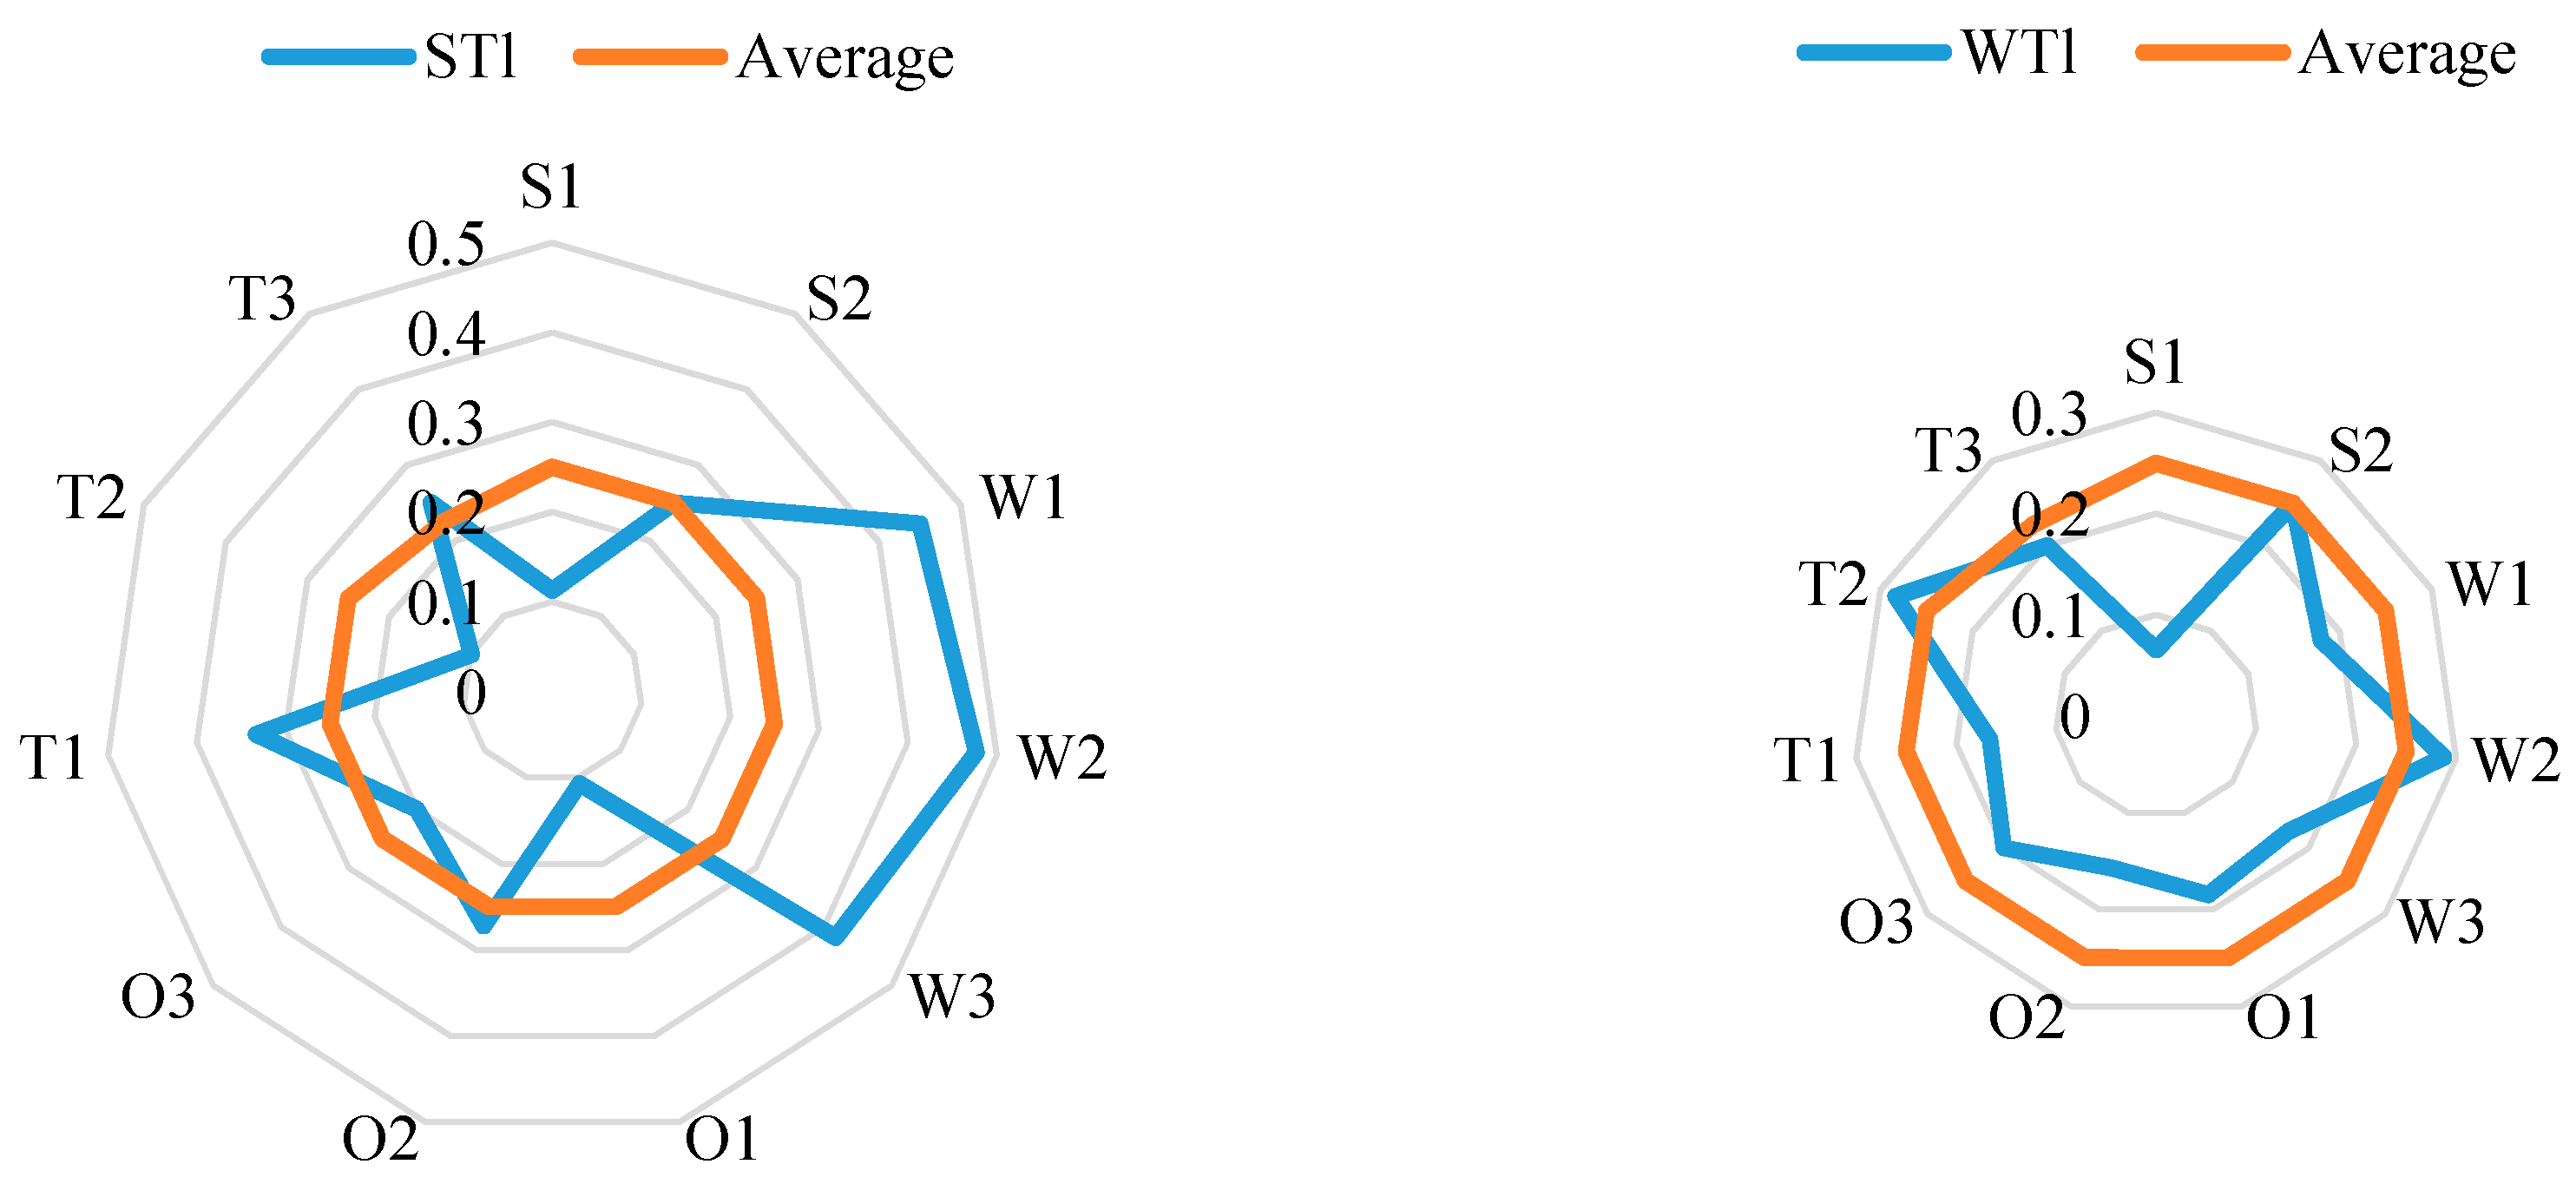
3.4. Analysis and Evaluation of Short-Term Development Strategies for China’s New Energy Auto Industry
The four short-term development strategies are evaluated with each influencing factor as the criterion (See Appendix E for details). Thus, we can get the weighted values using a matrix of each factor under the ANP analysis for each short-term development program (as shown in Table 8).
Using the weighting matrix of the alternatives under each influencing factor, the weights to alternatives are as follows:
For the short-term development strategy to China’s new energy automotive industry see Table 9 for weights and final rankings.
When not considering the relationship between the species strategy from the evaluation results, and the WOs strategy, the optimal short-term development strategy is to avoid disadvantages and accelerate the construction of facilities designated for new energy vehicles.
Short-term development strategies are very important, as China’s new energy automotive industry is in the early stages of rapid development. Such strategies can transition into essential long-term development strategies. Infrastructure construction is crucial to the development of new energy vehicles such as pure electric vehicles and rechargeable hybrid vehicles that must rely on charging network coverage.
This strategy should be given priority, as it is important to the early developmental stages of the new energy automotive industry. The results of the strategic comparison are shown in Figure 8.
3.5. Outcomes and Considerations for the Impact of Short-Term Strategy on Long-Term Strategy
In the above analysis, we assume that there is no relationship between long-term development strategies and short-term development strategies. However, to some extent the long-term development strategy will be affected by the short-term development strategy. We will consider the impact short-term development strategy has on the long-term strategic ranking to ensure the sustainable development of China’s new energy automotive industry. This mutual influence relationship is shown in Figure 9.
Taking into account the impact of short-term developmental strategies, we use four short-term development strategies as the criterion, and the four sustainable development strategies to evaluate the impact. See Appendix F. Table 10 shows this impact.
The weights of the alternatives under the influence of the short-term development strategy are obtained by using the weight formation matrix of alternatives:
Consider the impact of short-term development strategy on the long-term development strategy using the weights and the final ranking in Table 11.
The evaluation results show that the strategy, which is the new energy automotive industry “market segmentation” strategy, gives priority to the use of industrial advantages for the development of a market segment of new energy vehicles and is therefore the best long-term development strategy.
The final ranking of importance changes, taking into account the impact of short-term development strategies on long-term development strategies, shown in Table 12.
This change in long-term development strategy results from factors that affect long-term development strategy, the short-term development strategy to take into account, the four long-term development strategy to join, the impact of strategic factors on the impact of options. Here, we see the weighted values have changed. The results of the strategic comparison are shown in Figure 10.
4. Conclusions
Strategic planning is essential to the sustainable development of China’s new energy automotive industry. In this paper, the primary use of the SWOT analysis model yielded a comprehensive analysis of China’s new energy automotive industry, using internal and external factors, the proposed four short-term development strategies and the four long-term development strategies, including the SO/WO/ST/WT methods. The ANP model was then used to study the interdependence and feedback relationship of each influencing factor. Finally, the ANP-SWOT model of China’s new energy automobile industry was established.
According to the results of the ANP analysis in Table 7, the best long-term development strategy for China’s new energy vehicle industry is to make use of local advantages through cost control measures, without considering the short-term impact of industry competition. According to the results of the ANP analysis in Table 9, the optimal short-term development strategy is to accelerate the construction of facilities that produce new energy vehicles, to scientifically plan and strengthen technology development and to explore effective business operation models that relate to new energy automotive needs.
In analyzing the developmental process of new energy vehicles we see that the choice of strategy is not set in stone and is constantly evolving. In exploring the industry’s long-term sustainable development strategy, we should also take into account short-term strategies, in the initial stage of industrial development, which promote and impact the overall strategic planning and sustainable development of new energy vehicles in China.
The results of the ANP analysis in Table 11 show that the optimal development strategy for the new energy vehicle industry is to subdivide and exploit the market for these vehicles, taking into account the impact of short-term development strategies on long-term development strategies. Priority is given to the use of industrial advantages in this strategy.
Overall, in calculating the impact of various factors using weighted values for strategies, the results show that the most influential factor in the development of new energy vehicles is the “national and government support”, in which preferential policies and subsidies influence the rapid development of the new energy automotive industry and achieve a series of important and advanced results. This is consistent with the notion of Mazzucato, who maintains that major innovations only occur with government support [37]. The factors that negatively affect the development of China’s new energy automotive industry are “inadequate infrastructure”, “resource integration” and the “traditional automobile industry”. Therefore, we should make the best use of China’s own energy resource advantages and industrial advantages, using a rational integration of resources and optimization strategies, while considering risk aversion to ensure further development of China’s new energy automotive industry and to promote China’s auto industry economy.
Acknowledgments
This paper was supported by the International Business Center at the University of Pittsburgh; the China Scholarship Council; the National Natural Science Foundation of China Grant No. 71101041, 71490725, the National Statistics Research Projects Grant No. 2013LZ07.
Author Contributions
Xiaojia Wang and Chenggong Li conceived and designed the experiments; Jennifer Shang contributed the discussion and revision; Changhui Yang and Xinsheng Ke contributed analysis tools.
Conflicts of Interest
The authors declare no conflict of interest.
Appendix A
An Investigation on the Influencing Factors of the Development of New Energy Vehicle Industry in China
Hello experts:
Thank you for your participation in the questionnaire. Based on the SWOT analysis of the internal and external factors influencing the development of China’s new energy vehicle industry, this questionnaire divides into four parts: advantages, disadvantages, opportunities and threats to determine the importance of influencing factors. Please complete your choice in parentheses. At the same time, we can also add that we did not mention and you think the important factors.
China’s new energy automotive industry development “advantage” factors
| 1. Resources and energy advantages | |||
| A. very important ( ) | B. important ( ) | C. generally important ( ) | D. is not important ( ) |
| 2. Strong scientific research | |||
| A. very important () | B. important () | C. generally important () | D. is not important () |
| 3. Market advantage | |||
| A. very important ( ) | B. important ( ) | C. generally important ( ) | D. is not important ( ) |
| 4. Industrial advantages | |||
| A. very important ( ) | B. important ( ) | C. generally important ( ) | D. is not important ( ) |
| 5. Development of environmental advantages | |||
| A. very important () | B. important () | C. generally important () | D. is not important () |
| 6. Cost advantage | |||
| A. very important () | B. important () | C. generally important () | D. is not important () |
| 7. Other important factors that you believe are:___________ | |||
China’s new energy automotive industry development “disadvantage” factor
| 1. Large-scale investment in charging equipment | |||
| A. very important () | B. important () | C. generally important () | D. is not important () |
| 2. Production scale is small, low yield | |||
| A. very important () | B. important () | C. generally important () | D. is not important () |
| 3. Resource integration weaknesses | |||
| A. very important () | B. important () | C. generally important () | D. is not important () |
| 4. Lack of purchasing power | |||
| A. very important () | B. important () | C. generally important () | D. is not important () |
| 5. Consumption concept behind | |||
| A. very important () | B. important () | C. generally important () | D. is not important () |
| 6. Key technology is lacking | |||
| A. very important () | B. important () | C. generally important () | D. is not important () |
| 7. Inadequate infrastructure support | |||
| A. very important () | B. important () | C. generally important () | D. is not important () |
| 8. Dependent on imports | |||
| A. very important () | B. important () | C. generally important () | D. is not important () |
| 9. Other important factors that you believe are:_______________________________ | |||
China’s new energy automotive industry development “opportunity” factor
| 1. National policy and government support | |||
| A. very important () | B. important () | C. generally important () | D. is not important () |
| 2. Low-carbon economic and environmental issues bring development opportunities | |||
| A. very important () | B. important () | C. generally important () | D. is not important () |
| 3. Oil prices rise | |||
| A. very important () | B. important () | C. generally important () | D. is not important () |
| 4. China’s new energy vehicle penetration is low | |||
| A. very important () | B. important () | C. generally important () | D. is not important () |
| 5. Opportunity opportunities | |||
| A. very important () | B. important () | C. generally important () | D. is not important () |
| 6. Energy-saving emission reduction policy to promote | |||
| A. very important () | B. important () | C. generally important () | D. is not important () |
| 7. Market opportunities | |||
| A. very important () | B. important () | C. generally important () | D. is not important () |
| 8. Competition and cooperation within the industry | |||
| A. very important () | B. important () | C. generally important () | D. is not important () |
| 9. Other important factors that you believe are:_______________________________ | |||
China’s new energy automotive industry development “threat” factors
| 1. Competition between regions | |||
| A. very important () | B. important () | C. generally important () | D. is not important () |
| 2. Higher manufacturing costs | |||
| A. very important () | B. important () | C. generally important () | D. is not important () |
| 3. New energy vehicles bring secondary pollution | |||
| A. very important () | B. important () | C. generally important () | D. is not important () |
| 4. Power supply is unstable | |||
| A. very important () | B. important () | C. generally important () | D. is not important () |
| 5. The threat of the traditional automotive industry | |||
| A. very important () | B. important () | C. generally important () | D. is not important () |
| 6. New energy vehicle development challenges | |||
| A. very important () | B. important () | C. generally important () | D. is not important () |
| 7. Subsidies and tax cuts and other policies triggered by the car manufacturers rent-seeking activities | |||
| A. very important () | B. important () | C. generally important () | D. is not important () |
| 8. Transnational auto giant | |||
| A. very important () | B. important () | C. generally important () | D. is not important () |
| 9. Other important factors that you believe are:_______________________________ | |||

Appendix B
Table A1.
The inner dependency matrix of the SWOT factors with respect to other factor.
| Strength | Relative Dependency | |||
| 1 | 1/2 | 2.5 | 0.304 | |
| 2 | 1 | 4 | 0.565 | |
| 1/2.5 | 1/4 | 1 | 0.131 | |
| CR = 0.005 | ||||
| Weakness | Relative Dependency | |||
| 1 | 1/4 | 1/2 | 0.137 | |
| 4 | 1 | 3 | 0.625 | |
| 2 | 1/3 | 1 | 0.238 | |
| CR = 0.017 | ||||
| Opportunity | Relative dependency | |||
| 1 | 1/2 | 1/5 | 0.128 | |
| 2 | 1 | 0.5 | 0.276 | |
| 5 | 2 | 1 | 0.595 | |
| CR = 0.005 | ||||
| Threat | Relative dependency | |||
| 1 | 2 | 4 | 0.578 | |
| 1/2 | 1 | 1.5 | 0.263 | |
| 1/4 | 2/3 | 1 | 0.159 | |
| CR = 0.008 | ||||
Appendix C
Table A2.
Pairwise comparison matrix on demand opportunities.
| Weight | ||||
|---|---|---|---|---|
| 1 | 1/2 | 1/2 | 0.2000 | |
| 2 | 1 | 1 | 0.4000 | |
| 2 | 1 | 1 | 0.4000 | |
| CR = 0.00 | ||||
Table A3.
Pairwise comparison matrix on market opportunities.
| Weight | ||||
|---|---|---|---|---|
| 1 | 3 | 1 | 0.443 | |
| 1/3 | 1 | 1/2 | 0.169 | |
| 1 | 2 | 1 | 0.387 | |
| CR = 0.017 | ||||
Table A4.
Pairwise comparison matrix on Inadequate infrastructure.
| Weight | |||
|---|---|---|---|
| 1 | 1 | 0.500 | |
| 1 | 1 | 0.500 | |
| CR = 0.00 | |||
Table A5.
Pairwise comparison matrix on traditional automobile industry.
| Weight | ||||
|---|---|---|---|---|
| 1 | 1/3 | 1 | 0.200 | |
| 3 | 1 | 3 | 0.600 | |
| 1 | 1/3 | 1 | 0.200 | |
| CR = 0.00 | ||||
Table A6.
Unweighted supermatrixes.
| 1 | 0 | 0 | 0 | 0 | 0.200 | 0 | 0.443 | 0 | 0 | 0 | |
| 0 | 1 | 0 | 0 | 0 | 0.400 | 0 | 0.169 | 0 | 0 | 0 | |
| 0 | 0 | 1 | 0.500 | 0 | 0 | 0 | 0 | 0.200 | 0 | 0 | |
| 0 | 0 | 0 | 1 | 0 | 0.400 | 0 | 0.387 | 0.600 | 0 | 0 | |
| 1.000 | 0 | 0 | 0 | 1 | 0 | 0 | 0 | 0 | 0 | 0 | |
| 0 | 0 | 0 | 0 | 0 | 1 | 0 | 0 | 0 | 0 | 0 | |
| 0 | 0 | 0 | 0 | 0 | 1.000 | 1 | 0 | 0 | 0 | 0 | |
| 0 | 0 | 0 | 0 | 0 | 0 | 0 | 1 | 0 | 0 | 0 | |
| 0 | 0 | 0 | 0 | 0 | 0 | 0 | 0 | 1 | 0 | 0 | |
| 0 | 0 | 0 | 0 | 0 | 0 | 0 | 0 | 0 | 1 | 0 | |
| 0 | 0 | 0 | 0.500 | 0 | 0 | 0 | 0 | 0.200 | 0 | 1 |
Appendix D
Table A7.
Pairwise comparison matrix on resources and energy advantages.
| Weight | |||||
|---|---|---|---|---|---|
| 1 | 2 | 1/3 | 4 | 0.2257 | |
| 1/2 | 1 | 1/6 | 2 | 0.1128 | |
| 3 | 6 | 1 | 7 | 0.5963 | |
| 1/4 | 1/2 | 1/7 | 1 | 0.0652 | |
| CR = 0.014 | |||||
Table A8.
Pairwise comparison matrix on industrial advantages.
| Weight | |||||
|---|---|---|---|---|---|
| 1 | 1 | 1 | 1 | 0.2500 | |
| 1 | 1 | 1 | 1 | 0.2500 | |
| 1 | 1 | 1 | 1 | 0.2500 | |
| 1 | 1 | 1 | 1 | 0.2500 | |
| CR = 0.000 | |||||
Table A9.
Pairwise comparison matrix on the key technology is weak, lack of core technology.
| Weight | |||||
|---|---|---|---|---|---|
| 1 | 1/2 | 3 | 2 | 0.2806 | |
| 2 | 1 | 5 | 2 | 0.4503 | |
| 1/3 | 1/5 | 1 | 1/2 | 0.0898 | |
| 1/2 | 1/2 | 2 | 1 | 0.1793 | |
| CR = 0.015 | |||||
Table A10.
Pairwise comparison matrix on inadequate infrastructures.
| Weight | |||||
|---|---|---|---|---|---|
| 1 | 1/3 | 2 | 1/2 | 0.1539 | |
| 3 | 1 | 5 | 2 | 0.4773 | |
| 1/2 | 1/5 | 1 | 1/4 | 0.0808 | |
| 2 | 1/2 | 4 | 1 | 0.2880 | |
| CR = 0.007 | |||||
Table A11.
Pairwise comparison matrix on resource integration disadvantages.
| W3 | SOl | STl | WOl | WTl | Weight |
|---|---|---|---|---|---|
| SOl | 1 | 1/4 | 1/4 | 1/3 | 0.0776 |
| STl | 4 | 1 | 2 | 2 | 0.4177 |
| WOl | 4 | 1/2 | 1 | 3 | 0.3301 |
| WTl | 3 | 1/2 | 1/3 | 1 | 0.1746 |
| CR = 0.03 | |||||
Table A12.
Pairwise comparison matrix on demand opportunities.
| Weight | |||||
|---|---|---|---|---|---|
| 1 | 3 | 1/2 | 2 | 0.2926 | |
| 1/3 | 1 | 1/3 | 1/2 | 0.107 | |
| 2 | 3 | 1 | 2 | 0.4155 | |
| 1/2 | 2 | 1/2 | 1 | 0.185 | |
| CR = 0.026 | |||||
Table A13.
Pairwise comparison matrix on national and government policy support.
| Weight | |||||
|---|---|---|---|---|---|
| 1 | 2 | 5 | 3 | 0.4828 | |
| 1/2 | 1 | 3 | 2 | 0.2720 | |
| 1/5 | 1/3 | 1 | 1/2 | 0.0882 | |
| 1/3 | 1/2 | 2 | 1 | 0.1570 | |
| CR = 0.017 | |||||
Table A14.
Pairwise comparison matrix on Market opportunities.
| Weight | |||||
|---|---|---|---|---|---|
| 1 | 2 | 2 | 2 | 0.4000 | |
| 1/2 | 1 | 1 | 1 | 0.2000 | |
| 1/2 | 1 | 1 | 1 | 0.2000 | |
| 1/2 | 1 | 1 | 1 | 0.2000 | |
| CR = 0.00 | |||||
Table A15.
Pairwise comparison matrix on traditional automobile industry.
| Weight | |||||
|---|---|---|---|---|---|
| 1 | 1 | 2 | 2 | 0.3334 | |
| 1 | 1 | 2 | 2 | 0.3334 | |
| 1/2 | 1/2 | 1 | 1 | 0.1666 | |
| 1/2 | 1/2 | 1 | 1 | 0.1666 | |
| CR = 0.000 | |||||
Table A16.
Pairwise comparison matrix on multinational auto giants.
| Weight | |||||
|---|---|---|---|---|---|
| 1 | 1 | 1/5 | 1/3 | 0.0989 | |
| 1 | 1 | 1/5 | 1/3 | 0.0989 | |
| 5 | 5 | 1 | 2 | 0.5183 | |
| 3 | 3 | 1/2 | 1 | 0.2838 | |
| CR = 0.002 | |||||
Table A17.
Pairwise comparison matrix on high manufacturing costs.
| Weight | |||||
|---|---|---|---|---|---|
| 1 | 1 | 1 | 1 | 0.2500 | |
| 1 | 1 | 1 | 1 | 0.2500 | |
| 1 | 1 | 1 | 1 | 0.2500 | |
| 1 | 1 | 1 | 1 | 0.2500 | |
| CR = 0.000 | |||||
Appendix E
Table A18.
Pairwise comparison matrix on resources and energy advantages.
| S1 | SOs | STs | WOs | WTs | Weight |
|---|---|---|---|---|---|
| SOs | 1 | 3 | 1/3 | 1/2 | 0.1615 |
| STs | 1/3 | 1 | 1/7 | 1/5 | 0.0601 |
| WOs | 3 | 7 | 1 | 2 | 0.4906 |
| WTs | 2 | 5 | 1/2 | 1 | 0.2878 |
| CR = 0.007 | |||||
Table A19.
Pairwise comparison matrix on industrial advantages.
| Weight | |||||
|---|---|---|---|---|---|
| 1 | 1 | 1/5 | 1/3 | 0.0989 | |
| 1 | 1 | 1/5 | 1/3 | 0.0989 | |
| 5 | 5 | 1 | 2 | 0.5183 | |
| 3 | 3 | 1/2 | 1 | 0.2838 | |
| CR = 0.002 | |||||
Table A20.
Pairwise comparison matrix on the key technology is weak, lack of core technology.
| Weight | |||||
|---|---|---|---|---|---|
| 1 | 1 | 1 | 1 | 0.2500 | |
| 1 | 1 | 1 | 1 | 0.2500 | |
| 1 | 1 | 1 | 1 | 0.2500 | |
| 1 | 1 | 1 | 1 | 0.2500 | |
| CR = 0.00 | |||||
Table A21.
Pairwise comparison matrix on inadequate infrastructure.
| Weight | |||||
|---|---|---|---|---|---|
| 1 | 1/2 | 1 | 1 | 0.2000 | |
| 1 | 1 | 2 | 2 | 0.4000 | |
| 1 | 1/2 | 1 | 1 | 0.2000 | |
| 1 | 1/2 | 1 | 1 | 0.2000 | |
| CR = 0.00 | |||||
Table A22.
Pairwise comparison matrix on resource integration disadvantages.
| Weight | |||||
|---|---|---|---|---|---|
| 1 | 1/3 | 2 | 1/2 | 0.1539 | |
| 3 | 1 | 5 | 2 | 0.4773 | |
| 1/2 | 1/5 | 1 | 1/4 | 0.0808 | |
| 2 | 1/2 | 4 | 1 | 0.2880 | |
| CR = 0.007 | |||||
Table A23.
Pairwise comparison matrix on demand opportunities.
| Weight | |||||
|---|---|---|---|---|---|
| 1 | 1 | 1/5 | 1/5 | 0.0833 | |
| 1 | 1 | 1/5 | 1/5 | 0.0833 | |
| 5 | 5 | 1 | 1 | 0.4167 | |
| 5 | 5 | 1 | 1 | 0.4167 | |
| CR = 0.00 | |||||
Table A24.
Pairwise comparison matrix on national and government policy support.
| Weight | |||||
|---|---|---|---|---|---|
| 1 | 2 | 2 | 2 | 0.4000 | |
| 1/2 | 1 | 1 | 1 | 0.2000 | |
| 1/2 | 1 | 1 | 1 | 0.2000 | |
| 1/2 | 1 | 1 | 1 | 0.2000 | |
| CR = 0.00 | |||||
Table A25.
Pairwise comparison matrix on market opportunities.
| Weight | |||||
|---|---|---|---|---|---|
| 1 | 3 | 2 | 5 | 0.4829 | |
| 1/3 | 1 | 1/2 | 2 | 0.1570 | |
| 1/2 | 2 | 1 | 3 | 0.2720 | |
| 1/5 | 1/2 | 1/3 | 1 | 0.0882 | |
| CR = 0.005 | |||||
Table A26.
Pairwise comparison matrix on traditional automobile industry.
| Weight | |||||
|---|---|---|---|---|---|
| 1 | 1 | 2 | 2 | 0.3334 | |
| 1 | 1 | 2 | 2 | 0.3334 | |
| 1/2 | 1/2 | 1 | 1 | 0.1666 | |
| 1/2 | 1/2 | 1 | 1 | 0.1666 | |
| CR = 0.00 | |||||
Table A27.
Pairwise comparison matrix on multinational auto giants.
| Weight | |||||
|---|---|---|---|---|---|
| 1 | 1/2 | 3 | 2 | 0.2806 | |
| 2 | 1 | 5 | 2 | 0.4503 | |
| 1/3 | 1/5 | 1 | 1/2 | 0.0898 | |
| 1/2 | 1/2 | 2 | 1 | 0.1793 | |
| CR = 0.015 | |||||
Table A28.
Pairwise comparison matrix on high manufacturing costs.
| Weight | |||||
|---|---|---|---|---|---|
| 1 | 3 | 2 | 3 | 0.4554 | |
| 1/3 | 1 | 1/2 | 1 | 0.1409 | |
| 1/2 | 2 | 1 | 2 | 0.2628 | |
| 1/3 | 1 | 1/2 | 1 | 0.1409 | |
| CR = 0.004 | |||||
Appendix F
Table A29.
Pairwise comparison matrix on SOs.
| Weight | |||||
|---|---|---|---|---|---|
| 1 | 4 | 2 | 1/2 | 0.2880 | |
| 1/4 | 1 | 1/2 | 1/5 | 0.0809 | |
| 1/2 | 2 | 1 | 1/3 | 0.1538 | |
| 2 | 5 | 3 | 1 | 0.4773 | |
| CR = 0.008 | |||||
Table A30.
Pairwise comparison matrix on WOs.
| Weight | |||||
|---|---|---|---|---|---|
| 1 | 3 | 5 | 2 | 0.4759 | |
| 1/3 | 1 | 1/2 | 1/4 | 0.0937 | |
| 1/5 | 2 | 1 | 1/3 | 0.1217 | |
| 1/2 | 4 | 3 | 1 | 0.3087 | |
| CR = 0.06 | |||||
Table A31.
Pairwise comparison matrix on STs.
| Weight | |||||
|---|---|---|---|---|---|
| 1 | 2 | 3 | 2 | 0.4092 | |
| 1/2 | 1 | 1/2 | 1/4 | 0.1113 | |
| 1/3 | 2 | 1 | 1/3 | 0.1450 | |
| 1/2 | 4 | 3 | 1 | 0.3345 | |
| CR = 0.09 | |||||
Table A32.
Pairwise comparison matrix on WTs.
| Weight | |||||
|---|---|---|---|---|---|
| 1 | 4 | 2 | 2 | 0.4177 | |
| 1/4 | 1 | 1/3 | 1/4 | 0.0776 | |
| 1/2 | 3 | 1 | 1/3 | 0.1746 | |
| 1/2 | 4 | 3 | 1 | 0.3301 | |
| CR = 0.05 | |||||
References
- International Energy Agency (IEA). World Energy Outlook 2016. Available online: http://www.iea.cc/ (accessed on 16 November 2016).
- Gao, L.; Winfield, Z.C. Life cycle assessment of environmental and economic impacts of advanced vehicles. Energies 2012, 5, 605–620. [Google Scholar] [CrossRef]
- Ministry of Industry and Information Technology of the People’s Republic of China. Regulations on the Administration of New Energy Automobile Production Enterprises and Products Access (Revised Draft). Available online: http://www.miit.gov.cn/n1146295/n1652858/n1653100/n3767755/c5202297/part/5202301.pdf (accessed on 12 August 2016).
- Ahmadi, L.; Elkamel, A. Multi-period optimization model for electricity generation planning considering plug-in hybrid electric vehicle penetration. Energies 2012, 8, 3978–4002. [Google Scholar] [CrossRef]
- China Association of Automobile Manufactures (CAAM). China Auto Sales in 2011–2014. Available online: http://www.caam.org.cn/ (accessed on 10 September 2015).
- Ministry of Industry and Information Technology of the People’s Republic of China. New Energy Vehicles in 2015 High Growth. Available online: http://www.miit.gov.cn/n1146312/n1146904/n1648362/n1648363/c4600465/content.html (accessed on 15 January 2016).
- Ministry of Finance of the People’s Republic of China. About 2016–2020 New Energy Vehicle Promotion and Application Notice of Financial Support Policy. Available online: http://jjs.mof.gov.cn/zhengwuxinxi/zhengcefagui/201504/t20150429_1224515.html (accessed on 22 April 2015).
- Central People’s Government of the People’s Republic of China. Energy Saving and New Energy Automotive Industry Development Plan (2012–2020). Available online: http://www.gov.cn/gongbao/content/2012/content_2182749.htm (accessed on 28 June 2012).
- Central People’s Government of the People’s Republic of China. Made in China 2025. Available online: http://www.gov.cn/zhengce/content/2015-05/19/content_9784.htm (accessed on 8 May 2015).
- Andrews, K.R. The Concept of Corporate Strategy; Dow Jones-Irwin: Homewood, CA, USA, 1965. [Google Scholar]
- Hill, T.; Westbrook, R. SWOT analysis: It’s time for a product recall. Long Range Plan. 1997, 30, 46–52. [Google Scholar] [CrossRef]
- Dyson, R.G. Strategic development and SWOT analysis at the University of Warwick. Eur. J. Oper. 2004, 152, 631–640. [Google Scholar] [CrossRef]
- Pahl, N.; Richter, A. SWOT Analysis—Idea, Methodology and a Practical Approach; BoD Books on Demand: Hamburg, Germany, 2009. [Google Scholar]
- Saaty, T.L. Decision Making for Leaders: The Analytical Hierarchy Process for Decisions in a Complex Work; Lifetime Learning Publications: Wadsworth, OH, USA, 1982. [Google Scholar]
- Ho, W. Integrated analytic hierarchy process and its applications -literature review. Eur. J. Oper. Res. 2008, 186, 211–228. [Google Scholar] [CrossRef]
- Chang, H.H.; Huang, W.C. Application of a quantification SWOT analytical method. Math. Comput. Model. 2006, 43, 158–169. [Google Scholar] [CrossRef]
- Amiri, M.P. Project selection for oil-fields development by using the AHP and fuzzy TOPSIS methods. Expert Syst. Appl. 2010, 37, 6218–6224. [Google Scholar] [CrossRef]
- Vidal, L.-A.; Marle, F.; Bocquet, J.-C. Using a Delphi process and the Analytic Hierarchy Process (AHP) to evaluate the complexity of projects. Expert Syst. Appl. 2011, 38, 5388–5405. [Google Scholar] [CrossRef]
- Saaty, T.L. Decision Making with Dependence and Feedback: The Analytic Network Process; RWS Publication PA: Pittsburgh, PA, USA, 1996. [Google Scholar]
- Saaty, T.L. Decision making -the analytic hierarchy and network processes (AHP/ANP). J. Syst. Sci. Syst. Eng. 2004, 13, 1–35. [Google Scholar] [CrossRef]
- Bruno, G.; Esposito, E.; Genovese, A.; Passaro, R. AHP-based approaches for supplier evaluation: Problems and perspectives. J. Purch. Supply Manag. 2012, 18, 159–172. [Google Scholar] [CrossRef]
- Sevkli, M.; Oztekin, A.; Uysal, O.; Torlak, G.; Turkyilmaz, A.; Delen, D. Development of a fuzzy ANP based SWOT analysis for the airline industry in Turkey. Expert Syst. Appl. 2012, 39, 14–24. [Google Scholar] [CrossRef]
- Chen, J.; Yang, Y. A Fuzzy ANP-based approach to evaluate region agricultural drought risk. Procedia Eng. 2011, 23, 822–827. [Google Scholar] [CrossRef]
- Lee, H.; Kim, C.; Cho, H.; Park, Y. An ANP-based technology network for identification of core technologies: A case of telecommunication technologies. Expert Syst. Appl. 2009, 36, 894–908. [Google Scholar] [CrossRef]
- Atmaca, E.; Basar, H.B. Evaluation of power plants in Turkey using Analytic Network Process (ANP). Energy 2012, 44, 555–563. [Google Scholar] [CrossRef]
- Theißen, S.; Spinler, S. Strategic analysis of manufacturer–supplier partnerships: An ANP model for collaborative CO2 reduction management. Eur. J. Oper. Res. 2014, 233, 383–397. [Google Scholar] [CrossRef]
- Aragonés-Beltrán, P.; Chaparro-González, F.; Pastor-Ferrando, J.-P.; Pla-Rubio, A. An AHP (Analytic Hierarchy Process)/ANP (Analytic Network Process)-based multi-criteria decision approach for the selection of solar-thermal power plant investment projects. Energy 2014, 66, 222–238. [Google Scholar] [CrossRef]
- Yüksel, İ.; Daǧ deviren, M. Using the analytic network process (ANP) in a SWOT analysis—A case study for a textile firm. Inf. Sci. 2007, 177, 3364–3382. [Google Scholar] [CrossRef]
- Kurttila, M.; Pesonen, M.; Kangas, J.; Kajanus, M. Utilizing the analytic hierarchy process (AHP) in SWOT analysis—A hybrid method and its application to a forest certification case. For. Policy Econ. 2000, 1, 41–52. [Google Scholar] [CrossRef]
- Kajanus, M.; Leskinen, P.; Kurttila, M.; Kangas, J. Making use of MCDS methods in SWOT analysis—Lessons learnt in strategic natural resources management. For. Policy Econ. 2012, 20, 1–9. [Google Scholar] [CrossRef]
- Babaesmailli, M.; Arbabshirani, B.; Golmah, V. Integrating analytical network process and fuzzy logic to prioritize the strategies—A case study for tile manufacturing firm. Expert Syst. Appl. 2012, 39, 925–935. [Google Scholar] [CrossRef]
- Shahabi, R.S.; Basiri, M.H.; Kahag, M.R.; Zonouzi, S.A. An ANP–SWOT approach for interdependency analysis and prioritizing the Iran’s steel scrap industry strategies. Resour. Policy 2014, 42, 18–26. [Google Scholar] [CrossRef]
- Azimi, R.; Yazdani-Chamzini, A.; Fouladgar, M.M.; Zavadskas, E.K.; Basiri, M.H. Ranking the strategies of mining sector through ANP and TOPSIS in a SWOT framework. J. Bus. Econ. Manag. 2011, 12, 670–689. [Google Scholar] [CrossRef]
- Khaligh, A.; Dusmez, S. Comprehensive topological analysis of conductive and inductive charging solutions for plug-in electric vehicles. IEEE Trans. Veh. Technol. 2012, 8, 3475–3489. [Google Scholar] [CrossRef]
- Osawa, J.; Nakano, M. Economic and environmental impacts on the portfolio of clean energy vehicles in Japan. In IFIP International Conference on Advances in Production Management Systems; Springer International Publishing: Cham, Switzerland.
- Liu, Y.; Kokko, A. Who does what in China’s new energy vehicle industry? Energy Policy 2013, 57, 21–29. [Google Scholar] [CrossRef]
- Mazzucato, M. The Entrepreneurial State: Debunking Public vs. Private Sector Myths; Anthem Press: London, UK, 2013. [Google Scholar]
Figure 1.
China’s new energy vehicle production and sales.

Figure 2.
Article Framework.
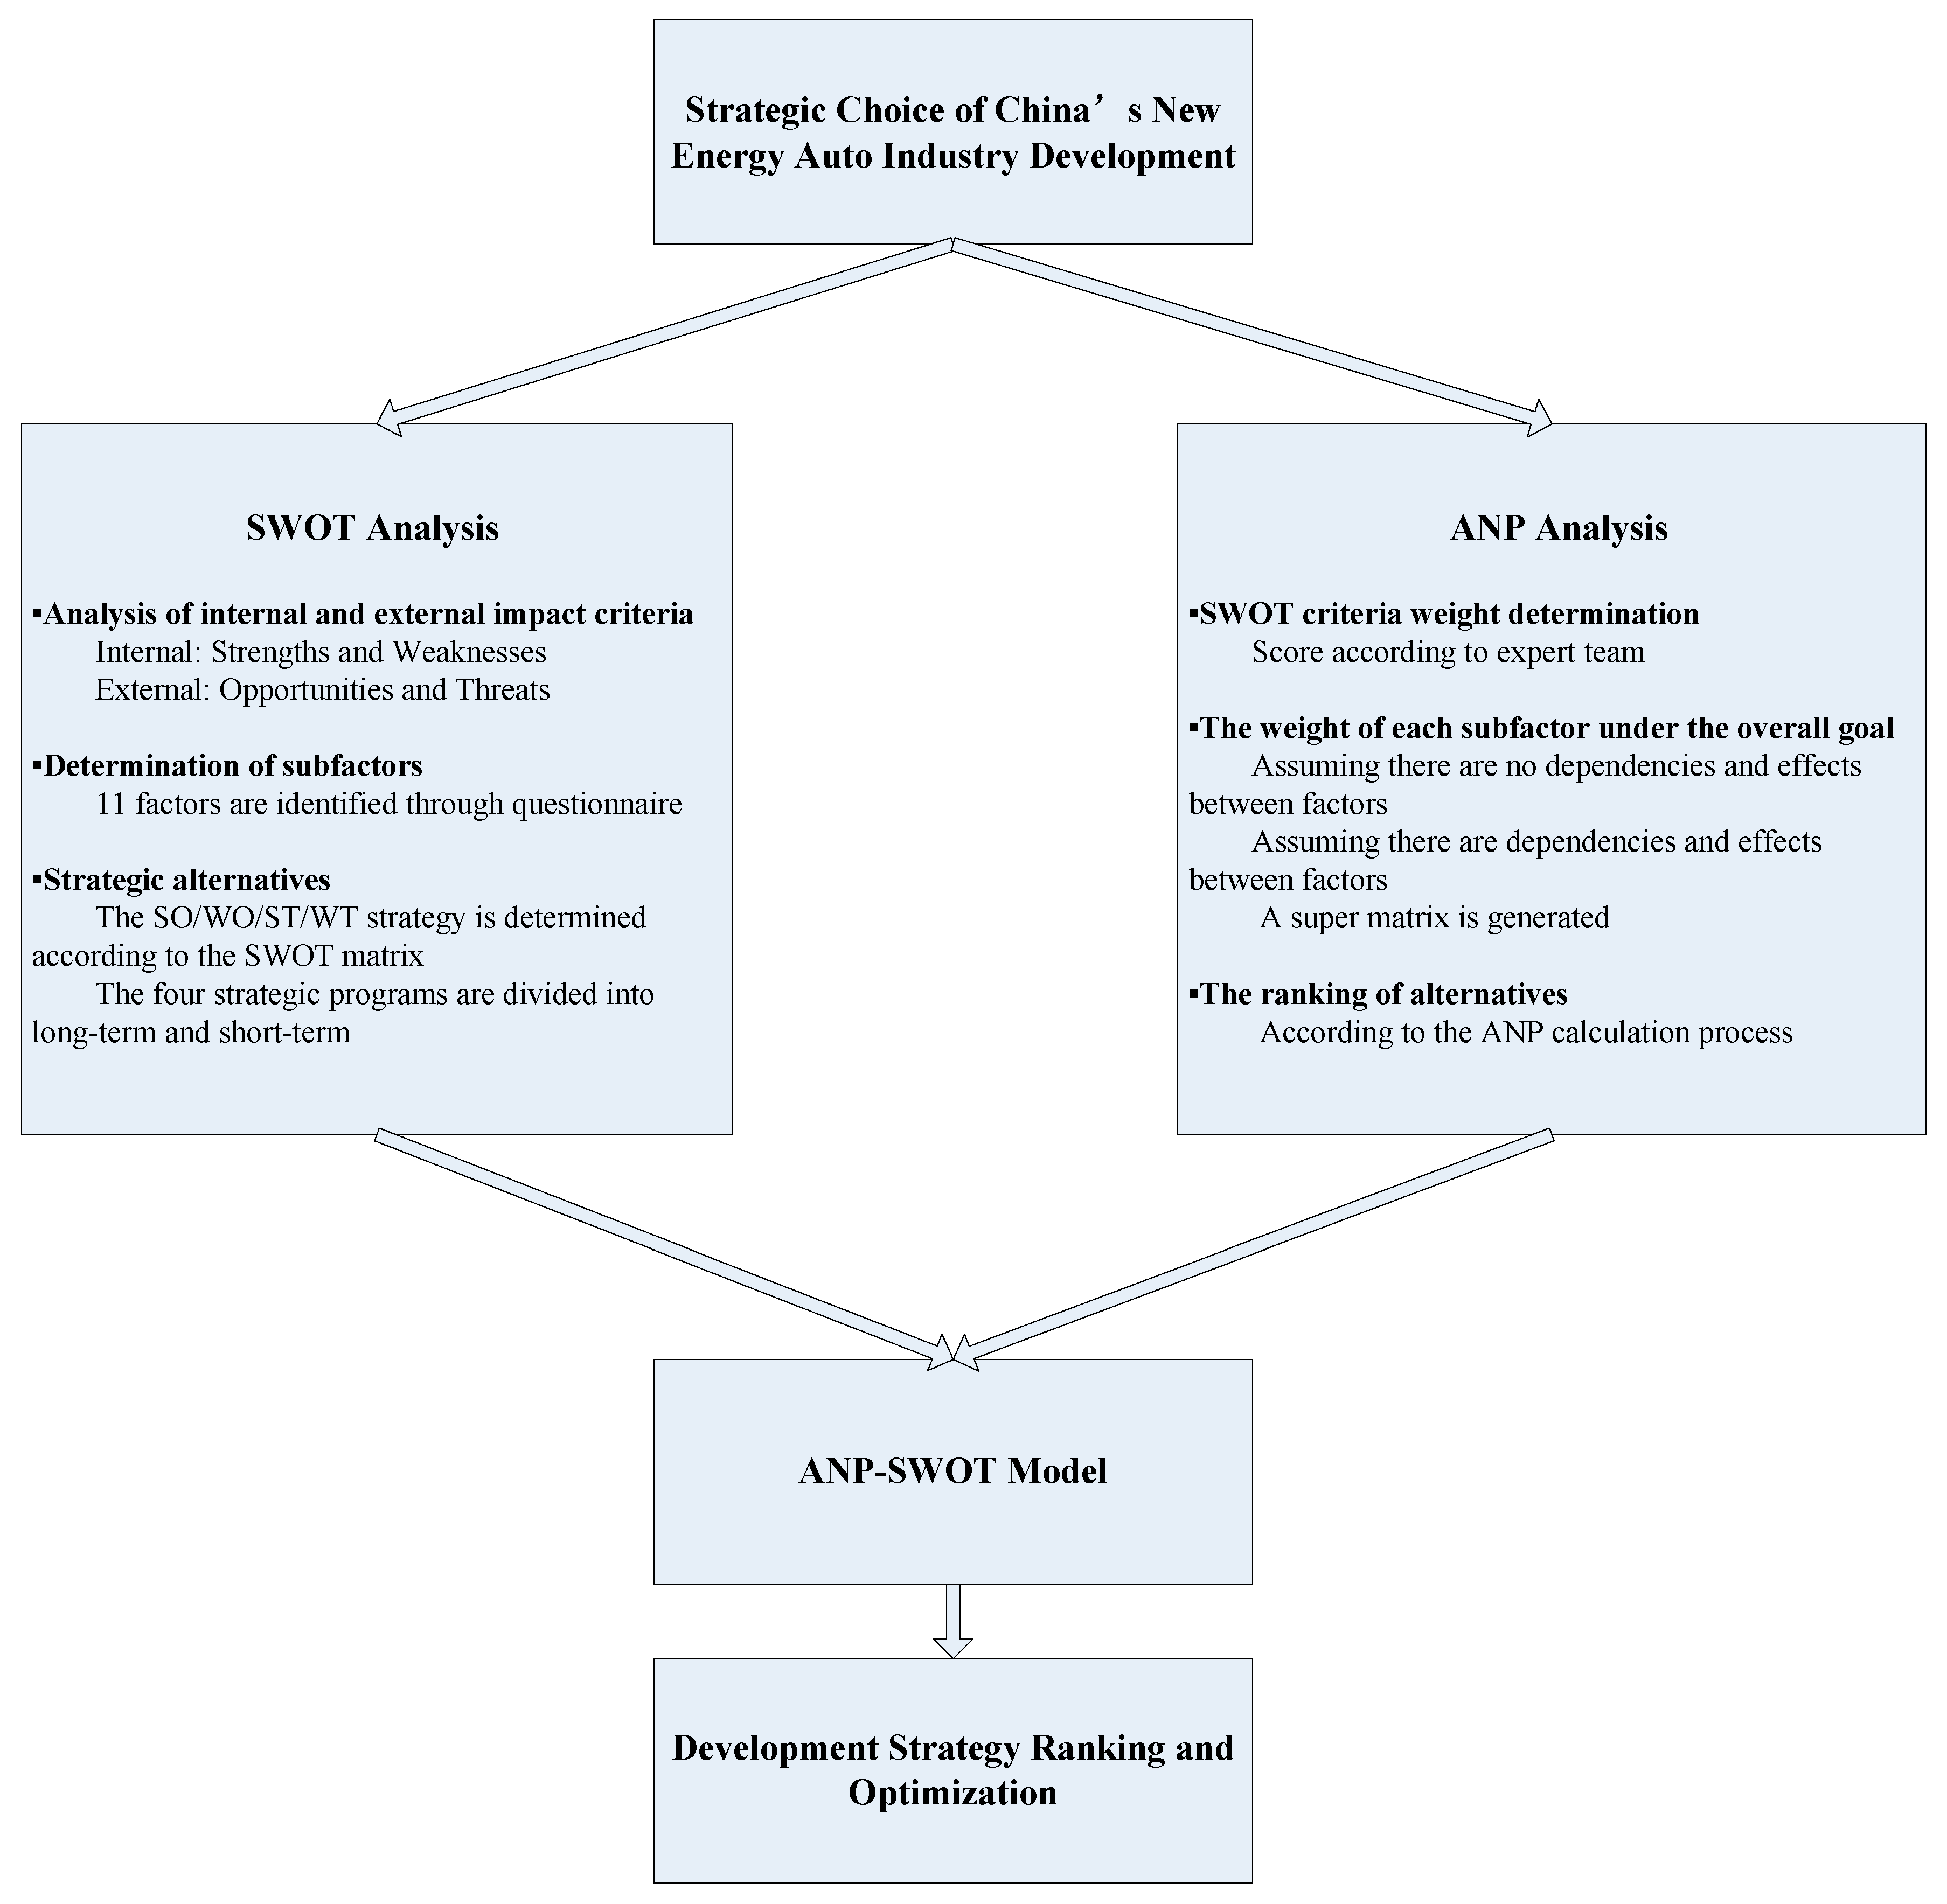
Figure 3.
China’s new energy automotive industry SWOT analysis.

Figure 4.
China’s choice strategy for the development of the new energy automotive industry using a network hierarchy.
Figure 4.
China’s choice strategy for the development of the new energy automotive industry using a network hierarchy.
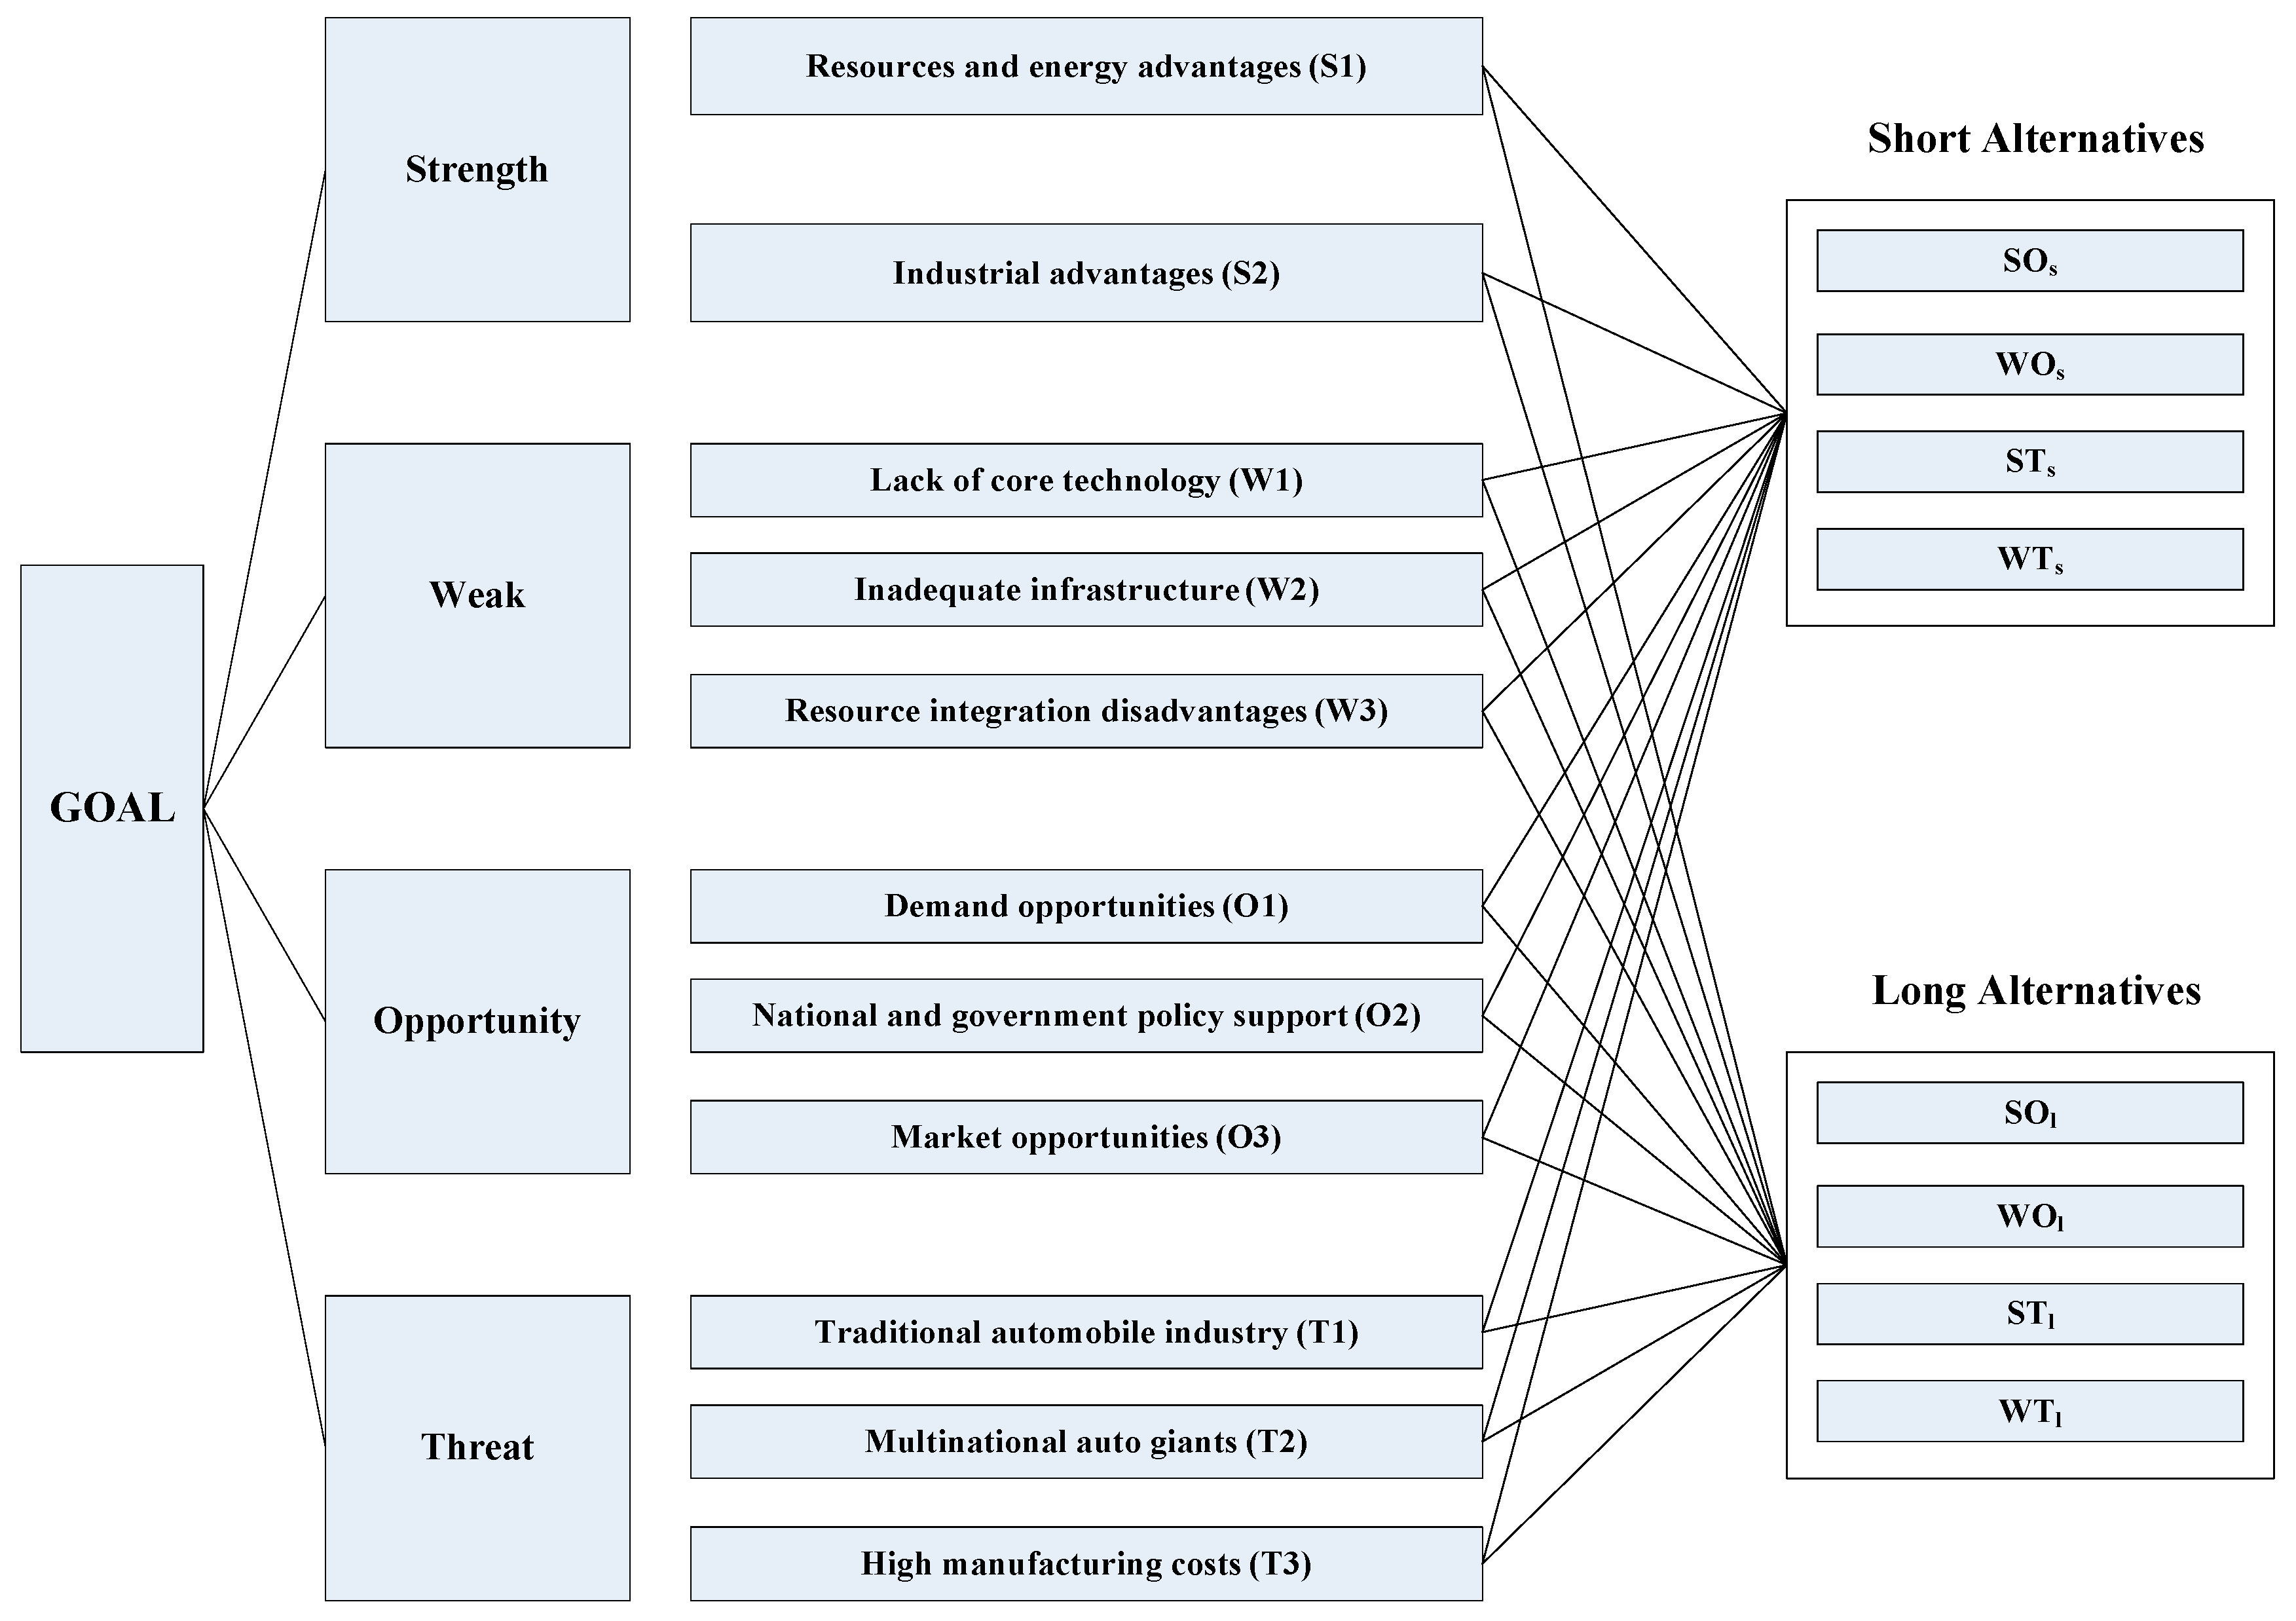
Figure 5.
SWOT criterion internal influence relation.

Figure 6.
The Relationship between Internal and External Factor.

Figure 7.
The results of Long-term strategic alternatives.
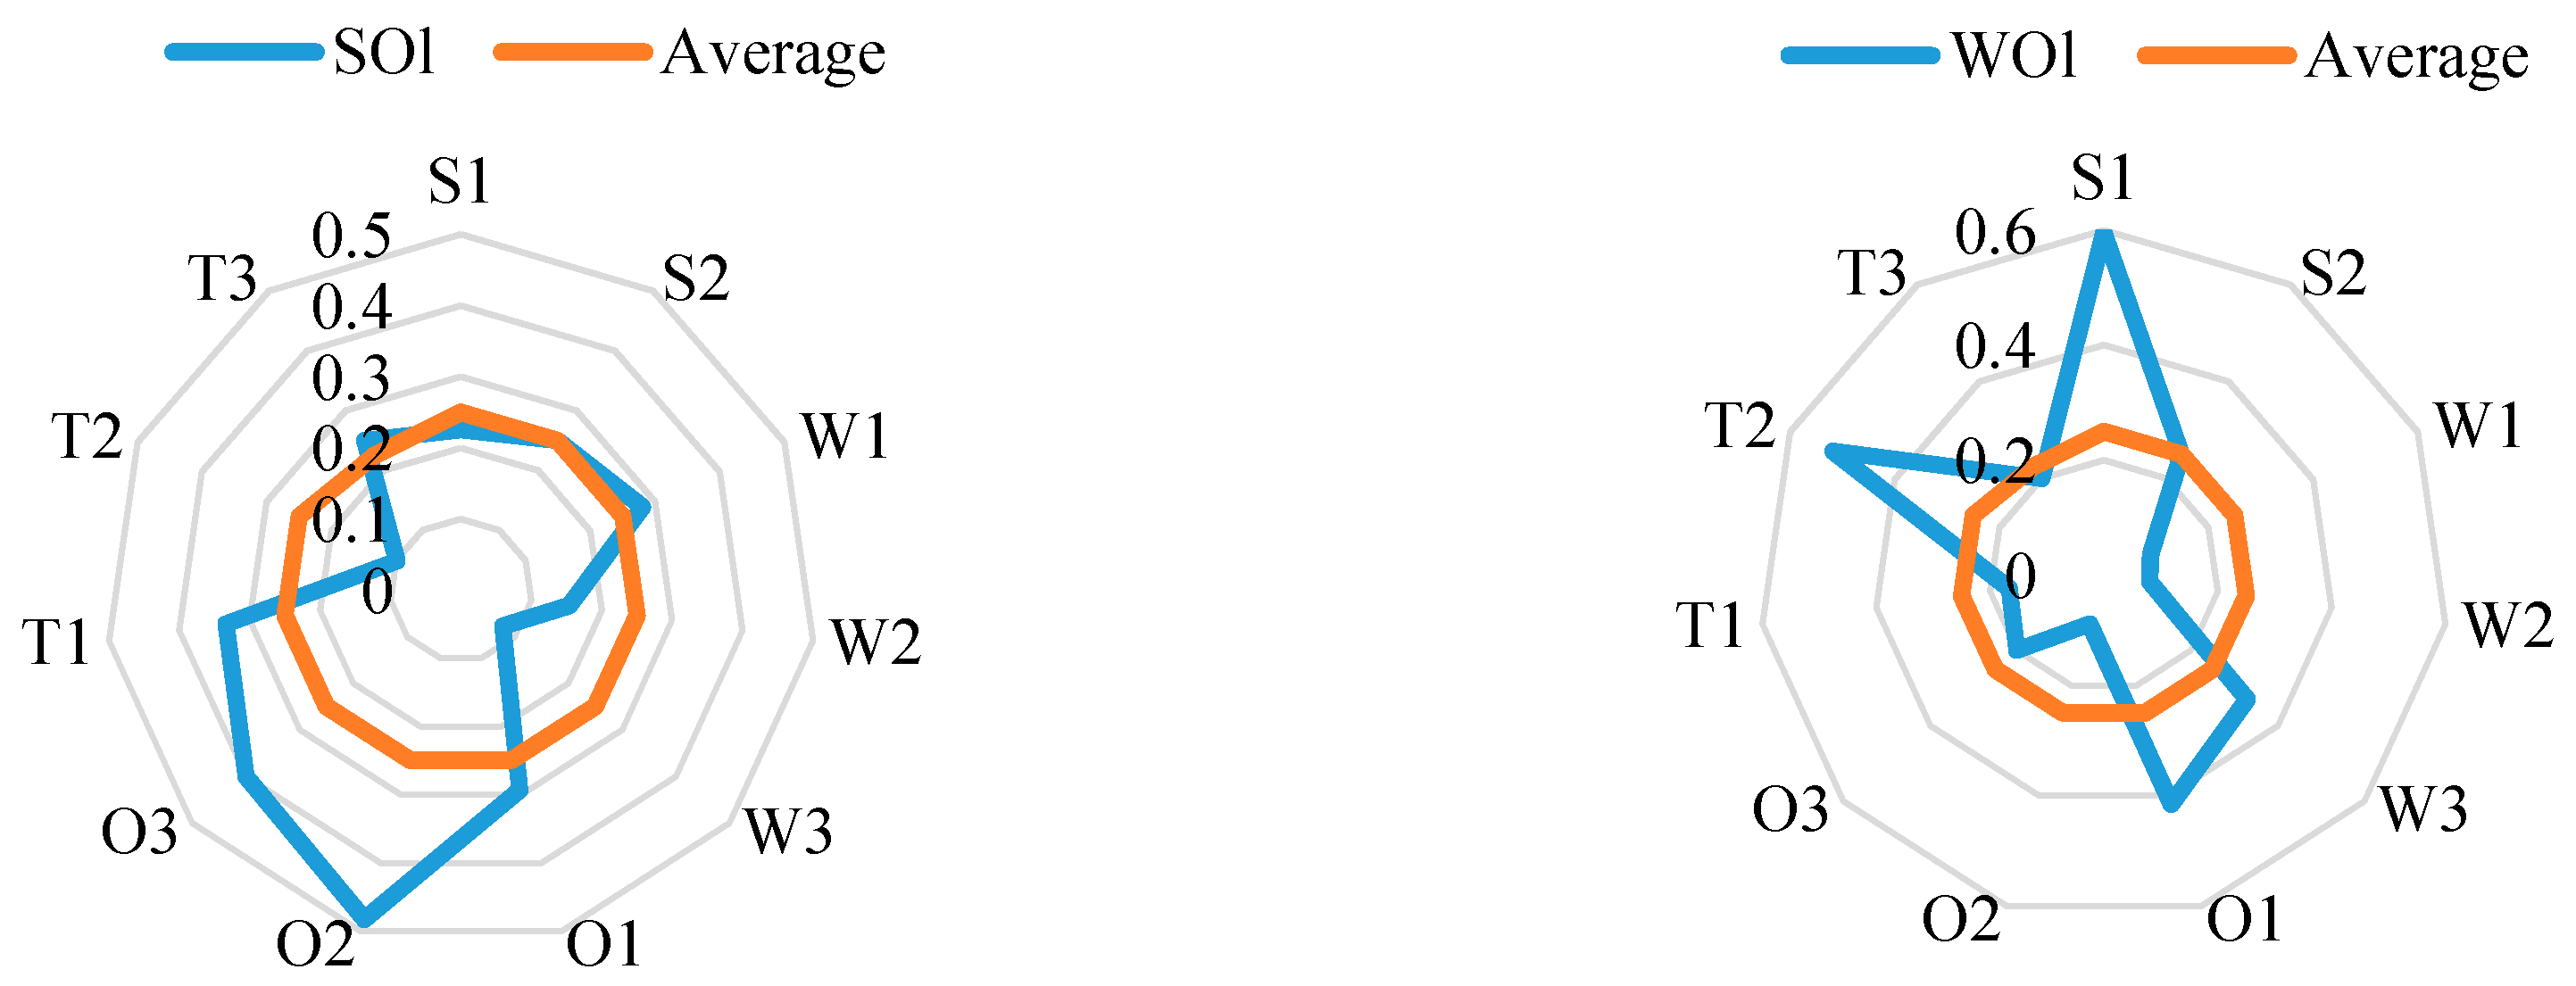

Figure 8.
The results of Short-term strategic alternatives.
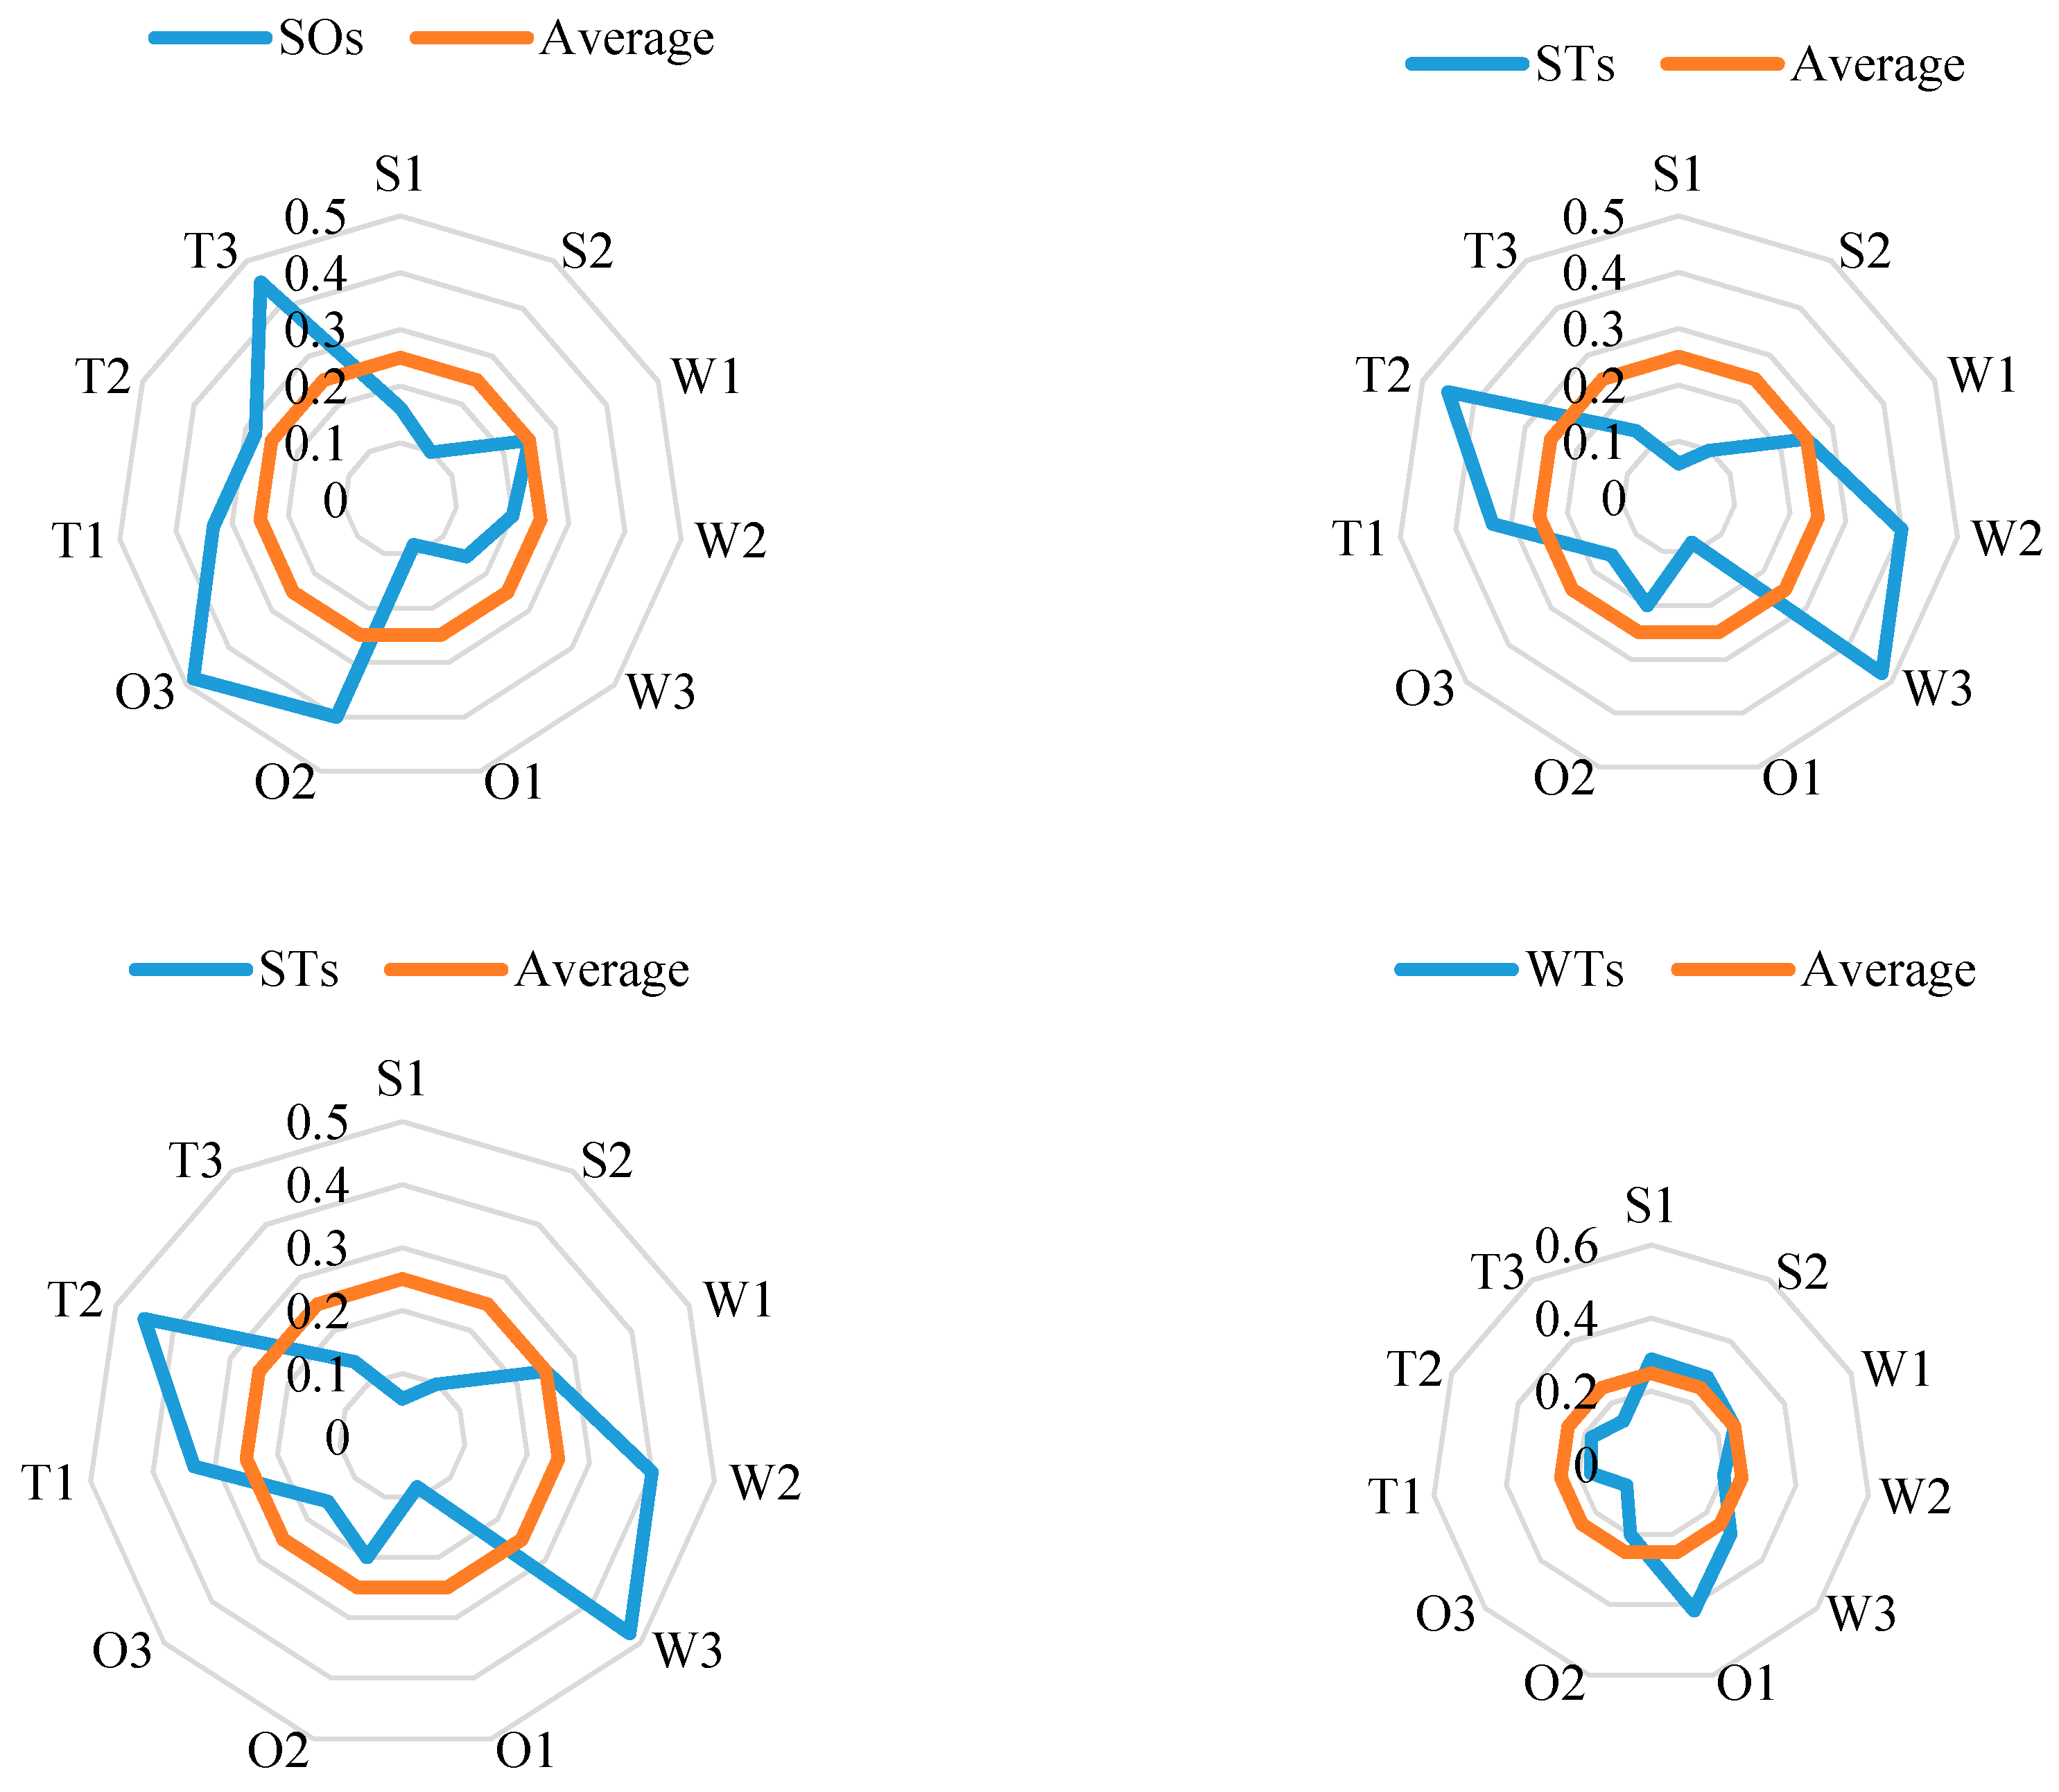
Figure 9.
Relationship between short-term strategy and long-term strategy.

Figure 10.
Results showing the impact of short-term strategy on long-term strategy.

Table 1.
The fundamental scale of AHP.
| Intensity of Importance | Definition |
|---|---|
| 1 | Equal importance |
| 3 | Moderate importance |
| 5 | Strong importance |
| 7 | Very strong importance |
| 9 | Absolute importance |
| 2, 4, 6, 8 | Used to express intermediate values |
| reciprocals | The scale between xi and xj is rij = 1/rji |
Table 2.
An example of the pairwise comparison of factors under the SWOT category “Opportunities”.
| Compare the Relative Importance of Each Opportunity | ||
|---|---|---|
| Demand opportunities () | 9 8 7 6 5 4 3 2 1 2 3 4 5 6 7 8 9 | National and government policy support () |
| Demand opportunities () | 9 8 7 6 5 4 3 2 1 2 3 4 5 6 7 8 9 | Market opportunities () |
| National and government policy support () | 9 8 7 6 5 4 3 2 1 2 3 4 5 6 7 8 9 | Market opportunities () |
Table 3.
Under the overall objective SWOT factor pairwise comparison matrix.
| SWOT | S | W | O | T | Weights |
|---|---|---|---|---|---|
| Strength (S) | 1 | 3 | 3 | 2 | 0.4705 |
| Weakness (W) | 1/3 | 1 | 2 | 1/2 | 0.1790 |
| Opportunity (O) | 1/3 | 1/2 | 1 | 1/2 | 0.1242 |
| Threat (T) | 1/2 | 2 | 1/2 | 1 | 0.2264 |
| CR = 0.03 | |||||
Table 4.
Each of the influencing factors is compared pairwise in the matrix using all criteria.
| Strength | S1 | S2 | Weights | |
| S1 | 1 | 1 | 0.500 | |
| S2 | 1 | 1 | 0.500 | |
| CR = 0.00 | ||||
| Weakness | W1 | W2 | W3 | Weights |
| W1 | 1 | 3 | 2 | 0.528 |
| W2 | 1/3 | 1 | 1/3 | 0.140 |
| W3 | 1/2 | 3 | 1 | 0.332 |
| CR = 0.052 | ||||
| Opportunity | O1 | O2 | O3 | Weights |
| O1 | 1 | 2 | 2 | 0.500 |
| O2 | 3 | 1 | 1 | 0.250 |
| O3 | 1/2 | 1/2 | 1 | 0.250 |
| CR = 0.00 | ||||
| Threat | T1 | T2 | T3 | Weights |
| T1 | 1 | 3 | 4 | 0.625 |
| T2 | 1/3 | 1 | 2 | 0.238 |
| T3 | 1/4 | 1/2 | 1 | 0.137 |
| CR = 0.017 | ||||
Table 5.
Influence factor weight.
| Criterion | Weights | Influencing Factors | Weights | The Weight under the Overall Goal |
|---|---|---|---|---|
| S | 0.171 | 0.500 | 0.0856 | |
| 0.500 | 0.0856 | |||
| W | 0.237 | 0.528 | 0.1250 | |
| 0.140 | 0.0332 | |||
| 0.332 | 0.0787 | |||
| O | 0.414 | 0.500 | 0.2070 | |
| 0.250 | 0.1035 | |||
| 0.250 | 0.1035 | |||
| T | 0.178 | 0.625 | 0.1112 | |
| 0.238 | 0.0424 | |||
| 0.137 | 0.0244 |
Table 6.
ANP analysis of the impact of various factors on the program weight matrix.
| 0.2257 | 0.2500 | 0.2806 | 0.1539 | 0.0776 | 0.2926 | 0.4828 | 0.4000 | 0.3334 | 0.0989 | 0.2500 | |
| 0.1128 | 0.2500 | 0.4503 | 0.4773 | 0.4177 | 0.107 | 0.2720 | 0.2000 | 0.3334 | 0.0989 | 0.2500 | |
| 0.5963 | 0.2500 | 0.0898 | 0.0808 | 0.3301 | 0.4155 | 0.0882 | 0.2000 | 0.1666 | 0.5183 | 0.2000 | |
| 0.0652 | 0.2500 | 0.1793 | 0.2880 | 0.1746 | 0.185 | 0.1570 | 0.2000 | 0.1666 | 0.2838 | 0.2000 |
Table 7.
Long-term development strategy program weight and ranking.
| Strategic Alternatives | Weights | Ranking |
|---|---|---|
| 0.2789 | 2 | |
| 0.2856 | 1 | |
| 0.2443 | 3 | |
| 0.1912 | 4 |
Table 8.
The weighting matrix of alternatives for each sub-factor.
| 0.1615 | 0.0989 | 0.2500 | 0.2000 | 0.1539 | 0.0833 | 0.4000 | 0.4829 | 0.3334 | 0.2806 | 0.4554 | |
| 0.0601 | 0.0989 | 0.2500 | 0.4000 | 0.4773 | 0.0833 | 0.2000 | 0.1570 | 0.3334 | 0.4503 | 0.1409 | |
| 0.4906 | 0.5183 | 0.2500 | 0.2000 | 0.0808 | 0.4167 | 0.2000 | 0.2720 | 0.1666 | 0.0898 | 0.2628 | |
| 0.2878 | 0.2838 | 0.2500 | 0.2000 | 0.2880 | 0.4167 | 0.2000 | 0.0882 | 0.1666 | 0.1793 | 0.1409 |
Table 9.
Short-term development strategy program weights and ranking.
| Strategic Alternatives | Weights | Ranking |
|---|---|---|
| 0.2789 | 2 | |
| 0.2856 | 1 | |
| 0.2443 | 3 | |
| 0.1912 | 4 |
Table 10.
Overall priority of long-term strategy based on the short-term strategy.
| 0.4829 | 0.2500 | 0.2806 | 0.1539 | 0.4554 | 0.5489 | 0.4828 | 0.4000 | 0.3334 | 0.0989 | 0.2000 | 0.2880 | 0.4759 | 0.4092 | 0.4177 | |
| 0.1570 | 0.2500 | 0.4503 | 0.4773 | 0.1409 | 0.2494 | 0.2720 | 0.2000 | 0.3334 | 0.0989 | 0.4000 | 0.0809 | 0.0937 | 0.1113 | 0.0776 | |
| 0.2720 | 0.2500 | 0.0898 | 0.0808 | 0.2628 | 0.0746 | 0.0882 | 0.2000 | 0.1666 | 0.5183 | 0.2000 | 0.1538 | 0.1217 | 0.145 | 0.1746 | |
| 0.0882 | 0.2500 | 0.1793 | 0.2880 | 1.1409 | 0.1271 | 0.1570 | 0.2000 | 0.1666 | 0.2838 | 0.2000 | 0.4773 | 0.3087 | 0.3345 | 0.3301 |
Table 11.
Final priority of long-term strategy based on the influence of short-term strategy.
| Strategic Alternatives | Weights | Ranking |
|---|---|---|
| 0.2800 | 1 | |
| 0.2618 | 2 | |
| 0.2265 | 4 | |
| 0.2316 | 3 |
Table 12.
Comparison of independence and dependence analysis.
| Long Strategy | Without Influence | With Influence | ||
|---|---|---|---|---|
| Priority | Ranking | Priority | Ranking | |
| 0.2789 | 2 | 0.2800 | 1 | |
| 0.2856 | 1 | 0.2618 | 2 | |
| 0.2443 | 3 | 0.2265 | 4 | |
| 0.1912 | 4 | 0.2316 | 3 | |
© 2017 by the authors. Licensee MDPI, Basel, Switzerland. This article is an open access article distributed under the terms and conditions of the Creative Commons Attribution (CC BY) license (http://creativecommons.org/licenses/by/4.0/).
Share and Cite
MDPI and ACS Style
Wang, X.; Li, C.; Shang, J.; Yang, C.; Zhang, B.; Ke, X. Strategic Choices of China’s New Energy Vehicle Industry: An Analysis Based on ANP and SWOT. Energies 2017, 10, 537. https://doi.org/10.3390/en10040537
AMA Style
Wang X, Li C, Shang J, Yang C, Zhang B, Ke X. Strategic Choices of China’s New Energy Vehicle Industry: An Analysis Based on ANP and SWOT. Energies. 2017; 10(4):537. https://doi.org/10.3390/en10040537
Chicago/Turabian StyleWang, Xiaojia, Chenggong Li, Jennifer Shang, Changhui Yang, Bingli Zhang, and Xinsheng Ke. 2017. "Strategic Choices of China’s New Energy Vehicle Industry: An Analysis Based on ANP and SWOT" Energies 10, no. 4: 537. https://doi.org/10.3390/en10040537
Note that from the first issue of 2016, this journal uses article numbers instead of page numbers. See further details here.